Abstract
Background: To aim of the study was describe the growth of publications on genetic myopia and understand the current research landscape through the analysis of citation networks, as well as determining the different research areas and the most cited publications. Methods: The Web of Science database was used to perform the publication search, looking for the terms “genetic*” AND “myopia” within the period between 2009 and October 2020. The CitNetExplorer and CiteSpace software were then used to conduct the publication analysis. To obtain the graphics, the VOSviewer software was used. Results: A total of 721 publications were found with 2999 citations generated within the network. The year 2019 was singled out as a “key year”, taking into account the number of publications that emerged in that year and given that in 2019, 200 loci associated with refractive errors and myopia were found, which is considered to be great progress. The most widely cited publication was “Genome-wide meta-analyses of multiancestry cohorts identify multiple new susceptibility loci for refractive error and myopia”, an article by Verhoeven et al., which was published in 2013. By using the clustering function, we were able to establish three groups that encompassed the different research areas within this field: heritability rate of myopia and its possible association with environmental factors, retinal syndromes associated with myopia and the genetic factors that control and influence axial growth of the eye. Conclusions: The citation network offers a comprehensive and objective analysis of the main papers that address genetic myopia.
Keywords: genetic, myopia, citation network
1. Introduction
Myopia is the leading cause of visual impairment worldwide and there are both genetic and environmental factors that contribute to its development [1]. Efforts to decipher the hereditary determinants of myopia began in the 1960s, and these were carried out in studies of monozygotic twins. These studies demonstrated that myopia is hereditary, with a rate of 91%, and that genes explain up to 80% of the variances that exist in terms of refractive error [2,3,4,5]. Until the advent of genome-wide association studies (GWAS), studies using linkage analysis in families or investigating variants in candidate genes were conducted to identify disease-associated genes. However, they were not successful in myopia, and until 2009, there were no genes known for common myopia that occur in the general population. GWAS allowed the identification of many refractive error genes associated with myopia. Thus, knowledge about the molecular machinery underlying myopia was increased as well as promising clues for the development of future therapies [6].
During the last decade, different consortia such as the International Consortium for Refractive Error and Myopia (CREAM), the 23andMe Research Team and the UK Biobank Eye and Vision Consortium have tried to identify the genetic variants that are associated with different refractive errors, mainly myopia. In 2013, 39 SNP (single nucleotide polymorphism) mutations were found to be associated with myopia [7,8]. In 2016, Tideman et al. [9], as members of the CREAM, analyzed the influence of these SNPs on axial length and corneal radius (AL/CR) as a function of age. In 2018, a meta-analysis involving 160,420 subjects increased the number of genetic polymorphisms that were associated with refractive errors from 39 to 161 [10]. In the most recent large-scale study that was published in Nature Genetics in 2020, Hysi et al. [11] conducted a meta-analysis of genome-wide association studies (GWAS). Their study involved a total of 542,934 European participants, and 336 new genetic loci associated with refractive error were identified. Citation network analysis is used when we want to look for a specific topic within the scientific literature. By analyzing one publication, we can discover other relevant publications, with the objective being to show, in a qualitative and quantitative manner, any connections that may exist between articles and authors through the creation of groups [12]. This method also allows for the quantification of the most commonly cited publications from each group, and, likewise, a specific research field can be developed or, where necessary, the literature search can concentrate on a particular topic [12,13].
In recent years, citation analysis, the exploration of reference patterns in both academic and scientific literature, has been applied in order to analyze the impact of research, knowledge flows and knowledge networks. It is also important in information science, mainly in the representation of knowledge and in the retrieval of information. Recently, there has been an increase in interest in citation analysis in order to solve questions related to research, management or information services (evaluation of research or visualization of knowledge).
This interest arises from the increase in the availability and accessibility of digital bibliographic data (both citations and full text) as well as in the relevant computer technologies. This provides a wealth of data and the tools necessary for researchers to reliably perform citation analyses on a large scale, even without having access to special data collections [12,13].
Therefore, taking into account the rising number of publications on genetic myopia, the objective of this study was to determine the different areas of research as well as the most commonly cited publication. Likewise, by using the CitNetExplorer software, a program used to assess the development of scientific research within a specific field, we looked to evaluate the existing relationships between the publications and the different research groups.
2. Materials and Methods
2.1. Database
We used the Web of Science (WoS) database to conduct our search, establishing the following search terms: “myopia” and “genetic.” We selected these terms as they are the two most frequently used terms in all of the fields of research, therefore meaning that they were in line with the objectives of this study.
Taking into consideration the fact that the search results had articles in common, we applied the Boolean operator AND and the wildcard operator “*” in order to look for both the singular and plural forms of the words. As a result, the search term that was employed was: “genetic*” AND “myopia.” Additionally, the search was also conducted by choosing the Subject as the search field, before going on to limit the results according to the abstract, keywords and title. This search covered the time frame from 2009 to October 2020.
With regard to the citation indexes, the Social Sciences Citation Index, the Science Citation Index Expanded and the Emerging Sources Citation Index were used. The publications were searched and downloaded on 20 October 2020.
The study was favorably evaluated by the ethics investigation committee of Universidad Europea de Madrid (CEI-UE) under the code CIPI/19/102. In addition, the study was developed in accordance with the standards recognized by the Declaration of Helsinki by the World Medical Association (64th General Meeting, Fortaleza, Brazil, October 2013). Informed consent was not necessary.
2.2. Data Analysis
The CitNetExplorer software was used for the publication analysis; this software enables the researcher to both analyze and visualize the citation networks of scientific publications. Citation networks can also be downloaded directly from the Web of Science, and likewise, it is possible to manage citation networks that are comprised of millions of publications and other related citations.
The citation score attribute was used to conduct a quantitative analysis of the most mentioned publications within a specific period (self-citations were excluded). By doing so, it was possible to quantify not only the internal connections within the Web of Science database but also any external connections as well, which meant, therefore, that other databases were also taken into consideration [13].
The CitNetExplorer offers a number of techniques that can be used when analyzing publications’ citation networks. The clustering functionality is achieved by using the formula that was established by Van Eck in 2012 [13].
| (1) |
The clustering function was used to assign a group to each publication. By using this function and taking into consideration the results from the citation networks, it was possible to group publications with a greater level of association [13].
Finally, the Identifying Core Publications functionality was used to evaluate the core publications. This function serves to identify any publications that are considered to be at the core of a citation network, while disposing of any that are considered insignificant. When establishing the number of connections, we took into account the fact that the higher the value is of this parameter, the lower the number of core publications is [13]. This study took into consideration any publications with four or more citations in the citation network. On the other hand, we also used the drilling down functionality to attain a more in-depth analysis of each of the groups at different levels.
The VOSviewer software, which allows for the visualization and creation of bibliometric networks, was used for creating the graphs.
Scientometric analysis was conducted using the CiteSpace software (5.6.R2). This is a Java language-based software which is formed by five basic theoretical aspects: Kuhn’s model of scientific revolutions, Price’s scientific frontier theory, the organization of ideas, the best information foraging theory of scientific communication and the theory of discrete and reorganized knowledge units [14,15]. In the scientometric analysis process, some parameter indicators exist for a specific evaluation. The H index is a mixed quantitative index which is used to evaluate the quantity and level of academic output of researchers and institutions. The H index indicates that h of the N articles published in the journal have been cited at least h times [16]. The degree indicates the number of connections that exist between authors (institutions, countries) in the co-occurrence knowledge graph. In the case in which the degree value is higher, this suggests a greater level of communication and cooperation between the authors (institutions, countries). Besides, intermediary centrality is an indicator that is used to determine the importance of nodes in the research cooperation network, and the half-life is a parameter that is used to represents the continuity of institutional research from a time perspective [14].
Therefore, with this analysis, we obtained the articles with the largest citation networks and the most importance in each research area.
3. Results
In 1970, the first articles on genetic myopia were published; therefore, the selected period of study was from 1970 to October 2020. Following the WoS search, 983 publications were found according to title, abstract and keywords, as well as 6100 citation networks.
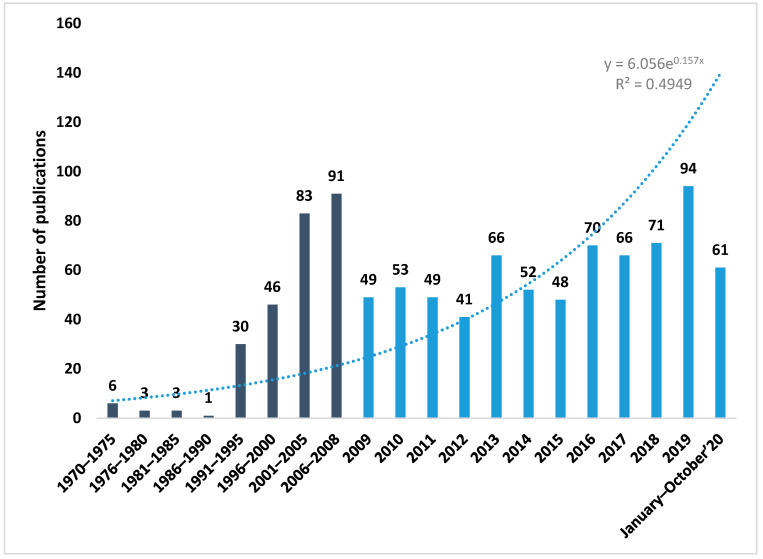
As we can see in Figure 1, the number of publications on genetic myopia has increased exponentially since 2009 (1970–2008: 26.75%; 2009–October 2020: 73.27%). Notably, 2019 was the year with the highest number of publications: 94 publications and 20 citation networks. In turn, 2019 was also determined to be the “key year”, not only because of the number of publications but also the fact that 200 loci associated with refractive errors and myopia were found, which is a great advance.
Figure 1.
Number of publications per year.
For this reason, and according to the study conducted by de Tedja et al. [6], the selected time frame for performing the bibliometric and citation network analysis was from 2009 to October 2020. Before 2009, genes for common myopia were not known to occur in the general population.
3.1. Description of Publications
Of all the publications, 80.17% were articles, 11.37% were reviews, 6.10% were congress and conference abstracts, 1.39% were book chapters and the remaining 1% were “proceeding papers, letters, corrections and data papers”. According to van Wesel [17], the reasons why the number of articles is significantly higher may be due to alterations in the publication policy, the interest of the authors or the topics that are being covered.
3.1.1. Language and Countries
With regard to the language of the publications, 98.21% were published in English, 1.37% in German, 0.27% in French and 0.14% in Korean. This is because English is one of the most widely used languages in the world; therefore, researchers who write in this language have a greater chance of having their work published [18].
Therefore, as shown in Supplementary Figure S1, the countries with the highest publication rate were the United States (31.18%), China (28.57%) and England (15.52%). Supplementary Figure S1 shows the most important publications and the group that they belong to. An item’s color represents the group to which it belongs and the lines between the elements represent the existing links.
Supplementary Table S1 shows the main characteristics of the six most important groups in Supplementary Figure S1.
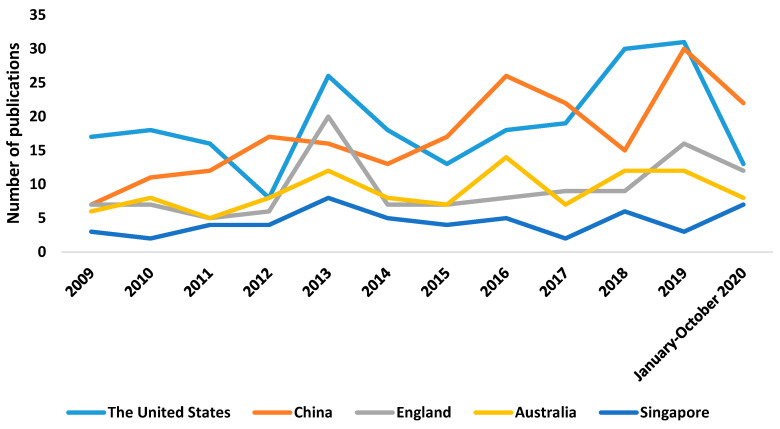
Figure 2 and Table 1 show the trajectory of publications in the five countries that boast the highest number of articles on genetic myopia, and the highest number can be appreciated in the United States. The upward tendency in the number of publications from countries such as the United Kingdom or the United States may be due to a range of different factors, including the fact that these are anglophonic countries or the possible affiliations that exist between different research groups in the scientific community [19,20]. It should be considered that in our study, England stands out, not counting other countries of United Kingdom.
Figure 2.
Number of publications per country and year.
Table 1.
The five countries with the highest number of publications.
| Country | Publications (%) | Centrality | Degree | Half-Life |
|---|---|---|---|---|
| The United States | 225 (31.18%) | 0.40 | 38 | 5.5 |
| China | 208 (28.57%) | 0.02 | 19 | 6.5 |
| England | 113 (15.52%) | 0.12 | 33 | 5.5 |
| Australia | 107 (14.70%) | 0.19 | 33 | 5.5 |
| Singapore | 53 (7.28%) | 0.05 | 25 | 5.5 |
3.1.2. Research Areas
Research on this topic is multidisciplinary. The fields of ophthalmology (60.30%) and hereditary genetics (19.23%) are particularly relevant (Table 2).
Table 2.
The 10 research fields with the highest number of publications.
| Category | Frequency | Centrality | Degree | Half-Life |
|---|---|---|---|---|
| Ophthalmology | 437 | 0.16 | 16 | 5.5 |
| Hereditary genetics | 138 | 0.05 | 15 | 7.5 |
| Biochemistry molecular biology | 78 | 0.10 | 19 | 4.5 |
| Science technology other topics | 53 | 0.08 | 3 | 7.5 |
| Experimental medicine research | 31 | 0.00 | 29 | 5.5 |
| General internal medicine | 25 | 0.00 | 3 | 6.5 |
| Neurosciences neurology | 18 | 0.07 | 15 | 5.5 |
| Pediatrics | 8 | 0.03 | 11 | 7.5 |
| Pharmacology and pharmacy | 7 | 0.02 | 4 | 7.5 |
| Psychology | 7 | 0.03 | 10 | 3.5 |
3.1.3. Authors and Institutions
As shown in Table 3 and Supplementary Figure S2, the authors with the highest number of publications on genetic myopia were Guggenheim JA (6.59%), Hammond CJ (5.91%) and Saw SM (5.36%).
Table 3.
The 10 authors with the largest number of publications.
| Author | Number of Publications |
H Index |
Total Citations |
Citation Average | Centrality | Degree |
|---|---|---|---|---|---|---|
| Guggenheim JA | 48 | 33 | 4173 | 24.99 | 0.08 | 53 |
| Hammond CJ | 43 | 16 | 991 | 23.05 | 0.02 | 29 |
| Saw SM | 39 | 18 | 2047 | 52.49 | 0.04 | 48 |
| Mackey DA | 38 | 15 | 792 | 20.84 | 0.03 | 33 |
| Young TL | 38 | 22 | 1343 | 35.34 | 0.16 | 54 |
| Hysi PG | 31 | 12 | 649 | 20.94 | 0.02 | 37 |
| Klaver CCW | 30 | 13 | 590 | 19.67 | 0.02 | 38 |
| Williams C | 30 | 14 | 623 | 20.77 | 0.02 | 41 |
| Wojciechowski R | 30 | 16 | 923 | 30.77 | 0.00 | 15 |
| Zhang QJ | 29 | 15 | 474 | 16.34 | 0.04 | 15 |
Supplementary Table S2 shows the main characteristics of the seven most important groups in Supplementary Figure S2.
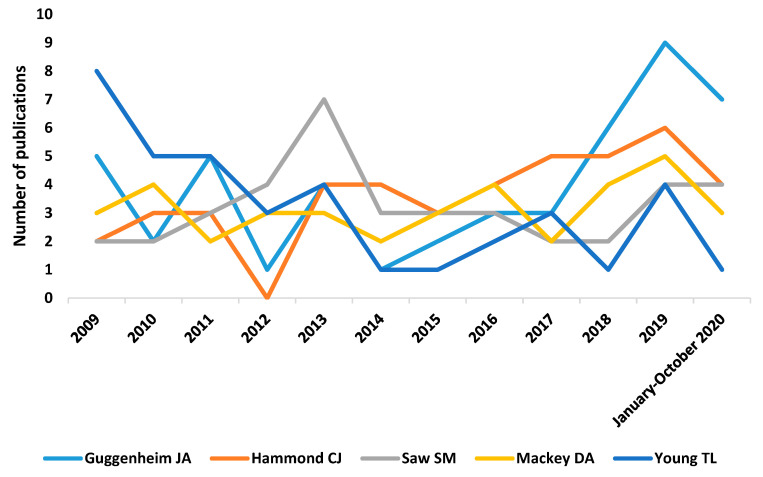
Figure 3 shows the trajectory of the five authors with the largest number of articles on genetic myopia, with Guggenheim JA’s trajectory considered to be the most relevant.
Figure 3.
Number of publications per authors and year.
The institutions with the highest number of publications, as indicated in Table 4 and Supplementary Figure S3, were Sun Yat-sen University (8.10%), University of Melbourne (7.69%) and Kings College London (7.01%).
Table 4.
The 10 institutions with the largest number of publications.
| Category | Frequency | Centrality | Degree | Half Life |
|---|---|---|---|---|
| Sun Yat-sen University | 59 | 0.03 | 20 | 6.5 |
| University of Melbourne | 56 | 0.04 | 40 | 4.5 |
| Kings College London | 51 | 0.05 | 52 | 5.5 |
| Cardiff University | 45 | 0.03 | 49 | 8.5 |
| National University of Singapore | 42 | 0.04 | 58 | 5.5 |
| University of Western Australia | 37 | 0.06 | 41 | 5.5 |
| Erasmus MC | 36 | 0.03 | 64 | 5.5 |
| National Human Genome Research Institute | 34 | 0.02 | 30 | 5.5 |
| University College de Londres | 34 | 0.08 | 42 | 5.5 |
| University of Pennsylvania | 33 | 0.01 | 31 | 3.5 |
Supplementary Table S3 shows the main characteristics of the six most important groups from Supplementary Figure S3.
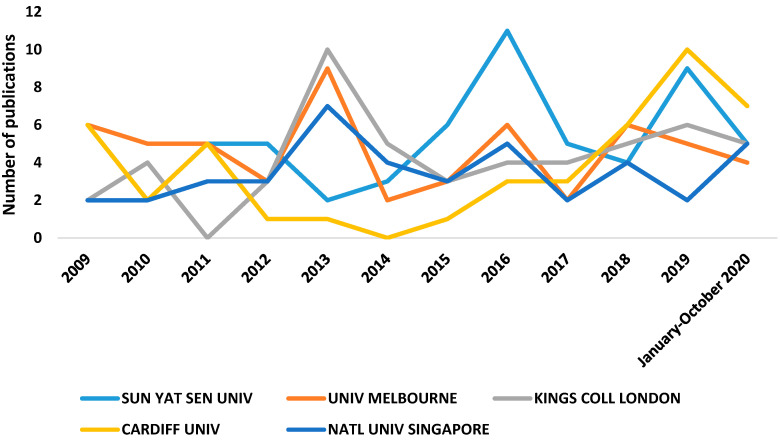
Figure 4 shows the trajectory of the five institutions with the largest number of articles on genetic myopia, with the most relevant being Sun Yat-sen University. It also shows that there has been a significant increase in publications at Cardiff University in recent years.
Figure 4.
Number of publications per institutions and year.
3.1.4. Journals
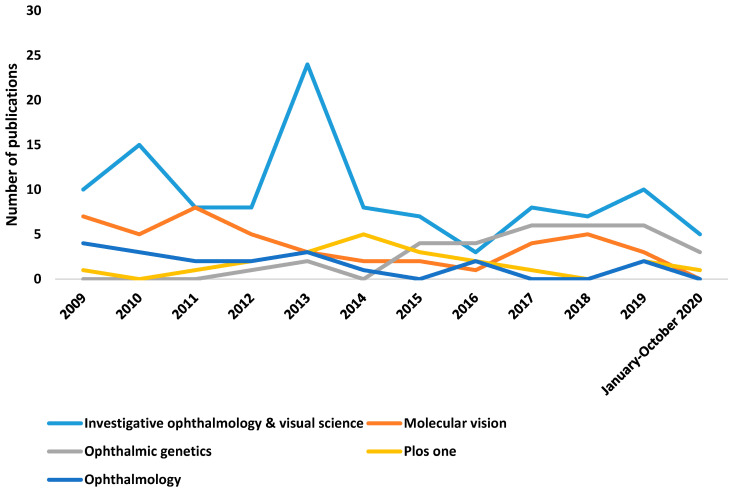
Table 5 and Supplementary Figure S4 show the main journals that have published content on genetic myopia, indicating the number of publications that have been found in the WoS database. Most of the journals with a high publication rate and a high impact factor were from the United States and the United Kingdom.
Table 5.
The 10 journals with the largest number of publications.
| Journal | Total Publications | Impact Factor (2019) |
Quartile | SJR (SCImago Journal Rank) (2019) | Citations /Docs (2 years) |
Total Citations (2019) |
Centrality |
H Index |
Country |
|---|---|---|---|---|---|---|---|---|---|
| Investigative Ophthalmology & Visual Science | 113 | 3.47 | Q1 | 1.79 | 3.458 | 8592 | 0..00 | 209 | United States |
| Molecular Vision | 45 | 2.20 | Q2 | 0.86 | 2.213 | 724 | 0.00 | 88 | United States |
| Ophthalmic Genetics | 32 | 1.31 | Q4 | 0.63 | 1.336 | 411 | 0.00 | 38 | United Kingdom |
| PLOS One | 21 | 2.74 | Q2 | 1.02 | 2.942 | 193,380 | 0.00 | 300 | United States |
| Ophthalmology | 19 | 8.47 | Q1 | 4.41 | 8.476 | 6778 | 0.00 | 229 | Netherlands |
| Scientific Reports | 19 | 3.99 | Q1 | 1.34 | 4.149 | 283,384 | 0.00 | 179 | United Kingdom |
| Experimental Eye Research | 17 | 3.01 | Q1 | 1.14 | 3.233 | 2169 | 0.00 | 119 | United States |
| Acta Ophthalmologica | 14 | 3.36 | Q1 | 1.42 | 3.304 | 2369 | 0.00 | 82 | United States |
| British Journal of Ophthalmology | 14 | 3.61 | Q1 | 1.89 | 4.026 | 3591 | 0.00 | 146 | United Kingdom |
| Optometry and Vision Science | 14 | 1.46 | Q3 | 0.89 | 1.789 | 1011 | 0.00 | 92 | United States |
Supplementary Table S4 shows the main characteristics of the six most important groups in Supplementary Figure S4.
Figure 5 shows the trajectory of the five journals with the highest number of articles on genetic myopia, with a greater relevance of the journal Investigative Ophthalmology & Visual Science.
Figure 5.
Number of publications per journals and year.
3.1.5. Keywords
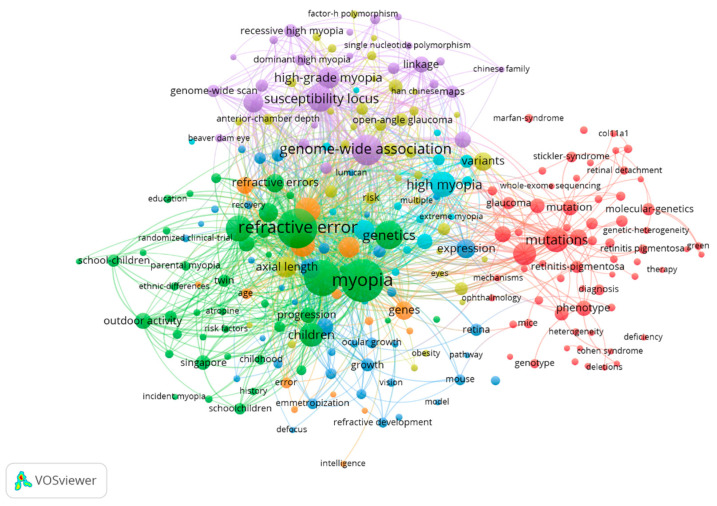
The most used keywords were “Myopia” (215 publications), “Refractive error” (186 publications) and “Prevalence” (152 publications). Table 6 and Figure 6 show the most commonly used keywords in the most relevant publications.
Table 6.
The 30 most used keywords.
| Keyword | Frequency | Centrality | Degree | Total Link Strength |
|---|---|---|---|---|
| Myopia | 215 | 0.03 | 40 | 1394 |
| Refractive error | 186 | 0.05 | 65 | 1397 |
| Prevalence | 152 | 0.05 | 57 | 1053 |
| Genome-wide association | 110 | 0.03 | 51 | 807 |
| Genetics | 94 | 0.07 | 56 | 609 |
| Susceptibility locus | 77 | 0.05 | 55 | 608 |
| Risk factors | 77 | 0.04 | 54 | 581 |
| High myopia | 73 | 0.06 | 56 | 485 |
| Population | 73 | 0.05 | 55 | 484 |
| Heritability | 70 | 0.02 | 36 | 488 |
| Mutations | 68 | 0.04 | 35 | 329 |
| Children | 67 | 0.03 | 40 | 432 |
| Gene | 60 | 0.06 | 47 | 302 |
| High-grade myopia | 54 | 0.07 | 64 | 446 |
| Eye | 50 | 0.05 | 45 | 311 |
| Axial length | 49 | 0.04 | 49 | 379 |
| Association | 48 | 0.09 | 60 | 321 |
| Form-deprivation myopia | 46 | 0.03 | 42 | 319 |
| Ocular refraction | 45 | 0.03 | 47 | 377 |
| Visual impairment | 44 | 0.06 | 55 | 358 |
| Expression | 43 | 0.09 | 50 | 255 |
| Variant | 39 | 0.05 | 38 | 38 |
| Environment | 33 | 0.07 | 59 | 246 |
| Eye growth | 33 | 0.04 | 48 | 227 |
| Identification | 33 | 0.04 | 35 | 162 |
| Outdoor activity | 32 | 0.02 | 41 | 250 |
| Locus | 32 | 0.02 | 31 | 207 |
| Linkage | 31 | 0.02 | 39 | 243 |
| Family | 30 | 0.08 | 49 | 145 |
| Epidemiology | 29 | 0.06 | 46 | 211 |
Figure 6.
Connection between keywords.
Table 7 shows the main characteristics of the five most important groups in Figure 6.
Table 7.
Characteristics of the most used keywords.
| Cluster | Color | Main Keywords | Topic | % |
|---|---|---|---|---|
| 1 | Red | mutations, gene, family, phenotype, identification | Genetic mutations | 27.53 |
| 2 | Green | prevalence, myopia, refractive error, genetics, risk factors | Prevalence of myopia in children and its risk factors | 17.96 |
| 3 | Blue | growth, eye growth, form-deprivation myopia, retina, expression | Axial length growth | 15.92 |
| 4 | Yellow | variants, macular degeneration, metanalysis, single nucleotide polymorphism, common variants, open-angle glaucoma | SNPs (Single Nucleotide Polymorphism) and genes related to myopia | 15.92 |
| 5 | Violet | genome-wide association, susceptibility locus, high-grade myopia, linkage, locus | Genome association | 10.61 |
3.2. The Most Cited Publications
Between 2009 and October 2020, 721 publications and 2999 citation networks were found. Table 8 shows the 20 most cited articles.
Table 8.
The 20 most mentioned articles.
| Author | Title | Journal | Year | Citation index |
|---|---|---|---|---|
| Verhoeven et al. [21] | Genome-wide meta-analyses of multiancestry cohorts identify multiple new susceptibility loci for refractive error and myopia | Nat Genet. 2013 Mar;45(3):314–8. | 2013 | 106 |
| Wojciechowski et al. [22] | Nature and nurture: the complex genetics of myopia and refractive error | Clin Genet. 2011 Apr;79(4):301–20 | 2011 | 85 |
| Kiefer et al. [8] | Genome-Wide Analysis Points to Roles for Extracellular Matrix Remodeling, the Visual Cycle, and Neuronal Development in Myopia | PLoS Genet. 2013;9(2):e1003299. | 2013 | 83 |
| Morgan et al. [23] | Myopia | Lancet. 2012 May 5;379(9827):1739–48 | 2012 | 80 |
| Nakanishi et al. [24] | A genome-wide association analysis identified a novel susceptible locus for pathological myopia at 11q24.1 | PLoS Genet. 2009 Sep;5(9):e1000660 | 2009 | 59 |
| Lopes et al. [25] | Estimating Heritability and Shared Environmental Effects for Refractive Error in Twin and Family Studies | Invest Ophthalmol Vis Sci. 2009 Jan;50(1):126–31 | 2009 | 55 |
| Shi et al. [26] | Exome Sequencing Identifies ZNF644 Mutations in High Myopia | PLoS Genet. 2011 Jun;7(6):e1002084. | 2011 | 54 |
| Li et al. [27] | Genome-Wide Association Studies Reveal Genetic Variants in CTNND2 for High Myopia in Singapore Chinese | Ophthalmology. 2011 Feb;118(2):368–75 | 2011 | 47 |
| Pan et al. [28] | Worldwide prevalence and risk factors for myopia | Ophthalmic Physiol Opt. 2012 Jan;32(1):3–16 | 2012 | 47 |
| Shi et al. [29] | Genetic Variants at 13q12.12 are associated with high myopia in the Han Chinese population | Am J Hum Genet. 2011 Jun 10;88(6):805–813 | 2011 | 40 |
| Hornbeak et al. [30] | Myopia genetics: a review of current research and emerging trends | Curr Opin Ophthalmol. 2009 Sep;20(5):356–62. | 2009 | 38 |
| Klein et al. [31] | Heritability Analysis of Spherical Equivalent, Axial Length, Corneal Curvature, and Anterior Chamber Depth in the Beaver Dam Eye Study | Arch Ophthalmol. 2009 May;127(5):649–55. | 2009 | 38 |
| Yang et al. [32] | Clinical and linkage study on a consanguineous Chinese family with autosomal recessive high myopia | Mol Vis. 2009;15:312–8 | 2009 | 36 |
| Fan et al. [33] | Genetic Variants on Chromosome 1q41 Influence Ocular Axial Length and High Myopia | PLoS Genet. 2012;8(6):e1002753. | 2012 | 35 |
| Li et al. [34] | An International Collaborative Family Based Whole-Genome Linkage Scan for High-Grade Myopia | Invest Ophthalmol Vis Sci. 2009 Jul;50(7):3116–27 | 2009 | 34 |
| Tedja et al. [10] | Genome-wide association meta-analysis highlights light-induced signaling as a driver for refractive error | Nat Genet. 2018 Jun;50(6):834–848. | 2018 | 34 |
| Aldahmesh et al. [35] | Mutations in LRPAP1 Are Associated with Severe Myopia in Humans | Am J Hum Genet. 2013 Aug 8;93(2):313–20 | 2013 | 33 |
| Young [36] | Molecular genetics of human myopia: an update | Optom Vis Sci. 2009 Jan;86(1):E8-E22 | 2009 | 31 |
| Jiang et al. [37] | Detection of Mutations in LRPAP1, CTSH, LEPREL1, ZNF644, SLC39A5, and SCO2 in 298 Families with Early Onset High Myopia by Exome Sequencing | Invest Ophthalmol Vis Sci. 2014 Dec 18;56(1):339–45 | 2014 | 31 |
| Verhoeven et al. [38] | Large scale international replication and meta-analysis study confirms association of the 15q14 locus with myopia. The CREAM consortium | Hum Genet. 2012 Sep;131(9):1467–80 | 2012 | 30 |
The most cited publication was the article by Verhoeven et al. [21], which was published in 2013 and which had a citation index of 106. A genome-wide meta-analysis was performed, which included 37,382 individuals from 27 studies of European ancestry and 8376 from five Asian cohorts. Sixteen new loci for refractive errors in individuals of European ancestry were found (eight were shared with Asian).
These new loci included candidate genes with functions in neurotransmission (GRIA4), ion transport (KCNQ5), retinoic acid metabolism (RDH5), extracellular matrix remodeling (LAMA2 and BMP2), and eye development (SIX6 and PRSS56). Previously reported associations with GJD2 and RASGRF1 were also found. Subjects with the highest genetic load shown a tenfold increased risk of myopia in a risk score analysis using associated SNPs. These results considerably advance the understanding of the mechanisms involved in refractive error and myopia.
When analyzing the 20 most cited articles, all of them analyzed the heritability rate of myopia. Likewise, these articles also considered the contribution of genes and the environment in the development of refractive errors.
3.3. Clustering
By using the clustering function, we were able to assign each publication in the citation network to a group, meaning, therefore, that the publications that are close to each other within the citation network tend to be in the same group. Therefore, each group consists of publications that are strongly linked to each other in terms of citation networks. In this way, it is possible to interpret that each group represents a particular topic within the scientific literature. In order to distinguish between the different groups, they were each assigned different colors, and the links between groups are shown by colored lines.
Through this analysis, five groups were identified, of which three contained a significant number of publications (Figure 7). However, the remaining groups accounted for just 3.75%.
Figure 7.
Citation network about genetic myopia.
Table 9 shows the information on the citation networks for the three main groups, listed by size from the biggest to the smallest.
Table 9.
Information about the citation networks of the three main groups.
| Main Cluster | Number of Publications | Number of Citation Links | Number of Citations Median (Range) | Number of Publications with ≥4 Citations | Number of Publications in the 100 Most Cited Publications |
|---|---|---|---|---|---|
| Group 1 | 379 | 2579 | 2 (0–107) | 308 | 93 |
| Group 2 | 54 | 95 | 1 (0–18) | 0 | 5 |
| Group 3 | 22 | 28 | 1 (0–10) | 0 | 1 |
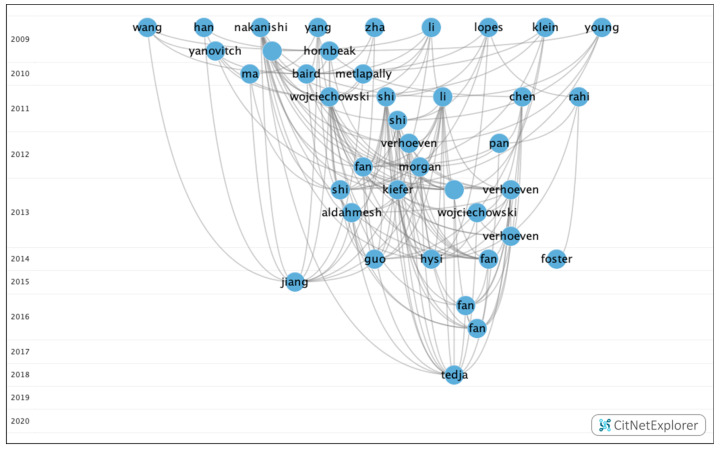
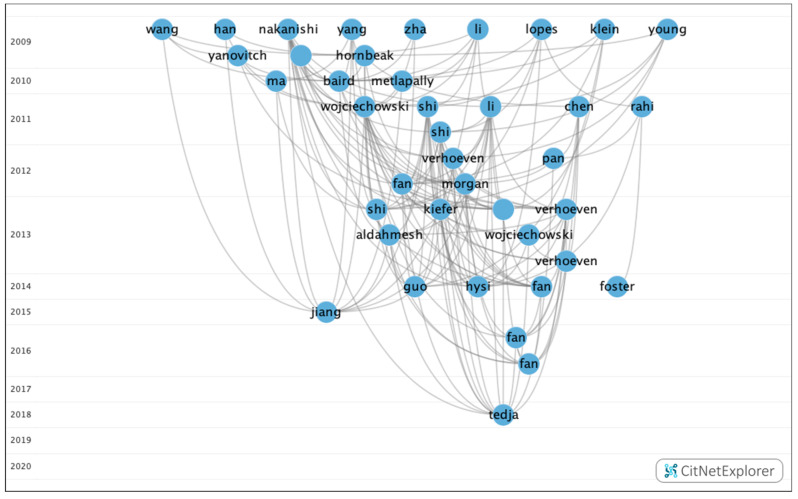
In group 1, there were 379 publications and 2579 citations within the network. The most commonly cited publication was the article by Verhoeven et al. [21], which was published in 2013 in Nature Genetics and which was also at the top of the list of the 20 most cited publications. The articles in this group evaluate the heritability of myopia and its possible association with the negative impact of environmental factors (Figure 8).
Figure 8.
Citation network in group 1.
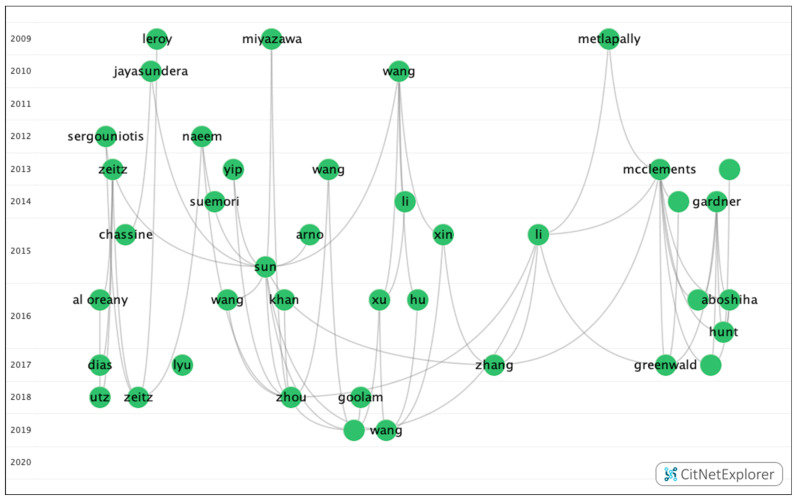
In group 2, 54 publications and 95 citations were found within the network. The most commonly cited publication was the article by Sun et al. [39], which was published in 2015 in Investigative Ophthalmology & Visual Science. The aim of this study was to investigate mutations in 234 genes associated with retinal dystrophies in a cohort of 298 subjects with early-onset high myopia using whole-exome sequencing. The results showed that systematic analysis of variants in the 234 genes identified potential pathogenic mutations in 34 genes of 71 participants. Of these, 44 had mutations in 11 genes responsible for high myopia eye disease, including COL2A1, COL11A1, PRPH2, FBN1, GNAT1, OPA1, PAX2, GUCY2D, TSPAN12, CACNA1F and RPGR. The initial clinical records of the 71 patients with mutations did not show any diseases other than high myopia. In conclusion, mutations in genes responsible for retinal diseases were confirmed in a quarter of subjects with early onset of high myopia.
The articles in this group analyzed the allelic and genotypic frequencies that can lead to retinal syndromes associated with myopia (Figure 9).
Figure 9.
Citation network in group 2.
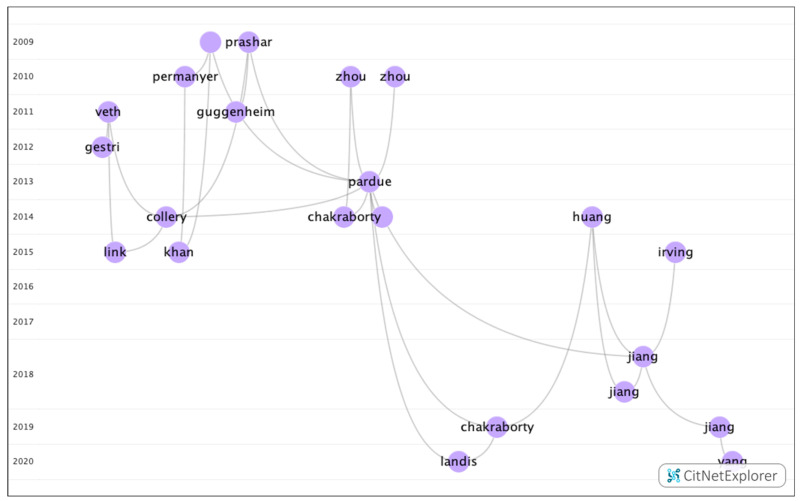
In group 3, 22 publications and 28 citations were found within the network. The most commonly cited publication was the article by Prashar et al. [40], which was published in 2009 in Experimental Eye Research. This study examines the relationship between eye size and body size in chickens from a genetic cross between a layer line (small body size and eye size) and a broiler line (large body and eye size). In total, 510 chickens were evaluated by keratometry and in vivo high-resolution A-scan ultrasonography at three weeks from birth. The diameter of the equatorial eye and the weight of the eye were measured after enucleation.
Changes in eye size parameters were explained by a multiple linear regression analysis of body weight (BW), body length (BL), head width (HW) and gender.
Thus, the analysis of BW, BL, HW and sex predicted 51–56% of the variation in eye weight, axial length, corneal radius and equatorial eye diameter and 22% of the variation in lens thickness. When adjusting for sex, the three parameters of body size predicted between 45% and 49% of the variation in eye weight, axial length, corneal radius and eye diameter; however, they explained only 0.4% of the variation in lens thickness.
In conclusion, the variation in the eye size of chickens in this broiler–layer advanced intercross line is unlikely to be determined by pleiotropic genes that also influence body size. Therefore, in general, to understand the genetic determination of eye size, mapping the quantitative trait loci (QTL) that determine body size may be helpful (Figure 10).
Figure 10.
Citation network in group 3.
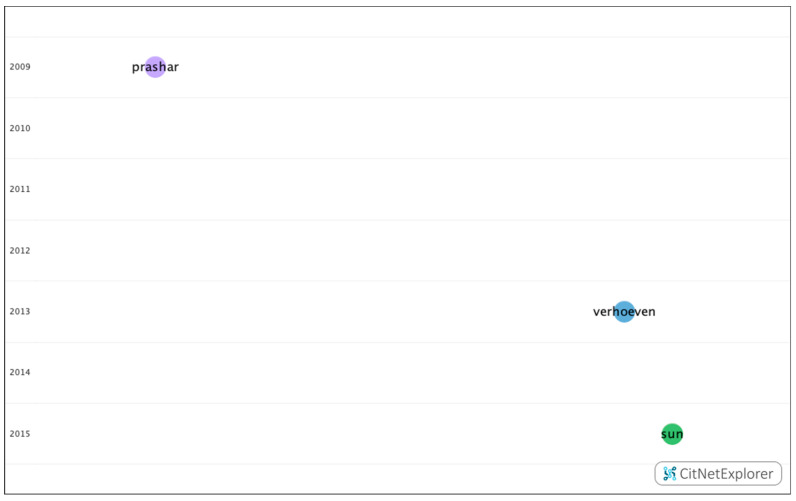
When analyzing the relationship between groups, it was determined that there was no connection between the groups. Therefore, each group analyzed clearly different topics (Figure 11).
Figure 11.
Relationship between the three main groups.
3.4. Core Publications
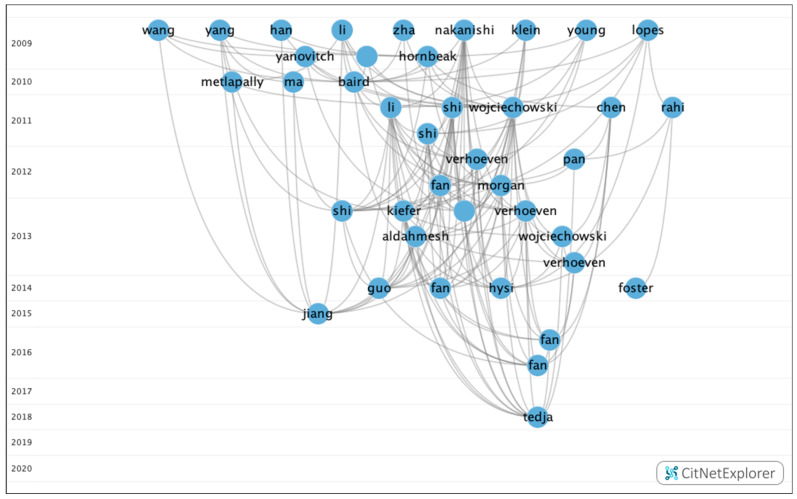
In total, 353 publications with four or more citations were found and the citation network was 2696, representing 48.96%. This means that there is a clear focus on the research that is being carried out in this field. In this analysis, the main topic is the heritability rate of myopia, as well as the contribution of genes and the environment in the development of refractive errors (Figure 12).
Figure 12.
Core publications in citations network about genetic myopia.
4. Discussion
This study aimed to analyze the literature available on genetic myopia and understand the current research outlook by grouping publications together according to similarities in the investigated research topics. In order to do so, the Web of Science database was used. This is one of the most comprehensive databases, as it covers data dating back to the year 1900. Nevertheless, it is worth considering that only international journals that have undergone a rigorous selection process are accepted in the Web of Science. This database allows for citation networks to be created; however, when conducting a systematic review of all of the literature that exists on a subject, its usefulness is somewhat limited given that it does not offer a general overview of the connections that exist between the citations of a group of publications. For this reason, CitNetExplorer and CiteSpace software were used, as these computer programs allow researchers to visualize, analyze and scrutinize the citation networks of scientific publications. These programs offer a much more detailed analysis when creating citation networks compared to other databases such as Web of Science or Scopus [13]. In addition, for the methodology, we based ours on other studies of citation networks carried out by our research team [41,42,43].
The first studies on genetic myopia were based on linkage analysis, and these studies were limited to the identification of genetic variants with a large effect on myopia [44]. It should be noted that three studies provided evidence of a myopia locus on chromosome 11. For the first time, a genome-wide linkage analysis of 221 dizygotic twins from the UK identified the MPY7 locus at 40 cm on chromosome 11p13 as a locus susceptible to myopia [45]. However, another study showed marginal evidence of this connection in an independent group of 485 dizygotic twin pairs from the United Kingdom [46].
Finally, a genome-wide exploration of 36 white families with a mean SE of −4.0D also provided strong evidence for the linkage of a myopia locus on chromosome 11 [47].
However, given the limited number of genes that have been identified, the advent of GWAS studies in the 2000s has significantly improved knowledge of the genetic architecture of diseases.
At the beginning, GWAS for myopia were performed as a dichotomic result (case–control). However, since myopia constitutes a dichotomization of quantitative trait spherical equivalent, considering the quantitative trait should be more informative for gene mapping. Thus, in 2010, the first GWAS for spherical equivalent were conducted in 4000 participants [48,49]. The first loci to reach the genome-wide significance threshold were markers near the RASGFR1 gene at 15q25.1 and near GJD2 at 15q14.
These early studies demonstrated the difficulty in mapping many genes using the spherical equivalent, which is what led to the creation of the Consortium for Refractive Error and Myopia (CREAM) in 2010, which brought together researchers and cohorts from the US, Europe, Asia and Australia. This is consistent with the results obtained in our study and it shows the growing interest in the importance of genetics in myopia on a global level. Thus, in the last decade, there has been an increase in publications from European and Asian countries with a rate of 50.72% and 17.83%, respectively. Therefore, although academic exchanges and cooperation do exist between authors, institutions and countries in the field of myopia, these collaborations tend to occur between different institutions within a particular country or between influential academics within an institution. In this field, although developed countries such as England, the US and Australia, etc., remain in the lead, more and more developing countries are beginning to present a relatively high number of articles and distinguished research institutions. Thus, Sun Yat-Sen University in China stands out in this area of research, with a publication rate of 8%. In turn, in 2015, the International Myopia Institute was created; this institute was formed by experts from all over the world who have come together with the aim of advancing research, patient management and education in myopia. The aim of this initiative is to prevent future vision problems and blindness associated with increased cases of myopia by organizing meetings between scientists, doctors, legislators, governments and educators in the field of myopia in order to stimulate collaboration and the exchange of knowledge [50]. At the same time, the study by Tedja et al. [6], which was published in the year 2019, which has been identified as a “key year”, is considered to be particularly relevant, and said study conducted an exhaustive search of the existing literature on common refractive error, high myopia and myopia-associated syndromes. The result showed nearly 200 genetic loci associated with refractive error and myopia. Furthermore, it was determined that the risk variants mostly carry low risk but are highly prevalent in the general population. In turn, they concluded that several genes for syndromic secondary myopia overlap with those for common myopia. The polygenic risk scores showed overrepresentation of high myopia in the higher deciles of risk. The annotated genes have a wide variety of functions and all retinal areas appear to be sites of expression. Another relevant study was the one conducted by Pozarickij et al. [51], in which they analyzed gene–environment or gene–gene interactions in myopia. To do this, they tested the hypothesis that the variants associated with refractive error exhibit heterogeneity in effect size, a distinctive characteristic of genetic interactions. Of the 146 variants tested, evidence of non-linear and non-uniform effects was found in 66 at Bonferroni-corrected significance (p < 1.1×10⁻⁴) and 128 at nominal significance (p < 0.05). The LAMA2 rs12193446 variant had an effect size varying in different individuals from −0.20 diopters (95% CI: −0.18 to −0.23) to −0.89 diopters (95% CI: 0.71 to −1.07). At the extremes of the phenotype, SNP effects were strongest and weakest in emmetropes. One explanation for this finding was that gene–environment or gene–gene interactions in myopia are omnipresent. In turn, with the rise of large biobanks such as the UK Biobank [5,52], further GWAS meta-analyses between large consortia and companies will allow for the identification of many more genes. This will allow the molecular mechanism of myopia genesis to be fully obtained.
For this reason, given the increase in the prevalence of myopia on a global level and the fact that this varies geographically, a greater exchange of scientific research between countries will make it possible for knowledge to be built on the genes associated with myopia based on the different environmental factors [53].
In terms of the journal with a high number of publications on genetic myopia, Investigative Ophthalmology & Visual Science is worth mentioning, as this journal occupies the tenth position in the ophthalmology category with an impact factor of 3.47. Articles were published in 26 journals in the ophthalmology and optometry topic category, which was to be expected given that genetic myopia is a specialty within the field of optometry and ophthalmology. The journal with the highest impact factor was Ophthalmology, 3.57. However, it is important to consider that although the impact factor is a critical index of a journal’s importance, it is not an absolute measure index, nonetheless. The main difference between the two indexes is that the latter is based not only on the impact of the research results but also on the authors’ physical and intellectual contributions [54].
Research on the genetics of myopia, genetic epidemiology and epigenetics is thriving, and this research is providing a wealth of new insights into the molecules that are involved in refractive myopia genesis [5]. To date, 904 genetic loci have been found associated with refractive error. In turn, it has been found that refractive error is genetically heterogeneous and that it is driven by genes that participate in the development of all the anatomical components of the eye. Genetic factors that control circadian rhythm and pigmentation have also been found to be involved in the development of myopia and refractive error [11].
GWAS studies have been very effective in evaluating the role of common variants in myopia; however, said methods cannot effectively characterize very rare genomic variants. Whole-exome sequencing (WES) allows for the investigation of rare variants in exon regions; however, due to the cost, applications to date have primarily been in studies of familial or early-onset high myopia studies [55,56,57,58]. The study by Kloss et al. [59], in which WES was performed on 14 high myopia families, identifying 104 genetic variants in both known MYP loci as well as in new loci is worth mentioning. In familial studies, most variants showed an autosomal dominant mode of inheritance [26,37,59,60], although heterozygous X-linked mutations were found in ARR3 [61].
However, despite progress, the chain of events that form the myopia signaling cascade and the triggering for scleral remodeling are still largely unknown. The next steps should include all of the technological advances necessary to analyze complex disorders, such as the expansion of omics (genomics, transcriptomics, proteomics and metabolomics) and the use of multi-source study populations, environmental genomics and systems biology in order to organically integrate the findings and improve our understanding of the development of myopia in a quantitative way through big data analysis, in combination with the expansion of omics and other approaches (deep learning or artificial intelligence) [6].
Therefore, in the coming years, it is anticipated that there will be a significant increase in the number of genes related to myopia, and this will allow for the prediction of refractive error and the development of personalized strategies for the prevention of myopia in the future.
5. Conclusions
In conclusion, this study offers a comprehensive and objective analysis of the main existing studies on genetic myopia. In addition, by using the Web of Science database and the CitNetExplorer software, it was possible to view, analyze and explore the most cited articles and the existing citation networks to date.
Currently, 336 new loci associated with myopia have been discovered. The increase in biobanks will allow for more meta-analyses of GWAS among large consortia and companies, and therefore, many more genes will be identified. In this way, the molecular mechanism of myopia genesis will be fully understood.
Therefore, genetic myopia studies will provide new insights into the evolution of myopia and promising concepts for future therapies. However, the genetic architecture and its molecular mechanisms have yet to be clarified. The knowledge of genetic risk prediction models is improving; however, it must be expanded to have an impact on clinical practice. That is, the knowledge of the genetic influence will allow to establish the bases on the inheritance and the appearance of myopia as well as improve the effectiveness of the treatment methods that currently exist.
Supplementary Materials
The following are available online at https://www.mdpi.com/2073-4425/12/3/447/s1, Figure S1: Collaboration between countries; Figure S2: Collaboration between authors; Figure S3: Collaboration between institutions; Figure S4: Collaboration between journals; Table S1: Characteristics of the main countries; Table S2: Characteristics of the main authors; Table S3: Characteristics of the main institutions; Table S4: Characteristics of the main journals.
Author Contributions
Conceptualization, C.A.-P., M.Á.S.-T., C.M.-P. and C.V.-C.; methodology, C.A.-P., M.Á.S.-T., C.M.-P. and C.V.-C.; software, C.A.-P., M.Á.S.-T., C.M.-P. and C.V.-C.; validation, C.A.-P., M.Á.S.-T., C.M.-P. and C.V.-C.; formal analysis, C.A.-P., M.Á.S.-T., C.M.-P. and C.V.-C.; investigation, C.A.-P., M.Á.S.-T., C.M.-P. and C.V.-C.; resources, C.A.-P., M.Á.S.-T., C.M.-P. and C.V.-C.; data curation, C.A.-P., M.Á.S.-T., C.M.-P. and C.V.-C.; writing—original draft preparation, C.A.-P., M.Á.S.-T., C.M.-P. and C.V.-C.; writing—review and editing, C.A.-P., M.Á.S.-T., C.M.-P. and C.V.-C.; visualization, C.A.-P., M.Á.S.-T., C.M.-P. and C.V.-C.; supervision, C.A.-P., M.Á.S.-T., C.M.-P. and C.V.-C.; project administration, C.A.-P., M.Á.S.-T., C.M.-P. and C.V.-C.; funding acquisition, C.A.-P., M.Á.S.-T., C.M.-P. and C.V.-C. All authors have read and agreed to the published version of the manuscript.
Funding
This research received no external funding.
Institutional Review Board Statement
Not applicable.
Informed Consent Statement
Not applicable.
Data Availability Statement
Not applicable.
Conflicts of Interest
The authors declare no conflict of interest.
Footnotes
Publisher’s Note: MDPI stays neutral with regard to jurisdictional claims in published maps and institutional affiliations.
References
- 1.Wan L., Deng B., Wu Z., Chen X. Exome sequencing study of 20 patients with high myopia. PeerJ. 2018;6:e5552. doi: 10.7717/peerj.5552. [DOI] [PMC free article] [PubMed] [Google Scholar]
- 2.Zhang Q. Genetics of Refraction and Myopia. Prog. Mol. Biol. Transl. Sci. 2015;134:269–279. doi: 10.1016/bs.pmbts.2015.05.007. [DOI] [PubMed] [Google Scholar]
- 3.Sanfilippo P.G., Hewitt A.W., Hammond C.J., Mackey D.A. The heritability of ocular traits. Surv. Ophthalmol. 2010;55:561–583. doi: 10.1016/j.survophthal.2010.07.003. [DOI] [PubMed] [Google Scholar]
- 4.Liew S.H., Elsner H., Spector T.D., Hammond C.J. The first ‘‘classical’’ twin study? Analysis of refractive error using monozygotic and dizygotic twins published in 1922. Twin Res. Hum. Genet. 2005;8:198–200. doi: 10.1375/1832427054253158. [DOI] [PubMed] [Google Scholar]
- 5.Ang M., Wong T.Y. Updates on Myopia. 1st ed. Springer; Berlin/Heidelberg, Germany: 2020. [Google Scholar]
- 6.Tedja M.S., Haarman A.E.G., Meester-Smoor M.A., Kaprio J., Mackey D.A., Guggenheim J.A., Hammond C.J., Verhoeven V., Klaver C. CREAM Consortium. IMI—Myopia Genetics Report. Investig. Ophthalmol. Vis. Sci. 2019;60:M89–M105. doi: 10.1167/iovs.18-25965. [DOI] [PMC free article] [PubMed] [Google Scholar]
- 7.Yoshikawa M., Yamashiro K., Miyake M., Oishi M., Akagi-Kurashige Y., Kumagai K., Nakata I., Nakanishi H., Oishi A., Gotoh N., et al. Comprehensive replication of the relationship between myopia-related genes and refractive errors in a large Japanese cohort. Investig. Ophthalmol. Vis. Sci. 2014;55:7343–7354. doi: 10.1167/iovs.14-15105. [DOI] [PubMed] [Google Scholar]
- 8.Kiefer A.K., Tung J.Y., Do C.B., Hinds D.A., Mountain J.L., Francke U., Eriksson N. Genome-wide analysis points to roles for extracellular matrix remodeling, the visual cycle, and neuronal development in myopia. PLoS Genet. 2013;9:e1003299. doi: 10.1371/journal.pgen.1003299. [DOI] [PMC free article] [PubMed] [Google Scholar]
- 9.Tideman J.W.L., Fan Q., Polling J.R., Guo X., Yazar S., Khawaja A., Höhn R., Lu Y., Jaddoe V.W., Yamashiro K., et al. When do myopia genes have their effect? Comparison of genetic risks between children and adults. Genet. Epidemiol. 2016;40:756–766. doi: 10.1002/gepi.21999. [DOI] [PubMed] [Google Scholar]
- 10.Tedja M.S., Wojciechowski R., Hysi P.G., Eriksson N., Furlotte N.A., Verhoeven V., Iglesias A.I., Meester-Smoor M.A., Tompson S.W., Fan Q., et al. Genome-wide association meta-analysis highlights light-induced signaling as a driver for refractive error. Nat. Genet. 2018;50:834–848. doi: 10.1038/s41588-018-0127-7. [DOI] [PMC free article] [PubMed] [Google Scholar]
- 11.Hysi P.G., Choquet H., Khawaja A.P., Wojciechowski R., Tedja M.S., Yin J., Simcoe M.J., Patasova K., Mahroo O.A., Thai K.K., et al. Meta-analysis of 542, 934 subjects of European ancestry identifies new genes and mechanisms predisposing to refractive error and myopia. Nat. Genet. 2020;52:401–407. doi: 10.1038/s41588-020-0599-0. [DOI] [PMC free article] [PubMed] [Google Scholar]
- 12.González C.M. Análisis de citación y de redes sociales para el estudio del uso de revistas en centros de investigación: An approach to the development of collections. Ciência Inf. 2009;38:46–55. doi: 10.1590/S0100-19652009000200004. [DOI] [Google Scholar]
- 13.Van Eck N.J., Waltman L. CitNetExplorer: A new software tool for analyzing and visualizing citation networks. J. Informetr. 2014;8:802–823. doi: 10.1016/j.joi.2014.07.006. [DOI] [Google Scholar]
- 14.Chen C. CiteSpace II: Detecting and Visualizing Emerging Trends and Transient Patterns in Scientific Literature. J. Am. Soc. Inf. Sci. Technol. 2006;3:359–377. doi: 10.1002/asi.20317. [DOI] [Google Scholar]
- 15.De Solla Price D.J. Little Science, Big Science. 1st ed. Columbia University Press; New York, NY, USA: 1963. [Google Scholar]
- 16.Hirsch J.E. An index to quantify an individual’s scientific research output. Proc. Natl. Acad. Sci. USA. 2005;102:16569–16572. doi: 10.1073/pnas.0507655102. [DOI] [PMC free article] [PubMed] [Google Scholar]
- 17.Van Wesel M. Evaluation by Citation: Trends in Publication Behavior, Evaluation Criteria, and the Strive for High Impact Publications. Sci. Eng. Ethics. 2016;22:199–225. doi: 10.1007/s11948-015-9638-0. [DOI] [PMC free article] [PubMed] [Google Scholar]
- 18.Curry M.J., Lillis T. Multilingual Scholars and the Imperative to Publish in English: Negotiating Interests, Demands, and Rewards. Tesol. Q. 2004;38:663. doi: 10.2307/3588284. [DOI] [Google Scholar]
- 19.Lee M., Wu Y., Tsai C. Research Trends in Science Education from 2003 to 2007: A content analysis of publications in selected journals. Int. J. Sci. Educ. 2009;31:1999–2020. doi: 10.1080/09500690802314876. [DOI] [Google Scholar]
- 20.Aparicio-Martinez P., Perea-Moreno A.J., Martinez-Jimenez M.P., Redel-Macías M.D., Vaquero-Abellan M., Pagliari C. A Bibliometric Analysis of the Health Field Regarding Social Networks and Young People. Int. J. Environ. Res. Public Health. 2019;16:4024. doi: 10.3390/ijerph16204024. [DOI] [PMC free article] [PubMed] [Google Scholar]
- 21.Verhoeven V.J.M., Hysi P.G., Wojciechowski R., Fan Q., Guggenheim J.A., Höhn R., MacGregor S., Hewitt A.W., Nag A., Cheng C.Y., et al. Genome-wide meta-analyses of multiancestry cohorts identify multiple new susceptibility loci for refractive error and myopia. Nat. Genet. 2013;45:314–318. doi: 10.1038/ng.2554. [DOI] [PMC free article] [PubMed] [Google Scholar]
- 22.Wojciechowski R. Nature and nurture: The complex genetics of myopia and refractive error. Clin. Genet. 2011;79:301–320. doi: 10.1111/j.1399-0004.2010.01592.x. [DOI] [PMC free article] [PubMed] [Google Scholar]
- 23.Morgan I.G. Myopia. Lancet. 2012;379:1739–1748. doi: 10.1016/S0140-6736(12)60272-4. [DOI] [PubMed] [Google Scholar]
- 24.Nakanishi H., Yamada R., Gotoh N., Hayashi H., Yamashiro K., Shimada N., Ohno-Matsui K., Mochizuki M., Saito M., Iida T., et al. A genome-wide association analysis identified a novel susceptible locus for pathological myopia at 11q24.1. PLoS Genet. 2009;5:e1000660. doi: 10.1371/journal.pgen.1000660. [DOI] [PMC free article] [PubMed] [Google Scholar]
- 25.Lopes M.C., Andrew T., Carbonaro F., Spector T.D., Hammond C.J. Estimating Heritability and Shared Environmental Effects for Refractive Error in Twin and Family Studies. Investig. Ophthalmol. Vis. Sci. 2009;50:126–131. doi: 10.1167/iovs.08-2385. [DOI] [PubMed] [Google Scholar]
- 26.Shi Y., Li Y., Zhang D., Zhang H., Li Y., Lu F., Liu X., He F., Gong B., Cai L., et al. Exome Sequencing Identifies ZNF644 Mutations in High Myopia. PLoS Genet. 2011;7:e1002084. doi: 10.1371/journal.pgen.1002084. [DOI] [PMC free article] [PubMed] [Google Scholar]
- 27.Li Y.J., Goh L., Khor C.C., Fan Q., Yu M., Han S., Sim X., Ong R.T., Wong T.Y., Vithana E.N., et al. Genome-Wide Association Studies Reveal Genetic Variants in CTNND2 for High Myopia in Singapore Chinese. Ophthalmology. 2011;118:368–375. doi: 10.1016/j.ophtha.2010.06.016. [DOI] [PMC free article] [PubMed] [Google Scholar]
- 28.Pan C.W., Ramamurthy D., Saw S.M. Worldwide prevalence and risk factors for myopia. Ophthalmic. Physiol. Opt. 2012;32:3–16. doi: 10.1111/j.1475-1313.2011.00884.x. [DOI] [PubMed] [Google Scholar]
- 29.Shi Y., Qu J., Zhang D., Zhao P., Zhang Q., Tam P., Sun L., Zuo X., Zhou X., Xiao X., et al. Genetic Variants at 13q12.12 Are Associated with High Myopia in the Han Chinese Population. Am. J. Hum. Genet. 2011;88:805–813. doi: 10.1016/j.ajhg.2011.04.022. [DOI] [PMC free article] [PubMed] [Google Scholar]
- 30.Hornbeak D.M., Young T.L. Myopia genetics: A review of current research and emerging trends. Curr. Opin. Ophthalmol. 2009;20:356–362. doi: 10.1097/ICU.0b013e32832f8040. [DOI] [PMC free article] [PubMed] [Google Scholar]
- 31.Klein A.P., Suktitipat B., Duggal P. Heritability Analysis of Spherical Equivalent, Axial Length, Corneal Curvature, and Anterior Chamber Depth in the Beaver Dam Eye Study. Arch. Ophthalmol. 2009;127:649–655. doi: 10.1001/archophthalmol.2009.61. [DOI] [PMC free article] [PubMed] [Google Scholar]
- 32.Yang Z., Xiao X., Li S., Zhang Q. Clinical and linkage study on a consanguineous Chinese family with autosomal recessive high myopia. Mol. Vis. 2009;15:312–318. [PMC free article] [PubMed] [Google Scholar]
- 33.Fan Q., Barathi V.A., Cheng C.Y., Zhou X., Meguro A., Nakata I., Khor C.C., Goh L.K., Li Y.J., Lim W., et al. Genetic Variants on Chromosome 1q41 Influence Ocular Axial Length and High Myopia. PLoS Genet. 2012;8:e1002753. doi: 10.1371/journal.pgen.1002753. [DOI] [PMC free article] [PubMed] [Google Scholar]
- 34.Li Y.J., Guggenheim J.A., Bulusu A., Metlapally R., Abbott D., Malecaze F., Calvas P., Rosenberg T., Paget S., Creer R.C., et al. An International Collaborative Family-Based Whole-Genome Linkage Scan for High-Grade Myopia. Investig. Ophthalmol. Vis. Sci. 2009;50:3116–3127. doi: 10.1167/iovs.08-2781. [DOI] [PMC free article] [PubMed] [Google Scholar]
- 35.Aldahmesh M.A., Khan A.O., Alkuraya H., Adly N., Anazi S., Al-Saleh A.A., Mohamed J.Y., Hijazi H., Prabakaran S., Tacke M., et al. Mutations in LRPAP1 Are Associated with Severe Myopia in Humans. Am. J. Hum. Genet. 2013;93:313–320. doi: 10.1016/j.ajhg.2013.06.002. [DOI] [PMC free article] [PubMed] [Google Scholar]
- 36.Young T.L. Molecular genetics of human myopia: An update. Optom. Vis. Sci. 2009;86:E8–E22. doi: 10.1097/OPX.0b013e3181940655. [DOI] [PMC free article] [PubMed] [Google Scholar]
- 37.Jiang D., Li J., Xiao X., Li S., Jia X., Sun W., Guo X., Zhang Q. Detection of Mutations in LRPAP1, CTSH, LEPREL1, ZNF644, SLC39A5, and SCO2 in 298 Families with Early-Onset High Myopia by Exome Sequencing. Investig. Ophthalmol. Vis. Sci. 2014;56:339–345. doi: 10.1167/iovs.14-14850. [DOI] [PubMed] [Google Scholar]
- 38.Verhoeven V.J.M., Hysi P.G., Saw S.M., Vitart V., Mirshahi A., Guggenheim J.A., Cotch M.F., Yamashiro K., Baird P.N., Mackey D.A., et al. Large scale international replication and meta-analysis study confirms association of the 15q14 locus with myopia. The CREAM consortium. Hum. Genet. 2012;131:1467–1480. doi: 10.1007/s00439-012-1176-0. [DOI] [PMC free article] [PubMed] [Google Scholar]
- 39.Sun W., Huang L., Xu Y., Xiao X., Li S., Jia X., Gao B., Wang P., Guo X., Zhang Q. Exome Sequencing on 298 Probands with Early-Onset High Myopia: Approximately One-Fourth Show Potential Pathogenic Mutations in RetNet Genes. Investig. Ophthalmol. Vis. Sci. 2015;56:8365–8372. doi: 10.1167/iovs.15-17555. [DOI] [PubMed] [Google Scholar]
- 40.Prashar A., Hocking P.M., Erichsen J.T., Fan Q., Saw S.M., Guggenheim J.A. Common determinants of body size and eye size in chickens from an advanced intercross line. Exp. Eye Res. 2009;89:42–48. doi: 10.1016/j.exer.2009.02.008. [DOI] [PubMed] [Google Scholar]
- 41.Martinez-Perez C., Alvarez-Peregrina C., Villa-Collar C., Sánchez-Tena M.Á. Current State and Future Trends: A Citation Network Analysis of the Academic Performance Field. Int. J. Environ. Res. Public Health. 2020;17:5352. doi: 10.3390/ijerph17155352. [DOI] [PMC free article] [PubMed] [Google Scholar]
- 42.Nascimento H., Martinez-Perez C., Alvarez-Peregrina C., Sánchez-Tena M.Á. Citations Network Analysis of Vision and Sport. Int. J. Environ. Res. Public Health. 2020;17:7574. doi: 10.3390/ijerph17207574. [DOI] [PMC free article] [PubMed] [Google Scholar]
- 43.Martinez-Perez C., Alvarez-Peregrina C., Villa-Collar C., Sánchez-Tena M.Á. Citation Network Analysis of the Novel Coronavirus Disease 2019 (COVID-19) Int. J. Environ. Res. Public Health. 2020;17:7690. doi: 10.3390/ijerph17207690. [DOI] [PMC free article] [PubMed] [Google Scholar]
- 44.Risch N., Merikangas K. The future of genetic studies of complex human diseases. Science. 1996;273:1516–1517. doi: 10.1126/science.273.5281.1516. [DOI] [PubMed] [Google Scholar]
- 45.Hammond C.J., Andrew T., Mak Y.T., Spector T.D. A susceptibility locus for myopia in the normal population is linked to the PAX6 gene region on chromosome 11: A genomewide scan of dizygotic twins. Am. J. Hum. Genet. 2004;75:294–304. doi: 10.1086/423148. [DOI] [PMC free article] [PubMed] [Google Scholar]
- 46.Andrew T., Maniatis N., Carbonaro F., Liew S.H., Lau W., Spector T.D., Hammond C.J. Identification and replication of three novel myopia common susceptibility gene loci on chromosome 3q26 using linkage and linkage disequilibrium mapping. PLoS Genet. 2008;4:e1000220. doi: 10.1371/journal.pgen.1000220. [DOI] [PMC free article] [PubMed] [Google Scholar]
- 47.Ciner E., Ibay G., Wojciechowski R., Dana D., Holmes T.N., Bailey-Wilson J.E., Stambolian D. Genome wide scan of African-American and white families for linkage to myopia. Am. J. Ophthalmol. 2009;147:512–517. doi: 10.1016/j.ajo.2008.09.004. [DOI] [PMC free article] [PubMed] [Google Scholar]
- 48.Solouki A.M., Verhoeven V.J.M., van Duijn C.M., Verkerk A.J., Ikram M.K., Hysi P.G., Despriet D.D., van Koolwijk L.M., Ho L., Ramdas W.D., et al. A genome-wide association study identifies a susceptibility locus for refractive errors and myopia at 15q14. Nat. Genet. 2010;42:897–901. doi: 10.1038/ng.663. [DOI] [PMC free article] [PubMed] [Google Scholar]
- 49.Hysi P.G., Young T.L., Mackey D.A., Andrew T., Fernández-Medarde A., Solouki A.M., Hewitt A.W., Macgregor S., Vingerling J.R., Li Y.J., et al. A genome-wide association study for myopia and refractive error identifies a susceptibility locus at 15q25. Nat. Genet. 2010;42:902–905. doi: 10.1038/ng.664. [DOI] [PMC free article] [PubMed] [Google Scholar]
- 50.Myopia Institute About the International Myopia Institute. [(accessed on 25 October 2020)]; Available online: https://myopiainstitute.org.
- 51.Pozarickij A., Williams C., Hysi P.G., Guggenheim J.A. UK Biobank Eye and Vision Consortium. Quantile regression analysis reveals widespread evidence for gene-environment or gene-gene interactions in myopia development. Commun. Biol. 2019;2:167. doi: 10.1038/s42003-019-0387-5. [DOI] [PMC free article] [PubMed] [Google Scholar]
- 52.Sudlow C., Gallacher J., Allen N., Beral V., Burton P., Danesh J., Downey P., Elliott P., Green J., Landray M., et al. UK biobank: An open access resource for identifying the causes of a wide range of complex diseases of middle and old age. PLoS Med. 2015;12:e1001779. doi: 10.1371/journal.pmed.1001779. [DOI] [PMC free article] [PubMed] [Google Scholar]
- 53.Stambolian D., Wojciechowski R., Oexle K., Pirastu M., Li X., Raffel L.J., Cotch M.F., Chew E.Y., Klein B., Klein R., et al. Meta-analysis of genome-wide association studies in five cohorts reveals common variants in RBFOX1, a regulator of tissue-specific splicing, associated with refractive error. Hum. Mol. Genet. 2013;22:2754–2764. doi: 10.1093/hmg/ddt116. [DOI] [PMC free article] [PubMed] [Google Scholar]
- 54.Biswal A.K. An Absolute Index (Ab-index) to Measure a Researcher’s Useful Contributions and Productivity. PLoS ONE. 2013;8:e84334. doi: 10.1371/journal.pone.0084334. [DOI] [PMC free article] [PubMed] [Google Scholar]
- 55.Napolitano F., Lorio V.D., Testa F., Tirozzi A., Reccia M.G., Lombardi L., Farina O., Simonelli F., Gianfrancesco F., Di Iorio G., et al. Autosomal-dominant myopia associated to a novel P4HA2 missense variant and defective collagen hydroxylation. Clin. Genet. 2018;93:982–991. doi: 10.1111/cge.13217. [DOI] [PubMed] [Google Scholar]
- 56.Zhao F., Wu J., Xue A., Su Y., Wang X., Lu X., Zhou Z., Qu J., Zhou X. Exome sequencing reveals CCDC111 mutation associated with high myopia. Hum. Genet. 2013;132:913–921. doi: 10.1007/s00439-013-1303-6. [DOI] [PubMed] [Google Scholar]
- 57.Wang B., Liu Y., Chen S., Wu Y., Lin S., Duan Y., Zheng K., Zhang L., Gu X., Hong W., et al. A novel potentially causative variant of NDUFAF7 revealed by mutation screening in a Chinese family with pathologic myopia. Investig. Ophthalmol. Vis. Sci. 2017;58:4182–4192. doi: 10.1167/iovs.16-20941. [DOI] [PubMed] [Google Scholar]
- 58.Feng L., Zhou D., Zhang Z., He L., Liu Y., Yang Y. Exome sequencing identifies a novel UNC5D mutation in a severe myopic anisometropia family: A case report. Medicine. 2017;96:e7138. doi: 10.1097/MD.0000000000007138. [DOI] [PMC free article] [PubMed] [Google Scholar]
- 59.Kloss B.A., Tompson S.W., Whisenhunt K.N., Quow K.L., Huang S.J., Pavelec D.M., Rosenberg T., Young T.L. Exome sequence analysis of 14 families with high myopia. Investig. Ophthalmol. Vis. Sci. 2017;58:1982–1990. doi: 10.1167/iovs.16-20883. [DOI] [PMC free article] [PubMed] [Google Scholar]
- 60.Tran-Viet K.-N., Powell C., Barathi V.A., Klemm T., Maurer-Stroh S., Limviphuvadh V., Soler V., Ho C., Yanovitch T., Schneider G., et al. Mutations in SCO2 are associated with autosomal-dominant high-grade myopia. Am. J. Hum. Genet. 2013;92:820–826. doi: 10.1016/j.ajhg.2013.04.005. [DOI] [PMC free article] [PubMed] [Google Scholar]
- 61.Xiao X., Li S., Jia X., Guo X., Zhang Q. X-linked heterozygous mutations in cause female limited early onset high myopia. Mol. Vis. 2016;22:1257–1266. [PMC free article] [PubMed] [Google Scholar]
Associated Data
This section collects any data citations, data availability statements, or supplementary materials included in this article.
Supplementary Materials
Data Availability Statement
Not applicable.


