

Abstract
Introduction
Interstitial hypertension, a rise in interstitial fluid pressure, is a common feature of many solid tumors as they progress to an invasive state. It is currently unclear whether this elevated pressure alters the probability that tumor cells eventually escape into a neighboring blood or lymphatic vessel.
Methods
In this study, we analyze the escape of MDA-MB-231 human breast tumor cells from a ~3-mm-long preformed aggregate into a 120-μm-diameter empty cavity in a micromolded type I collagen gel. The “micro-tumors” were located within ~300 μm of one or two cavities. Pressures of ~0.65 cm H2O were applied only to the tumor (“interstitial hypertension”) or to its adjacent cavity.
Results
This work shows that interstitial hypertension suppresses escape into the adjacent cavity, but not because tumor cells respond directly to the pressure profile. Instead, hypertension alters the chemical microenvironment at the tumor margin to one that hampers escape. Administration of tumor interstitial fluid phenocopies the effects of hypertension.
Conclusions
This work uncovers a link between tumor pressure, interstitial flow, and tumor cell escape in MDA-MB-231 cells, and suggests that interstitial hypertension serves to hinder further progression to metastatic escape.
Electronic Supplementary Material
The online version of this article (10.1007/s12195-020-00661-w) contains supplementary material, which is available to authorized users.
Keywords: Triple-negative breast cancer, Intravasation, Lymphovascular invasion, Microphysiological system, Tumor engineering
Introduction
Like many other solid cancers, breast cancer progresses in a stereotypical sequence, from premalignant growth (in situ carcinoma) to invasion of the interstitium (invasive carcinoma), escape into a local vessel (intravasation or lymphovascular invasion), and finally metastatic colonization and growth at a secondary site.1,14,41 Gene expression profiling of human breast tumor epithelial cells has revealed differences in gene expression that correlate with tumor stage.13,18,35 Cell culture and/or animal models of breast cancer have confirmed the causal role of a subset of these genes in invasion, vascular escape, or metastasis. For instance, transient expression of the matrix metalloproteinase (MMP) stromelysin-1 in the epithelial compartment of mouse mammary tissue is sufficient to trigger invasion.37 Similar studies have shown that although invasion and intravasation both require some form of tumor cell movement, they are distinct steps in metastatic progression and may not necessarily rely on identical mechanisms. Loss of E-cadherin expression in mouse mammary tumors in vivo results in increased local invasion but decreased numbers of circulating tumor cells.25 Metastasis of mouse mammary tumors to the lung appears to be possible without local invasion at the primary site.38
Surprisingly, many genetic changes that are found at later stages of breast cancer are already present at earlier stages.18,40 This observation implies that microenvironmental factors may play at least as important of a role as genetic ones in determining whether and when a tumor progresses. These microenvironmental signals are often provided by surrounding cells: myoepithelial cells serve as a barrier to invasion of tumor epithelial cells, whereas tumor-associated fibroblasts promote invasion.10 Once breast tumor cells have successfully breached the basement membrane surrounding in situ carcinoma, stromal cells can shepherd the invasive cells through the extracellular matrix (ECM), such as during macrophage-assisted migration toward and into vessels.9,44 Other microenvironmental signals can promote invasion through a variety of mechanisms, including enhanced mechanotransduction that results from increased production or crosslinking of peritumoral ECM, hypoxia-induced increase of MMP activity, and presentation of an anisotropic peritumoral ECM.6,16,20,31,32
One change that accompanies the progression of a solid breast tumor from in situ to invasive carcinoma is a rise in the interstitial fluid pressure (IFP) within the tumor from its normally near-atmospheric value. The rise in tumor IFP results from vascular leakiness and the loss of functional lymphatic drainage within the tumor.11 It is now well-appreciated that this tumor interstitial hypertension results in a centrifugal interstitial flow that can hinder the delivery of chemotherapeutic agents to the tumor.23 The stress imposed by interstitial flow can also alter tumor cell migration toward or away from an escape site, such as a lymphatic vessel. In particular, flow can polarize the concentration profile of autocrine chemokines, which can lead to autologous chemotaxis of a tumor cell downstream.36 Alternatively, tumor cells can migrate upstream when the cell density exceeds a threshold.29
How the changes in IFP that accompany breast tumor progression affect the likelihood of tumor cell escape remains unclear, in large part because intravasation is rare and difficult to observe in vivo. Cell culture models of intravasation have traditionally relied on basal-to-apical transmigration of tumor cells across endothelial cell monolayers.28 Recently, more sophisticated culture models that allow individual tumor cells to escape into the lumens of self-organized vascular networks or engineered endothelial tubes have been developed.5,21,24,43
Previously, we described an in vitro model in which human breast cancer cells invade collectively from an initial three-dimensional (3D) microscale aggregate (a “micro-tumor”) into surrounding collagenous ECM.26,39 This culture model is distinguished by (1) the use of aggregates instead of individual, dispersed tumor cells, (2) the ability to control the IFP distribution at different locations in the engineered tumor, and (3) the ability to control the microscale geometry of the tumor. Using this 3D model, we showed that different IFP profiles result in different invasive phenotypes that are accompanied by changes in the expression of genes associated with epithelial-mesenchymal transition.27,39 Because the ECM in these models did not provide an open space for escape, we could not explore whether the pressure profiles also have an effect on the likelihood of tumor cell escape.
In the current study, we modify this 3D model to enable study of tumor cell escape, and examine how IFP affects escape from engineered tumors of MDA-MB-231 human breast cancer cells in vitro. To isolate the effects on escape in the absence of confounding signals from endothelial cells, tumor cells were allowed to escape into an empty cavity (true intravasation across an endothelium will be the focus of a subsequent study). Our data indicate that tumor hypertension, whether applied acutely or chronically and in a variety of microenvironments, acts to suppress escape in this 3D model. Thus, the development of interstitial hypertension may act as a natural inhibitor of metastatic progression in human breast cancer.
Materials and methods
Cell Culture
MDA-MB-231 human breast cancer cells (lot #59704452; Physical Sciences-Oncology Network Bioresource Core Facility, ATCC) were routinely cultured at 37 °C and 5% CO2 in HEPES-containing DMEM/F12 medium (Hyclone) that was supplemented with 10% heat-inactivated fetal bovine serum (FBS, lot #F17089; Atlanta Biologicals) and 50 μg/mL gentamicin (Life Technologies). Cells were passaged every 3–4 days at a 1:4 ratio, and were discarded after passage 14.
Formation of Micro-tumors Adjacent to a Single Cavity
Micro-tumors (n = 290) were formed by adapting a previously described needle-based approach to mold microscale cavities in collagen gels (Fig. 1a).3,26,39 In the modified approach, we placed a polydimethylsiloxane (PDMS)-based mold onto a glass coverslip to define a 1 mm × 1 mm × 6 mm chamber open on each end to 6-mm-diameter cylindrical wells. The chamber was coated with poly-D-lysine (Sigma) to promote adhesion of collagen gel.4 We then adsorbed bovine serum albumin (Calbiochem) onto two 120-μm-diameter needles (Seirin) and threaded the needles into both open ends of the chamber, one needle per end. The needles were carefully aligned so that they were roughly collinear with each other, parallel with the long axis of the chamber, and located with a tip-to-tip distance between needles of up to 300 μm. Stock solutions of native, acid-solubilized bovine dermal type I collagen (4.9 mg/mL, pH 3.0, lot #210090; Koken) were adjusted to a pH of 9–9.5 and a final collagen concentration of 3.9 or 2.5 mg/mL with 10× Hanks’ balanced salt solution and sodium hydroxide. All working collagen solutions were supplemented with 4% cell culture medium (i.e., for a final FBS concentration of 0.4%). Collagen solution was added to fill each chamber, gelled at 37 °C for 25 min, and maintained in a hydrated state by adding medium to the wells at both sides of the chamber. Removal of the two needles yielded a gel that contained two 120-μm-diameter cylindrical cavities, each ~3 mm in length. These gels were further conditioned with medium for at least 1 h before use.
Figure 1.

Schematic diagrams of the formation of (a) a micro-tumor adjacent to an empty cavity and (b) a micro-tumor adjacent to two empty cavities.
For each gel, we seeded MDA-MB-231 human breast cancer cells into one cavity only, by introducing a suspension of cells (3–4 million cells per mL) at the open end of the cavity and allowing convection to draw the cells into the cavity. Within ~10 min, the cells formed a packed aggregate (“micro-tumor”) in the cavity, and we then exhaustively washed the adjacent well to remove any excess, non-adherent cells. The day of cell seeding was considered to be day 0. Tumors were maintained until day 2 by removing and replacing the medium from both ends of the gel every 10–14 h, with ~60 μL and ~40 μL added to the seeded and unseeded sides, respectively.
Formation of Micro-tumors Adjacent to Two Cavities
Micro-tumors (n = 31) were formed as described above, except the configuration of the gel was shaped as a “T” (Fig. 1b). This configuration allowed the placement of three needles in the PDMS/glass chamber, with the central needle approximately equidistant from the two needles at the left and right. The left and right needles were placed ~300 μm apart at their tips, while the central needle was placed within 300 μm of the other two needles. The tips of the needles thus roughly formed an obtuse isosceles triangle. Collagen solution with a final concentration of 3.9 mg/mL was prepared, introduced around the aligned needles, and gelled as above. Removal of the needles yielded three cavities, and only the central one was seeded with MDA-MB-231 cells. This procedure thus created tumors that were flanked at their left and right sides by equidistant blind-ended cavities. Tumors were maintained until day 2 by removing and replacing the medium from all ends of the gel every 10–14 h, with ~60 and ~40 μL added to the seeded and unseeded sides, respectively.
Tumor Morphometry
All tumors were characterized on day 0 by measuring the minimum distance D between the tumor and neighboring cavity or cavities. In-plane (xy) distances were measured by phase-contrast imaging at 10× magnification with an air objective (NA 0.25) on a Nikon Eclipse microscope and calibrated with a stage micrometer. Out-of-plane (z) distances were measured using the focal ring and were adjusted by a factor of 1.33 to account for the refractive index of the hydrated gel. D was calculated from the in-plane and adjusted out-of-plane distances using the formula of Pythagoras. In most cases, D equaled the distance between the tip of the tumor and the tip of the cavity. For tumors that were adjacent to two cavities, we also measured the cavity-to-cavity distance.
In some experiments, D was measured again on day 6, after invasion had taken place. In these cases, D referred to the minimum distance between invading cells and the cavity.
Application of Pressures
On day 2 post-seeding, we applied a hydrostatic pressure of ~0.65 cm H2O to the seeded or unseeded ends of the gel by placing a PDMS spacer onto the desired end and filling it with culture medium. For tumors that were adjacent to a single cavity, the pressure condition consisted of either a tumor pressure of 0.65 cm H2O and a cavity pressure of 0 cm H2O (“hypertension”), or the reverse (“hypotension”). For tumors that were between two cavities, one of the two cavities was set to 0.65 cm H2O while the other cavity and the tumor were both maintained at 0 cm H2O; the tumors in this configuration were always cultured under interstitial hypotension. Tumors were maintained under pressure for an additional two weeks (i.e., until day 16) by adding medium to the upstream end (the side with the PDMS spacer) and removing the medium that had accumulated in the downstream end every 10–14 h.
In some samples, tumors that had invaded were switched from hypotension to hypertension on day 6. These tumors were then maintained under interstitial hypertension until day 16.
Analysis of Invasion and Escape
All tumors were observed by phase-contrast imaging at 10× magnification every 10–14 h. Tumor “invasion” was considered to occur when a protrusion from the surface of the tumor extended into the surrounding collagen. We only counted tumors that clearly showed the migration of an entire cell body; the extension of thin, anuclear filopodia into the collagen was not considered invasion. Tumor “escape” was considered to occur when at least one cell body contacted and lay within the cavity. When escape was the first observed instance of a cell outside the initial tumor boundary, the day of invasion was considered to be the day of escape. These data only document the first day at which invasion or escape occurred; if a tumor invaded or escaped at two or more locations at different times, only the day of the first instance was recorded. In some samples, tumor cells gradually infiltrated along the interface between PDMS or glass and the collagen gel and eventually obscured a view of the tumor; in these cases, the tumor was considered censored when invasion or escape could no longer be detected with certainty.
Collection and Application of Tumor Interstitial Fluid
Starting on day 9 post-seeding, we harvested interstitial fluid every 10–14 h from a subset of tumors that were adjacent to a single cavity and cultured under hypertensive conditions. This procedure consisted of collecting the fluid that accumulated in the downstream well (i.e., the well adjacent to the cavity). Collected medium was stored at 4 °C and then used without further purification.
To apply interstitial fluid to tumors, we first subjected a separate set of tumors that were adjacent to a single cavity to interstitial hypotension starting on day 2 post-seeding. After an additional four days of feeding with fresh medium, we rinsed the upstream well with PBS and then refilled the well with the collected interstitial fluid while preserving the hypotensive condition. Subsequent feedings (i.e., from day 6 onwards) were performed with interstitial fluid.
Staining
Cell viability and F-actin staining were performed on tumors on day 7 post-seeding. Live tumors were stained with Hoechst 33342 (1 μg/mL; Invitrogen) and propidium iodide (2 μg/mL; Invitrogen) by adding ~80 μL of labeled medium to the well opposite the tumor and ~20 μL to the well adjacent to the tumor and allowing medium to flow for 30–40 min before imaging. A separate set of tumors were fixed with 4% paraformaldehyde (Electron Microscopy Sciences) for 15 min at room temperature and permeabilized with 0.2% Triton X-100 (Sigma) for 1 h. These tumors were stained with Hoechst 33342 (1 μg/mL) and Alexa Fluor 488-conjugated phalloidin (0.33 μM; Invitrogen) in 0.1% Triton X-100 by adding ~80 μL of labeled solution to the well opposite the tumor and ~20 μL to the well adjacent to the tumor and allowing the solution to flow through the gel for 1 h. Tumors were then washed with PBS three times for 20 min each before imaging. Fluorescence images were acquired using an Axiovert 200 inverted microscope (Zeiss) with a 10×/0.30 NA Plan-Neofluar objective and an Axiocam MRm camera (Zeiss) at 1040 × 1388 resolution.
Mechanical Characterization of Gels
For each set of tumors, we measured the hydraulic permeability of a separate collagen gel by gelling collagen in a PDMS/glass chamber in the absence of needles. A pressure difference ΔP of 1.4–1.5 cm H2O was applied across the resulting solid gel to induce a uniform interstitial flow at 37 °C. The flow rate Q was calculated from the volume of medium that flowed across the gel in 5–7 h (for 3.9 mg/mL collagen) or in 1–1.1 h (for 2.5 mg/mL collagen). From the length L and cross-sectional area A of the gel, the hydraulic permeability k of the gel was calculated as k = QL/AΔP. The Darcy permeability κ was calculated as κ = ηk, where η = 0.72 cP is the viscosity of medium at 37 °C.
Measurement of Flow Rates
Flow rates into a cavity or a tumor were calculated from the volume of medium that flowed into the respective well over ~12 h. Evaporation rates were determined from the differences between the flow rates from upstream and downstream wells in the same tumor. Corrected flow rates were obtained by adding the average evaporation rate (1.3 μL/h) to all measured flow rates.
Finite-Element Modeling of Flow
The flow of fluid through tumors, their surrounding gel, and their adjacent cavities was modeled using COMSOL Multiphysics ver. 5.4 (Comsol, Inc.). Cavities and tumors were approximated as 120-μm-diameter cylinders with a 120-μm-diameter hemispherical cap. Tumors were placed 200 μm from a cavity (i.e., D equaled 200 μm). Flow through the collagen gel and tumor aggregate was modeled with Darcy’s Law, with Darcy permeabilities of 0.053 μm2 and 0.1 μm2, respectively. Flow through a cavity was modeled as creeping flow. The viscosity of interstitial fluid was set to 0.72 cP. Models were solved for the flow distribution using the PARDISO solver. Flow speeds were integrated across the cross-section of a model to obtain the flow rate, which was then divided by the 1 mm2 cross-sectional area to obtain the area-averaged flow speed. Local flow speeds at the surface of the tumor were obtained at the locations nearest to a cavity. Meshes were refined until a two-fold increase in mesh degrees-of-freedom led to <2% difference in the computed flow speeds.
Statistical Analysis
Comparison of invasion or escape frequencies were performed on Kaplan-Meier curves using the log-rank test. In the Kaplan-Meier plots, “fraction invaded” or “fraction escaped” refers to the percentage of tumors that invaded or escaped, not to the percentage of cells that invaded or escaped. Comparison of cumulative frequency distributions for the tumor-cavity distance D used the Kolmogorov-Smirnov test. A p value less than 0.05 was considered to denote a statistically significant difference. Statistical tests were performed with Prism ver. 6 (GraphPad).
Results
Essential Features of the Tumor Escape Model
The current design of the tumors was adapted from one described previously26,39 by including blind-ended cavities to allow for the escape of invasive tumor cells. Cavities were placed within 300 μm of tumors. In preliminary experiments, we found that this range of distances enabled many tumors to escape within two weeks after pressure was applied. At tumor-cavity distances greater than 300 μm, escape was extremely rare regardless of the pressure condition (data not shown).
Because the pore size of surrounding collagen has been found in other systems to correlate with the invasive phenotype of tumor cells,7,8,42 we measured the permeability of the collagen gels. For 3.9 mg/mL collagen, the Darcy permeability was 0.053 ± 0.004 μm2. For 2.5 mg/mL collagen, it was 0.178 ± 0.021 μm2. These permeabilities are consistent with a smaller pore size in the higher concentration gel, as expected.
Interstitial Hypertension Suppresses Tumor Cell Escape
To test whether interstitial hypertension affects the likelihood of tumor cell escape, we compared the kinetics of escape under hypertension and hypotension. In vivo, interstitial hypotension (relative to blood pressure) is observed in small breast tumors that would be expected to retain some functional lymphatic drainage.15 We modeled hypotension by placing the cavity at a higher pressure than the tumor. Under hypotension, tumors followed a stereotypical series of steps that culminated in escape (Fig. 2a, left). In 3.9 mg/mL gels, invasion typically occurred by day 6 as collective multicellular protrusions with a smooth cortical actin layer (Fig. 2a, middle). Tumor cell viability was high at the tumor edge where protrusions were typically found and decreased slightly at locations further from the cavity (Fig. 2a, right). In nearly all tumors, these protrusions elongated over time, and invasion was followed by escape within the next ten days. The initial escape event typically consisted of the leading cell in a collective protrusion breaching the boundary of the cavity, which was followed on the next day by migration or proliferation of the escaping cell along the cavity wall and/or streaming of additional cells into the cavity. On occasion, we observed escaped cells invade from the cavity back into the surrounding collagen gel.
Figure 2.

Representative images of micro-tumors in 3.9 mg/mL collagen under (a) interstitial hypotension or (b) interstitial hypertension. The tumors in (a) invaded and/or escaped, while the ones in (b) failed to invade or escape. Left, phase-contrast images (a, day 7; b, day 16). Middle, actin (green) and nuclear (blue) stains (a and b, day 7). Right, cell viability (red) and nuclear (blue) stains (a and b, day 7). “PI” refers to propidium iodide. Images are from six tumors, with initial D of 236 μm (a, left), 217 μm (a, middle), 237 μm (a, right), 175 μm (b, left), 209 μm (b, middle), and 267 μm (b, right).
In contrast, under hypertension, tumors in 3.9 mg/mL collagen rarely escaped (Fig. 2b, left). As we have shown previously,39 interstitial hypertension completely abrogated tumor cell invasion, and instead induced thin, actin-rich filopodia to emanate from the surface of the tumor (Fig. 2b, middle). For cavities that were sufficiently close to a tumor, the tumor-derived filopodia could extend into the cavity. These filopodia were surprisingly dynamic and could extend and retract in the cavity. Nevertheless, it was rare to find a nucleated cell that escaped in the cavity under hypertensive conditions. Tumor cell viability was limited to the boundary of the tumor, with the deeper regions containing many non-viable cells (Fig. 2b, right).
As shown by the phase-contrast images of both hypertensive and hypotensive tumors, the vast majority of cells did not invade or escape. Of the cells that did invade, only a fraction managed to escape by the end of the experiment (i.e., by day 16). Our assay could not determine whether all invasive cells were capable of eventually escaping, or if only a subset had this property.
To assess the degree to which hypertension suppressed escape, we applied Kaplan–Meier analysis and plotted the fraction of tumors that escaped as a function of time after pressure was applied. This analysis showed that hypertension decreased the risk of escape 7- to 8-fold (hazard ratio 0.13, 95% CI 0.067–0.24, p < 0.0001; Fig. 3a). For initial tumor-cavity distances greater than 150 μm, no instances of escape were observed under interstitial hypertension (Fig. 3b). In this subset of tumors, hypertension decreased the risk of escape ~10-fold (hazard ratio 0.098, 95% CI 0.037–0.26, p < 0.0001). For initial tumor-cavity distances smaller than 150 μm, hypertension decreased the risk of escape ~6-fold (hazard ratio 0.17, 95% CI 0.074–0.39, p < 0.0001; Fig. 3c). These results suggest that the suppressive effect of hypertension is not limited to particular tumor-cavity configurations. Because the tumor-cavity distance affects the rate of escape, we checked that the initial (day 0) distributions of these distances were comparable between tumors subject to hypertension or hypotension (p = 0.79, 0.58, and 0.78 for all tumors, tumors with D > 150 μm, and tumors with D < 150 μm, respectively; Fig. S1a).
Figure 3.
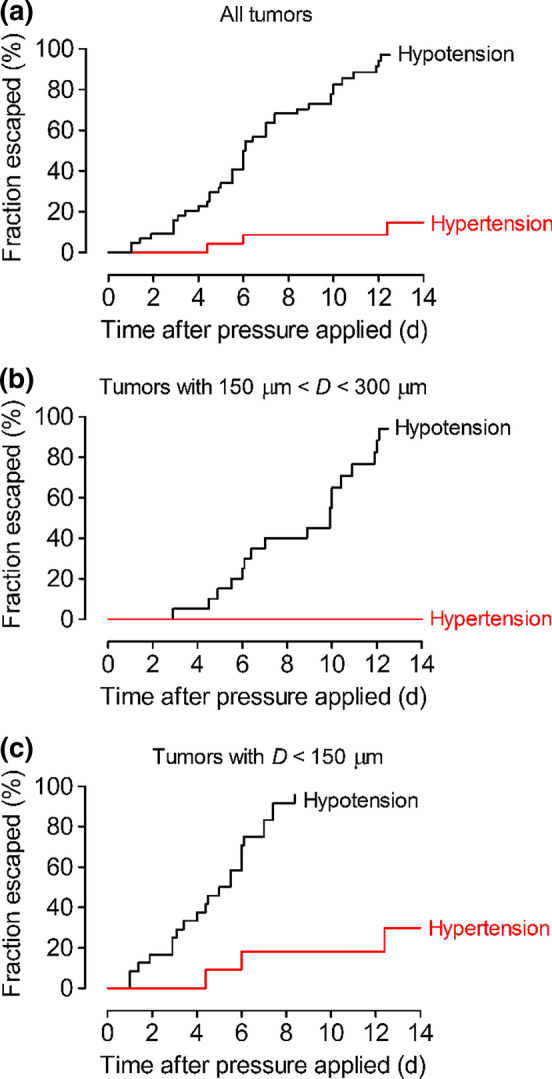
Plots of the fraction of tumors that had escaped as a function of time after application of hypertension or hypotension. These samples contained a single cavity for escape. (a) All tumors. (b) Tumors with initial tumor-cavity distance greater than 150 μm. (c) Tumors with initial tumor-cavity distance less than 150 μm.
Because hypertension also greatly suppressed invasion in 3.9 mg/mL collagen (p < 0.0001; Fig. S2a), one explanation for the decrease in escape could be simply that few cells invaded under hypertension to begin with. To determine whether hypertension could block the escape of tumor cells that had already invaded, we took two approaches. In the first approach, we generated tumors in 3.9 mg/mL collagen gels, applied hypotension on day 2, and maintained them under hypotension. By day 6, all tumors had invaded. Roughly half of the tumors were then switched to hypertension and maintained under this pressure condition for the remaining period of observation; the other half of the tumors continued to be held under hypotension. We assigned the samples to ensure that the distributions of tumor-cavity distances on day 0 and day 6 were similar for the two pressure conditions (p = 0.97 for day 0 and 0.81 for day 6; Fig. S1b). On day 6, when the pressure switch took place, the tumor-cavity distance had decreased from an initial (day 0) average of ~200 μm to 119 ± 47 μm for pressure-switched tumors and 121 ± 55 μm for tumors kept under hypotension. Remarkably, switching from hypotension to hypertension resulted in the stunting of existing invasions and induced the formation of filopodia (Fig. 4a). Although some of these tumors eventually escaped, switching to hypertension decreased the likelihood of escape ~5-fold (hazard ratio 0.20, 95% CI 0.094–0.43, p < 0.0001; Fig. 4b).
Figure 4.

Escape of tumors that were switched from hypotension to hypertension on day 6. (a) Representative images of tumors that did not (left, day 16) and tumors that did (right, day 11) escape after the pressure switch. Dense mats of filopodia extended from the tumor surfaces. (b) Plots of the fraction of tumors that escaped as a function of time after application of hypotension. The pressure was switched after 4–4.5 days of hypotension (i.e., on day 6); tumors that were not switched served as a comparison group. Images are from two tumors, with initial D of 146 μm (a, left) and 213 μm (a, right).
In the second approach, we assessed the ability of hypertension to hinder escape of cells in gels of a lower collagen concentration (2.5 mg/mL). Tumors in these gels invaded even before pressure was applied, most likely because the pore size was larger than in 3.9 mg/mL collagen. Thus, when pressure was applied on day 2, most of these tumors had already invaded (Fig. S2b). In contrast to the collective invasion observed in 3.9 mg/mL collagen, here the invasion was mostly as single cells (Fig. S3a, S3b). Tumors under hyper- or hypotension had similar initial tumor-cavity distances (p = 0.998; Fig. S1c). Again, the application of interstitial hypertension greatly retarded escape (hazard ratio 0.11, 95% CI 0.050–0.23, p < 0.0001; Fig. S3c). These results, along with those from the pressure-switching experiments, demonstrate that interstitial hypertension can suppress tumor escape even after the tumors have invaded.
Hypertension Does Not Hinder Escape by Promoting Cell Migration Upstream
Previous studies have shown that, depending on the cell density, tumor cells can migrate against the direction of interstitial flow.29,30 Since our tumors are generated as packed aggregates (i.e., at essentially the maximum possible cellular density), one would expect these cells to also migrate upstream. Thus, it is possible that interstitial hypertension reduces escape by causing a flow from the tumor to the cavity. This direction of flow would cause escape to be unfavorable, since escape would require migration to occur in the downstream direction.
To test this possibility, we generated tumors that were flanked on either side by cavities that were roughly the same distance from the tumor (Fig. 5a, S1d). On day 2, we set one cavity to a positive pressure; the other cavity and the tumor were both set to zero pressure. Under this configuration, flow occurred from the high-pressure cavity to the other cavity and to the tumor. The tumor thus started under hypotensive conditions and readily invaded. Once an invasion reached the region between the two cavities, however, it became exposed to a crosswise interstitial flow. If tumor cells escape by migrating against the direction of flow (i.e., upstream), then we would expect to find greater likelihood of escape into the high-pressure cavity.
Figure 5.

Escape of tumors that were flanked by equidistant cavities on the left and right. One of the cavities was maintained at higher pressure and considered the “upstream” cavity; the other one was maintained at 0 cm H2O and considered the “downstream” cavity. (a) Representative images of tumors that escaped into the upstream and/or downstream cavity (left, day 10; right, day 12). Pressure was applied from the left sides in both images. (b) Plots of the fraction of tumors that had escaped to the upstream vs downstream cavity, as a function of time after application of pressure. Images are from two tumors, with initial D of 225 μm (a, left) and 182 μm (a, right) to the upstream cavity and 238 μm (a, left) and 170 μm (a, right) to the downstream cavity.
In fact, we found that the kinetics of escape were equivalent into both cavities (hazard ratio 0.66, 95% CI 0.29–1.5, p = 0.32; Fig. 5b). This result implies that, in this system, tumor cells do not preferentially migrate upstream or downstream. As a result, the inhibition of escape by interstitial hypertension does not result from a direct response of tumor cells to the direction of flow.
Hypertension Hinders Escape by Convection of Tumor Interstitial Fluid
Although tumor cells do not appear to respond directly to pressure-induced differences in flow direction, these differences are not the only effect of interstitial hypertension. In particular, hypertension leads to the convection of interstitial fluid in a tumor-to-cavity direction, which alters the chemical microenvironment around the cells at the tip of the tumor. Thus, another possible mechanism for the effects of hypertension on escape is through tumor interstitial fluid.
To test this possibility, we subjected tumors to hypertensive conditions starting on day 2 and collected the fluid that accumulated in the cavity starting on day 9. This interstitial fluid was then applied to a separate set of tumors under hypotensive conditions after they had already invaded (i.e., on day 6). In other words, these tumors were exposed to escape-promoting pressure conditions but in the presence of interstitial fluid from escape-prevented tumors. We confirmed that the two populations of tumors had similar tumor-cavity distance distributions on day 0 and on day 6 (p = 0.88 for day 0 and 0.99 for day 6; Fig. S1e). Addition of the interstitial fluid resulted in the cessation of invasion and the development of filopodia (Fig. 6a), just as we observed in the pressure-switching experiments. These morphological changes were accompanied by a strong reduction in escape probability (hazard ratio 0.12, 95% CI 0.046–0.29, p < 0.0001; Fig. 6b). Altogether, our data imply that interstitial hypertension does not suppress escape via a direct physical mechanism. Rather, tumor cells respond to convective changes in their chemical microenvironment, which is switched by hypertension from one that promotes invasion and escape to one that inhibits both processes.
Figure 6.

Escape of tumors that were refed with interstitial fluid. (a) Representative images of tumors that did (left, day 15) or did not (right, day 16) escape after addition of interstitial fluid. (b) Plots of the fraction of tumors that had escaped as a function of time after application of hypotension. Interstitial fluid was added after 4–4.5 days of hypotension; tumors that continued to be refed with fresh medium served as a comparison group. Images are from two tumors, with initial D of 165 μm (a, left) and 181 μm (a, right).
Discussion
The main finding of this study is that interstitial hypertension inhibits the escape of MDA-MB-231 human breast cancer cells. This effect is mediated not by a direct response of cells to interstitial flow, but by alteration of the chemical microenvironment with hypertension-induced convection of tumor interstitial fluid. We have found the suppressive effect of hypertension to be very robust, with hazard ratios of 0.1-0.2 in a variety of tumor configurations (Fig. S4). It is important to keep in mind that these hazard ratios refer to the risk of invasion or escape of the tumor as a whole, rather than the risk that a given individual cell within the tumor invades or escapes; in other words, the hazard ratios are calculated on a per-tumor, rather than per-cell, basis.
Role of Interstitial Flow in Tumor Cell Escape
Previous studies have examined how interstitial flow can affect the escape of MDA-MB-231 and other human breast cancer cells in type I collagen gels.28,36 These studies have reached opposite conclusions from ours, and it is worth comparing the current and previous studies to better understand the origin of the difference. In the most relevant previous studies, tumor cells were seeded as individual cells within type I collagen and/or Matrigel-containing gels, and allowed to migrate towards filters, the undersides of which were covered by lymphatic endothelium. Interstitial flow of 0.2–1 μm/s was applied in a gel-to-endothelium direction. These studies found that tumor cells migrated towards and eventually across the endothelium (mimicking escape), with increased transmigration under flow. Flow-induced migration was independent of the presence of the endothelium, and instead depended upon signaling via the chemokine receptor CCR7, which is expressed by tumor cells. These studies concluded that CCR7-mediated autologous chemotaxis was responsible for downstream migration, and suggested that interstitial flow could direct lymphatic escape of migrating tumor cells.
When applied to our current study, this conclusion would imply that interstitial hypertension should promote escape into the cavity. Yet, our data clearly demonstrate the opposite is true. Several differences in experimental design may be responsible for this difference. First, and perhaps most importantly, the tumor cells in our system invaded from a densely packed aggregate, whereas they were seeded sparsely (0.35–1 million cells/mL) and as individual cells in previous studies. We have found that invasion from an aggregate results in collective migration in 3.9 mg/mL collagen, a migratory phenotype that is absent in previous work. Second, the pore sizes of gels may differ. Although gel permeabilities were not reported in the previous studies, one study used 1.5 mg/mL collagen with 10% Matrigel,28 which would be expected to have larger permeability than the gels we have used here.
Differences in interstitial flow speed may also play a role. Normalizing the measured flow rates of 3–4 μL/h (Fig. S5a) to the gel cross-sectional area gave average interstitial flow speeds of 0.8–1.1 μm/s, which are nominally similar to that used in previous studies and to flow speeds near tumors in vivo.2 These area-averaged speeds, however, do not necessarily reflect the flow speeds experienced locally by cells at the invasive front of our tumors. To obtain more information on local flow distributions, we used the finite-element method to solve models of the flow within the tumors, gels, and cavities and calculated the local and area-averaged flow speeds (Fig. S5b). These models indicate that the flow speeds at the locations where a tumor is closest to a cavity can be up to ~2-fold or ~8-fold larger than the area-averaged values for tumors adjacent to one or two cavities, respectively. These large local interstitial flows may partly account for the differences between our findings and those of previous studies.
Role of Interstitial Fluid in Tumor Cell Escape
Under interstitial hypertension, added culture medium is conditioned as it percolates through the tumor and gel before it reaches the tip of the tumor (and eventually flows out the downstream cavity). Conversely, under interstitial hypotension, the tip of the tumor is exposed largely to fresh medium added to the upstream cavity. We have found previously that fresh and tumor-conditioned media differ chemically, but the effects of these changes on tumor behavior cannot solely be attributed to loss of nutrients and increase in metabolites.39 For instance, tumor-conditioned interstitial fluid has lower concentrations of glucose and lower pH, but neither change by itself or in combination is responsible for the suppression of invasion by the conditioned medium. It is likely that the same result holds for suppression of escape; identification of the solutes that are responsible for the effects of conditioned medium in the current study remains to be performed.
Potential Relevance In Vivo
During the progression of a breast tumor from in situ to invasive carcinoma, the IFP rises above its normally near-atmospheric value. Given that the development of metastatic lesions takes place over years while IFP rises with tumor growth and progression, it is likely that interstitial hypertension precedes metastasis. Although we are not aware of any published studies that have searched for a direct causal link between changes in IFP and tumor progression, some studies have reported a positive correlation between IFP and metastasis (primarily in melanoma and cervical cancer),19,33,34 while others have not.17,22 Confounding factors, such as inter-study differences in tumor types, locations, sizes, and vascular densities, may partly account for the discordant findings. It is important to recognize that a possible positive correlation between IFP and metastasis in vivo does not necessarily imply that the elevation in IFP promotes metastasis, or that it cannot antagonize metastasis.
Our current study uses a well-controlled breast tumor model to isolate the effects of interstitial hypertension, and reveals that an increase in IFP acts to suppress further invasion and escape of MDA-MB-231 tumor cells. Our model is intended to mimic the pressure conditions near the rim of a hypertensive tumor, where a large IFP gradient exists; as applied here, the model does not replicate the pressure conditions within the core of a hypertensive tumor, where the IFP is uniformly large and pressure gradients are negligible. The levels of interstitial hypertension that are used in this study result in a 5- to 10-fold reduction in risk of cell escape. It is unlikely that such large reductions are found in vivo, and we suspect that metastatic escape in vivo is the result of multiple competing pro- and anti-metastatic signals, of which interstitial hypertension is only one. We have found no evidence that the increased interstitial flow that accompanies interstitial hypertension can “carry” tumor cells to a downstream cavity.
It is worth noting that vascular normalization therapy is being actively explored as a means to promote delivery of chemotherapeutics to breast and other types of tumors via a decrease in interstitial hypertension.12 Our findings suggest that this therapy may inadvertently hasten metastatic escape, and it will be important to test whether tumor interstitial fluid has the same suppressive effects in vivo as we observed here in vitro.
Conclusions
The progression of a solid tumor from an invasive phenotype to vascular escape remains enigmatic. How invasive tumor cells find their way to the open lumen and how cell-autonomous and microenvironmental signals work together to affect this process are still unclear. Our 3D model of human breast tumor invasion and escape revealed that interstitial hypertension greatly decreases the rate and overall likelihood of escape from a preformed tumor aggregate to an empty cavity. In contrast to in vivo escape, here escape occurred into an endothelium-free cavity and in the absence of constant perfusion. These parameters will be evaluated in future work by culturing endothelial cells on the cavity and/or by using a perfusable channel instead of a blind-ended cavity. Our current findings thus provide a baseline for comparison with escape in more elaborate systems, which should help shed light on the relevant factors that can interfere with this critical step in metastatic progression.
Electronic Supplementary Material
Below is the link to the electronic supplementary material.
Acknowledgments
This work was supported by award U01 CA214292 from the National Cancer Institute. Y.W.D. was supported by a training grant from the National Institute of General Medical Sciences (award T32 GM008764) and by a fellowship from the CURE Diversity Research Supplements Program at the National Cancer Institute.
Conflict of interest
Joe Tien, Yoseph W. Dance, Usman Ghani, Alex J. Seibel, and Celeste M. Nelson declare that they have no conflict of interest.
Ethical Standards
No human or animal studies were carried out by the authors for this article.
Informed Consent
Informed consent was not required.
Footnotes
Publisher's Note
Springer Nature remains neutral with regard to jurisdictional claims in published maps and institutional affiliations.
Contributor Information
Joe Tien, Email: jtien@bu.edu.
Celeste M. Nelson, Email: celesten@princeton.edu
References
- 1.Beckmann MW, Niederacher D, Schnürch H-G, Gusterson BA, Bender HG. Multistep carcinogenesis of breast cancer and tumour heterogeneity. J. Mol. Med. 1997;75:429–439. doi: 10.1007/s001090050128. [DOI] [PubMed] [Google Scholar]
- 2.Chary SR, Jain RK. Direct measurement of interstitial convection and diffusion of albumin in normal and neoplastic tissues by fluorescence photobleaching. Proc. Natl. Acad. Sci. USA. 1989;86:5385–5389. doi: 10.1073/pnas.86.14.5385. [DOI] [PMC free article] [PubMed] [Google Scholar]
- 3.Chrobak KM, Potter DR, Tien J. Formation of perfused, functional microvascular tubes in vitro. Microvasc. Res. 2006;71:185–196. doi: 10.1016/j.mvr.2006.02.005. [DOI] [PubMed] [Google Scholar]
- 4.Chung S, Sudo R, Zervantonakis IK, Rimchala T, Kamm RD. Surface-treatment-induced three-dimensional capillary morphogenesis in a microfluidic platform. Adv. Mater. 2009;21:4863–4867. doi: 10.1002/adma.200901727. [DOI] [PubMed] [Google Scholar]
- 5.Ehsan SM, Welch-Reardon KM, Waterman ML, Hughes CCW, George SC. A three-dimensional in vitro model of tumor cell intravasation. Integr. Biol. 2014;6:603–610. doi: 10.1039/c3ib40170g. [DOI] [PMC free article] [PubMed] [Google Scholar]
- 6.Goetz JG, Minguet S, Navarro-Lérida I, Lazcano JJ, Samaniego R, Calvo E, Tello M, Osteso-Ibáñez T, Pellinen T, Echarri A, Cerezo A, Klein-Szanto AJP, Garcia R, Keely PJ, Sánchez-Mateos P, Cukierman E, Del Pozo MA. Biomechanical remodeling of the microenvironment by stromal caveolin-1 favors tumor invasion and metastasis. Cell. 2011;146:148–163. doi: 10.1016/j.cell.2011.05.040. [DOI] [PMC free article] [PubMed] [Google Scholar]
- 7.Guzman A, Ziperstein MJ, Kaufman LJ. The effect of fibrillar matrix architecture on tumor cell invasion of physically challenging environments. Biomaterials. 2014;35:6954–6963. doi: 10.1016/j.biomaterials.2014.04.086. [DOI] [PubMed] [Google Scholar]
- 8.Haeger A, Krause M, Wolf K, Friedl P. Cell jamming: collective invasion of mesenchymal tumor cells imposed by tissue confinement. Biochim. Biophys. Acta. 1840;2386–2395:2014. doi: 10.1016/j.bbagen.2014.03.020. [DOI] [PubMed] [Google Scholar]
- 9.Harney AS, Arwert EN, Entenberg D, Wang Y, Guo P, Qian B-Z, Oktay MH, Pollard JW, Jones JG, Condeelis JS. Real-time imaging reveals local, transient vascular permeability, and tumor cell intravasation stimulated by TIE2hi macrophage-derived VEGFA. Cancer Discov. 2015;5:932–943. doi: 10.1158/2159-8290.CD-15-0012. [DOI] [PMC free article] [PubMed] [Google Scholar]
- 10.Hu M, Yao J, Carroll DK, Weremowicz S, Chen H, Carrasco D, Richardson A, Violette S, Nikolskaya T, Nikolsky Y, Bauerlein EL, Hahn WC, Gelman RS, Allred C, Bissell MJ, Schnitt S, Polyak K. Regulation of in situ to invasive breast carcinoma transition. Cancer Cell. 2008;13:394–406. doi: 10.1016/j.ccr.2008.03.007. [DOI] [PMC free article] [PubMed] [Google Scholar]
- 11.Jain RK. Transport of molecules, particles, and cells in solid tumors. Annu. Rev. Biomed. Eng. 1999;1:241–263. doi: 10.1146/annurev.bioeng.1.1.241. [DOI] [PubMed] [Google Scholar]
- 12.Jain RK. Normalizing tumor microenvironment to treat cancer: bench to bedside to biomarkers. J. Clin. Oncol. 2013;31:2205–2218. doi: 10.1200/JCO.2012.46.3653. [DOI] [PMC free article] [PubMed] [Google Scholar]
- 13.Kurozumi S, Joseph C, Sonbul S, Alsaeed S, Kariri Y, Aljohani A, Raafat S, Alsaleem M, Ogden A, Johnston SJ, Aleskandarany MA, Fujii T, Shirabe K, Caldas C, Ashankyty I, Dalton L, Ellis IO, Desmedt C, Green AR, Mongan NP, Rakha EA. A key genomic subtype associated with lymphovascular invasion in invasive breast cancer. Br. J. Cancer. 2019;120:1129–1136. doi: 10.1038/s41416-019-0486-6. [DOI] [PMC free article] [PubMed] [Google Scholar]
- 14.Lee S, Mohsin SK, Mao S, Hilsenbeck SG, Medina D, Allred DC. Hormones, receptors, and growth in hyperplastic enlarged lobular units: early potential precursors of breast cancer. Breast Cancer Res. 2006;8:R6. doi: 10.1186/bcr1367. [DOI] [PMC free article] [PubMed] [Google Scholar]
- 15.Less JR, Posner MC, Boucher Y, Borochovitz D, Wolmark N, Jain RK. Interstitial hypertension in human breast and colorectal tumors. Cancer Res. 1992;52:6371–6374. [PubMed] [Google Scholar]
- 16.Levental KR, Yu H, Kass L, Lakins JN, Egeblad M, Erler JT, Fong SFT, Csiszar K, Giaccia A, Weninger W, Yamauchi M, Gasser DL, Weaver VM. Matrix crosslinking forces tumor progression by enhancing integrin signaling. Cell. 2009;139:891–906. doi: 10.1016/j.cell.2009.10.027. [DOI] [PMC free article] [PubMed] [Google Scholar]
- 17.Lunt SJ, Kalliomaki TMK, Brown A, Yang VX, Milosevic M, Hill RP. Interstitial fluid pressure, vascularity and metastasis in ectopic, orthotopic and spontaneous tumours. BMC Cancer. 2008;8:2. doi: 10.1186/1471-2407-8-2. [DOI] [PMC free article] [PubMed] [Google Scholar]
- 18.Ma X-J, Salunga R, Tuggle JT, Gaudet J, Enright E, McQuary P, Payette T, Pistone M, Stecker K, Zhang BM, Zhou Y-X, Varnholt H, Smith B, Gadd M, Chatfield E, Kessler J, Baer TM, Erlander MG, Sgroi DC. Gene expression profiles of human breast cancer progression. Proc. Natl. Acad. Sci. USA. 2003;100:5974–5979. doi: 10.1073/pnas.0931261100. [DOI] [PMC free article] [PubMed] [Google Scholar]
- 19.Milosevic M, Fyles A, Hedley D, Pintilie M, Levin W, Manchul L, Hill R. Interstitial fluid pressure predicts survival in patients with cervix cancer independent of clinical prognostic factors and tumor oxygen measurements. Cancer Res. 2001;61:6400–6405. [PubMed] [Google Scholar]
- 20.Muñoz-Nájar UM, Neurath KM, Vumbaca F, Claffey KP. Hypoxia stimulates breast carcinoma cell invasion through MT1-MMP and MMP-2 activation. Oncogene. 2006;25:2379–2392. doi: 10.1038/sj.onc.1209273. [DOI] [PubMed] [Google Scholar]
- 21.Nagaraju S, Truong D, Mouneimne G, Nikkhah M. Microfluidic tumor-vascular model to study breast cancer cell invasion and intravasation. Adv. Healthcare Mater. 2018;7:e1701257. doi: 10.1002/adhm.201701257. [DOI] [PubMed] [Google Scholar]
- 22.Nathanson SD, Nelson L. Interstitial fluid pressure in breast cancer, benign breast conditions, and breast parenchyma. Ann. Surg. Oncol. 1994;1:333–338. doi: 10.1007/BF03187139. [DOI] [PubMed] [Google Scholar]
- 23.Netti PA, Hamberg LM, Babich JW, Kierstead D, Graham W, Hunter GJ, Wolf GL, Fischman A, Boucher Y, Jain RK. Enhancement of fluid filtration across tumor vessels: implication for delivery of macromolecules. Proc. Natl. Acad. Sci. USA. 1999;96:3137–3142. doi: 10.1073/pnas.96.6.3137. [DOI] [PMC free article] [PubMed] [Google Scholar]
- 24.Nishiguchi A, Matsusaki M, Kano MR, Nishihara H, Okano D, Asano Y, Shimoda H, Kishimoto S, Iwai S, Akashi M. In vitro 3D blood/lymph-vascularized human stromal tissues for preclinical assays of cancer metastasis. Biomaterials. 2018;179:144–155. doi: 10.1016/j.biomaterials.2018.06.019. [DOI] [PubMed] [Google Scholar]
- 25.Padmanaban V, Krol I, Suhail Y, Szczerba BM, Aceto N, Bader JS, Ewald AJ. E-cadherin is required for metastasis in multiple models of breast cancer. Nature. 2019;573:439–444. doi: 10.1038/s41586-019-1526-3. [DOI] [PMC free article] [PubMed] [Google Scholar]
- 26.Piotrowski-Daspit AS, Simi AK, Pang M-F, Tien J, Nelson CM. A three-dimensional culture model to study how fluid pressure and flow affect the behavior of aggregates of epithelial cells. In: Martin F, Stein T, Howlin J, editors. Mammary Gland Development (Methods in Molecular Biology) New York: Humana Press; 2017. pp. 245–257. [DOI] [PubMed] [Google Scholar]
- 27.Piotrowski-Daspit AS, Tien J, Nelson CM. Interstitial fluid pressure regulates collective invasion in engineered human breast tumors via Snail, vimentin, and E-cadherin. Integr. Biol. 2016;8:319–331. doi: 10.1039/c5ib00282f. [DOI] [PMC free article] [PubMed] [Google Scholar]
- 28.Pisano M, Triacca V, Barbee KA, Swartz MA. An in vitro model of the tumor-lymphatic microenvironment with simultaneous transendothelial and luminal flows reveals mechanisms of flow enhanced invasion. Integr. Biol. 2015;7:525–533. doi: 10.1039/c5ib00085h. [DOI] [PubMed] [Google Scholar]
- 29.Polacheck WJ, Charest JL, Kamm RD. Interstitial flow influences direction of tumor cell migration through competing mechanisms. Proc. Natl. Acad. Sci. USA. 2011;108:11115–11120. doi: 10.1073/pnas.1103581108. [DOI] [PMC free article] [PubMed] [Google Scholar]
- 30.Polacheck WJ, German AE, Mammoto A, Ingber DE, Kamm RD. Mechanotransduction of fluid stresses governs 3D cell migration. Proc. Natl. Acad. Sci. USA. 2014;111:2447–2452. doi: 10.1073/pnas.1316848111. [DOI] [PMC free article] [PubMed] [Google Scholar]
- 31.Provenzano PP, Eliceiri KW, Campbell JM, Inman DR, White JG, Keely PJ. Collagen reorganization at the tumor-stromal interface facilitates local invasion. BMC Med. 2006;4:38. doi: 10.1186/1741-7015-4-38. [DOI] [PMC free article] [PubMed] [Google Scholar]
- 32.Provenzano PP, Inman DR, Eliceiri KW, Knittel JG, Yan L, Rueden CT, White JG, Keely PJ. Collagen density promotes mammary tumor initiation and progression. BMC Med. 2008;6:11. doi: 10.1186/1741-7015-6-11. [DOI] [PMC free article] [PubMed] [Google Scholar]
- 33.Rofstad EK, Galappathi K, Mathiesen BS. Tumor interstitial fluid pressure–a link between tumor hypoxia, microvascular density, and lymph node metastasis. Neoplasia. 2014;16:586–594. doi: 10.1016/j.neo.2014.07.003. [DOI] [PMC free article] [PubMed] [Google Scholar]
- 34.Rofstad EK, Tunheim SH, Mathiesen B, Graff BA, Halsør EF, Nilsen K, Galappathi K. Pulmonary and lymph node metastasis is associated with primary tumor interstitial fluid pressure in human melanoma xenografts. Cancer Res. 2002;62:661–664. [PubMed] [Google Scholar]
- 35.Schuetz CS, Bonin M, Clare SE, Nieselt K, Sotlar K, Walter M, Fehm T, Solomayer E, Riess O, Wallwiener D, Kurek R, Neubauer HJ. Progression-specific genes identified by expression profiling of matched ductal carcinomas in situ and invasive breast tumors, combining laser capture microdissection and oligonucleotide microarray analysis. Cancer Res. 2006;66:5278–5286. doi: 10.1158/0008-5472.CAN-05-4610. [DOI] [PubMed] [Google Scholar]
- 36.Shields JD, Fleury ME, Yong C, Tomei AA, Randolph GJ, Swartz MA. Autologous chemotaxis as a mechanism of tumor cell homing to lymphatics via interstitial flow and autocrine CCR7 signaling. Cancer Cell. 2007;11:526–538. doi: 10.1016/j.ccr.2007.04.020. [DOI] [PubMed] [Google Scholar]
- 37.Sternlicht MD, Lochter A, Sympson CJ, Huey B, Rougier J-P, Gray JW, Pinkel D, Bissell MJ, Werb Z. The stromal proteinase MMP3/stromelysin-1 promotes mammary carcinogenesis. Cell. 1999;98:137–146. doi: 10.1016/s0092-8674(00)81009-0. [DOI] [PMC free article] [PubMed] [Google Scholar]
- 38.Sugino T, Kusakabe T, Hoshi N, Yamaguchi T, Kawaguchi T, Goodison S, Sekimata M, Homma Y, Suzuki T. An invasion-independent pathway of blood-borne metastasis: a new murine mammary tumor model. Am. J. Pathol. 2002;160:1973–1980. doi: 10.1016/S0002-9440(10)61147-9. [DOI] [PMC free article] [PubMed] [Google Scholar]
- 39.Tien J, Truslow JG, Nelson CM. Modulation of invasive phenotype by interstitial pressure-driven convection in aggregates of human breast cancer cells. PLoS ONE. 2012;7:e45191. doi: 10.1371/journal.pone.0045191. [DOI] [PMC free article] [PubMed] [Google Scholar]
- 40.Weigelt B, Glas AM, Wessels LFA, Witteveen AT, Peterse JL, van’t Veer LJ. Gene expression profiles of primary breast tumors maintained in distant metastases. Proc. Natl. Acad. Sci. USA. 2003;100:15901–15905. doi: 10.1073/pnas.2634067100. [DOI] [PMC free article] [PubMed] [Google Scholar]
- 41.Wellings SR, Jensen HM, Marcum RG. An atlas of subgross pathology of the human breast with special reference to possible precancerous lesions. J. Natl. Cancer Inst. 1975;55:231–273. [PubMed] [Google Scholar]
- 42.Wolf K, te Lindert M, Krause M, Alexander S, te Riet J, Willis AL, Hoffman RM, Figdor CG, Weiss SJ, Friedl P. Physical limits of cell migration: control by ECM space and nuclear deformation and tuning by proteolysis and traction force. J. Cell Biol. 2013;201:1069–1084. doi: 10.1083/jcb.201210152. [DOI] [PMC free article] [PubMed] [Google Scholar]
- 43.Wong AD, Searson PC. Mitosis-mediated intravasation in a tissue-engineered tumor-microvessel platform. Cancer Res. 2017;77:6453–6461. doi: 10.1158/0008-5472.CAN-16-3279. [DOI] [PMC free article] [PubMed] [Google Scholar]
- 44.Wyckoff J, Wang W, Lin EY, Wang Y, Pixley F, Stanley ER, Graf T, Pollard JW, Segall J, Condeelis J. A paracrine loop between tumor cells and macrophages is required for tumor cell migration in mammary tumors. Cancer Res. 2004;64:7022–7029. doi: 10.1158/0008-5472.CAN-04-1449. [DOI] [PubMed] [Google Scholar]
Associated Data
This section collects any data citations, data availability statements, or supplementary materials included in this article.