Abstract
Multi-agent combination chemotherapy can be curative in acute lymphoblastic leukemia (ALL). Still, patients with primary refractory disease or with relapsed leukemia have a very poor prognosis. Here we integrate an in-depth dissection of the mutational landscape across diagnostic and relapsed pediatric and adult ALL samples with genome-wide CRISPR screen analysis of gene-drug interactions across seven ALL chemotherapy drugs. By combining these analyses, we uncover diagnostic and relapse-specific mutational mechanisms as well as genetic drivers of chemoresistance. Functionally, our data identifies common and drug-specific pathways modulating chemotherapy response and underscores the effect of drug combinations in restricting the selection of resistance-driving genetic lesions. In addition, by identifying actionable targets for the reversal of chemotherapy resistance, these analyses open novel therapeutic opportunities for the treatment of relapse and refractory disease.
ALL is an aggressive hematologic tumor resulting from the malignant transformation of immature lymphoid progenitor cells. Diffuse bone marrow infiltration by malignant lymphoblasts induces hematopoietic failure, which in the absence of treatment is rapidly fatal due to infection and hemorrhagic complications1. Predominantly a pediatric disease, the age distribution of B-precursor and T-ALL follow distinct patterns. The highest incidence of B precursor leukemias is in children between the ages of 2 and 5, while T-ALL is more common in older children with a peak incidence at 9 years of age1,2. Importantly, younger children have better outcomes than older pediatric patients, and adult patients with ALL do less well compared to children1. Similarly, in adults, the AYA group (adolescents and young adults) have a better prognosis compared with older individuals1. Multiple factors contribute to these different outcomes, including age-association of favorable/unfavorable genetic categories, treatment intensity (better tolerated in children) and eligibility for therapy intensification with allogenic bone marrow transplantation1.
Effective treatment for ALL requires intensive chemotherapy which combines drugs with non-overlapping mechanisms of action1, followed by intensive outpatient post-remission therapy, and subsequent prolonged low-intensity maintenance chemotherapy aimed at preventing leukemia relapse. In addition, patients receive therapy targeting the central nervous system sanctuary site1. Tailored treatment incorporating tyrosine kinase inhibitors BCR-ABL1-positive cases, therapy intensification based on risk-associated genetic features and quantification of minimal residual disease have further improved ALL outcomes1,3. However, patients whose leukemia relapses typically show dismal clinical outcomes as result of chemotherapy resistance4,5.
Genomic profiling of matched diagnostic and relapsed ALL samples have identified specific mutations associated with chemotherapy resistance at relapse including genetic lesions in NT5C2 and PRPS1 genes linked with 6-mercaptopurine resistance6–8 and CREBBP related to resistance to glucocorticoids9. Moreover, clonal evolution and mutational signature analyses of support non-linear evolutionary pathways for disease progression and that chemotherapy induced mutations could shape the mutational landscape of relapse10–13. However, specific mechanisms contributing to chemoresistance at relapse remain poorly understood, which limits the implementation of tailored therapeutic interventions for salvage therapy. To bridge this gap we dissected the mutational landscape of an extensive cohort of paired diagnostic and relapse samples from children and adults with B precursor and T-ALL and functionally explored gene-drug interactions via genome-wide CRISPR screens.
Mutational landscape of relapsed ALL
To gain further understanding of the mechanisms mediating escape from multiagent chemotherapy at relapse, we performed genome wide mutation analysis of matched diagnosis, germline (remission) and relapse DNA samples from a panel of 175 ALL patients (pediatric n=149 and adult n=26) treated with curative intent, using multi-agent chemotherapy combinations based on the Berlin-Frankfurt-Munster (BFM) backbone (Supplementary Table 1). This series included 129 B precursor ALL and 46 T-cell ALL cases analyzed by whole genome (n=105), whole exome (n=46) and combined whole genome and whole exome (n=24) sequencing (Supplementary Table 1).
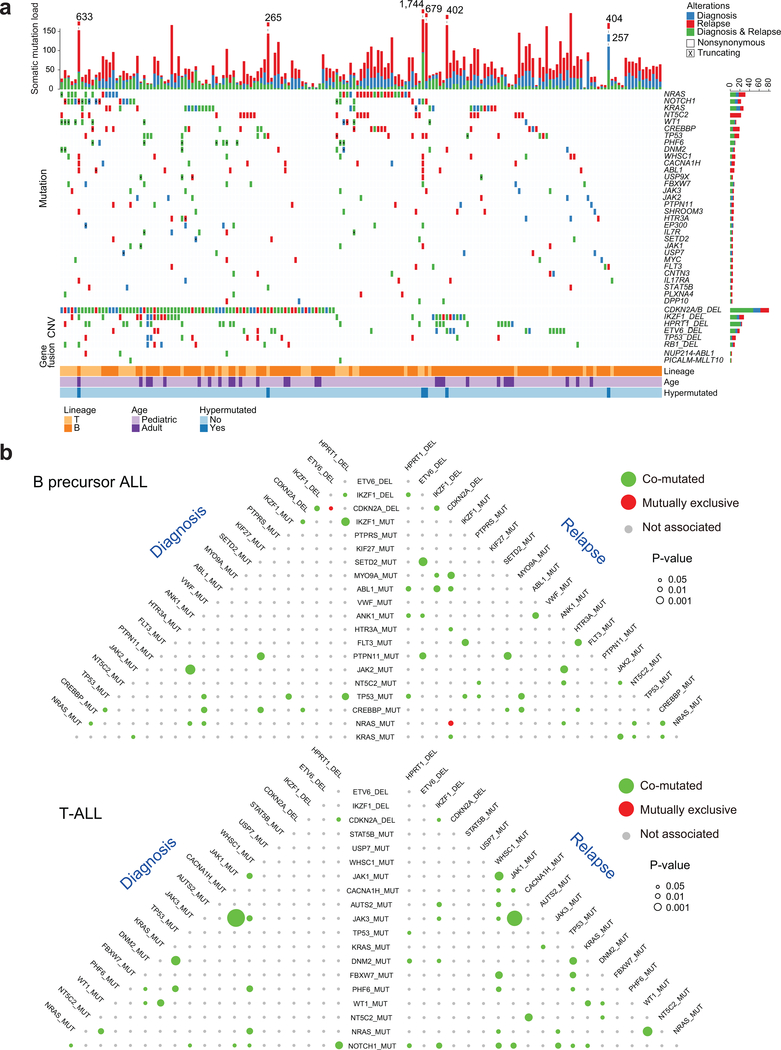
Somatic mutation variant calling identified a median of 27 coding mutations present in diagnostic samples and 34 mutations in relapsed leukemia DNAs (Fig. 1a, Extended Fig. 1 and Supplementary Table 2). Moreover, analysis of co-occurrence and exclusivity of mutations and copy number alterations pointed to numerous significant co-occurring genetic alterations in support of specific mechanistic interactions driving leukemic transformation and progression. In T-ALL we observed highly significant co-occurrence of JAK1 and JAK3 mutations both at diagnosis (P < 0.0001, hypergeometric test) and relapse (P = 6.13−6); as well as an association between WT1 and NRAS mutations (P = 5.54−4) and between JAK1 and WHSC1 mutations at relapse (P = 0.001) (Fig. 1b, 2a). Less prominent, but significant associations in B precursor ALL included a link between SETD2 mutations and ETV6 deletions (P = 0.001) and between NRAS and CREBBP mutations at relapse (P = 0.017). In addition we also observed a significant mutual exclusivity between NRAS mutations and CDKN2A deletions in relapse samples (P = 0.016) (Fig. 1b and Fig. 2a).
Figure 1 |. Somatic mutations in pediatric and adult relapsed ALL.
a, Distribution of mutations and copy number variations (CNVs) in selected genes in 175 paired diagnostic and relapse ALL samples. Colored boxes indicate the presence of mutations and CNVs in the indicated genes (rows) and samples (columns). Mutation type (nonsynonymous substitutions, or truncating mutation) and kind of sample (diagnosis vs. relapse) are color coded as indicated. DEL, deletion. Hypermutated samples include patient IDs (in order, left to right): 85, 18, 67, 169, 108, 153. b, Pyramid plots highlighting the correlation for co-mutated (green color) or mutually exclusive (red color) features in B-ALL. A hypergeometric test was performed for each pair of elements, considering diagnosis and relapse ALL samples separately. The size of each circle corresponds to the significance level of the correlation. Associations with P < 0.05 are colored.
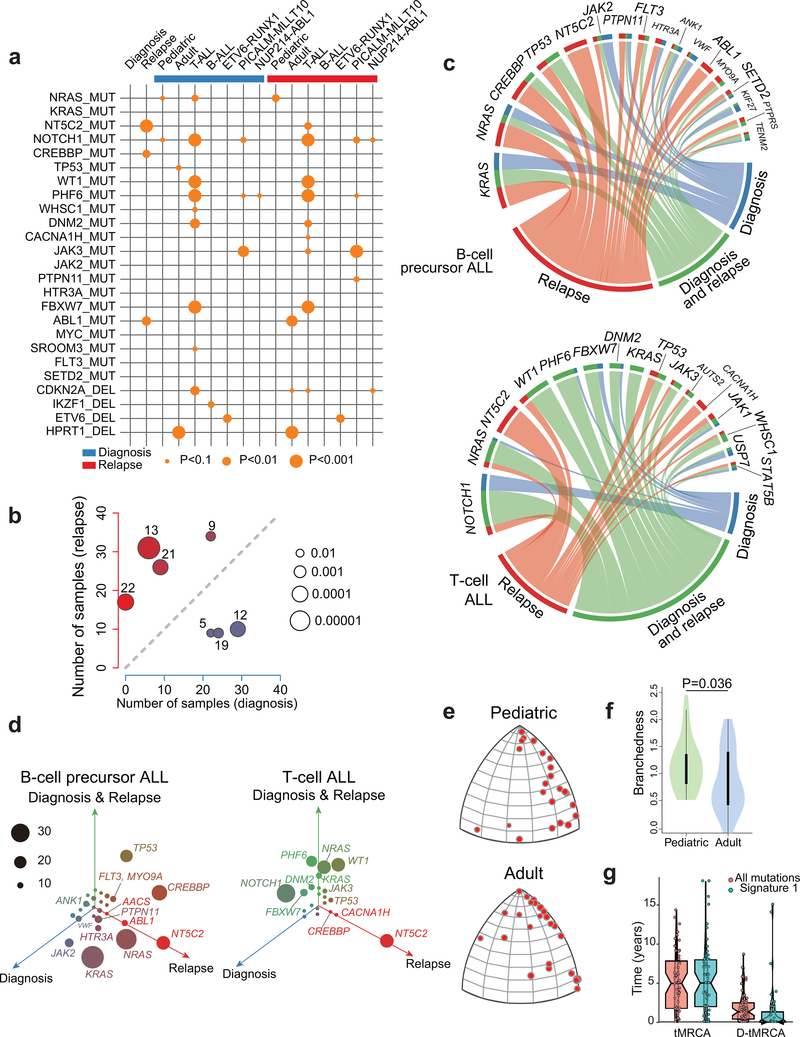
Figure 2 |. Mutational co-occurrence, signatures and clonal evolution of relapsed ALL.
a, Graphic representation of co-occurrence between pairs of patient age, genetic alterations and outcomes. Orange circles indicate co-occurrence and the size of each circle corresponds to the significance level of the correlation. b, Scatter plot representation of the number of samples with positive contribution across different mutation signatures in 46 diagnosis (blue; x-axis) versus relapse (red; y-axis) samples. c, Circos plot representation of the distribution of diagnosis-specific (blue), relapse-specific (red) and common diagnosis and relapse (green) mutations in selected recurrently mutated genes in B-cell precursor ALL and T-cell ALL. d, Three-dimensional bubble plot showing the frequency of diagnosis-only (blue; left axis), relapse-only (red; right axis), and common diagnosis and relapse (green; upper axis) somatic nonsynonymous mutations in B-cell precursor and T-cell ALL. e, CAT(0) projections of branched evolution in pediatric and adult patients. f, Violin plot indicating the branchedness of pediatric and adult patient trajectories. g, Left: distribution of the inferred age of Most Recent Common Ancestor (tMRCA) of the two dominant clones at diagnosis and relapse. Right: distribution of the number of years that the most recent common ancestor predated the diagnosis of the disease (D-tMRCA). Line of the notched boxplots represents the median. Lower and upper hinges represent the 25th and 75th percentiles respectively.
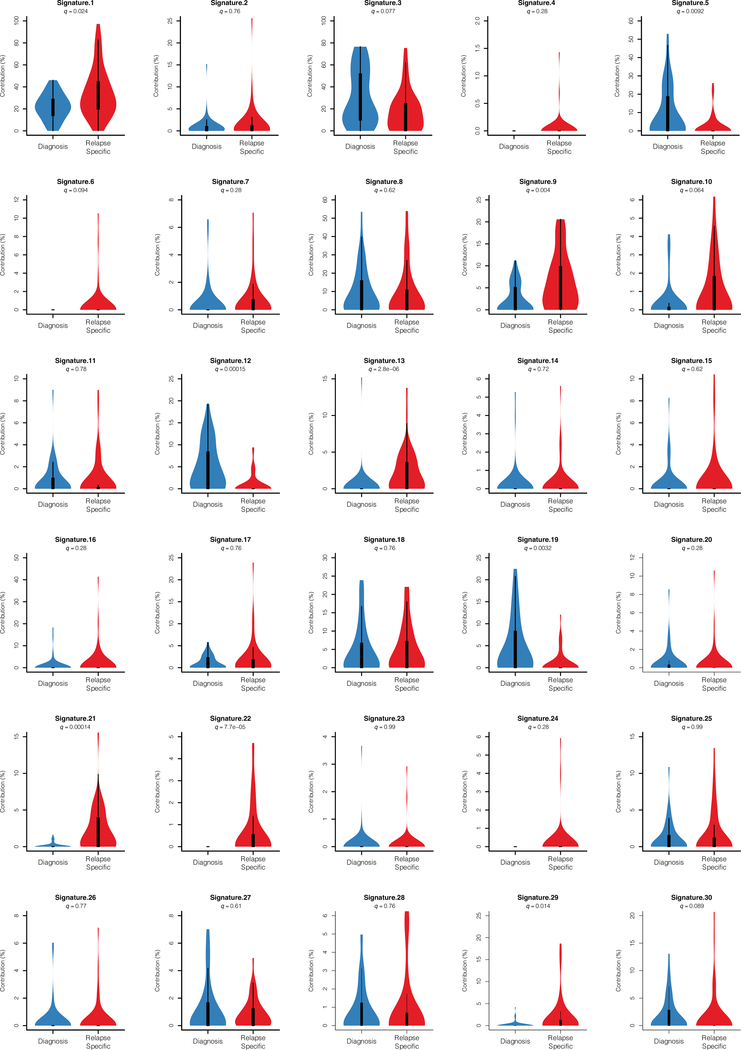
Despite the overall low mutation burden, some cases in this series showed a hyper-mutation phenotype with >100 coding somatic variants. Two cases had evidence of hypermutation both in the diagnostic and relapse samples; these were, one B precursor ALL harboring a mutation in ATR and one T-ALL mutated in MSH6. In addition, ten cases showed acquired hypermutation at relapse, 5 of which harbored mutations in mismatch DNA repair genes MSH2 (n=2) and MSH6 (n=3). Analyzing the 3 cases with relapse-associated hypermutation phenotype and available whole genome sequencing data, we found marked enrichment in mutational signatures associated with microsatellite instability (signature 21). Further inspection of mutational patterns in non-hypermutated samples revealed an overall enrichment of signatures associated with the activity of the mutagenic enzymes activation-induced cytidine deaminase (AID) and apolipoprotein B mRNA editing enzyme (APOBEC) (signatures 9 and 13), as well as increased contribution of microsatellite instability (signature 21) for relapse-specific somatic mutations compared with the genetic alterations present at diagnosis (Fig. 2b and Extended Figs. 2,3). In addition, we noted specifically at relapse the presence of mutations previously linked with aristolochic acid induced DNA adducts (signature 22) (Fig. 2b and Extended Figs. 2,3). In contrast, presentation specific mutations at diagnosis were characterized by an increased contribution of transcriptional strand biased T>C substitutions (signature 12) (Fig. 2b and Extended Figs. 2,3).
Out of 9,616 non-synonymous coding somatic mutations identified in total, 1,467 were present at diagnosis and relapse, 2,101 were present only at diagnosis and 6,048 mutations were observed only at the time of relapse. These alterations identified 186 highly confident recurrently mutated genes (Supplementary Table 3). Recurrent somatic mutations found at diagnosis included prominent known oncogenes and tumor suppressors including KRAS, NRAS, PTPN11, MYC, FLT3, JAK2, JAK3, STAT5B and CREBBP in B-cell precursor ALL, and NOTCH1, FBXW7, MYC, KRAS, NRAS, PTPN11, PHF6, DNM2, STAT5B, WT1, JAK1, JAK3, BCL11B, TP53, CREBBP, RPL10, RUNX1 and CNOT3 in T-cell ALL9,12,14–21 (Fig. 1a,b, Fig. 2a,c,d and Extended Fig. 4). In addition, we identified recurrent somatic mutations in NT5C2, CREBBP, TP53, WHSC1, ABL1, FLT3, USP9X, CNTN3, PLXNA4, AUTS2, MED12, ODZ3 and CDKN2A occurring exclusively or preferentially at the time of relapse (Fig. 1a,b, Fig. 2a,c,d and Extended Fig. 4). A notable characteristic of these results is the limited number of mutations in TP53 found in our relapsed ALL samples, which is in sharp contrast with early historical reports, which described a high frequency (~28%) of TP53 mutations in relapsed ALL samples22,23. This observation supports that currently used therapies may have improved capacity to eliminate subclonal TP53 mutations, a hypothesis consistent with the improved outcomes of modern chemotherapy protocols.
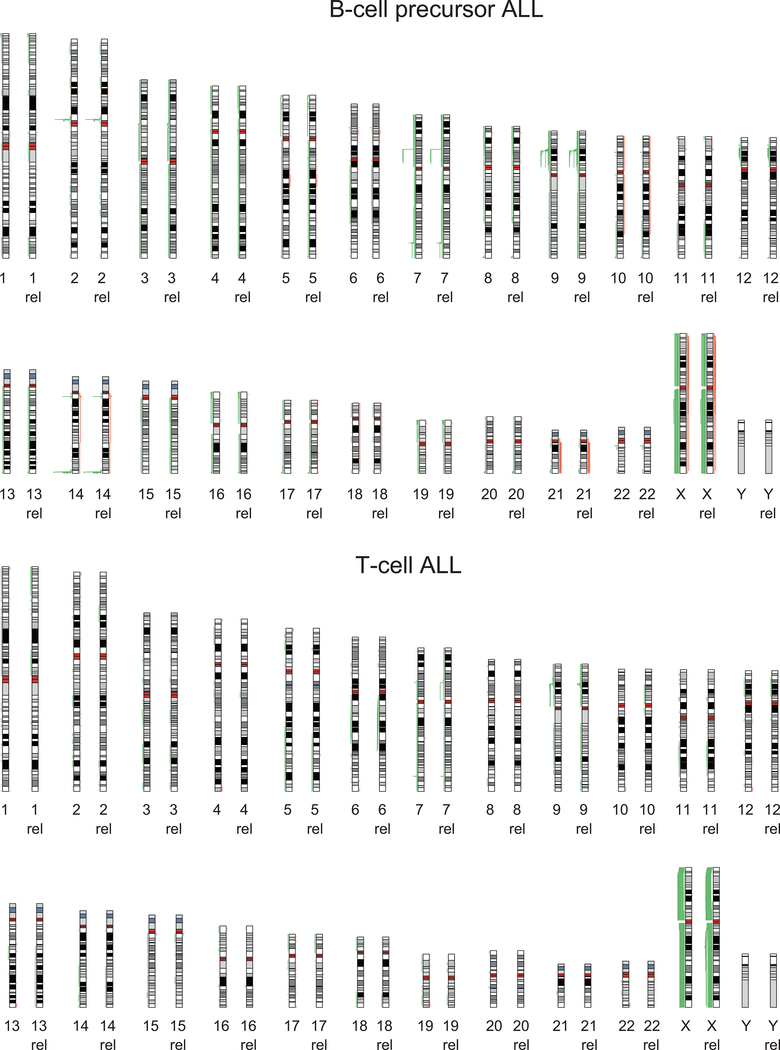
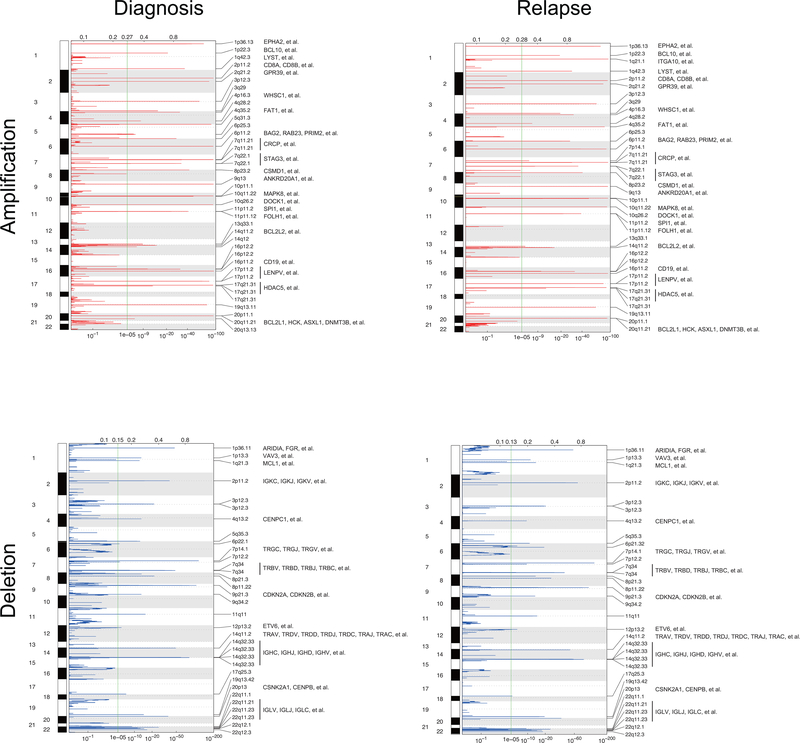
Single nucleotide polymorphism array analyses (n=54) and whole genome and exome sequencing-based analysis (n=95) of somatic copy number variants (CNVs) identified an average of 18 somatic CNVs per sample for a total of 6,475 alterations in our series. Of these, 3,589 CNVs were detected at diagnosis and 2,876 at the time of relapse, with 2,575 variants present in both diagnostic and relapsed samples (Extended Fig. 5 and Supplementary Table 4). Genomic Identification of Significant Targets in Cancer (GISTIC) analysis identified 116 recurrent focal areas of deletion and 175 recurrent focally amplified regions at diagnosis (q-value < 10−5), 154 deletions and 184 amplifications at relapse (q-value < 10−5) (Extended Fig. 6). The most common recurrent somatic copy number alterations included most prominently deletions involving the CDKN2A and CDKN2B cell cycle tumor suppressor loci in the short arm of chromosome 9 present in 49/99 (49%) B-cell precursor and 31/41 (75%) T-cell ALL samples (Supplementary Tables 4 and 5). In addition, we identified deletions encompassing the CDKN1B (13/99; 13%) cell cycle inhibitor and B-cell differentiation factors –PAX5 (28/99; 28%), VPREB1 (10/99; 10%), ETV6 (18/99; 18%), and IKZF1 (24/99; 24%)– in B-cell precursor ALLs. While in T-cell ALLs we observed recurrent deletions encompassing the CDKN1B (2/41; 5%) and WT1 (4/41; 9%) tumor suppressor genes and focal microdeletions in the vicinity of the TAL1 locus (3/41; 7%), which are responsible for aberrant transcriptional activation of this transcription factor oncogene24 (Supplementary Tables 4 and 5). Finally, chimeric gene transcript analyses in 85 cases with available RNAseq data showed the presence of oncogenic gene transcripts including the oncogenic drivers PAX5-BCOR, PAX5-CBFA2T3, PAX5-ZCCHC7, MEF2D-BCL9, MEF2D-HNRNPUL1, NUP214-ABL1, TPR-JAK2, PICALM-MLLT10, ETV6-RUNX1, KMT2A-AFF1, BCR-ABL1, TCF3-HLF and TCF3-PBX1, as well as a potentially activating rearrangement between TBL1XR1 and JAK2 (Supplementary Table 6). In most cases, fusion oncogene transcripts were detected both at diagnosis and relapse with the exception of two cases positive only at relapse, one for PICALM-MLLT10 and the other for NUP214-ABL1 (Fig. 1a and Supplementary Table 6).
Clonal evolution mechanisms of relapse
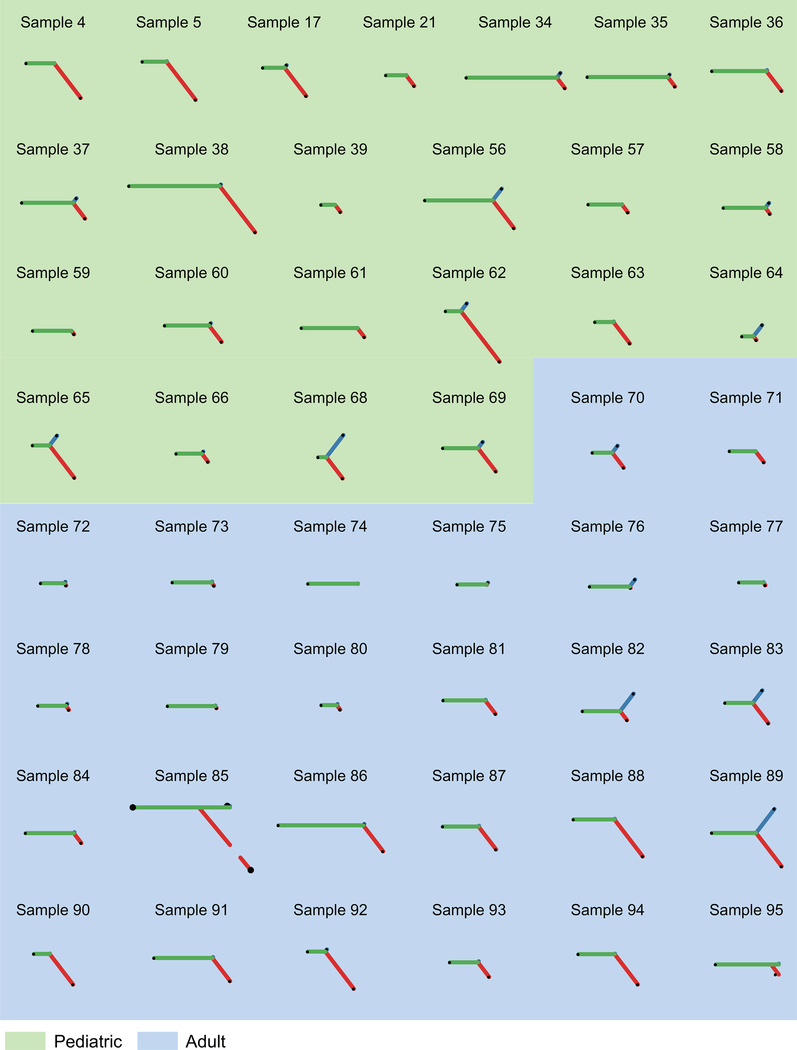
Copy number alterations25 and mutation data10–13 support a heterogeneous path of clonal evolution during ALL disease progression with some cases showing linear evolution, others presenting relapses originating from ancestral clones (missing some of the mutations present at diagnosis) and in some instances de novo leukemias emerging after a sustained complete remission. We reconstructed the molecular clonal history for each case in our cohort, represented by a specific phylogenetic tree that relate the genomic information of the dominant leukemia clones present at diagnosis and at relapse. Based on whole genome sequencing, 49/95 (52%) of the relapse samples contained most, but not all of the genetic lesions present in the major clone at diagnosis (Fig. 2e, f and Extended Fig. 7). In addition, we noticed a significantly higher level of branched evolution in pediatric ALL cases compared with adult leukemias indicative of a less distant divergence between diagnostic and relapsed populations in adults (P = 0.03, Wilcoxon rank-sum test). Overall, the number of relapsed specific mutations was significantly higher than the number of diagnostic specific variants (P < 1.67 10−8, Wilcoxon rank-sum test) (Fig 2e,f and Extended Fig. 7), which is consistent with the requirement of additional cell divisions for clonal expansion from the point of minimal residual disease to overt relapse, but also with our observation of mutational signatures suggestive of a potential increased mutation rate during disease progression. To disentangle these mechanisms, we specifically analyzed molecular clock signature 1 mutations, which result from endogenous mutational processes initiated by spontaneous deamination of 5-methylcytosine. Consistent with the fetal origin of many pediatric ALLs with founder chromosomal rearrangements already present at birth26, both the total number of mutations and signature 1 mutations correlate with age at diagnosis27 allowing us to infer a case specific mutational rate and to establish that the most recent common ancestor (MRCA) between the clone at diagnosis and relapse often develops early and several years before the leukemia is clinically diagnosed (Fig. 2g).
Chemotherapy treatment represents a major selective force and imposes a strong genetic bottleneck in ALL shaping the mutational landscape of relapse (Fig. 1a,b and Fig. 2a,c,d)6,8,13. In this context, we detected numerous genes with recurrent relapsed-associated alterations (no lost events in the relapse clone) (Fig. 2c,d, Extended Fig. 4 and Supplementary Table 3). Relapse-associated genetic lesions implicated in chemotherapy resistance included most prominently relapse-specific gain-of-function mutations in NT5C2 (22/175, 12%)6,7. In addition, mutations in the SETD2 histone 3 lysine 36 trimethyltransferase gene previously implicated in resistance to DNA-damaging agents28 were found in 4/175 (2.3%) of relapsed ALL samples, while mutations in the glucocorticoid receptor NR3C1 and epigenetic regulator genes WHSC129 and CREBBP9 also linked with resistance to glucocorticoids were present in 2/175 (1%), 8/175 (4.6%) and 17/175 (9.7%) of relapsed cases, respectively. TP53 mutations at presentation were more frequent in adults (4/26) than pediatric (5/149) cases (Fisher’s exact text P = 0.029). For cases with TP53 at presentation who relapsed, the same mutation was invariably in the relapse sample. In addition, 1/22 adult and 7/144 pediatric leukemias with wild type TP53 at diagnosis relapsed with TP53-mutant disease. Moreover, WT1 mutations, which have been proposed to blunt activation of TP53-induced transcriptional programs in T-ALL30 were found in 11/175 (6.2%) of relapsed cases. Furthermore, we also noted the presence of tyrosine kinase inhibitor resistance-driving mutations in ABL131 in 6 relapsed BCR-ABL1 positive ALLs that had been treated with kinase inhibitor-including regimens.
Detailed analysis of the mutations accrued from diagnosis to relapse showed strong positive selection of resistance driving genetic lesions, which were uniformly present both at diagnosis and relapse or acquired at the time of relapse (Fig. 1a,b and Fig. 2a,c,d). NT5C2 and ABL1 mutations were selectively acquired at relapse consistent with their specific role in therapy resistance. In contrast, most other genetic alterations associated with relapse were present also at diagnosis. Interestingly, activating mutations in the NRAS and KRAS oncogenes were primarily early events in T-ALL and showed a more heterogeneous distribution in B-precursor ALL with some cases showing RAS mutations as early events detected both in diagnosis and relapse clones, and others showing them as later events present only in the relapsed sample (Fisher’s exact text P = 0.0009).
Genome-wide mapping of drug-gene interactions shaping therapy response
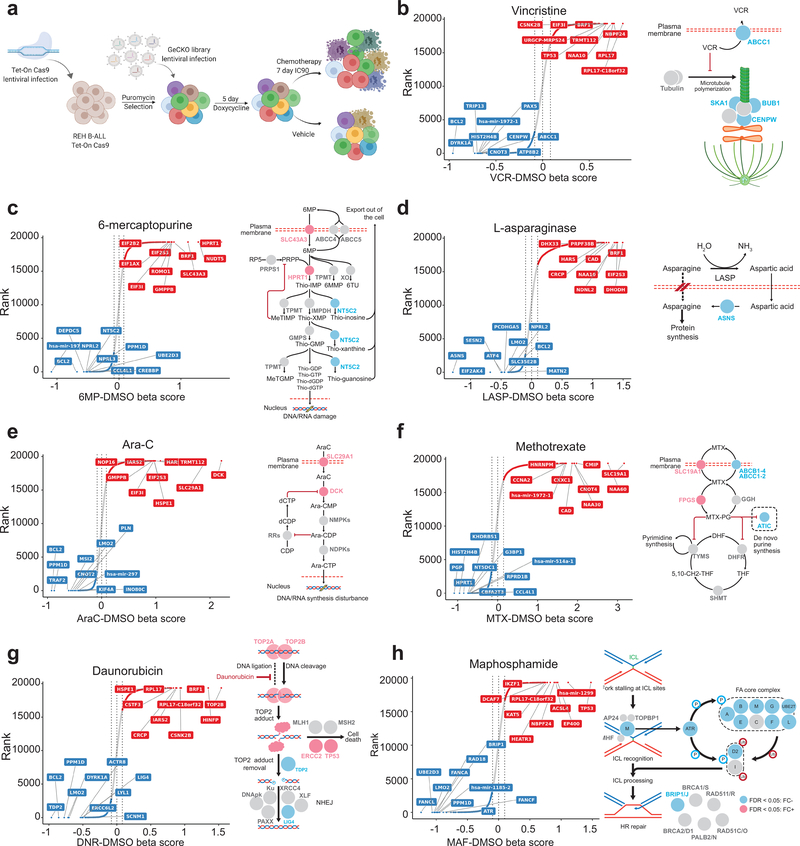
Despite the clear signal for positive selection of some resistance driver mutations at relapse, relapsed leukemias are largely heterogeneous and the importance and mechanism of most mutations present at relapse remains unknown. To better functionalize the landscape of relapse-associated mutations, we undertook a genome-wide forward genetics screen strategy to identify drug-gene interactions across all major chemotherapy drugs (vincristine, 6-mercaptopurine, L-asparaginase, cytarabine (Ara-C), methotrexate, daunorubicin, and maphosphamide) used in the treatment of ALL in REH cells, a representative model B-precursor ALL cell line32 with competent TP53 activity(Fig. 3a).
Figure 3 |. Genome wide CRISPR analysis of chemotherapy-gene interactions.
a, Schematic illustration of inducible Genome-Scale CRISPR/Cas9 knock-out screening in REH B-precursor ALL cells. b-h, CRISPR screen results and schematic representation for drug-gene interactions across seven chemotherapy drugs. Genes are ranked based on the enrichment of their respective gRNAs compared to vehicle-treated controls. Red and blue circles in b-h indicate genes with enriched and depleted gRNAs (FDR < 0.05), respectively.
gRNAs whose inactivation increased vincristine sensitivity included the ATP Binding Cassette Subfamily C Member 1 (ABCC1), a known vincristine transporter33, but also ATPase Phospholipid Transporting 8B2 (ATP8B2), a factor not previously implicated in resistance to vincristine (Fig. 3b and Supplementary Table 7). Of note, multiple genes encoding mitotic factors including (TRIP13, HASPIN, CLASP1, ASPM, CENPW, PPP2R1A, DLGAP5, KIF15, PSRC1, UBE2C, BUB1, TUBB4B, MAPRE1, SKA1, ZWINT and MKI67) showed depletion of targeting gRNAs in support of a previously unrecognized sensitizing role for disruption of the mitotic machinery in conferring sensitivity to vincristine (Fig. 3b and Supplementary Table 7).
Analysis of resistance driving gRNAs enriched in cells treated with 6-MP (Fig. 3c and Supplementary Table 7), a thiopurine antimetabolite, verified the requirement of Hypoxanthine Phosphoribosyltransferase 1 (HPRT1), an enzyme mediating 6-MP activation via the salvage pathway of purine biosynthesis and Solute Carrier Family 43 Member 3 (SLC43A3), a membrane transporter mediating the incorporation of 6-MP into the cell34, for 6-MP incorporation and cytotoxic activity. Interestingly, gRNAs targeting NUDT15, an enzyme involved in the clearance of intracellular thiopurine nucleotides35, were negatively selected in this screen, in support of a role for this enzyme as a novel therapeutic target to enhance the effects of 6-MP therapy (Fig. 3c and Supplementary Table 7). Surprisingly, we also observed here depletion of NT5C2 targeting gRNAs in REH cells, which are NT5C2 wild type (Fig. 3c and Supplementary Table 7). This result suggests a previously unappreciated role of wild type NT5C2 in the clearance of thiopurine monophosphate nucleotides, and as a potential target for therapy in ALL.
Genes whose inactivation promoted increased response to L-asparaginase included Asparagine Synthetase (ASNS), which mediates the conversion of aspartate and glutamine to asparagine and glutamate (Fig. 3d and Supplementary Table 7). In addition, we also observed negative selection of gRNAs targeting Glutamate-Ammonia Ligase (GLUL), a glutamine synthetase that catalyzes the ATP-dependent conversion of glutamate and ammonia to glutamine, suggesting an unanticipated functional role for glutamine synthesis in supporting asparagine levels in leukemia lymphoblasts (Fig. 3d and Supplementary Table 7). L-asparaginase sensitivity was also enhanced by gRNAs targeting Eukaryotic Translation Initiation Factor 2 Alpha Kinase 4 (EIF2AK4), a signaling factor responsible for blocking translation via phosphorylation of the alpha subunit of eukaryotic translation initiation factor-2 (EIF2) in response to asparagine deprivation36,37 (Fig. 3d and Supplementary Table 7).
Selection with Ara-C, a cytotoxic pyrimidine, resulted in positive selection of Deoxycytidine Kinase (DCK), which mediates metabolic activation of this drug and Solute Carrier Family 29 Member 1 (SLC29A1), which mediates cellular import of Ara-C38 (Fig. 3e and Supplementary Table 7).
gRNAs driving resistance to the antifolate drug methotrexate included Solute Carrier Family 19 Member 1 (SLC19A1), which mediates cellular methotrexate uptake39, and folylpolyglutamate synthase (FPGS), a major determinant of active intracellular methotrexate polyglutamate levels, recurrently mutated in relapsed ALL10 (Fig. 3f and Supplementary Table 7). In contrast, gRNAs against dihydrofolate reductase (DHFR), the target enzyme inhibited by methotrexate, as well as downstream enzymes in the salvage (HPRT1) and de novo purine biosynthesis (ATIC and PRPS1) pathways were negatively selected following treatment with this antifolate (Fig. 3f and Supplementary Table 7).
For daunorubicin, which stabilizes topoisomerase II induced DNA double strand breaks, gRNAs targeting DNA Topoisomerase II Beta (TOP2B) and DNA Topoisomerase II Alpha (TOP2A) induced resistance to treatment (Fig. 3g and Supplementary Table 7). This finding is consistent with a direct role of topoisomerase–DNA cleavage complexes in mediating anthracycline induced DNA damage and the antitumor effects of daunorubicin40. In concert, multiple genes encoding factors involved in non-homologous end joining and homologous recombination double strand DNA break repair (LIG4, PRKDC, ERCC6L2, NHEJ1, SFR1, UIMC1, BRE, RAD54L2, PRKDC, ERCC6L2 and PAXX) were also negatively selected following daunorubicin treatment, further supporting a critical role for DNA repair mechanisms in resolving DNA breaks induced by this drug (Fig. 3g and Supplementary Table 7). In contrast, we observed that gRNAs against Tyrosyl-DNA Phosphodiesterase 2 (TDP2) and zinc finger protein 451 (ZNF451), which mediate resolution of topoisomerase 2 DNA-protein cross-links41, increased daunorubicin sensitivity (Fig. 3g and Supplementary Table 7), which speaks to a major role of DNA-protein adduct DNA lesions as drivers of anthracycline-induced genotoxic stress. These results place target availability, double strand DNA repair and clearance mechanisms of anthracycline induced DNA-protein adducts as important modulators of cellular response to daunorubicin.
In line with, but also differentially from our daunorubicin CRISPR screen results, treatment with maphosphamide induced negative selection of gRNAs specifically targeting prominent genes involved in DNA inter-strand crosslink recognition and repair (Fig. 3h and Supplementary Table 7) including Fanconi factors FANCA, FANCB, FANCD2, FANCE, FANCF, FANCG, BRIP1/FANCJ, FANCL and FANCM; Fanconi associated proteins APITD1/FAAP16, C1orf86/FAAP20 and C19orf40/FAAP24; and additional DNA damage repair proteins such as EXO1, XPA, ERCC1, RANBP9, ERCC5, RAD1, RAD18, UBE2D3 and ATR.
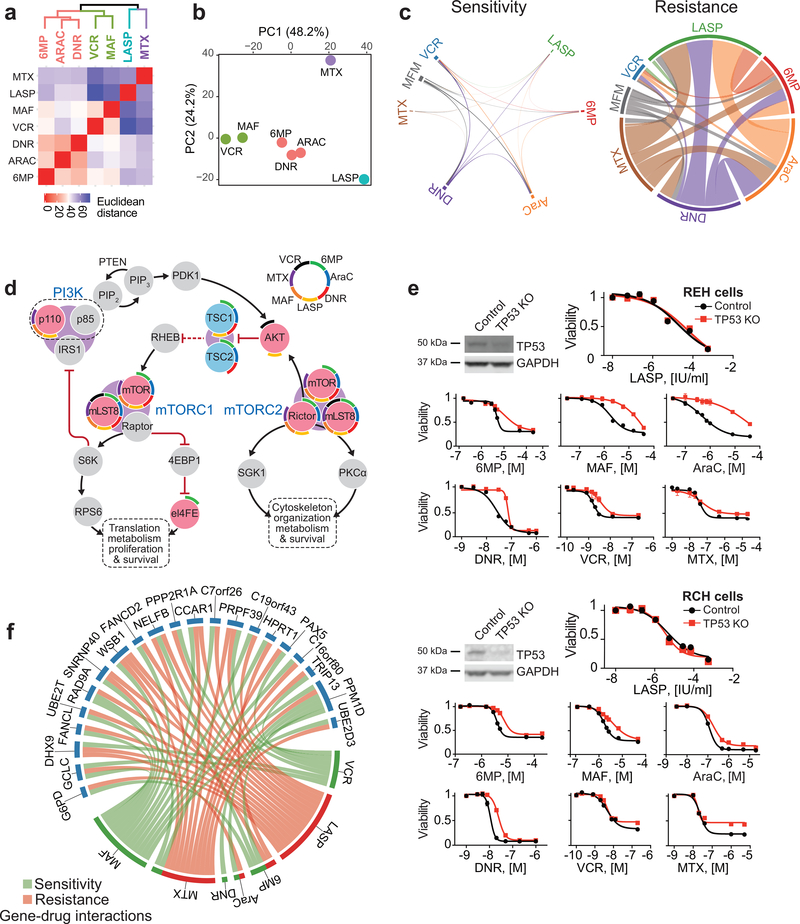
Beyond the individual effects of each chemotherapeutic drug used, global analysis of the relationship of gene-drug interactions across chemotherapy showed clustering of 6-MP, Ara-C and daunorubicin based on their pattern of enriched and depleted gRNAs; a separate grouping of cells treated with vincristine and maphosphamide; and markedly distinct patterns of positively and negatively selected gene-gRNA sets for methotrexate and L-asparaginase (Fig. 4a,b). These results suggest a potential functional overlap on the cellular mechanisms mediating the activity of nucleoside/nucleotide analogs (6-MP, Ara-C) and topoisomerase inhibitors (daunorubicin), and of drugs interfering with tubulin polymerization (vincristine) and alkylating agents (maphosphamide). Moreover, the distinctive pattern of gene-drug interactions of L-asparaginase and methotrexate supports that their antileukemic effects are largely distinct from other chemotherapy drugs. Of note, our genome wide CRISPR screens identified a limited number of genes-gRNA sets negatively selected across multiple treatments and a much broader number of gRNAs impairing the effects of multiple therapeutic agents (Fig. 4c and Supplementary Table 7). Among these, we observed positive selection of multiple genes encoding essential factors involved in cell growth with a prominent representation of mediators of protein biosynthesis including components of mTOR signaling (Fig 4d), but also RNA polymerase I, II and III complexes, RNA maturation machinery, ribosomal biogenesis factors and translation regulators (Supplementary Table 7). This finding is in agreement with a proposed role for metabolically quiescent less-proliferative populations as contributors to cancer disease persistence and relapse42. In addition, Ikaros (IKZF1) mutations are associated with chemoresistance and poor prognosis in B-precursor ALL and IKZF1 targeting gRNAs were enriched in cells treated with L-asparaginase (log fold change = 0.72; Fig. 3d), methotrexate (log fold change = 0.64; Fig. 3f), maphosphamide (log fold change = 0.93; Fig. 3h), and to some extent with Ara-C (log fold change = 0.28; Fig. 3e) (Supplementary Table 7). Moreover, TP53 targeting gRNAs were strongly positively enriched in REH cells treated with vincristine (log fold change = 0.93; Fig. 3b), daunorubicin (log fold change = 0.93; Fig. 3g), and maphosphamide (log fold change = 2.1; Fig. 3h) and, albeit more modestly, with 6 mercaptopurine (log fold change = 0.49; Fig. 3c) and Ara-C (log fold change = 0.66; Fig. 3e) (Supplementary Table 7) but showed limited selection with methotrexate (log fold change = 0.23; Fig. 3f) and no clear enrichment in cells treated with L-asparaginase (Fig. 3d and Supplementary Table 7). Consistently, TP53 CRISPR knockout REH and RCH ALL cells showed broad resistance to chemotherapy with retained sensitivity to L-asparaginase (Fig. 4e).
Figure 4 |. Convergent and divergent gene-chemotherapy drug interactions.
a, Hierarchical cluster analysis of gene-drug interactions from genome-wide CRISPR screens in REH cells treated with different chemotherapy drugs. b, Principal component analysis (PCA) of gene-drug interactions as in a. Each drug feature is plotted based on the top contributing genes to each of the first 2 principle components. Genes with enrichment (positive or negative) greater than 0.5 log fold-change and false discovery rate less than 5% were used in these analyses. c, Circos plot representation of overlapping genes with gRNAs enriched and depleted across different chemotherapy selection-based CRISPR screens. d, Schematic representation of PI3K-mTOR pathway drug-gene interactions identified in genome wide CRISPR screens. Red and blue circles in indicate genes with enriched and depleted gRNAs (FDR < 0.05), respectively. Drug interactions for each gene are in colored arch segments as indicated. e, Western blot analysis of TP53 inactivation and in vitro analyses of the antileukemic responses of REH and RCH control and CRISPR TP53 knockout cells treated with chemotherapy drugs. f, Circos plot representation of genes with divergent gRNA selection profiles across CRISPR screens with different chemotherapeutic drugs. Green links indicate sensitivity; red links indicate resistance. 6-MP: 6-mercaptopurine; AraC: cytarabine; MTX: methotrexate; LASP: L-asparaginase, DNR: daunorubicin; VCR: vincristine; MAF: maphosphamide; (S): drug-sensitizing; (R): drug resistance. Graphs indicate relative cell viability compared to vehicle treated controls.
Cross analysis of the compendium of mutations identified in our series and in previously reported cohorts10,43 with genome-wide CRISPR screen gene-drug interactions related to chemoresistance in REH cells revealed 355 mutated genes potentially involved in resistance to therapy (Supplementary Table 8). Among those it is worth noting the presence of recurrent mutations in TP53, IKZF1, DNM2, SETD2, MED12 and USP9X, genes potentially related to resistance to multiple drugs. In addition, we found a significant number of mutant genes involved in cell growth related pathways including protein biosynthesis (Benjamini P = 1.2 1012), mRNA processing (Benjamini P =9.4 10−14), transcription (Benjamini P =9.1 10−8) and cell cycle (Benjamini P =2.4 10−10) (Supplementary Table 8). Mutated genes with gRNAs selected for specific drugs included SLC19A1 –related to methotrexate chemotherapy– and SLC43A3 and HPRT1 –related to resistance to 6-MP. In addition, and as mentioned before gRNAs for NT5C2 were negatively selected in cells treated with 6-MP related to thiopurine resistance induced by gain of function mutations in this cytosolic nucleotidase. These results support that the broad genetic heterogeneity of relapsed ALL is related to the multiplicity of genes and pathways that can be engaged to reduce the efficacy of multiagent chemotherapy and contribute to disease recurrence.
In this context, and most importantly, we noticed that CRISPR inactivation of particular genes induced cellular resistance to some chemotherapy drugs, while enhancing the cytotoxic effects of some others (Fig. 4f). This observation may imply that the success of modern ALL combination therapies in preventing the occurrence of relapse originates at least in part from the selective eradication, via targeting of collateral genetic vulnerabilities induced by resistance driver-mutations, of single-drug resistant clones. As an example, HPRT1 inactivating gRNAs, which ablate the salvage pathway of purine biosynthesis, induce resistance to 6-MP, but cause synthetic lethality to inhibition of de novo nucleotide biosynthesis with methotrexate (Fig. 3c and Supplementary Table 7). Importantly, the maintenance phase of ALL therapy combines 6-MP and methotrexate, and consistently, we observed that HPRT1 mutations appear only rarely at relapse (Fig. 1a, Extended Fig. 1 and Supplementary Tables 3 and 8). In all, these findings suggest that cytotoxic agents and empirical combination chemotherapies, often regarded as a broad-brush and non-specific therapeutic approach, may actually leverage unforeseen incompatibilities in the gene-drug interaction space to create genetic bottlenecks that limit the selection of resistance-driving mutations and the emergence of relapse-initiating leukemic clones.
Targeting genetic vulnerabilities overcomes drug resistance at relapse
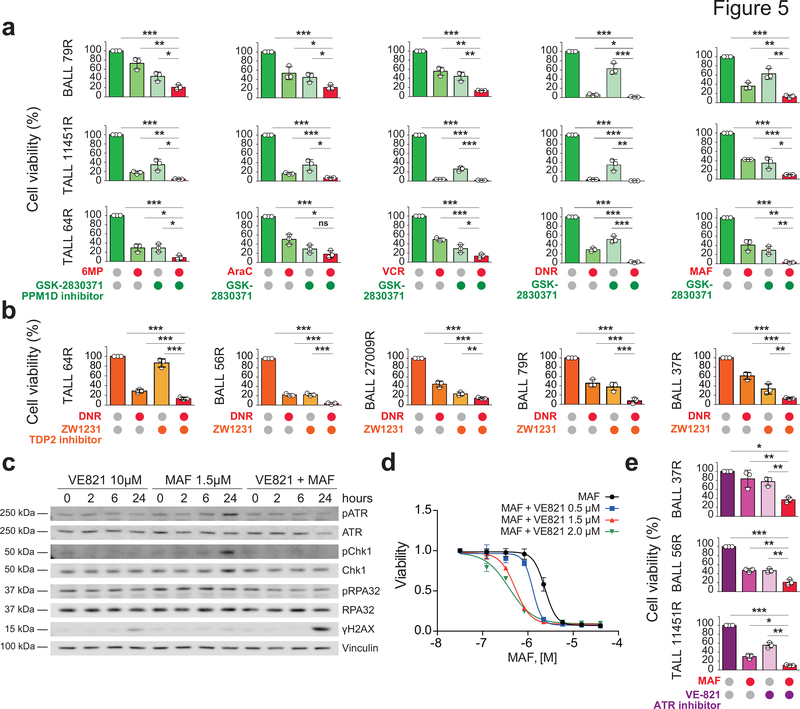
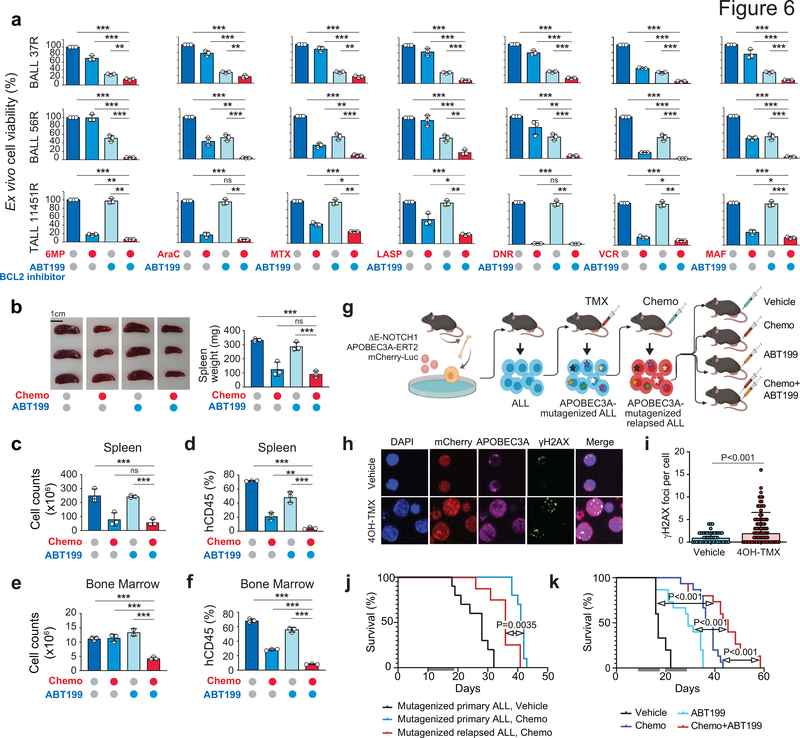
Among the numerous drug-gene interactions identified in our screens those involving multiple chemotherapeutic agents could be of particularrelevance in the context of combination chemotherapy treatments. Among these, gRNAs for Protein Phosphatase, Mg2+/Mn2+ Dependent 1D (PPM1D), which encodes a phosphatase mediating negative feedback regulation of p38-p53 signaling and suppression of stress-induced apoptosis, were negatively selected in cells treated with vincristine, 6-MP, Ara-C, daunorubicin and maphosphamide (Fig. 3b,c,e,g,h and Supplementary Table 7). Consistently, GSK280371, a PPM1D inhibitor, enhanced the antileukemic effects of chemotherapy in relapsed-leukemia xenograft samples ex vivo (Fig. 5a). Consistent with increased daunorubicin sensitivity by gRNAs targeting TDP2, which encodes an enzyme involved in the excision of topoisomerase II-DNA adducts (Fig. 3g), ex vivo treatment with ZW1231, a highly active deazaflavin TDP2 inhibitor (compound 11e44), resulted in increased response to daunorubicin in relapsed-leukemia xenograft cells (Fig. 5b). Similarly, the observed increased sensitivity to maphosphamide in cells with gRNAS targeting the ATR kinase and DNA inter-strand crosslink recognition and repair factors (Fig. 3h and Supplementary Table 7) prompted us to test the effects of VE821, a small molecule ATR inhibitor in combination with chemotherapy. In vitro treatment of REH cells with VE821 abrogated chemotherapy-induced ATR phosphorylation leading to increased DNA damage as determined by accumulation of γH2AX and consequently increased response to therapy (Fig. 5c,d). Moreover, ex vivo ATR inhibitor treatment increased the response of relapsed leukemia xenograft cells to maphosphamide (Fig. 5e). Finally, and with direct therapeutic significance, the antiapototic factor BCL2 scored broadly in our CRISPR screens as a common target whose inhibition could enhance the response to vincristine, 6-MP, L-asparaginase, Ara-C, daunorubicin and maphosphamide, (Fig. 3b–e,g,h and Supplementary Table 7). In agreement, and in line with some clinical reports45–47, ex vivo treatment with ABT199, a BCL2 inhibitor, enhanced the antitumor effects of chemotherapy against relapsed-ALL primary xenograft cells (Fig. 6a). Moreover, in vivo treatment of a relapsed leukemia-derived ALL xenograft showed enhanced therapeutic efficacy in mice treated with ABT199 plus an induction-like combination chemotherapy (dexamethasone, vincristine, L-asparaginase) as evidenced by markedly reduced numbers of human ALL lymphoblasts in the spleen (Fig. 6b–d) and bone marrow (Fig. 6e–f). Finally, given the results of our whole genome sequencing, which pointed to branched clonal evolution and ongoing mutagenesis as a relevant mechanisms conductive to relapse, we tested this therapy in a ΔE-NOTCH1-APOBEC3A-ERT2 mouse model of ALL that incorporates genetic diversification and chemotherapy selection of resistance traits (Fig. 6g). In basal conditions, ΔE-NOTCH1-APOBEC3A-ERT2 lymphoblasts showe cytoplasmic localization of APOBEC3A and low levels of the DNA damage marker γH2AX (Fig. 6h,i), while treatment with tamoxifen resulted in translocation of the APOBEC3A to the nucleus and induction of DNA damage (Fig. 6h,i). Using this model we generated a genetically diversified tumor population and selected for chemoresistance phenotypes after combinatorial chemotherapy (dexamethasone, vincristine, L-asparaginase) collecting tumor cells at relapse (Fig. 6g,j). In this setting, in vivo treatment of relapsed ΔE-NOTCH1 APOBEC3A-ERT2 leukemia- bearing mice with ABT199 plus induction-like combination chemotherapy overcame this trait and induced prolonged survival compared with vehicle, chemotherapy and ABT199-only treatment groups (Fig. 6k). In all, our experimental therapeutics results support a role for targeting effectors of chemoresistance and collateral vulnerabilities in combination with chemotherapy as salvage treatment for relapsed ALL.
Figure 5 |. Therapeutic targeting of chemotherapy resistance.
a, Response of ALL patient-derived xenografts treated ex vivo with different chemotherapeutic drugs in combination with the GSK2830371 PPM1D inhibitor. b, Response of ALL patient-derived xenografts treated ex vivo with daunorubicin (DNR) as a single-agent or in combination with the ZW1231 TDP2 inhibitor. c, Western analysis of DNA damage and response markers in REH cells treated with the VE821 ATR inhibitor and maphosphamide. d, Cell viability of REH cells treated with VE821 and maphosphamide alone and in combination. e, Response of ALL patient-derived xenografts treated ex vivo with VE821 and maphosphamide as single agents and in combination. Bars in a, b and e and curves in d indicate relative cell viability compared with vehicle treated controls.
Figure 6 |. Reversal of chemotherapy resistance by BCL2 inhibition.
a, Response of ALL patient-derived xenografts treated ex vivo with different chemotherapeutic drugs in combination with ABT199. Bars indicate relative cell viability compared with vehicle treated controls. b-f, Response of B-ALL 37R patient-derived xenografts treated in vivo with vehicle, single-agent ABT199, combinatorial chemotherapy or ABT199 with combinatorial chemotherapy. Panel b shows spleens following acute treatment and the quantification of spleen weights represented as bar graphs. Bars in c show spleen cell counts, while bars in d represent the percentage of human-CD45+ cells in the spleen following the indicated treatment arm. Bars in e show femoral bone marrow cell counts, while bars in f represent the percentage of human-CD45+ cells in the bone marrow following the indicated treatment arm. g, Schematic representation of the generation and experimental therapeutic treatment of a APOBEC3A-mutagenized relapsed ALL mouse model and experimental therapeutics. h, Immunofluorescence analysis of APOBEC3A subcellular localization and DNA damage (γH2AX) in vehicle and 4OH-tamoxifen (4OH-TMX)-treated ΔE-NOTCH1 APOBEC3A-ERT2 ALL cells. i, Quantification of γH2AX foci in vehicle and 4OH-TMX-treated ΔE-NOTCH1 APOBEC3A-ERT2 ALL cells. j, Survival curves of mice bearing ΔE-NOTCH1 APOBEC3A-ERT2-mutagenized allografts treated with either vehicle (black) or combinatorial chemotherapy (survival in chemotherapy treated primary tumor in blue, survival in chemotherapy treated relapsed tumor in red). Gray bars indicate the duration of treatment. k, Survival curves of mice bearing APOBEC3A-ERT2-mutagenized relapsed allografts treated with either vehicle, single-agent ABT199, combinatorial chemotherapy or ABT199 plus combinatorial chemotherapy. Gray bars indicated the duration of treatment.
Discussion
Induction therapy for newly diagnosed ALL consists of acute highly intensive treatment combining drugs with different mechanisms of action, which together induce strong antitumor effects and more profound responses than single agent therapies. Modern chemotherapy protocols homogeneously include therapy with vincristine, anthracyclines, L-asparaginase and glucocorticoids plus cyclophosphamide, and/or high doses of methotrexate or cytarabine in high-risk cases1. In addition, maintenance post-remission therapy relies on sustained treatment with low dose 6-mercaptopurine, complemented with pulses of glucocorticoids and methotrexate1. This complex therapy regimen is designed to curtail the incidence of relapse by targeting multiple tumor vulnerabilities simultaneously and sequentially. In this context, drivers of leukemia relapse likely involve the persistence of rare quiescent and intrinsically chemoresistant leukemia cells with self-renewal capacity48; safe-haven microenvironment niches offering protection from the effects of chemotherapy49, and genetic and epigenetic heterogeneity resulting in the Darwinian selection of features associated with chemotherapy resistance6,7,50.
Whole genome sequencing results in our series uphold and extend previous studies pointing to the presence of broad genetic heterogeneity as a dominant feature of relapsed ALL6–13,43,51–53. In addition, mutational landscape, clonal evolution patterns and mutational mechanism analyses powered by whole genome data support a dynamic and complex picture of drug-gene interactions as drivers of disease progression. In particular, the presence of hypermutator phenotypes at relapse indicates that increased genetic heterogeneity may favor escape from therapy. We observed an enrichment of microsatellite instability-related mutational signatures and signatures associated with the activity of AID and APOBEC mutagenic enzymes in relapse-specific mutations in support of a role for these mutagenic mechanisms as drivers of genetic diversification conductive of disease progression and relapse. However, defects in DNA mismatch repair underlying microsatellite instability can impair the efficacy of thiopurine chemotherapy54,55, arguing that functional defects involving this specific DNA repair mechanism may also contribute to relapse by directly interfering with the activity of 6-MP. Across these analyses we did not recognize chemotherapy-induced mutational signatures10,56, suggesting that these may account for a small fraction of the mutational burden of leukemias at relapse.
The high prevalence of branched clonal evolution as a common feature of relapsed leukemia supports a central role for preexisting chemo-resistant clones as the original seed of relapse11. In this scenario, selection for resistance-driver features could result from clonal competition between leukemia subclones and the normal hematopoietic compartment early on in the natural history of the disease, or alternatively, emerge as a late event during progression through clonal competition between different leukemia populations. Whole genome sequencing analyses across pediatric and adult ALL cases enabled the differential analysis of molecular clock-associated mutations to datestamp the time of the last common ancestor of the diagnostic and relapsed clones. Surprisingly, these analyses mark the divergence of diagnosis and relapse populations to years before clinical presentation supporting the concept of clonal diversification during early stages of tumor initiation, at a time when clonal diversification is most probably shaped by selection under evolutionary pressures derived from the competition of early leukemia-originating cells with the normal hematopoietic system, in shaping the nature of the relapse originating cell11. Notably, we observed lower levels of branched clonal evolution in leukemias from adult patients compared with children, in line with higher levels of minimal residual disease and lower rates of complete remission57 indicative of a higher prevalence of primary drug resistance in ALL from adults.
The comprehensive genome-wide gene-drug interaction maps reported here show multiple resistance factors and genes whose inactivation increases drug activity, which in many cases are directly linked to the mechanism of action of these core chemotherapy drugs, validating this approach. Integrative analysis of mutational and drug-gene interaction screens reveals a heterogeneous resistance-associated mutational landscape with numerous low frequency mutations in genes involved in growth regulatory pathways, potentially contributing to resistance. In addition, analysis of CRISPR screen results across multiple drugs points to (i) highly stringent selection bottlenecks, and (ii) discordant gene-drug interactions across different drugs as emerging properties of multiagent chemotherapy that shape the mutational landscape of ALLs at relapse. Thus, our observation of broad chemo-resistance induced by TP53 inactivation is consistent with the role of this tumor suppressor gene as guardian of genomic integrity and mediator of apoptosis downstream of multiple stress signals. However, it is worth noting that REH and RCH ALL cell lines remained sensitive to L-asparaginase after TP53 knockout. A general corollary of these observations is that the combination of drugs with non-overlapping resistance mechanisms may enhance cure rates in ALL not only by providing enhanced cell killing in the dominant leukemia population at diagnosis, but by cross-targeting clones harboring drug escape-driving mutations. Secondly, integrative analysis of CRISPR screens highlights the presence of numerous discordant gene-drug interactions, with the same CRISPR gene inactivation inducing resistance to one drug and sensitivity to another. We propose that successful drug combinations empirically selected in clinical trials over the last four decades, exploit highly stringent and mechanistically rooted evolutionary bottlenecks to curtail the selection of resistant clones capable of driving leukemia relapse. An example could be the successful combination of 6-MP and methotrexate in maintenance therapy. As highlighted above, we observed that HPRT1 inactivation, which impairs the salvage purine biosynthesis pathway limits the activity of 6-MP but may also render HPRT1 mutant clones more readily targetable with methotrexate thus explaining why HPRT1, which is located in chromosome X and is an easy target for genetic inactivation, is rarely lost in ALL tumors at relapse. Therapeutically, the gene-drug interaction maps reported here identify multiple genes whose inactivation results in increased drug sensitivity, including numerous factors whose inactivation increase the activity of different chemotherapeutic agents. Among these, our proof of principle experimental therapeutics supports the expeditious testing in clinical trials of combination therapies including inhibitors targeting the anti-apoptotic machinery in the salvage therapy of ALL.
Methods
Patient samples.
DNA and leukemia lymphoblasts samples from ALL patients obtained at diagnosis, during remission and after relapse were provided by the Children’s Oncology Group and ECOG-ACRIN leukemia tissue banks; the Pediatric Oncology Division at Columbia University Medical Center; the Department of Hematology/Oncology at Saitama Children’s Medical Center; the Hemato-Oncology Laboratory at University of Padova; the Erasmus Medical Center-Sophia Children’s Hospital; Hospital Universitario Central de Asturias and the Department of Oncology/Hematology and Canada’s University Health Network. Informed consent was obtained at study entry and samples were collected under the supervision of local Institutional Review Boards for participating institutions and analyzed under the supervision of the Columbia University Medical Center Institutional Review Board (Protocol Number: IRB-AAAB3250) and in compliance with ethical regulations. We selected samples for whole exome and whole genome sequencing on the basis of the availability of sufficient DNA from diagnosis, remission and relapse samples including a subset of cases previously analyzed by exome sequencing in15.
Cells and cell culture procedures.
We performed cell culture in a humidified atmosphere at 37°C under 5% CO2. We purchased HEK293T cells from Genecopoeia and REH cells from Thermo Fisher Scientific and RCH cells from the Deutsche Sammlung von Mikroorganismen und Zellkulturen (DSMZ) cell bank. We grew HEK293T cells were in DMEM media supplemented with 10% fetal bovine serum (FBS), 100 U ml-1 penicillin G and 100 μg ml-1 streptomycin for up to two weeks and REH and RCH cells in RPMI-1640 media supplemented with 10% FBS, 100 U ml−1 penicillin G and 100 μg ml−1 streptomycin. Cell lines were regularly authenticated and tested for mycoplasma contamination. Primary human xenograft ALL cells were passaged and harvested from the spleens of NRG (NOD.Cg-Rag1tm1Mom/I2rgtm1Wjl/SzJ, Jackson Laboratory) mice and cultured in RPMI media supplemented with 20% FBS, 100 U ml−1 penicillin G, 100 μg ml−1 streptomycin and 10 ng ml−1 human IL-7.
Drugs and inhibitors.
Methotrexate hydrate (MTX), 6-mercaptopurine (6-MP), cytosine-D-arabinofuranoside (AraC), daunorubicin hydrochloride (DNR) and vincristine sulfate salt (VCR) were obtained from Sigma-Aldrich. Maphosfamide (MAF) was obtained from Santa Cruz Biotechnology. L-Asparaginase (LASP) was purchased from BioVendor. Venetoclax (ABT-199), VE-821 and GSK2830371 were purchased from Selleckchem. ZW1231 was synthesized and characterized by Zhengqiang Wang’s laboratory at University of Minnesota as described44. For in vitro assays L-Asparaginase was dissolved in water. All other drugs were dissolved in DMSO.
In vitro cell viability and chemotherapy response assays.
We measured cell viability and chemotherapy responses of human ALL cell lines in vitro by measurement of the metabolic reduction of the tetrazolium salt MTT using the Cell Proliferation Kit I (Roche) following the manufacturer’s instructions. We analyzed chemotherapy responses following 72 or 96 h incubation with increasing concentrations of chemotherapy drugs. We quantified cell viability and chemotherapy responses of patient-derived xenografts by flow cytometry using Cell Viability Kit with the liquid counting beads (BD Biosciences). We performed all experiments in triplicates. Ex vivo drug concentrations were optimized based on response of each patient derived xenograft. B-ALL 79R: 200 μM 6-MP, 0.2 μM Ara-C, 10 nM DNR, 5 nM VCR, 1 μM MAF, 30 μM GSK280371, 2 μM ZW1231. T-ALL 11451R: 200 μM 6-MP, 0.2 μM Ara-C, 10 μM MTX, 5 μg/mL L-Asp, 10 nM DNR, 5 nM VCR, 1 μM MAF, 30 μM GSK280371, 3 μM VE821, 0.1 μM ABT199. T-ALL 64R: 200 μM 6-MP, 0.2 μM Ara-C, 10 nM DNR, 5 nM VCR, 1 μM MAF, 30 μM GSK280371, 30 μM ZW1231. B-ALL 56R: 100 μM 6-MP, 0.1 μM Ara-C, 10 μM MTX, 1 μg/mL L-Asp, 5 nM DNR, 5 nM VCR, 1 μM MAF, 3 μM VE821, 0.1 μM ABT199 and in ZW1231 experiments – 10 nM DNR and 2 μM ZW1231. B-ALL 27009R: 10 nM DNR, 30 μM ZW1231. B-ALL 37R: 100 μM 6MP, 0.1 μM Ara-C, 10 μM MTX, 1 μg/mL L-Asp, 5 nM DNR, 5 nM VCR, 1 μM MAF, 2 μM VE821, 0.2 μM ABT199 and in ZW1231 experiments – 10 nM DNR and 2 μM ZW1231.
Mice and animal procedures.
We generated primary human leukemia xenografts by intravenous injection of cryopreserved leukemia lymphoblasts from diagnostic and relapsed acute lymphoblastic leukemia patient samples into immunodeficient NRG mice. All animals were maintained in specific pathogen-free facilities at the Irving Cancer Research Center at Columbia University Medical Center. The Columbia University Institutional Animal Care and Use Committee (IACUC) approved all animal procedures. Animal experiments were conducted in compliance with all relevant ethical regulations. Animals were euthanized upon showing symptoms of clinically overt disease (do not feed, lack of activity, abnormal grooming behavior, hunch back posture) or excessive weight loss (15% body weight loss over a week).
For drug synergism studies in primary human leukemia xenografts, PDX-BALL 37R was transplanted into secondary recipients and animals were monitored for leukemia progression by analysis of human CD45 in peripheral blood (Anti-Hu CD45 APC, Clone HI30, eBiosciences). Upon overt leukemia development (25% blast in peripheral blood) mice were treated by intraperitoneal injection with vehicle (10% DMSO – 20% (2-Hydroxypropyl)-β-cyclodextrin – 70% water), combinatorial chemotherapy58 (Vincristine 0.15 mg/Kg days 1 and 8; dexamethasone 5 mg/Kg days 1–5, 8–9; L-asparaginase 1000 IU/Kg days 1–5, 8–9), ABT-199 (50 mg/Kg days 1–5, 8–9) and combinatorial chemotherapy plus ABT-199 (Vincristine 0.15 mg/Kg days 1 and 8; dexamethasone 5 mg/Kg days 1–5, 8–9; L-asparaginase 1000 IU/Kg days 1–5, 8–9, ABT-199 50 mg/Kg days 1–5, 8–9). Animals were euthanized and data collected 24 hours after finishing treatment schedule.
Retroviral plasmid constructs.
Apobec3A (A3A) cDNA was kindly provided by Dr. Nathaniel Landau at New York University. WE generated the ΔE-NOTCH1-T2A-APOBEC3A-ERT2-IRES-mCherry-LUC vector by cloning the Apobec3A cDNA in fusion with sequences coding for a tamoxifen-sensitive mutant form of the human estradiol receptor (ERT2) ligand binding domain in the C terminus into a custom synthetized retroviral vector (pMSCV ΔE-NOTCH1-T2A-IRES-mCherry-Luc) expressing oncogenic NOTCH1 (ΔE-NOTCH159), and the mCherry-Luciferase fusion protein60.
Mouse leukemia generation and treatment.
To generate mutagenized and chemotherapy resistant T-cell leukemias, we first infected lineage-negative enriched cells from the bone marrow of C57BL/6 donor mice with retroviral particles expressing ΔE-NOTCH1-T2A-APOBEC3A-ERT2-IRES-mCherry-LUC as described previously60. These cells were then transplanted into lethally irradiated recipients and leukemia onset and disease progression was evaluated by luciferase in vivo bioimaging with the In vivo Imaging System (IVIS, Xenogen) and FACS analysis. Next, we transplanted lymphoblasts from spleens and bone marrow of diseased animals into secondary recipients and treated mice with 1 mg of tamoxifen by intraperitoneal injection four days after transplant and every 3 days thereafter, for a total of 4 injections, to induce APOBEC3A activation. Mutagenized lymphoblasts were then transplanted into tertiary hosts, which upon leukemia development were then treated either with vehicle (10% DMSO – 20% (2-Hydroxypropyl)-β-cyclodextrin – 70% water) or combinatorial induction chemotherapy (Vincristine 0.15 mg/Kg days 1 and 8; dexamethasone 5 mg/Kg days 1–5, 8–9; L-asparaginase 1000 IU/Kg days 1–5, 8–9)58. We evaluated disease progression and therapy response by in vivo bioimaging (IVIS, Xenogen). To evaluate the development of secondary drug resistance we collected leukemia lymphoblasts from mice with disease progression and evaluated survival of relapsed-leukemia transplanted mice after salvage treatment with chemotherapy.
Secondly we used again these relapsed ΔE-NOTCH1-APOBEC3A-ERT2 mutagenized leukemias to evaluate the efficacy of salvage therapies in cohorts of mice treated by intraperitoneal injection with two cycles of: vehicle (10% DMSO – 20% (2-Hydroxypropyl)-β-cyclodextrin – 70% water), combinatorial chemotherapy (Vincristine 0.15 mg/Kg days 1 and 8; dexamethasone 5 mg/Kg days 1–5, 8–9; L-asparaginase 1000 IU/Kg days 1–5, 8–9), ABT-199 (50 mg/Kg days 1–5, 8–9) and combinatorial chemotherapy plus ABT-199 (Vincristine 0.15 mg/Kg days 1 and 8; dexamethasone 5 mg/Kg days 1–5, 8–9; L-asparaginase 1000 IU/Kg days 1–5, 8–9, ABT-199 50 mg/Kg days 1–5, 8–9). Treatment cycles were administered consecutively (2 days apart). Mice were monitored for disease progression and survival following treatment.
Western Blotting.
We performed Western blot analysis using antibodies recognizing P53 [1C12] (1:1000; 2524, Cell Signaling Technology), GAPDH [D16H11] (1:5000; 5174, Cell Signaling Technology), P-ATR [Thr1989] (1:1000; 58014, Cell Signaling Technology), ATR [C-1] (1:250; sc-515173, Santa Cruz Biotechnology), P-CHK1 [Ser345; 133D3] (1:500; 2348, Cell Signaling Technology), CHK1 [G-4] (1:500; sc-8408, Santa Cruz Biotechnology), P-RPA32 [S33] (1:1000; A300–246A, Bethyl Laboratories), RPA32 [9H8] (1:1000; ab2175, abcam), γH2AX [Ser139] (1:2000; 613402, Biolegend), Vinculin [VIN-11–5] (1:2000; NB120–11193, Novus Biologicals), following standard procedures.
Immunofluorescence.
Immunofluorescence analysis was performed on ex vivo cultured ΔE-NOTCH1-APOBEC3A-ERT2-mCherry-LUC leukemia cells. We cultured cells on coverslips for one day and then treat them with either ethanol (vehicle) or 4-hydroxytamoxifen for 9 hours. We fixed cells were fixed with PFA 4% in PBS, washed with TBS, permeabilized with Triton X-100 0.5% in PBS and blocked with BSA 3%. Cells were stained using antibodies recognizing phosphorylated γH2AX [Ser139] (1/3000; JBW301, Millipore), Apobec3A (1/300; EPR9165(2), Abcam). Coverslips were mounted on slides using ProLong Diamond Antifade Mountant with DAPI (ThermoFisher scientific P36962). Images were acquired with the CSU-X1 confocal spinning disk system (Yokogawa Life Sciences) on an Eclipse TiE microscope stand (Nikon Instruments). Images were analyzed and γH2AX foci quantified using ImageJ software.
CRISPR gene knockout.
We performed gene inactivation of TP53 in REH and RCH cells by lentiviral infection with lentiCRISPR v2 (Addgene 52961) lentiviral particles expressing CAS9 and a gRNA targeting the TP53 locus. We selected infected cells with puromycin and enriched for TP53 null populations in a secondary selection with nutlin-3a.
CRISPR-Cas9 screen and analysis.
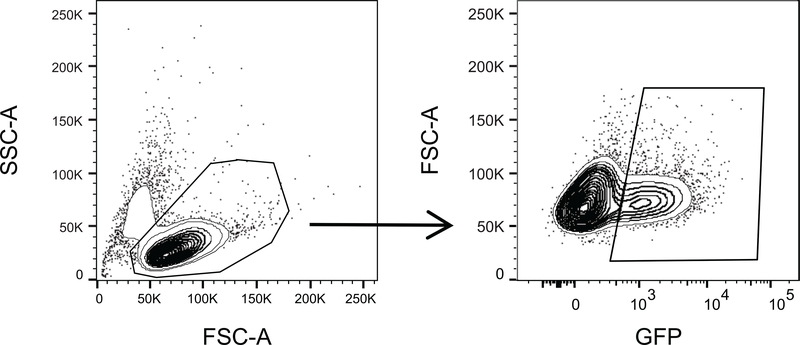
To generate REH cells with inducible expression of CAS9 we first infected this cell line with pCW-Cas9 (Addgene 50661) lentiviral particles followed by selection with 1 μg ml−1 puromycin. We isolated single cell clones by limited dilution and identified doxycycline inducible Cas9-expressing cells by Western blot following doxycycline treatment. For drug-gene interaction screens we determined the lethal dose 90 (LD90) of 6-MP (1.8 μM), methotrexate (10 nM), Ara-C (12 nM), vincristine (0.22 nM), daunorubicin (3.5 nM), maphosphamide (0.9 μM) and L-asparaginase (0.8 U/mL) in REH cells over 7 days of culture. We conducted pool genome wide CRISPR screens as in61. Briefly, we infected Cas9 inducible REH cells with a genome-wide gRNA library (SureGuide GeCKO v2 Human Exome CRISPR Library; Agilent) at a multiplicity of infection of 1 and selected GFP-positive infected cells by flow cytometry cell sorting. Library representation was evaluated by PCR amplification and sequencing of gRNAs. We induced Cas9 expression with doxycycline in cultures containing 250x representation of the library and treated them with vehicle-only or chemotherapy at the calculated 7 day-EC90. We removed dead cells via Ficoll density gradient centrifugation and extracted genomic DNA with phenol-chloroform using standard procedures. We amplified DNA containing gRNAs by PCR and then sequenced these on an Illumina NextSeq 500 instrument, loaded with a 20% spike-in of PhiX DNA. We analyzed sequencing data and normalized gRNA abundance as in62. All experiments were performed in triplicates.
To assess the global differences and similarities in the gene-dependency profiles across different CRISPR screens we performed principle component analysis (PCA) on genes with enrichment (positive or negative) greater than 0.5 log fold-change and false discovery rate less than 5%. We computed principle components in R version 3.5.0 using the prcomp function from the stats package and visualized using ggplot2. We performed hierarchical clustering analysis in R using the factoextra package (version 1.0.5) using Euclidean distances and complete linkage.
For integrated analysis of mutational and forward-genetic screen data we selected genes with positively enriched gRNAs (FDR <0.25) with annotated mutations in this series and in two large and non-overlapping cohorts of diagnostic-relapse ALL samples10,43 cohorts encompassing in total 354 cases.
Next generation sequencing and mapping.
We extracted genomic DNA from patient leukemic blasts, from the lymphoid fraction from peripheral blood or bone marrow of remission samples and from bone marrow derived fibroblast cultures using the DNeasy Blood & Tissue Kit (Qiagen). Whole exome sequencing was performed and analyzed as previously described12. For whole genome sequencing, paired diagnosis, remission, and relapse samples from 15 cases were sequenced on the Illumina HiSeq X Ten System at New York Genome Center (remission at 60x coverage, diagnosis and relapse at 100x coverage), paired diagnosis, remission, and relapse samples from 15 cases were sequenced on the Illumina HiSeq X Ten System at GENEWIZ (remission at 30x coverage, diagnosis and relapse at 60x coverage), and paired diagnosis, remission, and relapse samples from 19 cases were sequenced on the Illumina HiSeq X Ten System at BGI Americas (remission at 30x coverage, diagnosis and relapse at 60x coverage). The analysis produced an average of 90.1 million paired-end reads per sample. After filtering for duplicate reads (i.e. reads with identical start and orientation), sequences were aligned to the reference human genome hg19 assembly using the Burrows-Wheeler Aligner (BWA) tool version 0.7.1532.
Identification of somatic variants.
To identify somatic mutations from Illumina whole-genome sequencing data, we applied the variant-calling software SAVI2 (statistical algorithm for variant frequency identification)63. Only variants with a mutant allele frequency of 5% or greater were considered for further analysis.
Whole genome sequencing data for 80 ALL diagnosis, relapse and matched remission trios of samples analyzed by Complete Genomics were obtained through the Therapeutically Applicable Research to Generate Effective Treatments (TARGET) project (Database of Genotype and Phenotype dbGAP access number phs000464). We used SRAtoolkit to generate pileup stats which was then used as input of VarScan to perform variant detection64. Only SNP variant calls were considered for this cohort analyzed using the Complete Genomics sequencing platform. We removed remove false-positive calls using the following filters: i) at least five reads supported the mutant allele in the tumor sample; ii) the MAF in normal/remission sample of 0; iii) somatic p-value from VarScan <0.01; iv) the mappability (up to 2 mismatches, read length 100bp) of the variant locus is 1. In addition, calls of recurrent mutant genes required the presence of >2 mutant samples from Illumina data and >2 mutant samples in CGI/TARGET data plus >1 mutation from Illumina sequenced data.
Circus plot representation of diagnostic-specific and relapse-specific genetic alterations in recurrently mutated (≥3 lesions) genes was generated using R package Circlize65.
Identification of recurrent and focal copy number variants.
Somatic copy number variants (CNV) were identified using BIC-seq266 with default parameters from Illumina whole-genome sequencing data. CNV for the TARGET dataset, which was generated using Affymetrix SNP 6.0 arrays, was downloaded from Target Data Matrix. These CNV were analyzed using GISTIC267 to identify recurrent areas of copy number variation.
Clonal evolution analysis.
The number of mutations exclusive to, or in common with, each sample was used to construct evolutionary tree for every patient. Each tree was then rescaled by the total lengths of its branches and represented with a circle in the positive quadrant in three dimensions on a sphere, where the size of each circle was scaled by total number of mutations in its corresponding patient68. To exclude false positives, only variants with an allele frequency of at least 20% were used in this analysis.
Mutational signature analysis.
In total 30 mutational signatures were downloaded from COSMIC (https://cancer.sanger.ac.uk/cosmic/signatures). Then mutational signature deconvolution was conducted using non-negative matrix factorization technique through R package MutationalPatterns69. This was done using 49 trios with Illumina whole genome sequencing data (3 trios were separated for hypermutation analysis) by individual sample.
Gene fusion detection.
We used STAR-Fusion70 to identify candidate fusion transcripts. The ‘--examine_coding_effect’ parameter was invoked to examine effect of fusions on coding regions.
Statistical analyses.
We performed analyses of significance using Student’s t test assuming equal variance. Continuous biological variables were assumed to follow a normal distribution. A two-sided P value of <0.05 was considered to indicate statistical significance. We represented survival using Kaplan-Meier curves and calculated statistical significance using the log rank test.
URLs.
Broad Institute Firehose platform for TCGA data, http://gdac.broadinstitute.org/; AROMA for SNP6 data preprocessing, http://www.aroma-project.org/; Cancer Genomics Hub for TCGA raw data, https://cghub.ucsc.edu/; TARGET data matrix, https://ocg.cancer.gov/programs/target/data-matrix.
Code availability.
All custom code is available upon request.
Accession codes.
Whole exome and whole genome sequence Genotypes and Phenotypes (dbGaP) database accession number: phs001072.v1.p1. RNA-seq Sequence Read Archive (SRA) access code: PRJNA534488.
Extended Data
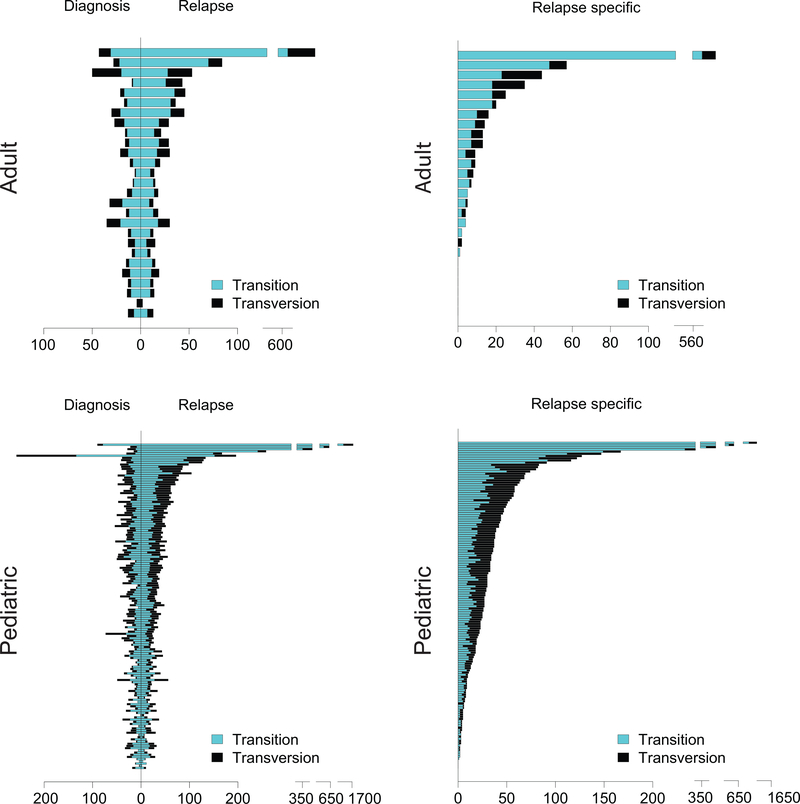
Extended Fig. 1 |. Genomic profiling of diagnostic and relapsed ALL samples.
Number of mutations identified in the diagnosis and relapse adult and pediatric ALL samples (n= 27 adult; 148 pediatric.). Transitions are indicated in blue bars. Transversions are indicated in black bars.
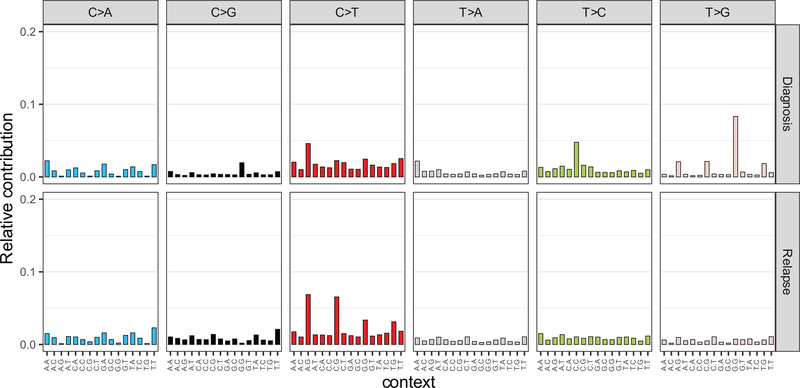
Extended Fig. 2 |. Mutational profiles of diagnosis and relapsed ALL.
Bar graphs indicate the relative contribution of mutational profiles in diagnosis and relapsed ALL patient samples (n=50).
Extended Fig. 3 |. Mutational signatures of diagnosis and relapsed ALL samples.
The percentage contribution of mutational signatures in diagnosis (blue, n=49 patients) and relapsed (red, n=49 patients) ALL samples represented as violin plots. Violin plots use median as the center measure with the 1st quantile and 3rd quantile as the bottom and top boundary, respectively, of the plot.
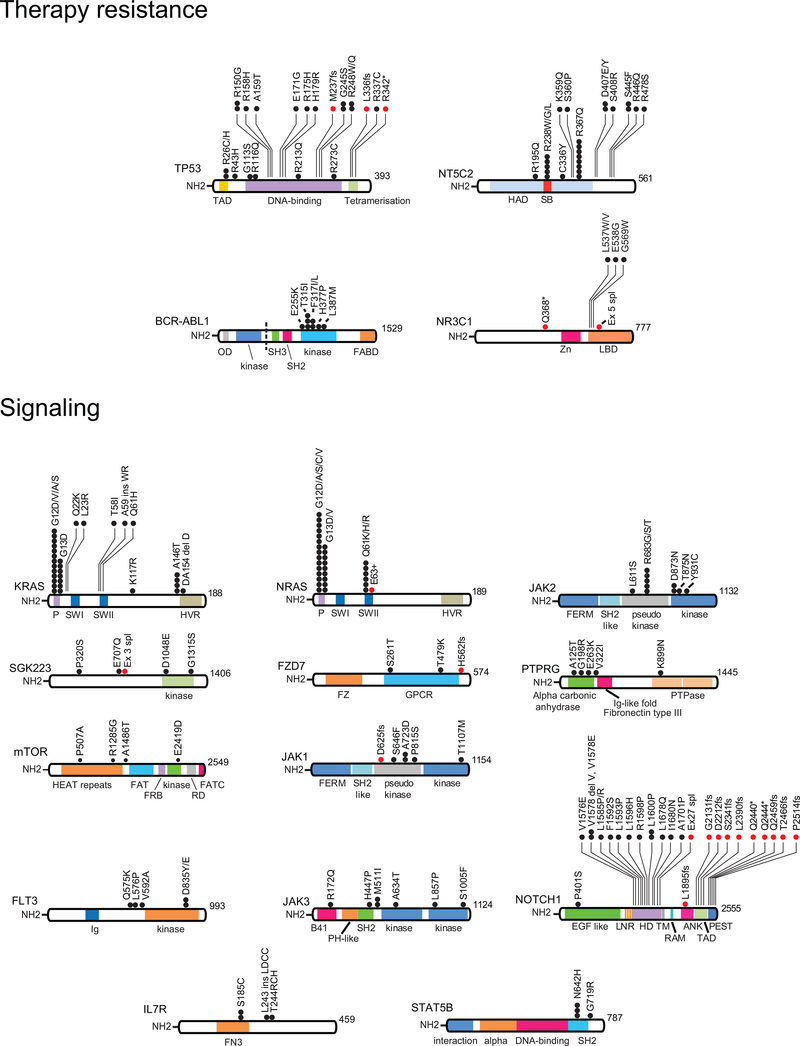
Extended Fig. 4 |. Schematics of the protein structures showing mutations recurrently identified in diagnostic and relapse ALL samples.
Proteins involved in chemotherapy resistance and signaling are represented. Black circles indicate amino acid substitutions. Red circles indicate truncating mutations. TAD, transactivation domain; HAD haloacid dehalogenase domain; SB, substrate binding; Zn, zinc finger domain; LBD, ligand binding domain; P, P loop domain; SWI, Switch I domain; SWII, Switch II domain; HVR, hypervariable region domain; FERM, 4.1 protein Ezrin Radixin Moesin domain; SH2 like, Src homology 2 like domain; FZ, Frizzled domain; GPCR, GPCR family 2-like; Ig, Immunoglobulin; PTPase, Tyrosine specific protein phosphatases domain; HEAT, Huntingtin, EF3A, ATM, TOR; FAT, Frap, ATM, TRRAP; FRB, FKBP-rapamycin complex binding; RD, regulatory domain; FATC, FAT C-terminal; B41, Band 4.1 homologues; PH-like, Pleckstrin homology-like; EGF like, epidermal growth factor like domain repeats; LNR, Lin12-Notch repeats; HD, heterodimerization domain; TM, transmembrane region; RAM, Rbp-associated molecule domain; ANK, ankyrin repeats; PEST, proline (P), glutamic acid (E), serine (S), and threonine (T) domain; FN3, Fibronectin type III; OD, oligomerization domain; SH3, Src homology 3 domain; FABD, F-actin binding domain.
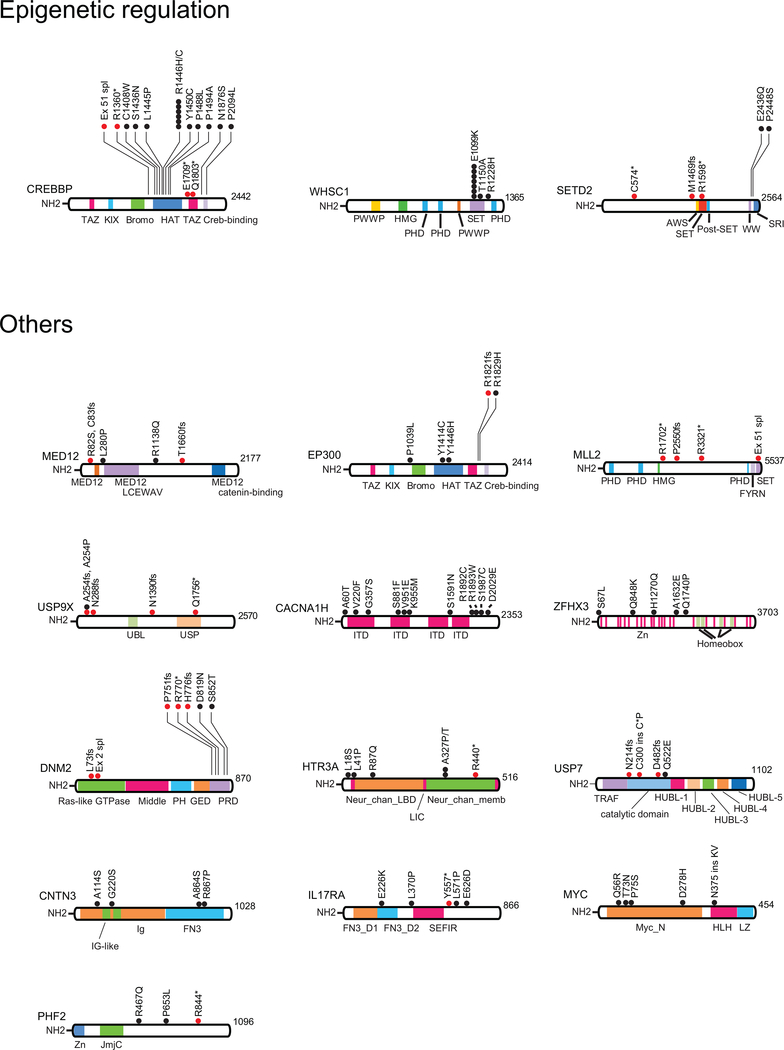
Extended Fig. 5 |. Schematics of the protein structures showing mutations recurrently identified in diagnostic and relapse ALL samples.
Proteins involved in epigenetic regulation and other recurrently mutated factors are represented. Black circles indicate amino acid substitutions. Red circles indicate truncating mutations. TAZ, TAZ zinc finger; KIX, kinase-inducible domain interacting domain; Bromo, bromodomain; HAT, histone acetyl transferase domain; PWWP, proline (P) tryptophan (W) tryptophan (W) proline (P) domain; HMG, high mobility group domain; PHD, plant homeodomain; SET, Su(var)3–9 Enhancer of zeste and Trithorax domain; AWS, associated with SET; SRI, Set2 Rpb1 interacting; MED12, Mediator complex, subunit Med12; FYRN, FY-rich domain N-terminal; UBL, ubiquitin like domain; USP, ubiquitin specific protease domain; ITD, ion transport domain; PH, pleckstrin homology; GED, GTPase effector domain; PRD, proline/arginine-rich domain; Neur_chan_LBD, Neurotransmitter-gated ion-channel ligand binding domain; LIC, Cation transporter family protein; Neur_chan_memb, Neurotransmitter-gated ion-channel transmembrane region; TRAF, tumor necrosis factor-receptor associated factor; HUBL, HAUSP/USP7 ubiquitin-like domain; FN3_D, Fibronectin type III-like domain; SEFIR, SEF/IL-17R; Myc_N, Myc amino-terminal region; HLH, Helix-loop-helix; LZ, leucine zipper; Jmjc, Jumonji C.
Extended Fig. 6 |. Copy number alterations in diagnostic and relapse ALL samples.
Human chromosomal ideograms showing the areas of genetic gain and loss identified by whole exome sequencing, whole genome sequencing or Genome-Wide Human SNP Array 6.0 (Affymetrix) in 103 B-precursor ALL samples and 46 T-cell ALL samples at diagnosis and relapse (rel). Green bars represent areas of loss. Red bars represent areas of gain.
Extended Fig. 7 |. GISTIC analysis of recurrent Copy number alterations in diagnostic and relapse ALL samples.
GISTIC qplots of 149 diagnosis and relapse ALL samples. Copy number segmentation files were generated by EXCAVATOR base on Whole Exome Sequencing data, BIC-seq2 for whole genome sequencing or Genome-Wide Human SNP Array 6.0 (Affymetrix). The resulting seg files (genomic intervals), together with the union of whole exome probes from different platform were used in GISTIC version 2.0.22.
Extended Fig. 8 |. Clonal evolution profiles in relapsed ALL.
Evolutionary trees of 49 matched diagnosis and relapse samples evaluated by whole-genome sequencing. The lengths of the branches in the evolutionary tree graph indicate the number of shared (orange), diagnosis-specific (blue) and relapse-specific (red) genetic alterations in each sample. We used the variant allele frequency cutoff >= 20%.
Supplementary Material
Acknowledgements
This work was supported by the University of Minnesota Academic Health Center Faculty Research Development Grant (ZW), a Leukemia & Lymphoma Quest for Cures Award (AF), an Innovative Research Award and a Phillip A. Sharp Innovation in Collaboration Award by Stand Up to Cancer (AF), the St. Baldrick’s Foundation (AF), the Chemotherapy Foundation (AF), the Swim Across America Foundation (AF), a Crazy 8 Pilot Project Award from the Alex Lemonade Stand Foundation (AF), the NIH grants P30 CA013696 (Genomics and High Throughput Screen Shared Resource, Flow Cytometry Shared Resource, Oncology Precision Therapeutics Shared Resource), R35 CA210065 (AF), R01 CA206501 (AF), R01 CA185486 (RR), R01 CA179044 (RR), U54 CA121852 (RR), CA180827 (E. Paietta), CA196172 (E. Paietta), CA180820 (ECOG-ACRIN), CA189859 (ECOG-ACRIN), CA14958 (ECOG-ACRIN), CA180791 (ECOG-ACRIN), CA17145 (ECOG-ACRIN), U10 CA180827 (ECOG-ACRIN), CA233332 (ECOG-ACRIN), U10 CA98543 (JMG, MLL), Human Specimen Banking Grant U24 CA114766 (JMG) and the Stewart Foundation (RR). KO is a Rally Foundation fellow. JAB is the Candy and William Raveis Fellow of the Damon Runyon-Sohn Foundation Pediatric Cancer Fellowship Award.
Footnotes
Competing financial interests
The authors declare no competing financial interests relevant for the work reported here. Financial disclosures for Adolfo Ferrando: Consulting for Ayala Pharmaceuticals and SpringWorks Therapeutics; previous research support by Pfizer, Bristol Myers Squib, Merck, Eli Lilly; patent and reagent licensing royalties from Novartis, EMD Millipore and Applied Biological Materials.
References
- 1.Malard F & Mohty M Acute lymphoblastic leukaemia. Lancet (London, England) 395, 1146–1162 (2020). [DOI] [PubMed] [Google Scholar]
- 2.Chan KW Acute lymphoblastic leukemia. Current problems in pediatric and adolescent health care 32, 40–49 (2002). [DOI] [PubMed] [Google Scholar]
- 3.El Fakih R, et al. Current paradigms in the management of Philadelphia chromosome positive acute lymphoblastic leukemia in adults. American journal of hematology 93, 286–295 (2018). [DOI] [PubMed] [Google Scholar]
- 4.Pui CH & Evans WE Treatment of acute lymphoblastic leukemia. The New England journal of medicine 354, 166–178 (2006). [DOI] [PubMed] [Google Scholar]
- 5.Bhojwani D & Pui CH Relapsed childhood acute lymphoblastic leukaemia. The lancet oncology 14, e205–217 (2013). [DOI] [PubMed] [Google Scholar]
- 6.Tzoneva G, et al. Activating mutations in the NT5C2 nucleotidase gene drive chemotherapy resistance in relapsed ALL. Nature medicine 19, 368–371 (2013). [DOI] [PMC free article] [PubMed] [Google Scholar]
- 7.Meyer JA, et al. Relapse-specific mutations in NT5C2 in childhood acute lymphoblastic leukemia. Nature genetics 45, 290–294 (2013). [DOI] [PMC free article] [PubMed] [Google Scholar]
- 8.Li B, et al. Negative feedback-defective PRPS1 mutants drive thiopurine resistance in relapsed childhood ALL. Nature medicine 21, 563–571 (2015). [DOI] [PMC free article] [PubMed] [Google Scholar]
- 9.Mullighan CG, et al. CREBBP mutations in relapsed acute lymphoblastic leukaemia. Nature 471, 235–239 (2011). [DOI] [PMC free article] [PubMed] [Google Scholar]
- 10.Li B, et al. Therapy-induced mutations drive the genomic landscape of relapsed acute lymphoblastic leukemia. Blood 135, 41–55 (2020). [DOI] [PMC free article] [PubMed] [Google Scholar]
- 11.Dobson SM, et al. Relapse-Fated Latent Diagnosis Subclones in Acute B Lineage Leukemia Are Drug Tolerant and Possess Distinct Metabolic Programs. Cancer discovery 10, 568–587 (2020). [DOI] [PMC free article] [PubMed] [Google Scholar]
- 12.Oshima K, et al. Mutational landscape, clonal evolution patterns, and role of RAS mutations in relapsed acute lymphoblastic leukemia. Proceedings of the National Academy of Sciences 113, 11306–11311 (2016). [DOI] [PMC free article] [PubMed] [Google Scholar]
- 13.Ma X, et al. Rise and fall of subclones from diagnosis to relapse in pediatric B-acute lymphoblastic leukaemia. Nature communications 6, 6604 (2015). [DOI] [PMC free article] [PubMed] [Google Scholar]
- 14.Mullighan CG Molecular genetics of B-precursor acute lymphoblastic leukemia. The Journal of clinical investigation 122, 3407–3415 (2012). [DOI] [PMC free article] [PubMed] [Google Scholar]
- 15.Weng AP, et al. Activating mutations of NOTCH1 in human T cell acute lymphoblastic leukemia. Science (New York, N.Y.) 306, 269–271 (2004). [DOI] [PubMed] [Google Scholar]
- 16.Thompson BJ, et al. The SCFFBW7 ubiquitin ligase complex as a tumor suppressor in T cell leukemia. The Journal of experimental medicine 204, 1825–1835 (2007). [DOI] [PMC free article] [PubMed] [Google Scholar]
- 17.Van Vlierberghe P, et al. PHF6 mutations in T-cell acute lymphoblastic leukemia. Nature genetics 42, 338–342 (2010). [DOI] [PMC free article] [PubMed] [Google Scholar]
- 18.Tosello V, et al. WT1 mutations in T-ALL. Blood 114, 1038–1045 (2009). [DOI] [PMC free article] [PubMed] [Google Scholar]
- 19.Della Gatta G, et al. Reverse engineering of TLX oncogenic transcriptional networks identifies RUNX1 as tumor suppressor in T-ALL. Nature medicine 18, 436–440 (2012). [DOI] [PMC free article] [PubMed] [Google Scholar]
- 20.De Keersmaecker K, et al. Exome sequencing identifies mutation in CNOT3 and ribosomal genes RPL5 and RPL10 in T-cell acute lymphoblastic leukemia. Nature genetics 45, 186–190 (2013). [DOI] [PMC free article] [PubMed] [Google Scholar]
- 21.Zhang J, et al. The genetic basis of early T-cell precursor acute lymphoblastic leukaemia. Nature 481, 157–163 (2012). [DOI] [PMC free article] [PubMed] [Google Scholar]
- 22.Hsiao MH, Yu AL, Yeargin J, Ku D & Haas M Nonhereditary p53 mutations in T-cell acute lymphoblastic leukemia are associated with the relapse phase. Blood 83, 2922–2930 (1994). [PubMed] [Google Scholar]
- 23.Kawamura M, et al. Mutations of the p53 and ras genes in childhood t(1;19)-acute lymphoblastic leukemia. Blood 85, 2546–2552 (1995). [PubMed] [Google Scholar]
- 24.Brown L, et al. Site-specific recombination of the tal-1 gene is a common occurrence in human T cell leukemia. The EMBO journal 9, 3343–3351 (1990). [DOI] [PMC free article] [PubMed] [Google Scholar]
- 25.Mullighan CG, et al. Genomic analysis of the clonal origins of relapsed acute lymphoblastic leukemia. Science (New York, N.Y.) 322, 1377–1380 (2008). [DOI] [PMC free article] [PubMed] [Google Scholar]
- 26.Greaves MF, Maia AT, Wiemels JL & Ford AM Leukemia in twins: lessons in natural history. Blood 102, 2321–2333 (2003). [DOI] [PubMed] [Google Scholar]
- 27.Alexandrov LB, et al. Signatures of mutational processes in human cancer. Nature 500, 415–421 (2013). [DOI] [PMC free article] [PubMed] [Google Scholar]
- 28.Mar BG, et al. SETD2 alterations impair DNA damage recognition and lead to resistance to chemotherapy in leukemia. Blood 130, 2631–2641 (2017). [DOI] [PMC free article] [PubMed] [Google Scholar]
- 29.Li J, et al. A Gain of Function Mutation in the NSD2 Histone Methyltransferase Drives Glucocorticoid Resistance of Acute Lymphoblastic Leukemia. Blood 132, 653–653 (2018). [Google Scholar]
- 30.Bordin F, et al. WT1 loss attenuates the TP53-induced DNA damage response in T-cell acute lymphoblastic leukemia. Haematologica 103, 266–277 (2018). [DOI] [PMC free article] [PubMed] [Google Scholar]
- 31.Soverini S, et al. Implications of BCR-ABL1 kinase domain-mediated resistance in chronic myeloid leukemia. Leukemia research 38, 10–20 (2014). [DOI] [PubMed] [Google Scholar]
- 32.Inaba H, Greaves M & Mullighan CG Acute lymphoblastic leukaemia. Lancet (London, England) 381, 1943–1955 (2013). [DOI] [PMC free article] [PubMed] [Google Scholar]
- 33.Mirski SE, Gerlach JH & Cole SP Multidrug resistance in a human small cell lung cancer cell line selected in adriamycin. Cancer research 47, 2594–2598 (1987). [PubMed] [Google Scholar]
- 34.Ruel NM, Nguyen KH, Vilas G & Hammond JR Characterization of 6-Mercaptopurine Transport by the SLC43A3-Encoded Nucleobase Transporter. Molecular pharmacology 95, 584–596 (2019). [DOI] [PubMed] [Google Scholar]
- 35.Moriyama T, et al. NUDT15 polymorphisms alter thiopurine metabolism and hematopoietic toxicity. Nature genetics 48, 367–373 (2016). [DOI] [PMC free article] [PubMed] [Google Scholar]
- 36.Nakamura A, et al. Inhibition of GCN2 sensitizes ASNS-low cancer cells to asparaginase by disrupting the amino acid response. Proceedings of the National Academy of Sciences of the United States of America 115, E7776–e7785 (2018). [DOI] [PMC free article] [PubMed] [Google Scholar]
- 37.Bunpo P, et al. The eIF2 kinase GCN2 is essential for the murine immune system to adapt to amino acid deprivation by asparaginase. The Journal of nutrition 140, 2020–2027 (2010). [DOI] [PMC free article] [PubMed] [Google Scholar]
- 38.Griffiths M, et al. Cloning of a human nucleoside transporter implicated in the cellular uptake of adenosine and chemotherapeutic drugs. Nature medicine 3, 89–93 (1997). [DOI] [PubMed] [Google Scholar]
- 39.Matherly LH & Goldman DI Membrane transport of folates. Vitamins and hormones 66, 403–456 (2003). [DOI] [PubMed] [Google Scholar]
- 40.Burgess DJ, et al. Topoisomerase levels determine chemotherapy response in vitro and in vivo. Proceedings of the National Academy of Sciences of the United States of America 105, 9053–9058 (2008). [DOI] [PMC free article] [PubMed] [Google Scholar]
- 41.Riccio AA, Schellenberg MJ & Williams RS Molecular mechanisms of topoisomerase 2 DNA-protein crosslink resolution. Cellular and molecular life sciences : CMLS 77, 81–91 (2020). [DOI] [PMC free article] [PubMed] [Google Scholar]
- 42.Trumpp A & Wiestler OD Mechanisms of Disease: cancer stem cells--targeting the evil twin. Nature clinical practice. Oncology 5, 337–347 (2008). [DOI] [PubMed] [Google Scholar]
- 43.Schroeder MP, et al. Integrated analysis of relapsed B-cell precursor Acute Lymphoblastic Leukemia identifies subtype-specific cytokine and metabolic signatures. Scientific reports 9, 4188 (2019). [DOI] [PMC free article] [PubMed] [Google Scholar]
- 44.Kankanala J, et al. Novel Deazaflavin Analogues Potently Inhibited Tyrosyl DNA Phosphodiesterase 2 (TDP2) and Strongly Sensitized Cancer Cells toward Treatment with Topoisomerase II (TOP2) Poison Etoposide. Journal of medicinal chemistry 62, 4669–4682 (2019). [DOI] [PMC free article] [PubMed] [Google Scholar]
- 45.Numan Y, et al. First report of clinical response to Venetoclax in Early T-cell Precursor Acute Lymphoblastic Leukemia. JCO precision oncology 2(2018). [DOI] [PMC free article] [PubMed] [Google Scholar]
- 46.Rahmat LT, et al. Venetoclax in Combination with Decitabine for Relapsed T-Cell Acute Lymphoblastic Leukemia after Allogeneic Hematopoietic Cell Transplant. Case reports in hematology 2018, 6092646 (2018). [DOI] [PMC free article] [PubMed] [Google Scholar]
- 47.Farhadfar N, Li Y, May WS & Adams CB Venetoclax and decitabine for treatment of relapsed T-cell acute lymphoblastic leukemia: A case report and review of literature. Hematology/oncology and stem cell therapy (2020). [DOI] [PubMed] [Google Scholar]
- 48.Guan Y, Gerhard B & Hogge DE Detection, isolation, and stimulation of quiescent primitive leukemic progenitor cells from patients with acute myeloid leukemia (AML). Blood 101, 3142–3149 (2003). [DOI] [PubMed] [Google Scholar]
- 49.Iwamoto S, Mihara K, Downing JR, Pui CH & Campana D Mesenchymal cells regulate the response of acute lymphoblastic leukemia cells to asparaginase. The Journal of clinical investigation 117, 1049–1057 (2007). [DOI] [PMC free article] [PubMed] [Google Scholar]
- 50.Goker E, et al. Amplification of the dihydrofolate reductase gene is a mechanism of acquired resistance to methotrexate in patients with acute lymphoblastic leukemia and is correlated with p53 gene mutations. Blood 86, 677–684 (1995). [PubMed] [Google Scholar]
- 51.Mar BG, et al. Mutations in epigenetic regulators including SETD2 are gained during relapse in paediatric acute lymphoblastic leukaemia. Nature communications 5, 3469 (2014). [DOI] [PMC free article] [PubMed] [Google Scholar]
- 52.Kunz JB, et al. Pediatric T-cell lymphoblastic leukemia evolves into relapse by clonal selection, acquisition of mutations and promoter hypomethylation. Haematologica 100, 1442–1450 (2015). [DOI] [PMC free article] [PubMed] [Google Scholar]
- 53.Malinowska-Ozdowy K, et al. KRAS and CREBBP mutations: a relapse-linked malicious liaison in childhood high hyperdiploid acute lymphoblastic leukemia. Leukemia 29, 1656–1667 (2015). [DOI] [PMC free article] [PubMed] [Google Scholar]
- 54.Waters TR & Swann PF Cytotoxic mechanism of 6-thioguanine: hMutSalpha, the human mismatch binding heterodimer, binds to DNA containing S6-methylthioguanine. Biochemistry 36, 2501–2506 (1997). [DOI] [PubMed] [Google Scholar]
- 55.Evensen NA, et al. MSH6 haploinsufficiency at relapse contributes to the development of thiopurine resistance in pediatric B-lymphoblastic leukemia. Haematologica 103, 830–839 (2018). [DOI] [PMC free article] [PubMed] [Google Scholar]
- 56.Kucab JE, et al. A Compendium of Mutational Signatures of Environmental Agents. Cell 177, 821–836.e816 (2019). [DOI] [PMC free article] [PubMed] [Google Scholar]
- 57.Roberts KG Genetics and prognosis of ALL in children vs adults. Hematology. American Society of Hematology. Education Program 2018, 137–145 (2018). [DOI] [PMC free article] [PubMed] [Google Scholar]
- 58.Szymanska B, et al. Pharmacokinetic modeling of an induction regimen for in vivo combined testing of novel drugs against pediatric acute lymphoblastic leukemia xenografts. PloS one 7, e33894 (2012). [DOI] [PMC free article] [PubMed] [Google Scholar]
- 59.Schroeter EH, Kisslinger JA & Kopan R Notch-1 signalling requires ligand-induced proteolytic release of intracellular domain. Nature 393, 382–386 (1998). [DOI] [PubMed] [Google Scholar]
- 60.Herranz D, et al. Metabolic reprogramming induces resistance to anti-NOTCH1 therapies in T cell acute lymphoblastic leukemia. Nature medicine 21, 1182–1189 (2015). [DOI] [PMC free article] [PubMed] [Google Scholar]
Methods references.
- 61.Joung J, et al. Genome-scale CRISPR-Cas9 knockout and transcriptional activation screening. Nature protocols 12, 828–863 (2017). [DOI] [PMC free article] [PubMed] [Google Scholar]
- 62.Wang B, et al. Integrative analysis of pooled CRISPR genetic screens using MAGeCKFlute. Nature protocols 14, 756–780 (2019). [DOI] [PMC free article] [PubMed] [Google Scholar]
- 63.Trifonov V, Pasqualucci L, Tiacci E, Falini B & Rabadan R SAVI: a statistical algorithm for variant frequency identification. BMC systems biology 7, S2 (2013). [DOI] [PMC free article] [PubMed] [Google Scholar]
- 64.Koboldt DC, et al. VarScan 2: somatic mutation and copy number alteration discovery in cancer by exome sequencing. Genome research 22, 568–576 (2012). [DOI] [PMC free article] [PubMed] [Google Scholar]
- 65.Gu Z, Gu L, Eils R, Schlesner M & Brors B circlize implements and enhances circular visualization in R. Bioinformatics 30, 2811–2812 (2014). [DOI] [PubMed] [Google Scholar]
- 66.Xi R, Lee S, Xia Y, Kim T-M & Park PJ Copy number analysis of whole-genome data using BIC-seq2 and its application to detection of cancer susceptibility variants. Nucleic acids research 44, 6274–6286 (2016). [DOI] [PMC free article] [PubMed] [Google Scholar]
- 67.Mermel CH, et al. GISTIC2. 0 facilitates sensitive and confident localization of the targets of focal somatic copy-number alteration in human cancers. Genome biology 12, R41 (2011). [DOI] [PMC free article] [PubMed] [Google Scholar]
- 68.Zairis C, Khiabanian H, Blumberg AJ & Rabadan R Moduli Spaces of Phylogenetic Trees Describing Tumor Evolutionary Patterns. Lecture Notes in Computer Science 8609, 528–539 (2014). [Google Scholar]
- 69.Blokzijl F, Janssen R, van Boxtel R & Cuppen E MutationalPatterns: comprehensive genome-wide analysis of mutational processes. Genome medicine 10, 33 (2018). [DOI] [PMC free article] [PubMed] [Google Scholar]
- 70.Haas B, et al. STAR-Fusion: fast and accurate fusion transcript detection from RNA-Seq. BioRxiv, 120295 (2017) [Google Scholar]
Associated Data
This section collects any data citations, data availability statements, or supplementary materials included in this article.


