

Abstract
The identification of a bacterial, viral, or even noninfectious cause is essential in the management of febrile syndrome in the emergency department (ED), especially in epidemic contexts such as flu or CoVID‐19. The aim was to assess discriminative performances of two biomarkers, CD64 on neutrophils (nCD64) and CD169 on monocytes (mCD169), using a new flow cytometry procedure, in patients presenting with fever to the ED during epidemics. Eighty five adult patients presenting with potential infection were included during the 2019 flu season in the ED of La Timone Hospital. They were divided into four diagnostic outcomes according to their clinical records: no‐infection, bacterial infection, viral infection and co‐infection. Seventy six patients with confirmed SARS‐CoV‐2 infection were also compared to 48 healthy volunteers. For the first cohort, 38 (45%) patients were diagnosed with bacterial infections, 11 (13%) with viral infections and 29 (34%) with co‐infections. mCD169 was elevated in patients with viral infections, with a majority of Flu A virus or Respiratory Syncytial Virus, while nCD64 was elevated in subjects with bacterial infections, with a majority of Streptococcus pneumoniae and Escherichia coli. nCD64 and mCD169 showed 90% and 80% sensitivity, and 78% and 91% specificity, respectively, for identifying patients with bacterial or viral infections. When studied in a second cohort, mCD169 was elevated in 95% of patients with SARS‐CoV‐2 infections and remained at normal level in 100% of healthy volunteers. nCD64 and mCD169 have potential for accurately distinguishing bacterial and acute viral infections. Combined in an easy and rapid flow cytometry procedure, they constitute a potential improvement for infection management in the ED, and could even help for triage of patients during emerging epidemics.
Keywords: bacterial infection, CoVID‐19, emergency department, flow cytometry, viral infection
1. INTRODUCTION
In the management of febrile syndrome, diagnostic guidance toward an infectious etiology is essential. 1 The characterization of a viral, bacterial or other infectious or noninfectious cause allows early appropriate patient management. Nevertheless, the data in the literature report the complexity of triage and diagnostic guidance. 2 The integration of the clinical examination is essential, but unfortunately is often not enough; 3 diagnostic elements are therefore needed as quickly as possible in the emergency department (ED), especially in epidemic contexts such as flu or CoVID‐19. 4 , 5 , 6
Biological markers such as procalcitonin (PCT) and C‐reactive protein (CRP) are commonly used in clinical practice. These markers have bacterial specificity but share a wide range of values with viral infections and do not make it possible to exclude or to confirm definitively the diagnosis. 7 , 8 , 9 Their triage capacity in ED is thus regularly challenged. 10 Measuring multiple specific biomarkers simultaneously, with a simple technique and rapid time‐to‐results, would be better compatible with the needs of triage in emergency medicine. 11
We developed a rapid flow cytometry assay, able to measure leucocytes biomarkers expressions within 10 min, 12 and demonstrated promising results for the triage of patients with fever at the Emergency Department, 13 , 14 with CD64 on neutrophils (nCD64), increased in case of bacterial infections 15 , and CD169 on monocytes (mCD169), increased in case of viral infections. 16 In these previous studies, one limitation was the low number of infected patients, especially those with viral diseases.
In this new study, we have thus included more patients, and focused on those with infectious symptoms during the flu season, and later added a cohort of CoVID‐19 patients. The main goal was to confirm the relevance of CD64 and CD169 for discriminating between bacterial and viral infections in such epidemic contexts.
2. METHODS
2.1. Studied population
The study population included patients older than 18 years, if they presented to the adult ED of La Timone University Hospital in Marseille, France, with infection signs, during 2019 flu season or 2020 CoVID‐19 pandemic. The inclusion criteria were the presence of fever greater than 38°C or hypothermia less than 36.5°C, and any potential respiratory (cough, sputum, and dyspnea), urinary (potential urinary infection), abdominal (pain syndrome, diarrhea), cutaneous (erysipelas), or neurological (meningitis) infectious clinical signs. The exclusion criteria were incomplete clinical files, traumatized patients or patients presenting with a known inflammatory or autoimmune disease, neoplasia, chronic infectious disease (viral, fungal, or bacterial), or antibiotic, antiviral, or immunosuppressive treatment prior to admission, and patients with extensive burns or recent surgery (less than 1 month).
Their routine care was not modified, and confidentiality was preserved at all levels. All enrolled patients provided informed consent and no objection authorization, so that their data could be retrieved from their clinical records by a team of emergency department specialists, and could be used in the study.
This observational and noninterventional prospective study was approved by the La Timone Hospital Ethical Committee and the Committee for Protection of Persons (CPP approval no. 181160; ID‐RCB approval no. 2018 A02706‐49; ClinicalTrials.gov Identifier NCT03912870). Procedures followed were in accordance with the Helsinki Declaration.
2.2. Clinical data collection
Electronic medical records were retrieved for each patient by a team of ED specialists:
epidemiological data: sex, age, clinical history (evolutionary cancer, liver disease, congestive heart failure, cerebrovascular disease), medical institutionalization, altered mental status;
physiological data: cardiac parameters (systolic, diastolic and average blood pressures, pulse and respiratory rates), body temperature, fever duration, vital signs and symptoms (respiratory, abdominal, neurological, urinary, cutaneous or others), and eventual oxygen‐, antibiotic‐ or antiviral‐therapy;
clinical data: time from onset, symptoms, X‐ray examination results (performed and atypical chest X‐ray or ultrasound or CT scan), final diagnosis established by the ED practitioner, outcome of the ED visit (released home, conventional or critical care hospitalization), and eventually duration of the hospitalization;
and biological data: white blood cell (WBC) and polymorphonuclear neutrophil (PMN) counts, CRP and PCT levels, biochemical measurements (urea, sodium, glucose, hematocrit, hemoglobin), and name of the identified pathogens if isolated.
WBC and PMN counts were assessed using a Sysmex XN system (Sysmex Inc., Kobe, Japan). PCT was measured using a Dosage ADVIA Centaur BRAHMS Procalcitonin system (Siemens, Munich, Germany) and CRP using Gen.3 system (COBAS, Roche, Basel, Switzerland).
Isolation of potential viruses relied on examining blood or cerebrospinal fluid samples with polymerase chain reaction (PCR) or reverse transcriptase (RT)‐PCR, and serum IgG and IgM with LIAISON analyzer (DiaSorin, Saluggia, Italy). Potential bacteria were detected in blood and respiratory tract secretion (nasopharyngeal swabs, tracheobronchial aspirate, or bronchoalveolar lavage) cultures by a Bruker Mass Spectrometry system (Brucker Inc., Billerica, MA, USA), and in urine cultures by urinary antigen tests (for Pneumococcus and Legionella) or PCR (for Chlamydia and Mycoplasma).
2.3. Adjudication committee
Based on all clinical and biological data, an adjudication committee classified patients from the first cohort in four groups.
Group I: Subjects for which infection was ruled out. No evidence of infection was found according to clinical symptoms and laboratory test results.
Group II: Subjects diagnosed with bacterial infections. Subjects were categorized into this group either on the basis of a positive bacterial culture result, and/or if clinical and laboratory findings such as concomitant high levels of CRP and PCT and negative viral test results strongly suggested the presence of a bacterial infection.
Group III: Subjects diagnosed as having viral infections. This group contained subjects that presented with typical clinical symptoms of infections, but negative bacteriological results and/or low PCT levels. In some cases, viral agents were found by antigen‐based tests or serological assays.
Group IV: Subjects diagnosed as having both viral and bacterial infections.
The committee was not aware of the flow cytometry results.
The adjudication committee was not required for subjects included during CoVID‐19 pandemic, since RT‐PCR results were used as gold standard.
2.4. Flow cytometry testing
Leftover ethylenediaminetetraacetic acid (EDTA)‐treated blood samples were pseudonymized, and processed by flow cytometry according to a newly described one‐step procedure. 12 Briefly, a multicolor panel was constituted and dried as a “glassified” layer at the bottom of a 5‐ml testing tube using the DURA Innovations drying process (Beckman Coulter Inc.), with antibodies at their optimized amounts for a single test: anti‐CD169‐phycoerythrin (PE) (clone 7‐239), anti‐CD64‐PacificBlue (PBE) (clone 22), anti‐HLA‐DR‐allophycocyanin (APC) (clone Immu357) and anti‐HLA‐ABC‐Alexa Fluor 700 (AF700) (clone B9.12.1), all custom products from Beckman Coulter Inc. (Brea, CA).
For each blood sample tested, 500 μl of Versalyse lysing solution (Beckman Coulter Inc.) and 5 μl of EDTA‐treated blood were transferred to one dried tube. After incubation for 15 min, samples were analyzed on a three‐laser, 10‐color Navios flow cytometer (Beckman Coulter Inc.). As an external Quality Control, Flow‐Set beads (Beckman Coulter) were used before each analytical run in order to control the variability in device performance, however no harmonization between the measured values over the study period was necessary. Analysis was performed using Kaluza Analysis Software (version 2.1; Beckman Coulter Inc.).
Leucocytes were gated using Side Scatter (SSC) and CD64 expressions, as lymphocytes (low SSC, CD64−), monocytes (intermediate SSC, CD64+) and neutrophils (high SSC), prior to the analysis of nCD64, mCD169, mHLA‐DR, rHLA‐ABC, and mCD64. Results were expressed as mean of fluorescence intensities (MFI). CD169 ratio (rCD169) was also calculated as the MFI ratio between monocytes and lymphocytes. CD64 staining on monocytes was used as an internal Quality Control, since the natural CD64 expression on monocytes indicates the presence of the antibody cocktail.
For the second study, we directly used the recently launched IOTest Myeloid Activation antibody cocktail (Part Number C63854, Beckman Coulter Inc.), containing the same three markers: anti‐CD169‐PE (clone 7‐239), anti‐CD64‐PBE (clone 22), anti‐HLA‐DR‐APC (clone Immu357).
2.5. Statistical analysis
Statistical analysis was performed using IBM SPSS Statistics version 20 (IBM SPSS Inc., Chicago, IL). Quantitative data were expressed as mean ± SD. Qualitative variables were expressed as frequency with percent.
Comparisons of quantitative variables among the different groups were performed using Student's t‐test or Mann–Whitney U test. Comparisons of percentage were performed using Khi‐2 or Fisher's exact tests if conditions were missing. Comparisons of more than two groups were performed by Freeman–Halton extension of Fisher's exact test for qualitative variables and by analysis of variance or Kruskal‐Wallis tests for quantitative variables.
The ability of biomarker levels to discriminate between bacterial and viral infections was investigated by means of receiver operating characteristic (ROC) curve analysis. Youden index was used to define the best threshold of biomarker indexes, that optimizes the biomarker's differentiating ability with equal weight to sensitivity and specificity. Analyses were based on area under the curve (AUC), sensitivity (true positives/positives [TP/P]), specificity (true negatives / negatives [TN/N]), positive likelihood ratio (sensitivity/[100 − specificity]) and negative likelihood ratio ([100 − sensitivity]/specificity]). All values were expressed as ranges (between 0 and 100), with 95% confidence intervals. For all tests, two‐sided p values less than 0.05 were considered statistically significant.
3. RESULTS
3.1. Clinical features of the patients
During the first study period, 104 patients admitted to the ED of La Timone Hospital were included. All blood samples were processed by flow cytometry, but only 85 out of the 104 subjects satisfied the inclusion criteria. Nineteen patients for whom clinical files were incomplete, and in particular for whom there was doubt about the presence of underlying or asymptomatic infections that were not sufficiently documented, were removed from the study, because it could have biased their final diagnosis and classification.
The adjudication committee classified the 85 remaining patients: 7 (8%) were defined as not‐infected, 38 (45%) as bacterially infected, 11 (13%) as virally infected and 29 (34%) as presenting with both a bacterial and a viral infection (co‐infection).
An overview of this study workflow is shown in Figure 1.
FIGURE 1.
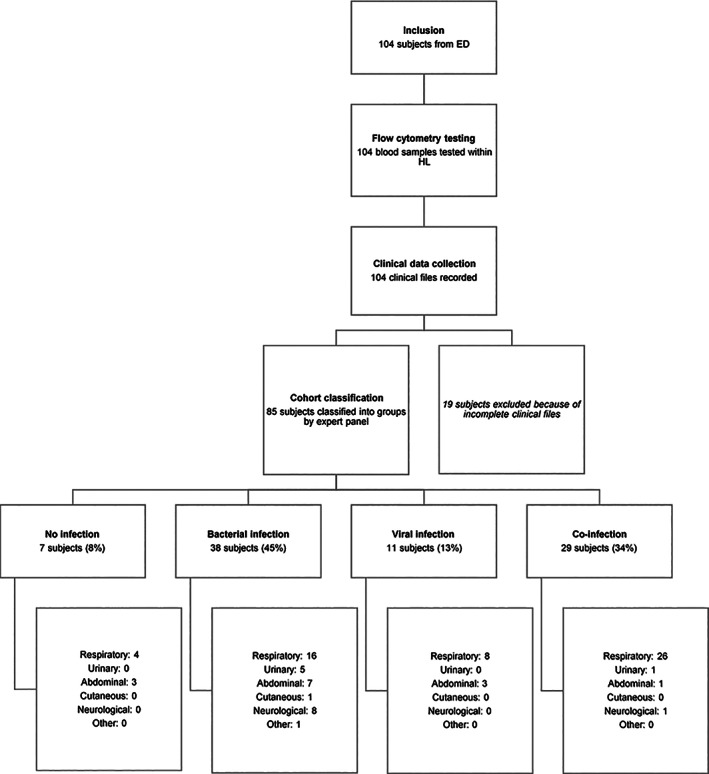
Overview of the study workflow. Representation of each step of the study, conducted between the Emergency Department (ED) and the Hematology Laboratory (HL) of La Timone Hospital, with final numbers of included and excluded subjects, and details about clinical kinds of symptoms
3.2. Clinical epidemiology and biomarker levels
The final first cohort consisted of 85 patients. Their epidemiological, clinical, and biological data are presented in Table 1.
TABLE 1.
Cohort study characteristics
| Variable | Characteristic | No infections (n = 7) | Bacterial infections (n = 38) | Viral infections (n = 11) | Co‐infections (n = 29) | p‐value |
|---|---|---|---|---|---|---|
| Demographics | ||||||
| Patient sex | Female | 0 (0%) | 18 (47%) | 2 (18%) | 10 (34%) | 0.02* |
| Male | 7 (100%) | 20 (53%) | 9 (82%) | 19 (66%) | ||
| Patient age | Years | 48 ± 9 | 56 ± 4 | 43 ± 7 | 63 ± 5 | 0.11 |
| Clinical history | Medical institutionalization | 0 (0%) | 1 (3%) | 0 (0%) | 1 (4%) | 0.80 |
| Altered mental status | 0 (0%) | 1 (3%) | 0 (0%) | 1 (4%) | 0.80 | |
| Evolutionary cancer | 0 (0%) | 1 (3%) | 0 (0%) | 0 (0%) | 0.65 | |
| Liver disease | 0 (0%) | 0 (0%) | 0 (0%) | 1 (4%) | 0.54 | |
| Congestive heart failure | 0 (0%) | 3 (8%) | 0 (0%) | 1 (4%) | 0.46 | |
| Cerebrovascular disease | 0 (0%) | 2 (5%) | 0 (0%) | 0 (0%) | 0.35 | |
| Constants | Systolic blood pressure (mm Hg) | 149 ± 10 | 128 ± 4 | 121 ± 8 | 136 ± 5 | 0.10 |
| Diastolic blood pressure (mm Hg) | 87 ± 6 | 69 ± 2 | 68 ± 5 | 72 ± 3 | 0.03* | |
| Average blood pressure (mm Hg) | 108 ± 7 | 89 ± 3 | 86 ± 5 | 94 ± 3 | 0.03* | |
| Pulse rate (bpm) | 85 ± 8 | 100 ± 3 | 108 ± 6 | 100 ± 4 | 0.17 | |
| Respiratory rate (b) | 16 ± 3 | 21 ± 1 | 18 ± 2 | 23 ± 1 | 0.04* | |
| Oxygen therapy | Initiated | 0 (0%) | 4 (11%) | 0 (0%) | 11 (38%) | <0.01* |
| Oxygen saturation (%) | 97 ± 2 | 97 ± 1 | 97 ± 1 | 95 ± 1 | 0.11 | |
| Fever | Body temperature (°C) | 38.6 ± 0.4 | 37.9 ± 0.2 | 38.6 ± 0.3 | 38.2 ± 0.2 | 0.12 |
| Duration (hours) | 29 ± 11 | 40 ± 5 | 49 ± 9 | 43 ± 6 | 0.57 | |
| Physiology and symptomatology | ||||||
| Clinical symptoms | Respiratory | 4 (57%) | 16 (42%) | 8 (73%) | 26 (90%) | 0.01* |
| Abdominal | 3 (43%) | 7 (18%) | 3 (27%) | 1 (4%) | ||
| Neurological | 0 (0%) | 8 (21%) | 0 (0%) | 1 (4%) | ||
| Urinary | 0 (0%) | 5 (13%) | 0 (0%) | 1 (4%) | ||
| Cutaneous | 0 (0%) | 1 (3%) | 0 (0%) | 0 (0%) | ||
| Other | 0 (0%) | 1 (3%) | 0 (0%) | 0 (0%) | ||
| X‐ray examinations (chest X‐ray, ultrasound, CT scan) | Performed | 7 (100%) | 31 (82%) | 5 (45%) | 25 (86%) | 0.02* |
| Atypical | 3 (43%) | 22 (58%) | 3 (27%) | 17 (59%) | 0.26 | |
| Antibiotic therapy | Initiated | 4 (80%) | 36 (97%) | 4 (36%) | 23 (85%) | <0.01* |
| Outcome | Released home | 4 (57%) | 15 (39%) | 8 (73%) | 5 (17%) | 0.01* |
| Conventional hospitalization | 2 (29%) | 23 (61%) | 3 (27%) | 22 (76%) | ||
| Critical care hospitalization | 1 (14%) | 0 (0%) | 0 (0%) | 2 (7%) | ||
| Hospitalization | Duration (days) | 4 ± 3 | 5 ± 1 | 2 ± 2 | 6 ± 2 | 0.49 |
| Biology and Biochemistry | ||||||
| Biological Measurements | CRP (mg/mL) | 12 ± 30 | 99 ± 13 | 39 ± 24 | 84 ± 13 | 0.02* |
| PCT (ng/mL) | 0.03 ± 1.32 | 0.58 ± 0.37 | 0.49 ± 1.32 | 0.76 ± 0.50 | 0.96 | |
| White blood cells (G/L) | 11 ± 2 | 13 ± 1 | 7 ± 2 | 10 ± 1 | 0.02* | |
| Polymorphonuclear cells (G/L) | 6 ± 3 | 11 ± 1 | 5 ± 3 | 8 ± 2 | 0.11 | |
| Biochemical constants | Urea (mmol/L) | 5 ± 2 | 6 ± 1 | 5 ± 1 | 8 ± 1 | 0.09 |
| Sodium (mmol/L) | 139 ± 2 | 138 ± 1 | 138 ± 1 | 138 ± 1 | 0.99 | |
| Glucose (mmol/L) | 6 ± 4 | 8 ± 2 | 7 ± 3 | 7 ± 2 | 0.93 | |
| Hematocrit (%) | 44 ± 2 | 38 ± 1 | 44 ± 2 | 41 ± 1 | <0.01* | |
| Hemoglobin (g/L) | 132 ± 9 | 128 ± 4 | 149 ± 7 | 141 ± 4 | 0.03* | |
| Flow cytometry | nCD64 | 1.1 ± 0.5 | 2.7 ± 0.2 | 1.5 ± 0.3 | 1.9 ± 0.2 | <0.01* |
| mCD169 | 5.5 ± 3.3 | 5.4 ± 1.4 | 24.7 ± 2.7 | 16.6 ± 1.6 | <0.01* | |
Note: Clinical and biological data for non‐, bacterially, virally, and co‐infected subjects. Values are presented either as mean ± SD or as number with percentage. Variables for which p values were less than α = 5% are indicated in bold with * to indicate statistically significant differences between groups.
In total, 30 (35%) women and 55 (65%) men (p: 0.02) were included, with a mean age of 56 (±25) years (p: 0.11). No significant differences between groups were observed for clinical histories and features of the patients, except for diastolic (p: 0.03) and average (p: 0.03) blood pressures, respiratory rate (p: 0.04), and number of initiated oxygen therapy (p < 0.01). Overall, patients had a mean elevated body temperature (38.1 ± 1.1°C), but temperature was not significantly different between groups (p: 0.12).
A wide range of infectious symptoms was observed among groups (respiratory, abdominal, neurological, urinary, cutaneous, and other). The most common clinical presentation associated with bacterial (n = 16; 42%), viral (n = 8; 73%), and co‐ (n = 26; 90%) infections was respiratory. As expected, based on symptoms, patients diagnosed as having bacterial or co‐infections were treated more frequently with antibiotics (p < 0.01), and X‐ray examinations were performed more frequently (p: 0.02). After their ED medical consultation, 32 patients (38%) could have been released home, but 53 patients (62%) were admitted to hospital specialized departments or the critical care department for longer observation. However, all patients that were kept at the hospital for observation remained for a non‐significantly different duration (p: 0.49).
Finally, comparison of biochemical and biological measurements showed significant differences between groups for WBC count (p: 0.02), hematocrit (p < 0.01) and hemoglobin (p: 0.03) levels. CRP (p: 0.02) but not PCT (p: 0.96) was significantly different among groups.
Overall, 94 common pathogen species were detected (Table 2). The most frequent pathogens were Streptococcus pneumoniae (38%) and Flu A virus (26%).
TABLE 2.
Identification of pathogens in the cohort
| Pathogen identified | Number isolated (n = 94) |
|---|---|
| Respiratory | |
| Streptococcus pneumoniae | 36 (38%) |
| Flu A virus | 24 (26%) |
| Human Respiratory Syncytial Virus | 5 (6%) |
| Rhinovirus | 3 (3%) |
| Mycoplasma pneumoniae | 1 (1%) |
| Legionella | 1 (1%) |
| Pseudomonas aeruginosa | 1 (1%) |
| Streptococcus oralis | 1 (1%) |
| Acinetobacter iwoffi | 1 (1%) |
| Coxiella Burnetti | 1 (1%) |
| Urinary | |
| Escherichia coli | 8 (9%) |
| Cytomegalovirus | 2 (2%) |
| Chlamydia | 1 (1%) |
| Proteus mirabilis | 1 (1%) |
| Gastrointestinal | |
| Enterococcus faecalis | 1 (1%) |
| Norovirus | 1 (1%) |
| Campylobacter jejuni | 1 (1%) |
| Yersinia | 1 (1%) |
| Shighella | 1 (1%) |
| Salmonella | 1 (1%) |
| Other Gram Negative Bacillus | 1 (1%) |
| Cutaneous | |
| Morexella osloensis | 1 (1%) |
Note: Name and number (percentage in brackets) of isolated bacteria and viruses in the whole cohort.
In comparison to non‐infected subjects (nCD64 MFI of 1.1 ± 0.5; mCD169 MFI of 5.5 ± 3.3), nCD64 level was elevated in patients with bacterial (MFI of 2.7 ± 0.2) and co‐infections (MFI of 1.9 ± 0.2; p < 0.01) whereas mCD169 level was increased in patients with viral (MFI of 24.7 ± 2.7) and co‐infections (MFI of 16.6 ± 1.6; p < 0.01). Example of flow cytometry results is shown in Figure S1. Biomarker levels in the different groups of patients are shown in Figure 2.
FIGURE 2.
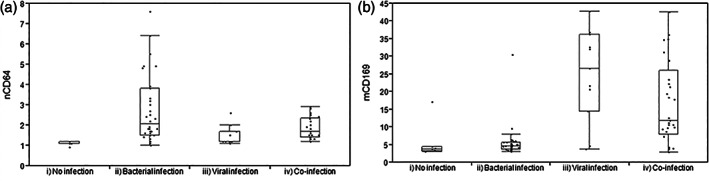
Biomarker levels for the four groups of patients. (A) nCD64 and (B) mCD169 levels of expression in patients with (i) no infection (control group), (ii) bacterial infection, (iii) viral infection, or (iv) co‐infection
3.3. Biomarker ROC analysis
ROC analysis of both biomarkers was made for evaluating their performance to identify the bacterial or viral etiology of an infection (Figure 3). Ability to discriminate bacterial infections was determined on patients presenting with bacterial infections only plus bacterial co‐infections (Group II + Group IV) in comparison to patients without bacterial infections (Group I + Group III). Ability to discriminate viral infections was determined on patients presenting with viral infections only plus viral co‐infections (Group III + Group IV) in comparison to patients without viral infections (Group I + Group II).
FIGURE 3.
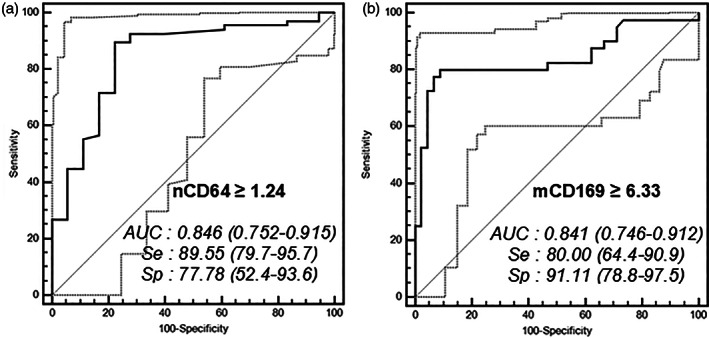
ROC analysis. ROC curves for the discrimination of bacterial infections with (A) nCD64 and of viral infections with (B) mCD169. Optimal thresholds for each biomarker are indicated with calculated values of specificity (Sp) and sensitivity (Se). Area under the curve (AUC) and 95% confidence interval are also given for each ROC analysis. Confidence interval curves are shown as light gray dotted lines
Using a cutoff point of greater than or equal to 1.24 for patients with bacterial infections, the results indicated that the nCD64 MFI showed a sensitivity of 90% (80–96%), specificity of 78% (52–94%), positive likelihood ratio of 4.03 (1.7–9.6), and negative likelihood ratio of 0.13 (0.06–0.3). The area under the curve was of 0.85 (0.75–0.92).
Using a cutoff point of greater than or equal to 6.33 for patients with viral infections, the results showed that the mCD169 MFI exhibited a sensitivity of 80% (64–91%), specificity of 91% (79–98%), positive likelihood ratio of 9.00 (3.5–23.2), and negative likelihood ratio of 0.22 (0.1–0.4). The area under the curve was of 0.84 (0.75–0.91).
3.4. Biomarkers during CoVID‐19 pandemic
In order to demonstrate the relevance of both biomarkers to discriminate patients in the Emergency Department in an epidemic context, 76 additional SARS‐CoV‐2 RT‐PCR positive samples were analyzed.
A total of 39 (51%) women and 37 (49%) men, with a mean age of 60 (±18) years and mean PCR level of 24.9 (±5.9) cycles, were included consecutively over a 3‐day period and compared to 48 healthy blood bank donors (Figure 4). Patients with CoVID‐19 reported symptoms for an average of 5.5 (±4.4) days. They suffered from representative comorbidities of CoVID‐19: high blood pressure (n = 31; 41%), cardiovascular diseases (n = 28; 37%), organ failure (n = 25; 33%), obesity (n = 18; 24%), diabetes (n = 16; 21%), asthma (n = 10; 13%), respiratory disorders (n = 9; 12%), progressive cancer (n = 8; 11%), smoking (n = 7; 9%), neurological disorders (n = 6; 8%), chronic obstructive pulmonary disease (n = 5; 7%), and autoimmune diseases (n = 2; 3%).
FIGURE 4.
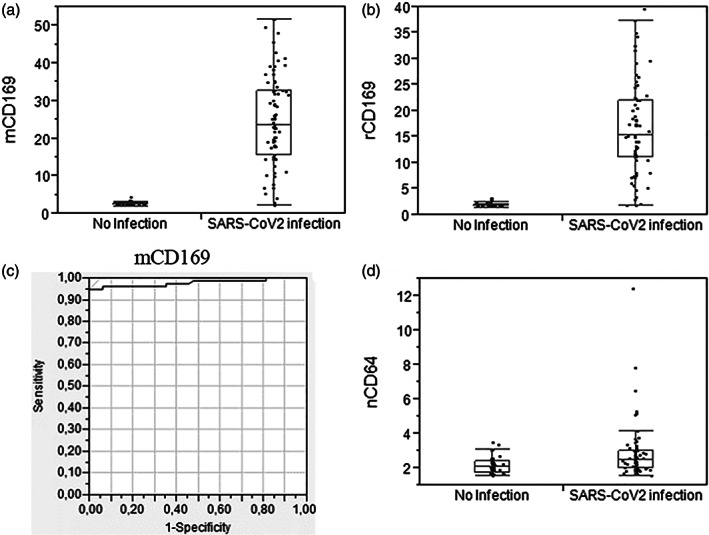
Biomarker levels and ROC analysis for SARS‐CoV‐2 infections. mCD169 (A) level, (B) ratio, and (C) ROC analysis for patients with SARS‐CoV‐2 infections, in comparison to healthy volunteers. (D) nCD64 level for the same patients
Patients with SARS‐CoV‐2 infections had a significantly higher mCD169 (MFI of 24.6 ± 12.2; p < 0.01) and rCD169 (ratio of 16.5 ± 9.0; p < 0.01) levels than healthy volunteers (mCD169 MFI of 2.6 ± 0.5; rCD169 ratio of 1.9 ± 0.4). ROC analysis showed that mCD169 MFI exhibited sensitivity of 95% and specificity of 100%, when using a cutoff point of greater than or equal to 5.34 for patients with CoVID‐19 infections. The area under the curve was of 0.98.
As expected for a viral infection, nCD64 level was rarely increased.
4. DISCUSSION
This study aimed to investigate the value of nCD64 and mCD169 biomarkers in a population of patients with febrile symptoms in a clinical context of the ED, using a new procedure of flow cytometry. Assessment of their levels, in non‐infected, bacterially‐infected, virally‐infected or co‐infected subjects, during flu or CoVID‐19 epidemics, demonstrated, within this study, their relevance for identifying etiology of infections.
In this new study, the first part included a total of 85 subjects, divided into four diagnostic outcomes: not‐, bacterially‐, virally‐ or co‐infected subjects. Among these groups, each outcome was always represented by more than 10 subjects. Moreover, almost all cases were confirmed by a bacterial or viral isolate in biological samples (22 different pathogens found among 94 isolates). As patients were included during flu season, the most frequent pathogens were respiratory: S. pneumoniae, Flu A virus, and Human Respiratory Syncytial Virus. These pathogens are commonly expected during this period, as has been reported. 5 The second part of the study presented a total of 124 patients, including 76 subjects with confirmed SARS‐CoV‐2 infections by RT‐PCR and 48 healthy volunteers.
CD64 on neutrophils and CD169 on monocytes were the two main biomarkers assessed in the study by flow cytometry for discriminating between bacterial versus viral infections. Expressions of these two biomarkers have been shown to be directly induced, within hours, by interferons produced by the body in response to pathogen detection. 14 Ability of nCD64 to discriminate between bacterial and non‐bacterial infections has been largely demonstrated for years, 17 whereas mCD169 increase after infection by viruses has only been described recently. mCD169 seems to be a general biomarker of acute viral infections since it has been found in patients with HIV, 16 , 18 , 19 EBV, 20 RSV, 21 CMV, 22 dengue, 23 , 24 Zika, 25 noroviruses, 26 Lassa, and Marburg. 27 Here, high levels of mCD169 have been observed for the first time for Flu A virus.
High levels of sensitivity and specificity were found in the study for both biomarkers. Interestingly, nCD64 showed a better sensitivity of 90% than specificity of 78%, whereas mCD169 showed a better specificity of 91% than sensitivity of 80%. These results further demonstrate their valuable use for infection etiology guidance in ED settings for patient triage. Indeed, a biomarker used for bacterial infection identification in ED needs to be as sensitive as possible to detect the majority of cases, demonstrating at least 90% sensitivity, as any missing case could delay patient from receiving appropriate antibiotic therapy, and thus increase their risk of developing sepsis and progression to death. Conversely, a viral marker in ED has to be very specific to ensure the etiology, with at least 90% specificity, as it allows the practitioner to discharge the patient, as well as avoiding the empirical use of antimicrobial drugs in case they are not required. 28
The global health issue of overuse of antibiotics has been illustrated in this study: the epidemiological data showed that an antibiotic therapy was initiated in 67 out of 85 patients. Examining the whole cohort, 36 out of 38 subjects with bacterial infections, and 23 out of 29 co‐infected with bacteria and viruses, appropriately received antibiotics. Conversely, 4 out of the 11 subjects virally infected only, and 4 out 7 not‐infected subjects, received antibiotics, cases where antibiotics are ineffective, or even worse, might be dangerous. 29 As a consequence of their usefulness for determining etiology, both biomarkers could be incorporated as part of the overall clinical management of patients with fever, and used for evaluation of antibiotic therapy initiation, duration and end. 30
When studied in a second cohort of CoVID‐19 patients, mCD169 was found elevated in 95% of patients with SARS‐CoV‐2 infections and remained at normal level in 100% of healthy volunteers. The biomarker levels in both groups were equivalent to those obtained during the flu period (mCD169 mean MFI around 25 for infected patients and around four for healthy donors). ROC analysis also confirmed similar performances (100% specificity and 95% sensitivity using a similar threshold around six). These results thus reinforced mCD169 value for patient triage in Emergency Department during epidemics.
Of the four CD169 negative but RT‐PCR positive patients, two had been symptomatic for more than 10 days and had a very low RT‐PCR result (cycle thresholds at 30 and 32), compatible with the disappearance of the disease. The other two patients presented to the Emergency Department for unrelated reasons, were asymptomatic for CoVID‐19, and had a very low RT‐PCR result (cycle thresholds at 32 and 34). The RT‐PCR results are therefore questionable.
As expected in these virally infected patients, CD64 on neutrophils level remained low. A few patients had an increased level that could indicate a bacterial co‐infection or could also be related to the severity of the disease, as it has been described an interferon‐gamma release during the inflammation phase. 31
This combination of biomarker is thus promising for the triage of patients at the Emergency Department in the routine and also during current epidemics such as flu or CoVID‐19, and could probably be directly applied to any new emergent infectious disease.
Other promising biomarkers had been included in the flow cytometry panels, and thus analyzed concomitantly: HLA‐DR on monocytes, CD64 on monocytes, and HLA‐ABC ratio of monocytes/neutrophils in the first part of the study. 13 They showed weak performances to identify bacterial or viral infections in these cohorts (Figure S2).
Finally, one major issue remaining is how to measure the biomarkers in ED clinical practice. The ED environment is complex and dynamic, and thus requires technologies tailored specifically for prevention, diagnosis, and outcome of infection, to enhance patient safety in emergency care. A new solution was demonstrated by assessing the levels of expression of the markers using an innovative, 15‐min, one‐step method of flow cytometry. 12 This procedure may meet the minimum characteristics required for a bacterial versus viral bedside test, as targeted by Dittrich team 11 : (1) the use of a capillary blood drop could be potentially used as only 5 μl are necessary, although EDTA blood samples were used here; (2) reagent storage and laboratory procedures are carried out at room temperature; and (3) all steps for testing the samples are combined into one step, with no specific material or training needed. In summary, this assay yields results in less than 15 min from initial blood collection, with discriminative power greater than other currently existing tests. In this study, we used a regular flow cytometer in the hematology laboratory; of course, we envision for future applications at the point‐of‐need the use of a benchtop flow cytometer, with automatized standardization and analysis, allowing a 24/7 access to non‐expert personals.
The study has other limitations. First, patients were enrolled only within one ED from one hospital, and their number remained limited. Thus, even if a good representation of the most common infections was achieved, it is not sufficient to provide a complete validation of biomarkers and the calculated specificity and sensitivity must be considered as preliminary. In future studies, it might be preferred to extend the study to other ED from other hospitals. Secondly, biomarkers seemed to be useful for infected patients, but their kinetics are not well known. It is important to understand their delay of onset after infection and their sequential evolution in blood circulation. Future research should thus focus on measuring these biomarkers on sequential samples from same subjects, and evaluating their prognostic value, both for bacterial versus viral infection diagnosis and for therapy duration.
5. CONCLUSION
In summary, CD64 and CD169 were confirmed to be biomarkers of interest to predict bacterial versus viral infection causes of fever. Flow cytometry is currently the universally applied method for identifying cell surface markers, but in this context, its availability remains limited in emergency settings. As part of a global effort to reduce inappropriate antibiotic use, this study makes available the measurement of infection‐related biomarkers using a new flow cytometry procedure, promisingly applicable at the point‐of‐care. This association of infection related biomarkers and flow cytometry is promising to facilitate an easy, rapid and robust discrimination of bacterial versus viral infections and thus the successful care of patients with potential infection presenting to the Emergency Department.
AUTHOR CONTRIBUTIONS
Penelope Bourgoin: Conceptualization; data curation; formal analysis; funding acquisition; investigation; methodology; software; validation; writing‐original draft; writing‐review & editing. Thomas Soliveres: Data curation; formal analysis; investigation; writing‐review & editing. alexandra Barbaresi: Data curation; formal analysis; investigation; writing‐review & editing. Anderson Loundou: Data curation; formal analysis; investigation; writing‐review & editing. Inès Ait Belkacem: Data curation; formal analysis; investigation; writing‐review & editing. Isabelle Arnoux: Conceptualization; data curation; methodology; project administration; supervision; validation; writing‐review & editing. Denis Bernot: Data curation; formal analysis; investigation; writing‐review & editing. Marie Loosveld: Methodology; project administration; validation; writing‐review & editing. Pierre‐Emmanuel Morange: Conceptualization; project administration; resources; supervision; validation; writing‐review & editing. Pierre Michelet: Conceptualization; methodology; project administration; resources; supervision; validation; writing‐review & editing. Fabrice Malergue: Conceptualization; data curation; formal analysis; investigation; methodology; project administration; supervision; validation; writing‐original draft; writing‐review & editing. Thibaut Markarian: Conceptualization; data curation; formal analysis; investigation; methodology; project administration; resources; validation; writing‐original draft; writing‐review & editing.
CONFLICT OF INTEREST
Fabrice Malergue, Inès Ait Belkacem and Pénélope Bourgoin are Beckman Coulter employees.
ETHICS STATEMENT
The authors state that they have followed the principles outlined in the Declaration of Helsinki for all human experimental investigations. Routine care of the subjects was not modified; analyses were performed on anonymized blood left over, and all data collected in the study were part of routine clinical practice and retrieved from subject records. Results of the study had no influence on subjects' management.
This observational and noninterventional prospective study was approved by the La Timone Hospital Ethical Committee and the Committee for Protection of Persons (CPP approval no. 181160; ID‐RCB approval no. 2018 A02706‐49; ClinicalTrials.gov Identifier NCT03912870).
DATA AVAILABILITY STATEMENT
The authors certify that this manuscript reports original clinical research data. Individual data that underlie the results reported in this article are available from the corresponding author following publication, including the study report and study protocol. Additional data are available upon reasonable request.
Supporting information
MIFlowCyt: Item checklist.
Figure S1 Biomarkers expressions in whole blood. Leucocytes were gated using Side Scatter (SSC) and CD64 expressions, as lymphocytes (low SSC, CD64−; in black), monocytes (intermediate SSC, CD64+; in red) and neutrophils (high SSC; in blue). Examples of CD169 and CD64 expressions on leucocytes were given for three subjects: (A) one first healthy volunteer whole blood, (B) 1 s viral‐infected whole blood, and (C) one third bacterial infected whole blood.
Figure S2 Other biomarkers. (A) mHLA‐DR, (B) mCD64, and (C) rHLA‐ABC levels of expression in patients with (i) no infection (control group), (ii) bacterial infection, (iii) viral infection, or (iv) co‐infection, in the first part of the study. (D) mHLA‐DR and mCD64 levels in patients with SARS‐CoV‐2 infections, in comparison to healthy volunteers, in the second part of the study.
ACKNOWLEDGMENTS
The authors would like to thank the technician team from the La Timone University Hospital Hematology Laboratory for their assistance in blood testing, the ANRT for funding the PhD grants, and Beckman Coulter for giving reagents used in the study.
Pénélope Bourgoin and Inès Ait Belkacem are recipient of CIFRE PhD grants (respectively n°2016/1368 and n°2018/1212) from the ANRT (National Agency for Research and Technology). This study was partially supported by Beckman Coulter through donations of the research reagents used in the study and participation of the two employees mentioned above. This private company had no role in the study design, or collection and interpretation of the clinical data. Beckman Coulter and the Beckman Coulter product and service marks mentioned herein are trademarks or registered trademarks of Beckman Coulter, Inc. in the United States of America and other countries. All other trademarks are the property of their respective owners.
Bourgoin P, Soliveres T, Barbaresi A, et al. CD169 and CD64 could help differentiate bacterial from CoVID‐19 or other viral infections in the Emergency Department. Cytometry. 2021;99:435–445. 10.1002/cyto.a.24314
Funding information Association Nationale de la Recherche et de la Technologie, Grant/Award Numbers: 2018/1212, n°2016/1368
REFERENCES
- 1. Ray P, Badarou‐Acossi G, Viallon A, Boutoille D, Arthaud M, Trystram D, et al. Accuracy of the cerebrospinal fluid results to differentiate bacterial from non bacterial meningitis, in case of negative gram‐stained smear. Am J Emerg Med. 2007;25:179–84. [DOI] [PubMed] [Google Scholar]
- 2. Kutz A, Florin J, Hausfater P, Amin D, Amin A, Haubitz S, et al. Predictors for delayed emergency department care in medical patients with acute infections – an international prospective observational study. PLoS ONE. 2016;11:e0155363. [DOI] [PMC free article] [PubMed] [Google Scholar]
- 3. Hausfater P, Juillien G, Madonna‐Py B, Haroche J, Bernard M, Riou B. Serum procalcitonin measurement as diagnostic and prognostic marker in febrile adult patients presenting to the emergency department. Crit Care. 2007;11:R60. [DOI] [PMC free article] [PubMed] [Google Scholar]
- 4. Ray P, Birolleau S, Lefort Y, Becquemin M‐H, Beigelman C, Isnard R, et al. Acute respiratory failure in the elderly: etiology, emergency diagnosis and prognosis. Crit Care. 2006;10:R82. [DOI] [PMC free article] [PubMed] [Google Scholar]
- 5. Cuquemelle E, Soulis F, Villers D, Roche‐Campo F, Ara Somohano C, Fartoukh M, et al. Can procalcitonin help identify associated bacterial infection in patients with severe influenza pneumonia? A multicentre study. Intensive Care Med. 2011;37:796–800. [DOI] [PMC free article] [PubMed] [Google Scholar]
- 6. Younes N, Al‐Sadeq DW, AL‐Jighefee H, Younes S, Al‐Jamal O, Daas HI, et al. Challenges in laboratory diagnosis of the novel coronavirus SARS‐CoV‐2. Viruses. 2020;12 :1–27. https://www.ncbi.nlm.nih.gov/pmc/articles/PMC7354519/. Accessed October 27, 2020. [DOI] [PMC free article] [PubMed] [Google Scholar]
- 7. Tang BM, Eslick GD, Craig JC, McLean AS. Accuracy of procalcitonin for sepsis diagnosis in critically ill patients: systematic review and meta‐analysis. Lancet Infect Dis. 2007;7:210–7. [DOI] [PubMed] [Google Scholar]
- 8. Uzzan B, Cohen R, Nicolas P, Cucherat M, Perret G‐Y. Procalcitonin as a diagnostic test for sepsis in critically ill adults and after surgery or trauma: a systematic review and meta‐analysis. Crit Care Med. 2006;34:1996–2003. [DOI] [PubMed] [Google Scholar]
- 9. Nijman RG, Vergouwe Y, Thompson M, van Veen M, van Meurs AHJ, van der Lei J, et al. Clinical prediction model to aid emergency doctors managing febrile children at risk of serious bacterial infections: diagnostic study. BMJ. 2013;346:f1706–6. [DOI] [PMC free article] [PubMed] [Google Scholar]
- 10. Le Bel J, Chenevier‐Gobeaux C, Blanc F‐X, Benjoar M, Ficko C, Ray P, et al. Diagnostic accuracy of C‐reactive protein and procalcitonin in suspected community‐acquired pneumonia adults visiting emergency department and having a systematic thoracic CT scan. Crit Care. 2015;19:366. [DOI] [PMC free article] [PubMed] [Google Scholar]
- 11. Dittrich S, Tadesse BT, Moussy F, Chua A, Zorzet A, Tängdén T, et al. Target product profile for a diagnostic assay to differentiate between bacterial and non‐bacterial infections and reduce antimicrobial overuse in resource‐limited settings: an expert consensus. PLoS One. 2016;11:e0161721. [DOI] [PMC free article] [PubMed] [Google Scholar]
- 12. Bourgoin P, Hayman J, Rimmelé T, Venet F, Malergue F, Monneret G. A novel one‐step extracellular staining for flow cytometry: proof‐of‐concept on sepsis‐related biomarkers. J Immunol Methods. 2019;470:59–63. [DOI] [PubMed] [Google Scholar]
- 13. Bourgoin P, Lediagon G, Arnoux I, Bernot D, Morange P‐E, Michelet P, et al. Flow cytometry evaluation of infection‐related biomarkers in febrile subjects in the emergency department. Future Microbiol. 2020;15:189–201. [DOI] [PubMed] [Google Scholar]
- 14. Bourgoin P, Biéchelé G, Ait Belkacem I, Morange P‐E, Malergue F. Role of the interferons in CD64 and CD169 expressions in whole blood: relevance in the balance between viral‐ or bacterial‐oriented immune responses. Immun Inflamm Dis. 2020;8:106–23. [DOI] [PMC free article] [PubMed] [Google Scholar]
- 15. Jämsä J, Ala‐Kokko T, Huotari V, Ohtonen P, Savolainen E‐R, Syrjälä H. Neutrophil CD64, C‐reactive protein, and procalcitonin in the identification of sepsis in the ICU—Post‐test probabilities. J Crit Care. 2018;43:139–42. [DOI] [PubMed] [Google Scholar]
- 16. van der Kuyl AC, van den Burg R, Zorgdrager F, Groot F, Berkhout B, Cornelissen M. Sialoadhesin (CD169) expression in CD14+ cells is Upregulated early after HIV‐1 infection and increases during disease progression. PLoS ONE. 2007;2:e257. [DOI] [PMC free article] [PubMed] [Google Scholar]
- 17. Xiong S‐D, Pu L‐F, Wang H‐P, Hu L‐H, Ding Y‐Y, Li M‐M, et al. Neutrophil CD64 index as a superior biomarker for early diagnosis of infection in febrile patients in the hematology department. Clin Chem Lab Med. 2017;55:82–90. [DOI] [PubMed] [Google Scholar]
- 18. Kim W‐K, McGary CM, Holder GE, Filipowicz AR, Kim MM, Beydoun HA, et al. Increased expression of CD169 on blood monocytes and its regulation by virus and CD8 T cells in macaque models of HIV infection and AIDS. AIDS Res Hum Retroviruses. 2015;31:696–706. [DOI] [PMC free article] [PubMed] [Google Scholar]
- 19. Rempel H, Calosing C, Sun B, Pulliam L. Sialoadhesin expressed on IFN‐induced monocytes binds HIV‐1 and enhances infectivity. PLoS One. 2008;3:1–9. [DOI] [PMC free article] [PubMed] [Google Scholar]
- 20. Farina A, Peruzzi G, Lacconi V, Lenna S, Quarta S, Rosato E, et al. Epstein‐Barr virus lytic infection promotes activation of Toll‐like receptor 8 innate immune response in systemic sclerosis monocytes. Arthritis Res Ther. 2017;19. Available at: https://www.ncbi.nlm.nih.gov/pmc/articles/PMC5331713/. Accessed December 2, 2019:39. [DOI] [PMC free article] [PubMed] [Google Scholar]
- 21. Jans J, Unger WWJ, Vissers M, Ahout IML, Schreurs I, Wickenhagen A, et al. Siglec‐1 inhibits RSV‐induced interferon gamma production by adult T cells in contrast to newborn T cells. Eur J Immunol. 2018;48:621–31. [DOI] [PMC free article] [PubMed] [Google Scholar]
- 22. Theobald SJ, Khailaie S, Meyer‐Hermann M, Volk V, Olbrich H, Danisch S, et al. Signatures of T and B cell development, functional responses and PD‐1 Upregulation after HCMV latent infections and reactivations in nod.Rag.Gamma mice humanized with cord blood CD34+ cells. Front Immunol. 2018;9 :1–21. https://www.ncbi.nlm.nih.gov/pmc/articles/PMC6262073/. Accessed December 2, 2019. [DOI] [PMC free article] [PubMed] [Google Scholar]
- 23. Green AM, Harris E. Monocyte‐plasmablast crosstalk during dengue. Cell Host Microbe. 2014;16:7–9. [DOI] [PMC free article] [PubMed] [Google Scholar]
- 24. Kwissa M, Nakaya HI, Onlamoon N, Wrammert J, Villinger F, Perng GC, et al. Dengue virus infection induces expansion of a CD14+CD16+ monocyte population that stimulates plasmablast differentiation. Cell Host Microbe. 2014;16:115–27. [DOI] [PMC free article] [PubMed] [Google Scholar]
- 25. Hirsch AJ, Smith JL, Haese NN, Broeckel RM, Parkins CJ, Kreklywich C, et al. Zika virus infection of rhesus macaques leads to viral persistence in multiple tissues. PLoS Pathog. 2017;13:e1006219. [DOI] [PMC free article] [PubMed] [Google Scholar]
- 26. Cutler AJ, Oliveira J, Ferreira RC, Challis B, Walker NM, Caddy S, et al. Capturing the systemic immune signature of a norovirus infection: an n‐of‐1 case study within a clinical trial. Wellcome Open Res. 2017;2. Available at: https://www.ncbi.nlm.nih.gov/pmc/articles/PMC5531165/. Accessed December 2, 2019:28. [DOI] [PMC free article] [PubMed] [Google Scholar]
- 27. Caballero IS, Yen JY, Hensley LE, Honko AN, Goff AJ, Lassa CJH. Marburg viruses elicit distinct host transcriptional responses early after infection. BMC Genomics. 2014;15. Available at: https://www.ncbi.nlm.nih.gov/pmc/articles/PMC4232721/. Accessed December 2, 2019:960. [DOI] [PMC free article] [PubMed] [Google Scholar]
- 28. Liang SY, Theodoro DL, Schuur JD, Marschall J. Infection prevention in the emergency department. Ann Emerg Med. 2014;64:299–313. [DOI] [PMC free article] [PubMed] [Google Scholar]
- 29. Ventola CL. The antibiotic resistance crisis. P T. 2015;40:277–83. [PMC free article] [PubMed] [Google Scholar]
- 30. Tang Z, Qin D, Tao M, Lv K, Chen S, Zhu X, et al. Examining the utility of the CD64 index compared with other conventional indices for early diagnosis of neonatal infection. Sci Rep. 2018;8:1–7. [DOI] [PMC free article] [PubMed] [Google Scholar]
- 31. Gadotti AC, de Castro Deus M, Telles JP, Wind R, Goes M, Garcia Charello Ossoski R, et al. IFN‐γ is an independent risk factor associated with mortality in patients with moderate and severe COVID‐19 infection. Virus Res. 2020;289:198171. [DOI] [PMC free article] [PubMed] [Google Scholar]
Associated Data
This section collects any data citations, data availability statements, or supplementary materials included in this article.
Supplementary Materials
MIFlowCyt: Item checklist.
Figure S1 Biomarkers expressions in whole blood. Leucocytes were gated using Side Scatter (SSC) and CD64 expressions, as lymphocytes (low SSC, CD64−; in black), monocytes (intermediate SSC, CD64+; in red) and neutrophils (high SSC; in blue). Examples of CD169 and CD64 expressions on leucocytes were given for three subjects: (A) one first healthy volunteer whole blood, (B) 1 s viral‐infected whole blood, and (C) one third bacterial infected whole blood.
Figure S2 Other biomarkers. (A) mHLA‐DR, (B) mCD64, and (C) rHLA‐ABC levels of expression in patients with (i) no infection (control group), (ii) bacterial infection, (iii) viral infection, or (iv) co‐infection, in the first part of the study. (D) mHLA‐DR and mCD64 levels in patients with SARS‐CoV‐2 infections, in comparison to healthy volunteers, in the second part of the study.
Data Availability Statement
The authors certify that this manuscript reports original clinical research data. Individual data that underlie the results reported in this article are available from the corresponding author following publication, including the study report and study protocol. Additional data are available upon reasonable request.