Abstract
A novel method for the preparation of antitumor drug vehicles has been optimized. Biological materials of chitosan oligosaccharide (CO) and γ‐polyglutamic acid (γ‐PGA) have previously been employed as modifiers to covalently modify graphene oxide (GO), which in turn loaded doxorubicin (DOX) to obtain a nano drug delivery systems of graphene oxide based composites (GO‐CO‐γ‐PGA‐DOX). The system was not equipped with the ability of initiative targeting, thus resulting into toxicity and side effects on normal tissues or organs. In order to further improve the targeting property of the system, the nucleic acid aptamer NH2‐AS1411 (APT) of targeted nucleolin (C23) was used to conjugate on GO‐CO‐γ‐PGA to yield the targeted nano drug delivery system APT‐GO‐CO‐γ‐PGA. The structure, composition, dispersion, particle size and morphology properties of the synthesized complex have been studied using multiple characterization methods. Drug loading and release profile data showed that APT‐GO‐CO‐γ‐PGA is provided with high drug loading capacity and is capable of controlled and sustained release of DOX. Cell experimental results indicated that since C23 was overexpressed on the surface of Hela cells but not on the surface of Beas‐2B cells, APT‐GO‐CO‐γ‐PGA‐DOX can target Hela cells and make increase toxicity to Hela cells than Beas‐2B cells, and the IC50 value of APT‐GO‐CO‐γ‐PGA‐DOX was 3.23±0.04 μg/mL. All results proved that APT‐GO‐CO‐γ‐PGA can deliver antitumor drugs in a targeted manner, and achieve the effect of reducing poison, which indicated that the targeted carrier exhibits a broad application prospect in the field of biomedicine.
Keywords: graphene oxide, NH2-AS1411, nucleolin, Targeted nano drug delivery systems
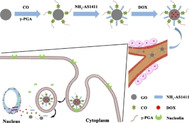
A nano drug delivery system able to enhance active targeting and therapeutic efficacy has been reported. Nucleic acid aptamer NH2‐AS1411 (APT) of targeted nucleolin (C23) was used to conjugate on GO‐CO‐γ‐PGA to yield the targeted nano drug delivery system APT‐GO‐CO‐γ‐PGA. The structure, composition, dispersion, particle size and morphology properties of the synthesized complex were analyzed via multiple characterization methods to find high drug loading capacity, the ability of controlled and sustained release of drugs, and the targeting to Hela cells.
1. Introduction
Nanotechnology is a powerful tool that among other applications allows the combination of anticancer drugs with nano drug carriers to form nano drug delivery systems. [1] Here, a particle dispersion system with particle size of 1–1000 nm composed of drugs and medicinal materials, including nanocapsules, nanospheres and nanoparticles has been prepared and investigated. The system can improve the solubility of drugs, especially refractory drugs, protect the drugs from the influence of internal environment, and prolong their action time in the body, thereby enhance the efficacy. [2] Various of natural polymer materials and synthetic polymers were used to construct drug carriers, such as chitosan, gelatin, dextran, polyethylene glycol, polylactic acid, and graphene. [3] However, there was no active targeting when the carriers were loaded with drugs. Therefore, in order to achieve the targeting function, some specific biomolecules can be connected to the vehicles. [4]
According to the receptors that possibly overexpressed on the tumor cell membrane, the ligands specifically combining with them were analyzed. On this basis, the ligands were binded to the nano drug carriers to construct the targeted nano drug delivery system. [5] The drugs can be concentrated in the tumor site to decrease cytotoxicity and other side effects on normal cells and improve the therapeutic effect through the interaction of receptor‐ligand. [6] Vitamin, protein, polysaccharide and integrin are common ligands. [7] At present, nucleic acid aptamer, single‐stranded DNA/RNA oligonucleotide fragment, is a ligand with good targeting properties, which can specifically bind to a variety of targeting substances (such as proteins, peptides, metal ions). [8] Chemical properties of the nucleic acid aptamers are relatively stable, and exhibit higher affinity and specificity than antibody. In recent years, aptamers functionalized drug delivery carriers are playing an increasingly important role in tumor therapy because of their good properties including biocompatibility, safety and targeting. [9]
AS1411 is one of the nucleic acid aptamers containing 26 bases and rich in guanine (G), which can form a reversed and parallel G4 structure to attach to the target protein nucleolin (C23). [10] C23 is the most important protein in the nucleolus of eukaryotic cells, which is related to nucleolus generation, cell growth, reproduction and ribosome synthesis. [11] In normal cells, C23 is mainly distributed in nucleus, while in tumor cells, it is not only distributed in the nucleus, but also overexpressed in the cell membrane. [12] Therefore, modification of the drug carrier with AS1411 can enhance the targeting to cancer cells. Tang et al. grafted the Cy5.5‐AS1411 to the mesoporous silica nanoparticles (MSN‐Dox@GO‐Apt), which had nucleolin specific targeting ability. [13] Sun et al. synthesized AS1411 connected SPION nanocarriers (Apt‐S8@SPION) to load DNM and TMPyP, which showed excellent toxicity to C26 cells and A549 cells. [14] Zhan et al. used AS1411 to modify DNA tetrahedron to obtain a new drug system, which can improve the therapeutic effect and targeting of breast cancer. [15] In this study, the application of an aminated aptamer NH2‐AS1411 (APT) to covalently modify the nano carrier GO‐CO‐γ‐PGA can identify the overexpressed C23 on the surface of Hela cells, therefore, the drug on which can be actively transported into Hela cells. It showed that in Scheme 1, APT was grafted onto the GO in the GO‐CO‐γ‐PGA complex via amidation to form APT‐GO‐CO‐γ‐PGA, the characterizations of which were measured by a variety of methods, and drug loading and release behaviors in vitro were investigated. In addition, the absorption, distribution and toxicity of the designed system were studied.
Scheme 1.
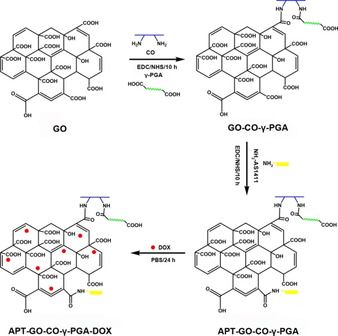
The Preparation Diagrammatic Sketch of APT‐GO‐CO‐γ‐PGA and APT‐GO‐CO‐γ‐PGA‐DOX.
2. Results and Discussion
2.1. Characterization of APT‐GO‐CO‐γ‐PGA
In order to certify the successful fabrication of APT‐GO‐CO‐γ‐PGA, characterization methods of fourier transform infrared spectroscopy (FTIR), X‐ray photoelectron spectroscopy (XPS), ultraviolet‐visible absorption spectra (UV‐Vis), Zeta potential determination and X‐ray diffraction (XRD) were used to measure the structure, composion, and dispersity characteristics of the prepared samples. Figure 1a shows that there are C=O stretching vibration peak (amideIbelt) at 1641 cm−1 and N−H bending vibration peak (amide II belt) at 1555 cm−1 in GO‐CO‐γ‐PGA. The FTIR absorptions of APT‐GO‐CO‐γ‐PGA reveal the characteristic peaks at 1637 cm−1 ascribed to C=O stretching vibration peak (amide I belt), and 1534 cm−1 corresponded to N−H bending vibration peak (amide II belt), and the strength of the two peaks increase. Compared with GO‐CO‐γ‐PGA, there appears a peak of C=O stretching vibration peak (ketogroup) at 1728 cm−1 in APT‐GO‐CO‐γ‐PGA, which was derived from guanine and thymidine of aptamer APT, and a peak of P=O stretching vibration peak at 1164 cm−1, which also comes from the aptamer. These results coincided with the studies of Rata et al. and Li et al. [16] Therefore, all results indicated that APT has been connected with GO‐CO‐γ‐PGA.
Figure 1.

(a) FTIR spectra of GO‐CO‐γ‐PGA and APT‐GO‐CO‐γ‐PGA. (b) XPS wide spectrum of APT‐GO‐CO‐γ‐PGA. (c) UV‐Vis absorption spectra of NH2‐AS1411, GO‐CO‐γ‐PGA and APT‐GO‐CO‐γ‐PGA. (d) Zeta potential of GO‐CO‐γ‐PGA and APT‐GO‐CO‐γ‐PGA. (e) XRD spectra of GO, GO‐CO‐γ‐PGA and APT‐GO‐CO‐γ‐PGA. (f) DLS spectra of GO‐CO‐γ‐PGA and APT‐GO‐CO‐γ‐PGA. (g) TEM image of GO‐CO‐γ‐PGA. (h) TEM image of APT‐GO‐CO‐γ‐PGA.
Figure 1b shows the full XPS spectra of APT‐GO‐CO‐γ‐PGA. As can be seen from the figure, APT‐GO‐CO‐γ‐PGA includes four chemical elements of C (285.8 eV), N (399.3 eV), O (532.1 eV) and P (133.6 eV). The content of each element is C 69.82 %, N 5.05 %, O 24.33 %, P 1.11 %, respectively. Since APT contains phosphorus element and GO‐CO‐γ‐PGA does not, it confirmed that the aptamer has been successfully attached to GO‐CO‐γ‐PGA, these results were similar to those of FTIR.
The UV‐Vis spectra of NH2‐AS1411, GO‐CO‐γ‐PGA and APT‐GO‐CO‐γ‐PGA are shown in Figure 1c. The characteristic absorption peak of APT is 254 nm. [17] Compared with GO‐CO‐γ‐PGA, the characteristic peak of APT‐GO‐CO‐γ‐PGA moves to the right and appears at 238 nm, which appeared a similar phenomenon to the investigation of Alibolandi et al, [18] indicting the presence of the new amide bond was formed between APT and GO‐CO‐γ‐PGA.
The successful combination of APT and GO‐CO‐γ‐PGA also can be proved by the data measured by Zeta potential analyzer. Figure 1d shows that after nucleic acid aptamer modification, the potential of APT‐GO‐CO‐γ‐PGA is −31.5±0.56 mV. Because APT is a single‐stranded DNA fragment with negative charge, the complex of APT combined with GO‐CO‐γ‐PGA has more negative charge than GO‐CO‐γ‐PGA (‐22.67±0.40 mV). [19] The results of Zeta potential indirectly confirmed that APT‐GO‐CO‐γ‐PGA was synthesized and showed excellent property of dispersion.
It can be seen from Figure 1e that the XRD characteristic peak of GO is 2θ=10.1°. When modified with CO and γ‐PGA, the characteristic peak of GO in GO‐CO‐γ‐PGA shifted to a smaller angle of 2θ=8.1° compared with GO, and it also appeared the characteristic peaks of CO and γ‐PGA (CO: 2θ=20.79° and γ‐PGA: 2θ=23.34°, see in Figure S1), but the intensity of the peaks was weaker than that of monomer CO, γ‐PGA and GO, which indicated that the three materials may be successfully compounded. After the modification of GO‐CO‐γ‐PGA with APT, the characteristic peak of GO shifted to a larger angle of 2θ=8.6° and the position of other characteristic peaks did not change, indicating that APT may successfully modify GO‐CO‐γ‐PGA.
The particle size and morphology of GO‐CO‐γ‐PGA and APT‐GO‐CO‐γ‐PGA were observed by dynamic light scattering (DLS) and transmission electron microscopy (TEM). The results were shown in Figure 1f‐h. After CO and γ‐PGA modification, GO was lamellar, with an average diameter of 305.1 nm. After APT modification, the diameter of GO‐CO‐γ‐PGA was increased to 319.1 nm, but it was still lamellar and showed good dispersion.
2.2. DOX Loading and Release In Vitro
In the present study, APT‐GO‐CO‐γ‐PGA, like the carrier of GO‐CO‐γ‐PGA, was loaded with DOX via π‐π bond. To verify the successful connection of DOX to APT‐GO‐CO‐γ‐PGA, the samples were characterized by FTIR and UV‐Vis. Figure S2 reveals the characteristic absorption peaks of DOX are C=O (carbonyl) stretching vibration peak at 1618 cm−1 and N−H stretching vibration peak at 1580 cm−1. The FTIR spectrum of APT‐GO‐CO‐γ‐PGA‐DOX appears the prominent peak of DOX and the characteristic peak at 1637 cm‐1 releated to C=O stretching vibration peak (amide I belt) of GO‐CO‐γ‐PGA. Figure S3 shows the UV‐Vis absorptions of DOX are 232 nm, 253 nm and 488 nm. [20] APT‐GO‐CO‐γ‐PGA has no absorption peak at 488 nm, while APT‐GO‐CO‐γ‐PGA‐DOX has obvious absorption peak at 488 nm, it confirmed that DOX has been loaded on APT‐GO‐CO‐γ‐PGA. In order to determine the drug loading capacity (DLC) of APT‐GO‐CO‐γ‐PGA, different concentrations of DOX solutions were used to react with the same amount APT‐GO‐CO‐γ‐PGA, and the results were presented in Figure 2a. With the increase of DOX concentration, the loading capacity of DOX on APT‐GO‐CO‐γ‐PGA also increased. When the DOX concentration was 1.4 mg/mL, the DCL of APT‐GO‐CO‐γ‐PGA was 1.2135 mg/mg, and which reached saturation. Thus the maximum DLC of DOX on APT‐GO‐CO‐γ‐PGA was 1.2135 mg/mg, which was higher than that of GO‐CO‐γ‐PGA.
Figure 2.
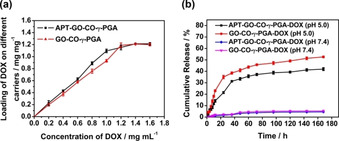
(a) The loading capacity of APT‐GO‐CO‐γ‐PGA and GO‐CO‐γ‐PGA‐DOX. (b) Cumulative release rate curves of APT‐GO‐CO‐γ‐PGA‐DOX and GO‐CO‐γ‐PGA‐DOX under different pH. (Values represent the means ±SD, the experiment was repeated three times).
We can verify whether APT‐GO‐CO‐γ‐PGA exhibited the effect of controlled and sustained release of DOX by measuring the cumulative release rate of APT‐GO‐CO‐γ‐PGA‐DOX under different pH conditions. As shown in Figure 2b, the cumulative release rate of APT‐GO‐CO‐γ‐PGA‐DOX at pH 5.0 was significantly higher than that at pH 7.4, and the drug was released rapidly before 24 h and slowly after 24 h. The cumulative release rate of APT‐GO‐CO‐γ‐PGA‐DOX reached the maximum under different pH conditions after 168 h with the cumulative release rate of 41.94 % at pH 5.0 and 4.52 % at pH 7.4. The experimental results showed that APT‐GO‐CO‐γ‐PGA can result in controlled and sustained release of DOX.
2.3. Cell Uptake Study
The fluorescence intensity of the drugs was measured by flow cytometry to reflect the absorption of the drugs in cells. Figure 3a shows that the fluorescence intensity of DOX, GO‐CO‐γ‐PGA‐DOX and APT‐GO‐CO‐γ‐PGA‐DOX in Beas‐2B cells are 68414, 71178 and 81139, respectively. Figure 3b reveals the fluorescence intensity of DOX, GO‐CO‐γ‐PGA‐DOX and APT‐GO‐CO‐γ‐PGA‐DOX in Hela cells are 97113, 108039 and 109363, respectively. These results showed that the fluorescence intensity of APT‐GO‐CO‐γ‐PGA‐DOX in both types of cells was higher than that of GO‐CO‐γ‐PGA‐DOX. Meanwhile, the fluorescence intensity of APT‐GO‐CO‐γ‐PGA‐DOX in Hela cells was higher than that of Beas‐2B cells, indicating that APT‐GO‐CO‐γ‐PGA‐DOX exhibited an obvious targeting effect on Hela cells.
Figure 3.
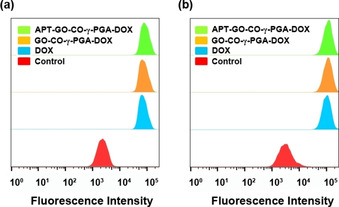
Flow cyctometry analyses of DOX uptake in (a) Beas‐2B cells and (b) Hela cells treated with DOX, GO‐CO‐γ‐PGA‐DOX and APT‐GO‐CO‐γ‐PGA‐DOX.
2.4. Intracellular Imaging
Figure 4a and Figure 4b are laser confocal images of Beas‐2B cells treated with GO‐CO‐γ‐PGA‐DOX and APT‐GO‐CO‐γ‐PGA‐DOX for 6 h. It can be seen from the figures that GO‐CO‐γ‐PGA‐DOX is mainly distributed in the cytoplasm and a small amount in the nucleus, while APT‐GO‐CO‐γ‐PGA‐DOX is mainly distributed in the nucleus and a little in the cytoplasm. Figure 4c and Figure 4d are laser confocal images of Hela cells incubated with GO‐CO‐γ‐PGA‐DOX and APT‐GO‐CO‐γ‐PGA‐DOX for 6 h. It is found that GO‐CO‐γ‐PGA‐DOX and APT‐GO‐CO‐γ‐PGA‐DOX are distributed in the nucleus and a small amount in the cytoplasm. Compared with GO‐CO‐γ‐PGA‐DOX, APT‐GO‐CO‐γ‐PGA‐DOX was less concentrated in cytoplasm, which confirmed that APT‐GO‐CO‐γ‐PGA‐DOX was equipped with higher drug delivery ability than GO‐CO‐γ‐PGA‐DOX, and it can target to Hela cells and increase the drug entry.
Figure 4.
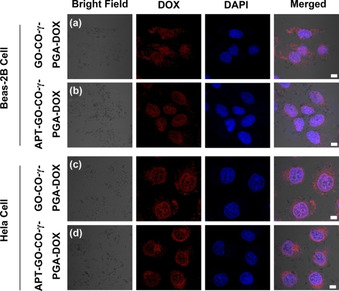
The drug distribution in Beas‐2B cells incubated with (a) GO‐CO‐γ‐PGA‐DOX and (b) APT‐GO‐CO‐γ‐PGA‐DOX for 6 h. The drug distribution in Hela cells incubated with (c) GO‐CO‐γ‐PGA‐DOX and (d) APT‐GO‐CO‐γ‐PGA‐DOX for 6 h.
2.5. Cytotoxicity Assay
Different concentrations of APT‐GO‐CO‐γ‐PGA were used to treat Beas‐2B cells and Hela cells for 24 h to measure the toxicity of APT‐GO‐CO‐γ‐PGA, and the survival status of the cells was observed. The results were shown in Figure 5a. When the concentration of APT‐GO‐CO‐γ‐PGA was up to 200 μg/mL, the survival rate of Beas‐2B cells and Hela cells were more than 80 %, indicating that APT‐GO‐CO‐γ‐PGA had good biological safety and could be used as carrier to deliver drugs. C23 is overexpressed on the surface of Hela cells while not expressed on the surface of Beas‐2B cells, thus, APT‐GO‐CO‐γ‐PGA‐DOX can target Hela cells. [21] To verify this characteristic, Beas‐2B cells and Hela cells were treated with different concentrations of APT‐GO‐CO‐γ‐PGA‐DOX, in which DOX and GO‐CO‐γ‐PGA‐DOX were used as controls. By comparing the experimental results in Figure 5b and Figure 5c, it can be found that DOX, GO‐CO‐γ‐PGA‐DOX and APT‐GO‐CO‐γ‐PGA‐DOX had higher toxic effects on Hela cells than Beas‐2B cells. In addition, APT‐GO‐CO‐γ‐PGA‐DOX was more toxic than GO‐CO‐γ‐PGA‐DOX in Hela cells, it demonstrated that APT‐GO‐CO‐γ‐PGA‐DOX showed a targeting effect on Hela cells. The IC50 value of APT‐GO‐CO‐γ‐PGA‐DOX to Hela cells was 3.23±0.04 μg/mL.
Figure 5.

(a) The effect of different concentration of unloaded APT‐GO‐CO‐γ‐PGA against Hela and Beas‐2B cells viability. (b) The effect of different concentration of DOX, GO‐CO‐γ‐PGA‐DOX and APT‐GO‐CO‐γ‐PGA‐DOX against Beas‐2B cells viability. (c) The effect of different concentration of DOX, GO‐CO‐γ‐PGA‐DOX and APT‐GO‐CO‐γ‐PGA‐DOX against Hela cells viability. (Values represent the means ±SD, the experiment was repeated three times)
3. Conclusion
We fabricated a new carrier of GO‐CO‐γ‐PGA in the previous work. In order to increase the targeting of the composite, APT was selected to modify GO‐CO‐γ‐PGA to obtain APT‐GO‐CO‐γ‐PGA, a nano drug carrier targeting to C23. The verifications of the modification were carried out by FTIR, XPS, UV‐Vis and Zeta potential. APT‐GO‐CO‐γ‐PGA was used to load DOX, and the maximum DLC was 1.2135 mg/mg, which was higher than that of GO‐CO‐γ‐PGA, and it exhibited the ability of controlled and sustained release of DOX. Cell experimental results reveled that APT‐GO‐CO‐γ‐PGA‐DOX had a targeting effect on Hela cells, could significantly enhance the therapeutic efficacy and its IC50 value to Hela cells was 3.23±0.04 μg/mL. We suggest paying attention to the toxicity and antitumor mechanism of APT‐GO‐CO‐γ‐PGA‐DOX in vivo in future. All results illustrated that APT‐GO‐CO‐γ‐PGA had potential value in targeted drug delivery.
Experimental Section
Materials
Graphene oxide was obtained from Su Zhou Hengqiu Graphene Technology Co., Ltd. Chitosan oligosaccharide and doxorubicin hydrochloride were provided by Dalian Meilun Biotechnology Co., Ltd. γ‐Polyglutamic acid was purchased from Xi'an Wanfang Biotechnology Co., Ltd. EDC and NHS were purchased from Shanghai Aladdin Reagent Co., Ltd. Nucleic acid aptamer NH2‐AS1411 (5’‐NH2‐GGTGGTGGTG GTTGTGGTGGTGGTGG‐3’) was synthesized by Sangon Biotech. MTT and DAPI were provided by Shanghai Yesen Biotechnology Co., Ltd. DMEM was obtained from Sangon Biothch. Hela cells and Beas‐2B cells were obtained from Shanghai Institute of Biochemistry and Cell Biology.
APT‐GO‐CO‐γ‐PGA Synthesis
In a typical procedure, 10 mg GO‐CO‐γ‐PGA was measured and dissolved in 10 mL 20 mM Tris‐HCl buffer containing 0.1 M KCl (pH 7.4), and followed by the sonication. 424 mg EDC and 636 mg NHS were added in turn, and ultrasound for 10 min. Then, the mixture was shaked and activated at 37 °C for 15 min. Added 10 μL (100 μM) APT to the solution and reacted for 10 h. Afterthat, centrifugal washing was performed, and the mixture dialyzed (MWCO=8‐14 KDa) in ultrapure water for 2 days.
Characterization
Characterization methods of FTIR, XPS, UV‐Vis, Zeta potential determination, XRD, TEM and DLS were used to analyze the properties of the samples. Laser confocal images were observed by two‐photon confocal laser microscope, and intracellular uptake investigation were performed by flow cytometry, microplate reader was used to measure the cytotoxicity.
Drug Loading Performance Study
40 mg APT‐GO‐CO‐γ‐PGA was dissolved in 40 mL PBS buffer (pH 7.4) via ultrasound, and the mixture was averagely divided into 8 parts. Then, 5 mL DOX solution was added to each APT‐GO‐CO‐γ‐PGA solution with concentrations of 0.2, 0.4, 0.6, 0.8, 1.0, 1.2, 1.4 and 1.6 mg/mL, respectively. The solutions were stirred at room temperature without light for 24 h, and the absorbance of supernatant was detected after centrifuging the unloaded drugs in a high speed centrifuge. The DLC was calculated according to the standard curve of DOX concentration‐absorbance (Figure S4) and the following formula:
| (1) |
Where mDOX represents the mass of initial drugs, m’DOX represents the mass of residual drugs in the solution after being loaded on APT‐GO‐CO‐γ‐PGA and mAPT‐GO‐CO‐γ‐PGA represents the mass of APT‐GO‐CO‐γ‐PGA.
In Vitro Drug Release Investigation
The DOX release investigations were performed in buffers with different pH. The steps are as follows, 5 mg APT‐GO‐CO‐γ‐PGA‐DOX was measured and dissolved in 5 mL PBS buffer (pH 7.4 and pH 5.0). Two solutions with different pH were put into dialysis bags and placed in PBS buffer, then the drugs were released at 37 °C. At regular time intervals, 4 mL release solution was collected, meanwhile, an equal volume of fresh PBS buffer was added. The absorbance of DOX released from APT‐GO‐CO‐γ‐PGA was evaluated, and the mass of which was calculated according to the standard curve of DOX concentration and absorbance.
Intracellular Uptake Studies
Beas‐2B cells and Hela cells were inoculated in 6‐well plates, respectively, and cultured at 37 °C, 5 % CO2, moist air for 24 h. Then, added DOX, GO‐CO‐γ‐PGA‐DOX and APT‐GO‐CO‐γ‐PGA‐DOX, respectively, and the final concentrations were 9.69 μg/mL (based on the DOX concentration), respectively. After treatment for 6 h, the cells were collected and fluorescence intensity was detected.
The distribution of GO‐CO‐γ‐PGA‐DOX and APT‐GO‐CO‐γ‐PGA‐DOX in different cells was observed by two‐photon laser confocal microscope. In brief, Hela cells and Beas‐2B cells were inoculated in 6‐well plates, respectively. After 24 hours of incubation, GO‐CO‐γ‐PGA‐DOX and APT‐GO‐CO‐γ‐PGA‐DOX were added, and their final concentrations were 3.23 μg/mL (based on the DOX concentration), respectively, and cultured for another 6 h. Subsequently, the Hela cells were immobilized by paraformaldehyde solution (4 % w/v), then washed with PBS buffer. Furthermore, DAPI was used to treat the wells for 10 min, then each well was washed with PBS buffer for three times. Finally, the samples were observed by two‐photon confocal laser microscopy.
In Vitro Cytotoxicity Study by MTT Assay
Beas‐2B cells and Hela cells were inoculated in 96‐well plates, and blank group, control group and experimental group were set up on each plate. After cultured for 24 hours, DOX, GO‐CO‐γ‐PGA‐DOX and APT‐GO‐CO‐γ‐PGA‐DOX with different concentrations were added and continued to incubate for 24 hours. 15 μL MTT was added and cultured for another 4 h. Sucked out the supernatant and added 100 μL DMSO in each well which can dissolve formazan crystals, and shaked for 3–5 min. The absorbance of peer well at 570 nm was measured by microplate reader and the cell viability was calculated via the following formula:
| (2) |
In the equations, Asample is the absorbance of the samples, Ablank is the absorbance of the blank group and Acontrol is the absorbance of the control group.
Conflict of interest
The authors declare no conflict of interest.
Supporting information
As a service to our authors and readers, this journal provides supporting information supplied by the authors. Such materials are peer reviewed and may be re‐organized for online delivery, but are not copy‐edited or typeset. Technical support issues arising from supporting information (other than missing files) should be addressed to the authors.
Supplementary
Acknowledgements
The authors thank the grant from Natural Science Foundation of Shandong Province (ZR2014CM020) and Qufu Normal University Research Innovation Team Fund (No.0230530).
B. Liu, W. Yang, C. Che, J. Liu, M. Si, Z. Gong, R. Gao, G. Yang, ChemistryOpen 2021, 10, 408.
References
- 1.
- 1a. Zha L. Q., Wang B. L., Qian J. J., J. Pharm. Pharmacol. 2020, 72, 496–506; [DOI] [PubMed] [Google Scholar]
- 1b. Ho Y. T., Poinard B., Kah J. C. Y., Nanomedicine 2016, 11, 693–714; [DOI] [PubMed] [Google Scholar]
- 1c. Ignjatovi N. L., Ninkov P., Sabetrasekh R., Uskokovi D. P., J. Mater. Sci. Mater. Med. 2010, 21, 231–239; [DOI] [PubMed] [Google Scholar]
- 1d. Yang Z., Yang D., Zeng K., Li D., Jin J., ACS Omega 2020, 5, 14437–14443. [DOI] [PMC free article] [PubMed] [Google Scholar]
- 2.
- 2a. Prasad M. S. C., Ajay M., Babu B. N., Prathyusha P., Audinarayana N., Reddy K. B., J. Pharm. Res 2011, 1381–1384; [Google Scholar]
- 2b. Tian R., Liang Y., Zhang X., Cui Y., Zhao Y., Zhang J., Liang X., Chen T., Shang Q., Lin X., Microsyst Technol 2015, 21, 2287–2296; [Google Scholar]
- 2c. Zhang W., Li C., Shen C., Drug Delivery 2015, 1–6; [Google Scholar]
- 2d. Liu D., Wang C., Yang J., An Y., Teng G., ACS Omega 2020, 5, 9316–9323. [DOI] [PMC free article] [PubMed] [Google Scholar]
- 3.
- 3a. Zhang S. Y., Yao W. U., Bin H. E., Luo K., Zhong G. U., Sci. China Chem. 2014, 57, 461–475; [Google Scholar]
- 3b. Biswas S., Kumari P., Lakhani P. M., Ghosh B., Eur. J. Pharm. Sci. 2016, 83, 184–202; [DOI] [PubMed] [Google Scholar]
- 3c. Zhang H. Y., Firempong C. K., Wang Y. W., Acta Pharmacol. Sin 2016, 834–844; [DOI] [PMC free article] [PubMed] [Google Scholar]
- 3d. Khodashenas B., Ardjmand M., Baei M. S. J., J. Inorg. Organomet. Polym. 2019, 29, 2186–2196; [Google Scholar]
- 3e. Kim H., Beack S., Han S., Adv. Mater. 2018, 30, 170–175. [DOI] [PubMed] [Google Scholar]
- 4.
- 4a. Hussien N. A., Işıklan N., Türk M., Mater. Chem. Phys. 2018, 211,479–488; [Google Scholar]
- 4b. Zhang J., Yang P. L., Gray N. S., Nat. Rev. Cancer 2009, 9, 28–39; [DOI] [PubMed] [Google Scholar]
- 4c. Alexiou C., Schmid R. J., Jurgons R., Kremer M., Wanner G., Bergemann C., Huenges E., Nawroth T., Arnold W., Parak F. G., Eur. Biophys. J. 2006, 35, 446–450. [DOI] [PubMed] [Google Scholar]
- 5.
- 5a. Wu Y. Y., Peck K., Chang Y. L., Pan S. H., Cheng Y. F., Lin J. C., Yang R. B., Hong T. M., Yang P. C., Oncogene 2011, 30, 3682–3693; [DOI] [PubMed] [Google Scholar]
- 5b. Min K. W., Zhang X., Imchen T., Baek S. J., Toxicol. Appl. Pharmacol. 2012, 263, 225–232; [DOI] [PMC free article] [PubMed] [Google Scholar]
- 5c. Gao L., Schwartzman J., Gibbs A., Lisac R., Kleinschmidt R., Wilmot B., Bottomly D., Coleman I., Nelson P., Mcweeney S., PLoS One 2013, 8, 76–79; [DOI] [PMC free article] [PubMed] [Google Scholar]
- 5d. Lin S., Wan S., Sun L., Hu J., Fang D., Zhao R., Yuan S., Zhang L., Cancer Ence 2012, 103, 904–912. [DOI] [PMC free article] [PubMed] [Google Scholar]
- 6.
- 6a. Walczak H., Cold Spring Harbor Perspect. Biol. 2013, 5, 8698; [DOI] [PMC free article] [PubMed] [Google Scholar]
- 6b. Potenza D., Vasile F., Belvisi L., Civera M., Araldi E. M. V., ChemBioChem 2011, 12, 653–653. [DOI] [PubMed] [Google Scholar]
- 7.
- 7a. Husseini G. A., Kanan S., Alsayah M., J Nano Nanotechnol 2016, 16, 1410–1414; [DOI] [PubMed] [Google Scholar]
- 7b. Schoeberl B., Faber A. C., Li D., Liang M. C., Wong K. K., Cancer Res. 2010, 70, 2485–2494; [DOI] [PMC free article] [PubMed] [Google Scholar]
- 7c. Zhong Y., Meng F., Deng C., Biomacromolecules 2014, 15, 1955–1969; [DOI] [PubMed] [Google Scholar]
- 7d. Gottschalk K., Angew. Chem. Int. Ed 2010, 41, 3767–3774. [DOI] [PubMed] [Google Scholar]
- 8.
- 8a. Tan Y., Shi Y. S., Wu X. D., Liang H. Y., Gao T. M., Acta Pharmacol Sin 2013, 34, 1491–1498; [DOI] [PMC free article] [PubMed] [Google Scholar]
- 8b. Huang Y. F., Chang H. T., Tan W., Anal. Chem. 2008, 80, 567–572; [DOI] [PubMed] [Google Scholar]
- 8c. Wang D. L., Song Y. L., Zhu Z., Li X. L., Zou Y., Yang H. T., Wang J. J., Yao P. S., Pan R. J., Yang C. J., Biochem. Biophys. Res. Commun. 2014, 453, 681–685; [DOI] [PubMed] [Google Scholar]
- 8d. Tang Z., Zhu Z., Mallikaratchy P., Yang R., Sefah K., Tan W., Chem. Asian J. 2010, 5, 783–786. [DOI] [PubMed] [Google Scholar]
- 9.
- 9a. Alibolandi M., Mohammadi M., Taghdisi S. M., Ramezani M., Abnous K., Carbohydr. Polym. 2017, 155, 218–229; [DOI] [PubMed] [Google Scholar]
- 9b. Zhou J. H., Rossi J., Drug Discovery 2017, 16, 181–202; [DOI] [PMC free article] [PubMed] [Google Scholar]
- 9c. Shiao Y. S., Chiu H. H., Wu P. H., ACS Appl. Mater. Interfaces 2014, 6, 21832–21841; [DOI] [PubMed] [Google Scholar]
- 9d. Tabasi A., Noorbakhsh A., Sharifi E., Biosens. Bioelectron. 2017, 95, 117–123. [DOI] [PubMed] [Google Scholar]
- 10.
- 10a. Zhan Y. X., Ma W. J., Zhang Y. X., ACS Appl. Mater. Interfaces 2019, 11, 15354–15365; [DOI] [PubMed] [Google Scholar]
- 10b. Shieh Y. A., Yang S. J., Wei M. F., Shieh M. J., ACS Nano 2010, 4, 1433–1442; [DOI] [PubMed] [Google Scholar]
- 10c. Reyes-Reyes E. M., Teng Y., Bates P. J., Cancer Res. 2010, 70, 8617–8629. [DOI] [PMC free article] [PubMed] [Google Scholar]
- 11.
- 11a. Hovanessian A. G., Puvion-Dutilleul F., Nisole S., Svab J., Perret E., Deng J. S., Krust B., Exp. Cell Res. 2000, 261, 312–328; [DOI] [PubMed] [Google Scholar]
- 11b. Huang Y., Shi H., Zhou H., Song X., Luo Y., Blood 2006, 107, 3564–3571; [DOI] [PubMed] [Google Scholar]
- 11c. Thun M. J., Henley S. J., Patrono C., J. Natl. Cancer Inst. 2002, 94, 252–266. [DOI] [PubMed] [Google Scholar]
- 12.
- 12a. Wang S., Chen X., Wang M., Yao D., Chen T., Yan Q., Lu W., Cell. Physiol. Biochem. 2018, 2174–2187; [DOI] [PubMed] [Google Scholar]
- 12b. Yuan X., Hu T., He H. J., Biomed. Sci. 2018, 25, 13. [DOI] [PMC free article] [PubMed] [Google Scholar]
- 13. Tang Y., Hu H., Zhang M. G., Song J., Chen X. S., Nanoscale 2015, 7. [Google Scholar]
- 14. Sun X., Liu B., Chen X. J., Mater. Sci.: Mater. Med 2019, 30, 76. [DOI] [PubMed] [Google Scholar]
- 15. Zhan Y. X., Ma W. J., Zhang Y. X., ACS Appl. Mater. Interfaces 2019, 11, 15354–15365. [DOI] [PubMed] [Google Scholar]
- 16.
- 16a. Rata D. M., Cadinoiu A. N., Atanase L. I., Mat. Sci. Eng. R 2019, 103, 109828; [DOI] [PubMed] [Google Scholar]
- 16b. Li J., Wang J., Sun D., Dai Y., Shen J., You J., Han C., Xu K., J. Biomed. Nanotechnol. 2016, 12, 1604–1616. [DOI] [PubMed] [Google Scholar]
- 17. Sun G. Y., Du Y. C., Cui Y., Wang J., Li X. Y., Tang A. N., Kong D. M., ACS Appl. Mater. Interfaces 2019, 11, 14684–14692. [DOI] [PubMed] [Google Scholar]
- 18. Alibolandi M., Mohammadi M., Taghdisi S. M., Ramezani M., Abnous K., Carbohydr. Polym. 2017, 155, 218–229. [DOI] [PubMed] [Google Scholar]
- 19. He Z. M., Zhang P. H., Li X., Zhang J. R., Zhu J. J., Rep 2016, 6, 22737. [DOI] [PMC free article] [PubMed] [Google Scholar]
- 20. Du F., Xu J., Fang Z., Wu S., Acta Chim. Sin. 2016, 74, 241–250. [Google Scholar]
- 21. Ugrinova I., Monier K., Ivaldi C., BMC Mol. Biol. 2007, 10, 66. [DOI] [PMC free article] [PubMed] [Google Scholar]
Associated Data
This section collects any data citations, data availability statements, or supplementary materials included in this article.
Supplementary Materials
As a service to our authors and readers, this journal provides supporting information supplied by the authors. Such materials are peer reviewed and may be re‐organized for online delivery, but are not copy‐edited or typeset. Technical support issues arising from supporting information (other than missing files) should be addressed to the authors.
Supplementary


