

Abstract
Background:
Experimental evidence and studies of children and adolescents suggest that ambient fine particulate matter [particulate matter in aerodynamic diameter ()] air pollution may be obesogenic, but the relationship between and the risk of body weight gain and obesity in adults is uncertain.
Objectives:
Our goal was to characterize the association between and the risks of weight gain and obesity.
Methods:
We followed 3,902,440 U.S. Veterans from 2010 to 2018 (median 8.1 y, interquartile range: 7.3–8.4) and assigned time-updated exposures by linking geocoded residential street addresses with satellite-based estimates of surface-level mass (at resolution). Associations with were estimated using Cox proportional hazards models for incident obesity [body mass index (] and a increase in weight relative to baseline and linear mixed models for associations with intra-individual changes in BMI and weight.
Results:
A higher average annual concentration was associated with risk of incident obesity [; (95% CI: 1.06, 1.11)] and the risk of a () increase in weight [ (95% CI: 1.06, 1.08)] and with higher intra-individual changes in BMI [ (95% CI: 0.139, 0.142)] and weight [ (95% CI: 0.955, 0.981)]. Nonlinear exposure–response models indicated associations at concentrations below the national standard of . As expected, a negative exposure control (ambient air sodium) was not associated with obesity or weight gain. Associations were consistent in direction and magnitude across sensitivity analyses that included alternative outcomes and exposures assigned at different spatial resolutions.
Discussion:
air pollution was associated with the risk of obesity and weight gain in a large predominantly male cohort of U.S. Veterans. Discussions about health effects of should include its association with obesity, and deliberations about the epidemiology of obesity should consider its association with . Investigation in other cohorts will deepen our understanding of the relationship between and weight gain and obesity. https://doi.org/10.1289/EHP7944
Introduction
Experimental evidence in animals suggests that ambient fine particulate matter [particulate matter in aerodynamic diameter ()] air pollution may be obesogenic (Madrigano et al. 2010; Sun et al. 2009; Xu et al. 2010; Zou 2010). For example, compared with mice exposed by inhalation to filtered air, mice exposed to exhibited increased subcutaneous and abdominal fat mass (Sun et al. 2009; Xu et al. 2010). Reports in children and adolescents suggest that exposure to higher levels of may be associated with adiposity and higher risk of weight gain (Bloemsma et al. 2019; de Bont et al. 2019; Jerrett et al. 2010, 2014; McConnell et al. 2015). However, to our knowledge, the associations between and the risks of body weight gain and obesity in adults have not been investigated. A greater understanding of the relationship between air pollution and the risks of weight gain and obesity—upstream risk factors for several noncommunicable diseases, including cardiovascular disease and diabetes—would enhance our understanding of the health effects of air pollution.
We hypothesized that exposure to higher levels of may increase the risk of weight gain and obesity. In this study, we built a large longitudinal cohort of 3,902,440 U.S. Veterans and followed them for a median of 8.1 y (27,628,688 total person-years) to investigate the relationship between and the risks of weight gain and obesity.
Methods
Cohort Construction
We built a cohort of U.S. Veterans from the U.S. Department of Veterans Affairs (VA) databases (Al-Aly et al. 2012; Bowe et al. 2017, 2018a, 2018b, 2019a, 2019b; Xie et al. 2016, 2017). We included Veterans who had at least one weight measurement recorded between 1 July 2010 and 31 June 2011 () (Figure S1) (Goodloe et al. 2017; Muthalagu et al. 2014; Noël et al. 2010). We then excluded weight measurements of () or () (resulting in 4,595,342 unique Veterans). Weight measurements that exceeded any other weight measurement within the year before to a year after its date of record by () were removed from measures in this time period (Goodloe et al. 2017). Of the resulting weight measurements left after application of these criteria (), the data of the first weight measurement was set as time zero (). To obtain a height value, we selected all heights for an individual Veteran that was available in VA records from 1999 to 2019. We then excluded height measurements of or in ( or ) and height measurements that varied more than () from the median value of all of the individual Veteran’s height measurements (Muthalagu et al. 2014); the median height was then taken, and those with no height measure were excluded (resulting in 4,528,288 Veterans remaining in the cohort).
Overall, 1.5% of Veterans were excluded from the cohort after applying data-cleaning criteria to weight and height measurements (Figure S1). Weight and height measurements were used to calculate body mass index (BMI) {[] (or weight in kilograms divided by the square of the height in meters)}, and Veterans with a BMI value outside the range of 10–80 were excluded () (Noël et al. 2010). We finally selected those Veterans who had data on all individual and contextual covariates and were linkable at baseline to data, excluding those where was not available for their residential location in the year prior to (e.g., Alaska), yielding an analytic cohort of 3,902,440 (Figure S1). Veterans were followed from until death or end of follow-up, 31 December 2018, and were interval censored when their residential location was not linkable to data, such as in instances where they moved outside the contiguous United States. Mortality and the date of death were obtained from the VA Vital Status file (Maynard C 2017). This study was approved by the Saint Louis Veterans Affairs Health Care System institutional review board (IRB). A waiver of informed consent was granted by the IRB because it determined that this study involved no more than minimal risk, was deemed to not adversely affect the rights and welfare of studied Veterans, and could not have been practically carried out without waivers of consent. To protect the privacy and security of study information, all study members underwent Collaborative Institutional Training Initiative training for the protection of human subjects in biomedical research, Privacy and Health Insurance Portability and Accountability Act of 1996 training from the VA, and VA Privacy and Information Security Awareness and Rules of Behavior training and followed the guidelines set forth by the Veterans Health Administration (VHA) Handbook 1200.12, Use of Data and Data Repositories in VHA Research (Department of Veterans Affairs 2009). Identifying protected health information was limited to only information required to conduct the study, did not include any names or social security numbers, and will not appear in any presentations of publications of the results of this study. In addition, all study data was accessed and stored only on VA servers and maintained behind a VA firewall, where data usage is routinely audited to ensure compliance with VHA data storage guidelines.
Exposure Data
Validated satellite-based (V4.NA.04.MAPLE) estimates of ground-level over the contiguous United States were derived using satellite remote sensing, chemical transport modeling, and ground-based measurement data ( with ground-based observations) (van Donkelaar 2019). Measured concentrations were obtained from the U.S. Environmental Protection Agency (U.S. EPA 2020). Estimates of annual average were available for grids () for each year from 2009 to 2017. Geocoded street addresses and county and state of residence from 1 July 2009 throughout the follow-up period were available for studied Veterans from the U.S. Department of Veterans Affairs Planning Systems Support Group Enrollee File (U.S. Department of Veterans Affairs Information Resource Center 2015). Latitude and longitude coordinates for each geographic grid were matched with the latitude and longitude of each Veteran’s residence throughout follow-up. In VA data, 90% of Veteran-geocoded residential locations were based on mapping to the Veteran’s street address or an interpolation based on the building number and the location of their street. Otherwise, addresses were geocoded to the ZIP code tabulation area centroid. In primary analyses, each individual’s residential address in the previous year was linked to the average annual in that location for that year (Crouse et al. 2016; Lepeule et al. 2012). Residential addresses were updated every quarter of a year during follow-up to account for changes in exposures over time and according to residential location. In all analyses, because satellite-based estimates in the very low range of were sparse and in some instances resulted in null and negative exposure values, we excluded annual concentrations that were (the 0.1th percentile of all values during follow-up) from exposure data for an individual, thus interval censoring Veterans during these time points.
Outcomes
Height and weight, as measured and recorded for each Veteran during routine clinical encounters, were available from the VA MedSAS inpatient and outpatient data sets (Bowe et al. 2021; Murphy et al. 2002; Oddone and Eisen 2008; U.S. Department of Veterans Affairs Information Resource Center 2009; U.S. Department of Veterans Affairs Information Resource Center 2007a; U.S. Department of Veterans Affairs Information Resource Center 2007b; Xie et al. 2020). As primary outcomes, we investigated time until obesity () among study Veterans whose baseline BMI was , and time until a () increase in weight from each Veteran’s baseline value. Events were assumed to occur on the date when a post-baseline or a () weight gain was first recorded in a Veteran’s record. To better account for intra-personal characteristics, we also investigated the intra-individual change in BMI and weight over time. The timing of changes in weight or BMI was determined by the date on which each measurement was recorded. Similar to data-cleaning procedures employed in the cohort construction, we excluded weight measurements of () or () and excluded weight measurements that exceeded any other weight measurement within the year before to a year after its date of record by () (Goodloe et al. 2017). The value assigned as the baseline height was used as the height value for outcome BMI assessment.
Covariates
Individual-level covariates.
State and county of residence, age, race, sex, and marital status at baseline were collected from the VA MedSAS (Murphy et al. 2002) inpatient and outpatient data sets. Self-reported race was identified based on encounter data and classified as White, Black or African American, or other (including American Indian or Alaska Native, Asian, Native Hawaiian or other Pacific Islander, and multiracial Veterans). If self-reported race differed across different VA encounters, the most frequently recorded classification was used. Missing self-reported race was supplemented by information from other data sources, including the Medicare and the Beneficiary Identification Records Locator Subsystem (Bowe et al. 2018b, 2019b; Xie et al. 2019). Ethnicity was not assessed. Data from the VA Corporate Data Warehouse Health Factors domain were used to classify baseline smoking status based on work by McGinnis et al. (2011). In brief, an algorithm validated against self-reported smoking survey data was used to convert text entries from health factors data into categories of never, former, and current smoker (for example, a Veteran whose VA record included text indicating former or previous smoking would be classified as a former smoker.) The report prior but closest to baseline was used to classify smoking; Veterans with missing smoking status data were classified as never smokers. BMI categories, used in reporting of cohort characteristics at baseline, were defined as normal or underweight (), overweight (BMI between 25 and ), and obese (); BMI was otherwise treated as continuous.
Contextual covariates (Table S1).
Population density at the county level was obtained from the U.S. Census Bureau’s Small Area Income and Poverty Estimates data (Bell et al. 2016). Diet (percentage of population with limited access to healthy foods), exercise (percentage of population with adequate access to exercise opportunities), excessive alcohol use (percentage of adults reporting excessive consumption), and rurality (percentage of population living in a rural area) were obtained from the County Health Rankings (Remington et al. 2015). The 2015 area deprivation index (ADI) was obtained from the University of Wisconsin (University of Wisconsin School of Medicine and Public Health 2015). The ADI allows for the rankings of census block groups by socioeconomic status disadvantage and is a composite measure of education, employment, housing quality, and poverty measures (Kind and Buckingham 2018; University of Wisconsin School of Medicine and Public Health 2015). The normalized difference vegetation index (NDVI), an indicator for green space, was obtained from the National Oceanic and Atmospheric Administration Climate Data Record of Advanced Very High-Resolution Radiometer Surface Reflectance (Vermote 2019). The NDVI for each residential location was classified for geographic grids based on the mean of the top three highest daily values during July 2010 (Crouse et al. 2017; James et al. 2016; Orioli et al. 2019; Vienneau et al. 2017). The NDVI measures surface vegetation by comparing red and near-infrared spectral bands and ranges from (water), to 0 (bare ground), and, maximally, to 1 (dense vegetation). Contextual covariates were updated every 3 months to reflect changes in residential location during follow-up.
Statistical Analyses
A conceptual framework for the association between and obesity, including relations between exposure, covariates, and outcomes, is provided in Figure S2.
Incident obesity and weight gain.
We constructed Cox proportional hazards models to estimate hazard ratios (HRs) for incident obesity (among Veterans with a at baseline only) and a () increase in weight relative to baseline (among all Veterans). Models with a linear functional form of the annual concentration in the previous year (averaged over all residences in the previous year) were sequentially adjusted for a) baseline BMI for the obesity outcome, and weight and height for the weight outcome to account for differences in time to outcomes that may result from differences in baseline values; b) State of residence to account for potential differences in state-level composition and potential differences in state-level policies and other factors that may also affect the outcomes (Chen et al. 2020); c) age, race, and sex; d) contextual characteristics to account for the influence of the broader contextual milieu—socioeconomic deprivation, residential greenness, population density, rurality, and other measures—which may correlate with both exposure and outcomes; and e) smoking status—a putative confounder of the association under examination. All continuous covariates (baseline BMI or weight and height, age, and the contextual factors) were modeled as restricted cubic splines unless otherwise indicated.
In separate analyses we also explored nonlinearity by constructing an ensembled estimate of the risk relationship in our cohort (Nasari et al. 2016). Specifically, we constructed Cox proportional hazards models of the form:
where is the baseline hazard at time t; and is the vector of coefficients for covariate vector x. is the coefficient for transformed , which is the product of , a logistic weighting function, and f(z), which is either the identity or natural log transformation of the concentration, z. The logistic weighting function was as follows:
where is a location parameter representing a percentile of the distribution; is a parameter that controls the curvature of the weighting function; and r is the range of concentrations. This logistic weighting function specifies a monotonic sigmoidal hazard function for the relation between and the outcome, with larger values of tau resulting in less curvature, and the value of determining the location of the inflection point or maximum slope along the distribution. Multiple models were constructed by adjusting the parameters , , and f(z), until optimal fit was achieved. The three models that best fit the data were averaged, weighted by their model fit (log-likelihood), and used to construct an ensembled estimate. We present both the ensembled estimates and the estimates from the best-fitting model for each outcome. Ranges of the concentrations covered in the analyses of obesity were from and from in the analyses of weight gain, where the difference is the value of . Ranges were determined by the range of concentrations experienced by Veterans included in each analysis (with models of incident obesity restricted to Veterans with at baseline), where the distribution included one observation per time period per cohort member at risk in the cohort and, thus, differed by corresponding cohort inclusion/exclusion criteria (Nasari et al. 2016). In addition, maximum values were excluded beyond the 99th percentile and minimum values were excluded below the 1st percentile. Models of both outcomes included two possible values of τ, 0.1 and 0.2, which were selected a priori based on prior examinations by the method authors on their influence on variation in the shape of possible curves, which suggested that values beyond these two did not appreciably change examined curves’ forms (Nasari et al. 2016). Finally, we modeled seven possible values of corresponding to the , 0th, 5th, 10th, 25th, 50th, and 75th percentiles of the distributions for each set of study Veterans (1.671, 3.327, 4.983, 5.823, 7.159, and for models of incident obesity and 1.752, 3.369, 4.986, 5.827, 7.185, and for models of a () gain in weight). Values for the percentile were derived by subtracting the difference between the 5th and 0th percentile from the value of the 0th percentile. The percentiles used as possible percentiles for were selected a priori based on work by the authors on the modeling approach that found these values sufficiently covered possible inflection points in the logistic curve across the distribution (Nasari et al. 2016).
Intra-individual changes in BMI and weight over time.
We constructed linear mixed models to analyze the relationship between and intra-individual change in BMI and weight over time (Jerrett et al. 2014). Each individual’s residential address in the year prior to each recorded weight measurement was linked to the average annual in that location for that year (or, for Veterans who moved during a given year, a weighted average of annual concentrations for each residential location, according to the time spent at each address). When two weight (i.e., BMI) measures were recorded within 90 d for the same Veteran, we retained only the earlier value. Mixed-effects models were used, with a random intercept, a random time slope at the individual-level, and a compound symmetry covariance structure. We report the association between and the trajectory of BMI over the next year based on the regression coefficient of an interaction between time and . As in models of incident obesity and weight gain, we used sequentially adjusted models for a) height for the weight outcome; b) state of residence; c) demographics of age, race, and sex; d) contextual characteristics; and e) smoking status. Height was included as a covariate because changes under the same conditions in weight may vary based on a person’s height; baseline BMI and weight were not adjusted for because these measures were included in the set of outcome data.
We used slope estimates from the fully adjusted linear mixed models to plot average trajectories in BMI and weight according to percentiles of cumulative average exposure throughout follow-up among subgroups of Veterans with cumulative exposures within of the 10th, 25th, 50th, 75th, and 90th percentiles, respectively ( Veterans per subgroup.) Cumulative average exposure was defined as the average of total exposure to during follow-up, calculated by taking the sum of exposures at each time point from follow-up to the time being analyzed and dividing by the difference in time from the start of follow-up to the time point in question. These trajectories represent the estimated average change in weight or BMI that Veterans in each subgroup would have experienced based on their cumulative average exposure throughout the entire study follow-up period (from the start of follow-up to 8 y later). In addition to estimating linear associations between concentrations and weight or BMI change within individuals, we estimated associations with concentrations modeled as a restricted cubic spline, with knots at the 5th, 25th, 50th, 75th, and 95th percentiles. values outside the 1st and 99th percentile (3.72 and ) were excluded to reduce the influence of outliers on these models.
Positive and Negative Controls
We estimated associations between exposures and all-cause mortality as a positive outcome control given consistent evidence of associations in other populations (Burnett et al. 2018; Cohen et al. 2017; GBD 2019 Risk Factors Collaborators 2020). All-cause mortality was ascertained using mortality data available from the VA Vital Status Mini file (Maynard 2017). We evaluated ambient sodium concentration as a negative exposure control for incident outcomes and weight gain over time among Veterans living () from a U.S. EPA air monitoring station. Because there is no prior evidence or biologic plausibility for an association between atmospheric sodium and weight or BMI (Lipsitch et al. 2010), associations with ambient sodium concentrations would suggest potential bias in associations with related to the use of air monitoring station data to estimate exposures in our study population. Ambient sodium exposures were estimated based on measured concentrations from the nearest U.S. EPA air monitoring station.
Sensitivity Analyses
We performed multiple sensitivity analyses. First, to enhance the spatial resolution of exposure assessment, we estimated exposure based on measurements from the air monitoring station closest to each residence in analyses restricted to Veterans living within () and () of a U.S. EPA air monitoring station, respectively (Miller et al. 2007). We used the Haversine formula (Robusto 1957) to link the latitude and longitude of the ZIP code tabulation area centroid for each residential address to the latitude and longitude of the nearest monitoring station. In addition, we repeated analyses restricted to Veterans whose residence latitude and longitude did not change by during follow-up. We also additionally adjusted for the number of hospitalizations and number of weight measurements in the year before baseline to assess potential confounding related to the frequency of interactions with the health care system, and we adjusted for marital status at baseline (Umberson 1992).
For models of the risk of obesity and a () increase in weight we also constructed within-city models [where city was defined as a metropolitan statistical area (MSA), which can include multiple grids] to further account for shared regional similarities (Miller et al. 2007). Models included both city-average exposure levels (defined for each year as the population-weighted average exposure for all residents of a given MSA) as estimates of between-city effects, and the difference between each individual’s exposure level from the city-level exposure as an estimate of within-city effects. Veterans were interval censored during time periods where they were not residing in an MSA. We report HRs for within-city effects corresponding to a higher individual-level relative to the city-level average.
We also repeated Cox proportional hazards models after stratifying by baseline age (, to , to , and ), sex, race (Black, White, or other), and BMI (, to , and ) to allow for differences in baseline hazards. In addition, we considered alternative outcome definitions including 1- and increases in BMI, where we adjusted for baseline BMI, and a () increase in weight relative to baseline, where we adjusted for baseline weight and height, 5% increases in BMI and weight relative to baseline, and the risk of becoming overweight or obese () among Veterans with a at baseline. Finally, to assess potential bias due to differential loss to follow-up across levels, we repeated linear mixed models restricted to Veterans who had at least one weight measurement after baseline, the median time from baseline to the last recorded weight measurement during follow-up of each Veteran.
Data were complete for all Veterans included in the analyses because Veterans with missing exposure, outcome, or covariate data were excluded from the study cohort. Effect estimates were considered statistically significant if the 95% confidence interval (CI) did not include the null value. All analyses were conducted using SAS Enterprise guide 7.1 (SAS Institute Inc.) and R (version 3.5.3; R Development Core Team).
Results
We assembled a cohort of 3,902,440 Veterans followed for a median 8.1 [interquartile range (IQR): 7.3–8.4 y], corresponding to 27,628,688 person-years. The demographic and health characteristics of the overall study cohort and by quartile (at cohort entry) are described in Table 1. The cohort was 94% male, 76% White, and 14% Black, with a median age at baseline of 64 y (IQR: 56–75) (Table 1). During the course of follow-up, 28% of Veterans died. At baseline, most (58%) were married, either current (29%) or former smokers (35%), and overweight (38%) or obese (40%). At baseline, cohort members lived in counties where 16% of residents were in rural areas, 16% of county adult residents reported excessive alcohol consumption, and 6% had limited access to healthy food. Veterans had a median of 10 weight measurements recorded during follow-up (IQR: 7–15). In general, Veteran characteristics were similar across quartiles at baseline, though Veterans in the highest quartile () were more likely to be Black (24%) and less likely to be married (49%), and lived in counties with a smaller proportion of rural residents (4%) and a higher population density ( () compared with () for those with baseline ).
Table 1.
Individual-level and county-level characteristics by quartiles at cohort entry in a national cohort of U.S. Veterans selected from 1 July 2010 through 31 June 2011 ().
| Characteristic | Overall () | Quartile 1 () () | Quartile 2 () () | Quartile 3 () () | Quartile 4 () () |
|---|---|---|---|---|---|
| Individual-level characteristics | |||||
| Body weight at baseline {lbs. [median (IQR)]} | 197.0 (172.6–226.5) | 197.2 (173.0–226.0) | 198.0 (173.2–227.0) | 198.0 (173.0–227.0) | 196.0 (171.0–226.0) |
| BMI at baseline { [median (IQR)]}a | 28.7 (25.5–32.6) | 28.8 (25.6–32.5) | 28.8 (25.6–32.6) | 28.8 (25.6–32.7) | 28.6 (25.3–32.5) |
| BMI {category [ (%)]} | |||||
| Normal or underweight | 835,212 (21.4) | 200,801 (20.6) | 204,370 (21.0) | 206,499 (21.2) | 223,542 (22.9) |
| Overweight | 1,490,557 (38.2) | 381,097 (39.0) | 374,354 (38.4) | 369,232 (37.9) | 365,874 (37.5) |
| Obese | 1,576,671 (40.4) | 394,235 (40.4) | 396,987 (40.7) | 399,844 (41.0) | 385,605 (39.6) |
| { [median (IQR)]} | 9.2 (7.8–10.5) | 6.7 (5.5–7.3) | 8.5 (8.2–8.8) | 9.8 (9.5–10.1) | 11.5 (10.9–12.4) |
| Age {y [median (IQR)]} | 64.1 (56.2–74.8) | 65.0 (58.4–75.3) | 64.5 (57.1–75.1) | 63.8 (55.5–74.4) | 63.4 (54.5–74.1) |
| Male sex [ (%)] | 3,679,604 (94.3) | 925,579 (94.8) | 923,170 (94.6) | 915,722 (93.9) | 915,133 (93.9) |
| Race [ (%)] | |||||
| Black | 553,429 (14.2) | 41,072 (4.2) | 100,136 (10.3) | 175,324 (18.0) | 236,897 (24.3) |
| Other | 372,573 (9.6) | 86,085 (8.8) | 81,263 (8.3) | 89,434 (9.2) | 115,791 (11.9) |
| White | 2,976,438 (76.3) | 848,976 (87.0) | 794,312 (81.4) | 710,817 (72.9) | 622,333 (63.8) |
| Smoking status [ (%)] | |||||
| Never | 1,303,792 (35.6) | 307,613 (34.1) | 334,786 (37.0) | 343,669 (37.1) | 317,724 (34.1) |
| Former | 1,285,483 (35.1) | 344,459 (38.2) | 301,903 (33.3) | 311,870 (33.7) | 327,251 (35.1) |
| Current | 1,076,763 (29.4) | 249,357 (27.7) | 269,381 (29.7) | 269,932 (29.2) | 288,093 (30.9) |
| Married at baseline [ (%)] | 2,249,982 (57.7) | 608,887 (62.4) | 596,875 (61.2) | 569,382 (58.4) | 474,838 (48.7) |
| Deaths [ (%)] | 1,095,796 (28.1) | 271,011 (27.8) | 278,643 (28.6) | 271,099 (27.8) | 275,043 (28.2) |
| Follow-up time, {y [median (IQR)]} | 8.1 (7.3–8.4) | 8.1 (7.4–8.4) | 8.1 (7.2–8.4) | 8.1 (7.4–8.4) | 8.1 (7.3–8.4) |
| inpatient stays in the year prior to baseline [ (%)] | 361,806 (9.3) | 81,698 (8.4) | 89,293 (9.2) | 87,637 (9.0) | 103,178 (10.6) |
| Outpatient weight measurements in the year prior to baseline { [median (IQR)]} | 1 (1–3) | 1 (1–3) | 2 (1–3) | 1 (1–3) | 2 (1–4) |
| BMI measurements during follow-up { [median (IQR)]} | 10 (7–15) | 10 (7–14) | 10 (7–15) | 10 (6–14) | 10 (6–15) |
| County-level characteristics | |||||
| ADI [median (IQR)]b | 54.7 (43.1–64.3) | 54.0 (43.4–65.4) | 57.3 (48.2–66.8) | 55.9 (44.1–64.7) | 53.5 (39.8–61.2) |
| Rural residency {% [median (IQR)]} | 15.6 (3.6–42.3) | 33.0 (9.8–62.4) | 22.4 (6.3–50.3) | 15.3 (3.8–39.5) | 4.0 (0.7–15.2) |
| Population density { [median (IQR)]} | 259.6 (81.4–910.0) | 70.9 (28.5–285.2) | 198.9 (78.4–487.3) | 332.5 (123.8–984.0) | 784.9 (299.2–2,171.5) |
| Limited access to healthy food {% [median (IQR)]} | 5.9 (3.7–8.5) | 5.9 (3.9–8.9) | 6.3 (4.2–9.0) | 6.0 (3.7–8.7) | 5.3 (2.9–7.5) |
| Access to exercise opportunities {% [median (IQR)]} | 74.8 (56.2–90.1) | 67.5 (50.1–82.7) | 69.0 (53.4–84.1) | 74.1 (54.1–89.7) | 88.4 (72.1–95.2) |
| Adults reporting excessive alcohol consumption {% [median (IQR)]} | 16.4 (14.1–18.7) | 16.7 (14.4–19.1) | 16.0 (13.4–18.6) | 15.6 (13.0–18.5) | 16.8 (14.9–18.7) |
| NDVI [median (IQR)}c | 0.63 (0.50–0.72) | 0.66 (0.46–0.76) | 0.64 (0.53–0.72) | 0.65 (0.55–0.71) | 0.59 (0.46–0.68) |
Note: Baseline data were complete for all variables shown. ADI, area deprivation index; BMI, body mass index; IQR, interquartile range; , ambient fine particulate matter (particulate matter in aerodynamic diameter); NDVI, normalized difference vegetation index. . .
BMI is weight in kilograms divided by the square of the height in meters.
ADI is a measure of socioeconomic status disadvantage, with a range from low to high disadvantage of 0 to 100.
NDVI is a measure of greenspace, and ranges from low to high from (water), to 0 (bare ground), and, maximally, to 1 (dense vegetation).
The distributions of levels for each year during follow-up are depicted in Figure S3. During follow-up, average annual concentrations ranged from 2.4 to (Table S2). During the first calendar year of follow-up, in 2010, the median exposure in our cohort was , which decreased to a median of in 2018.
and the Risk of Weight Gain and Obesity
Among the subgroup of Veterans who were not obese at baseline (, 60% of the total cohort), 446,113 (19%) became obese () during follow-up (Table 2). The risk of obesity was positively associated with a higher average annual concentration, with an HR from the fully adjusted model of 1.08 (95% CI: 1.06, 1.11). In the entire cohort, 42% gained () during follow-up relative to their baseline weight. As for risk of obesity, the risk of a () increase in weight was also positively associated with higher average annual concentration [fully adjusted (95% CI: 1.06, 1.08)].
Table 2.
Association of with risk of obesity and gain in body mass index or body weight in a national cohort of U.S. Veterans selected from 1 July 2010 through 31 June 2011 and followed until 31 December 2018 ().
| Risk of obesity { [HR/ (95% CI)]}a | Risk of body weight gain [HR/ (95% CI)] | Change in BMI//y (95% CI) | Change in body weight (lbs.)/ per/y (95% CI) | |
|---|---|---|---|---|
| Events [ (%)] | 446,113 (19.18) | 1,654,748 (42.40) | — | — |
| Sequentially adjusted model | ||||
| Unadjusted | 1.02 (1.01, 1.04) | 1.15 (1.14, 1.16) | 0.149 (0.147, 0.150) | 1.010 (0.998, 1.023) |
| +Baseline height, body weight, and/or BMI | 1.18 (1.17, 1.20)b | 1.14 (1.13, 1.15)c | — | 1.026 (1.013, 1.038)d |
| +State of residence | 1.30 (1.28, 1.33) | 1.24 (1.23, 1.25) | 0.149 (0.147, 0.151) | 1.026 (1.013, 1.039) |
| +Age, sex, and race | 1.08 (1.06, 1.10) | 1.05 (1.04, 1.06) | 0.145 (0.143, 0.147) | 1.000 (0.988, 1.013) |
| +Contextual characteristicse | 1.10 (1.08, 1.12) | 1.08 (1.07, 1.09) | 0.144 (0.142, 0.146) | 0.994 (0.981, 1.007) |
| +Smoking status | 1.08 (1.06, 1.11) | 1.07 (1.06, 1.08) | 0.140 (0.139, 0.142) | 0.968 (0.955, 0.981) |
Note: Cox proportional hazard models and linear mixed models provided hazard ratios and levels of intra-individual change, respectively. Models were sequentially adjusted using the corresponding covariates listed. —, not applicable; BMI, body mass index; CI, confidence interval; , ambient fine particulate matter (particulate matter in aerodynamic diameter). .
Restricted to Veterans with baseline ().
Baseline measurement was BMI.
Baseline measurement was height and body weight.
Baseline measurement was height.
Contextual characteristics include county-level area deprivation index, normalized difference vegetation index, county-level percentage rural residency, population density, percentage limited access to healthy food, percentage access to exercise opportunities, and percentage of adults reporting excessive alcohol consumption.
To characterize the shape of the relationship between concentrations and risk of obesity or a () weight gain, we used an ensemble modeling approach that accommodates a variety of nonlinear relations. The resulting estimates indicated positive associations for both outcomes (Figure 1A,B). Parameters for the top three best-fitting models for both outcomes may be found in Table S3. Resulting curves had a single inflection point, with steeper slopes for lower concentrations. For both the risk of obesity (Figure S4A) and the risk of weight gain (Figure S4B), the curve based on the ensemble estimate was similar in shape to that for the optimal model. For both outcomes, the ensembled estimates displayed less precision than those from the optimal models.
Figure 1.
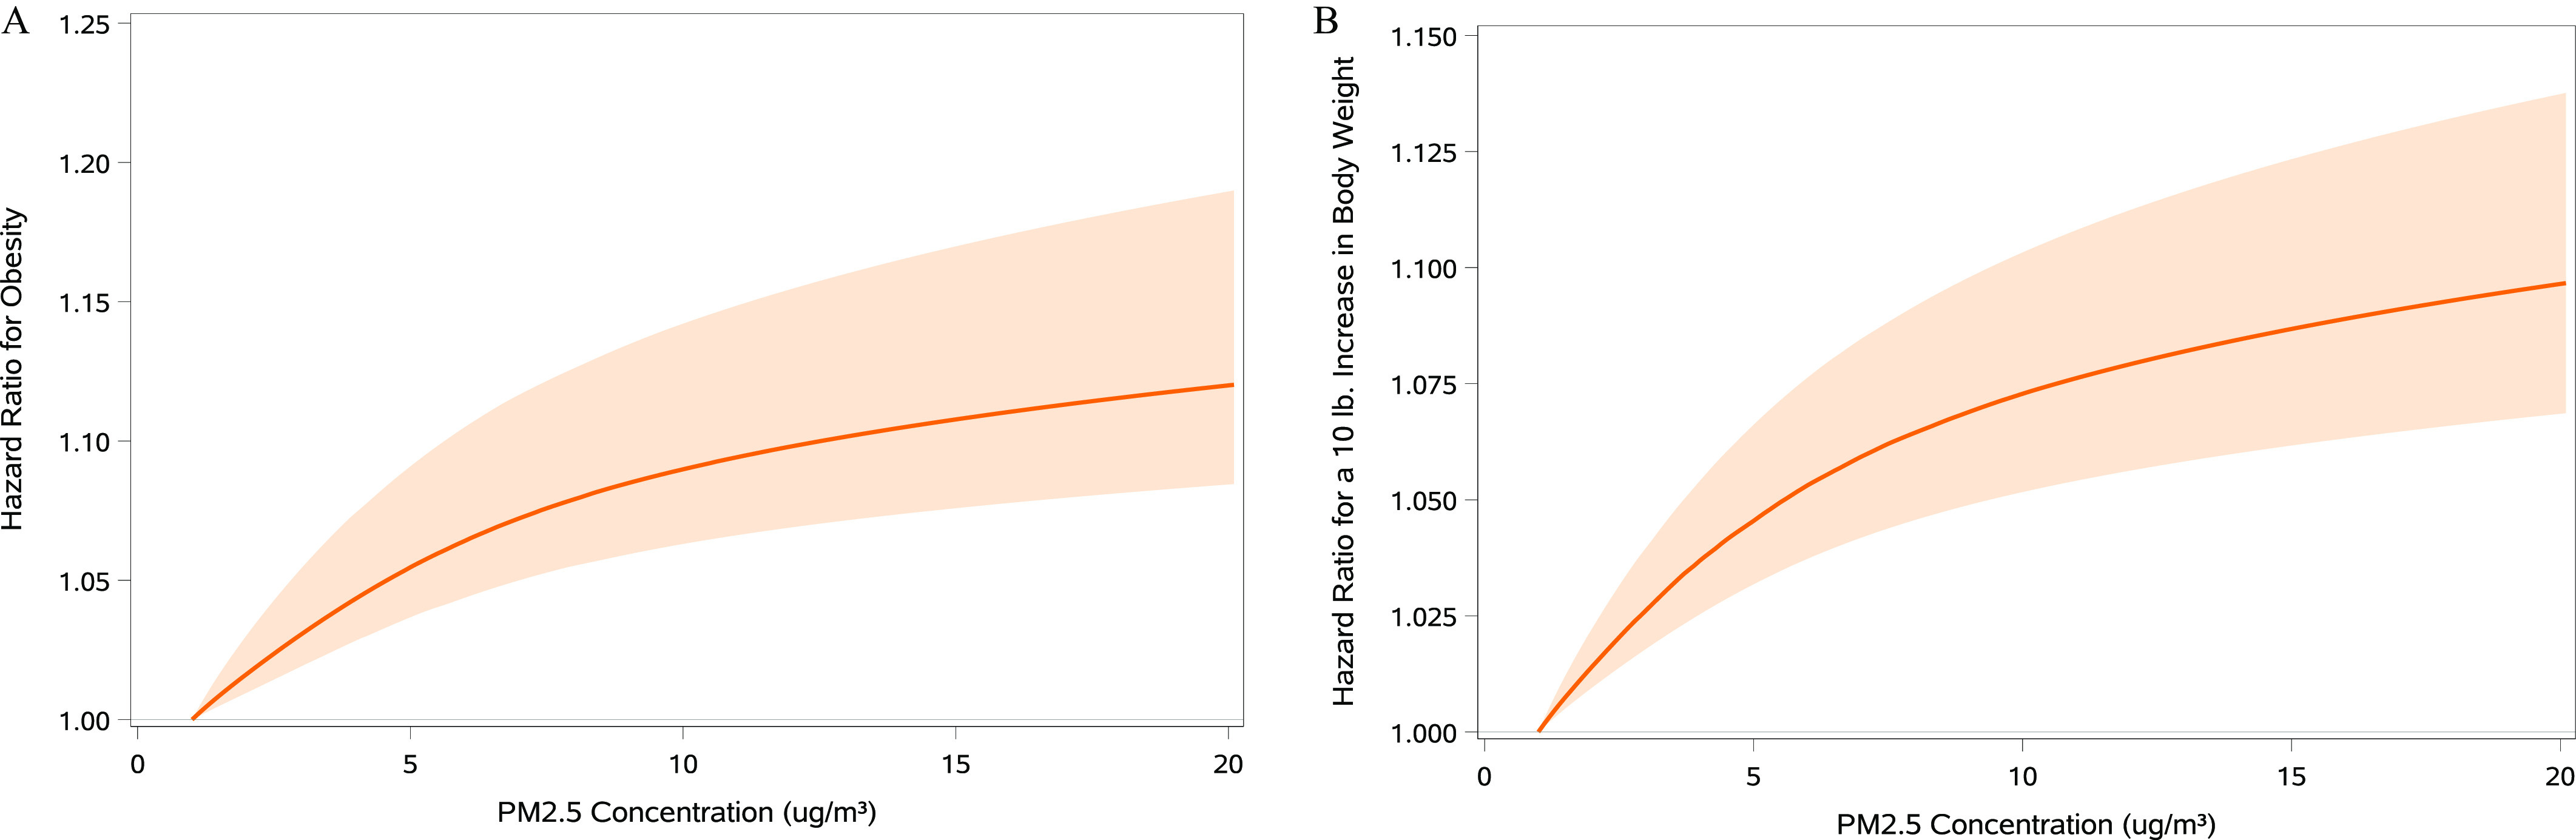
Association of exposure with risk of obesity and gain in body weight in a national cohort of U.S. Veterans selected from 1 July 2010 through 31 June 2011 and followed until 31 December 2018 (). (A) Obesity, (B) gain in body weight. A Shape Constrained Health Impact Function modeling approach was used. Models were adjusted for BMI (A), or height and body weight (B), and state of residence, age, race, sex, smoking status, area deprivation index, normalized difference vegetation index, county-level percentage rural residency, population density, percentage limited access to healthy food, percentage access to exercise opportunities, and percentage of adults reporting excessive alcohol consumption. Lines represent the estimated difference in risk associated with a given concentration compared with the reference concentration of (in consideration of the log-linear nature of the response). Bands represent the 95% confidence interval. . Model parameters of the optimal model and the second and third best-fitting models used to derive the ensemble estimates are reported in Table S3. Note: BMI, body mass index; , ambient fine particulate matter (particulate matter in aerodynamic diameter).
and Intra-Individual Changes in Weight
Linear mixed models of changes in BMI and weight indicated positive associations with concentrations (Table 2), and spline analyses also suggested positive associations across the range of exposure levels experienced by the cohort (Figure S5). We then estimated intra-individual changes in weight and BMI according to the distribution of cumulative average exposure. On average, Veterans with cumulative average levels at the 90th percentile gained an additional () or BMI by the end of follow-up compared with Veterans who had cumulative exposures at the 10th percentile (Figure 2; Tables S4–S5).
Figure 2.
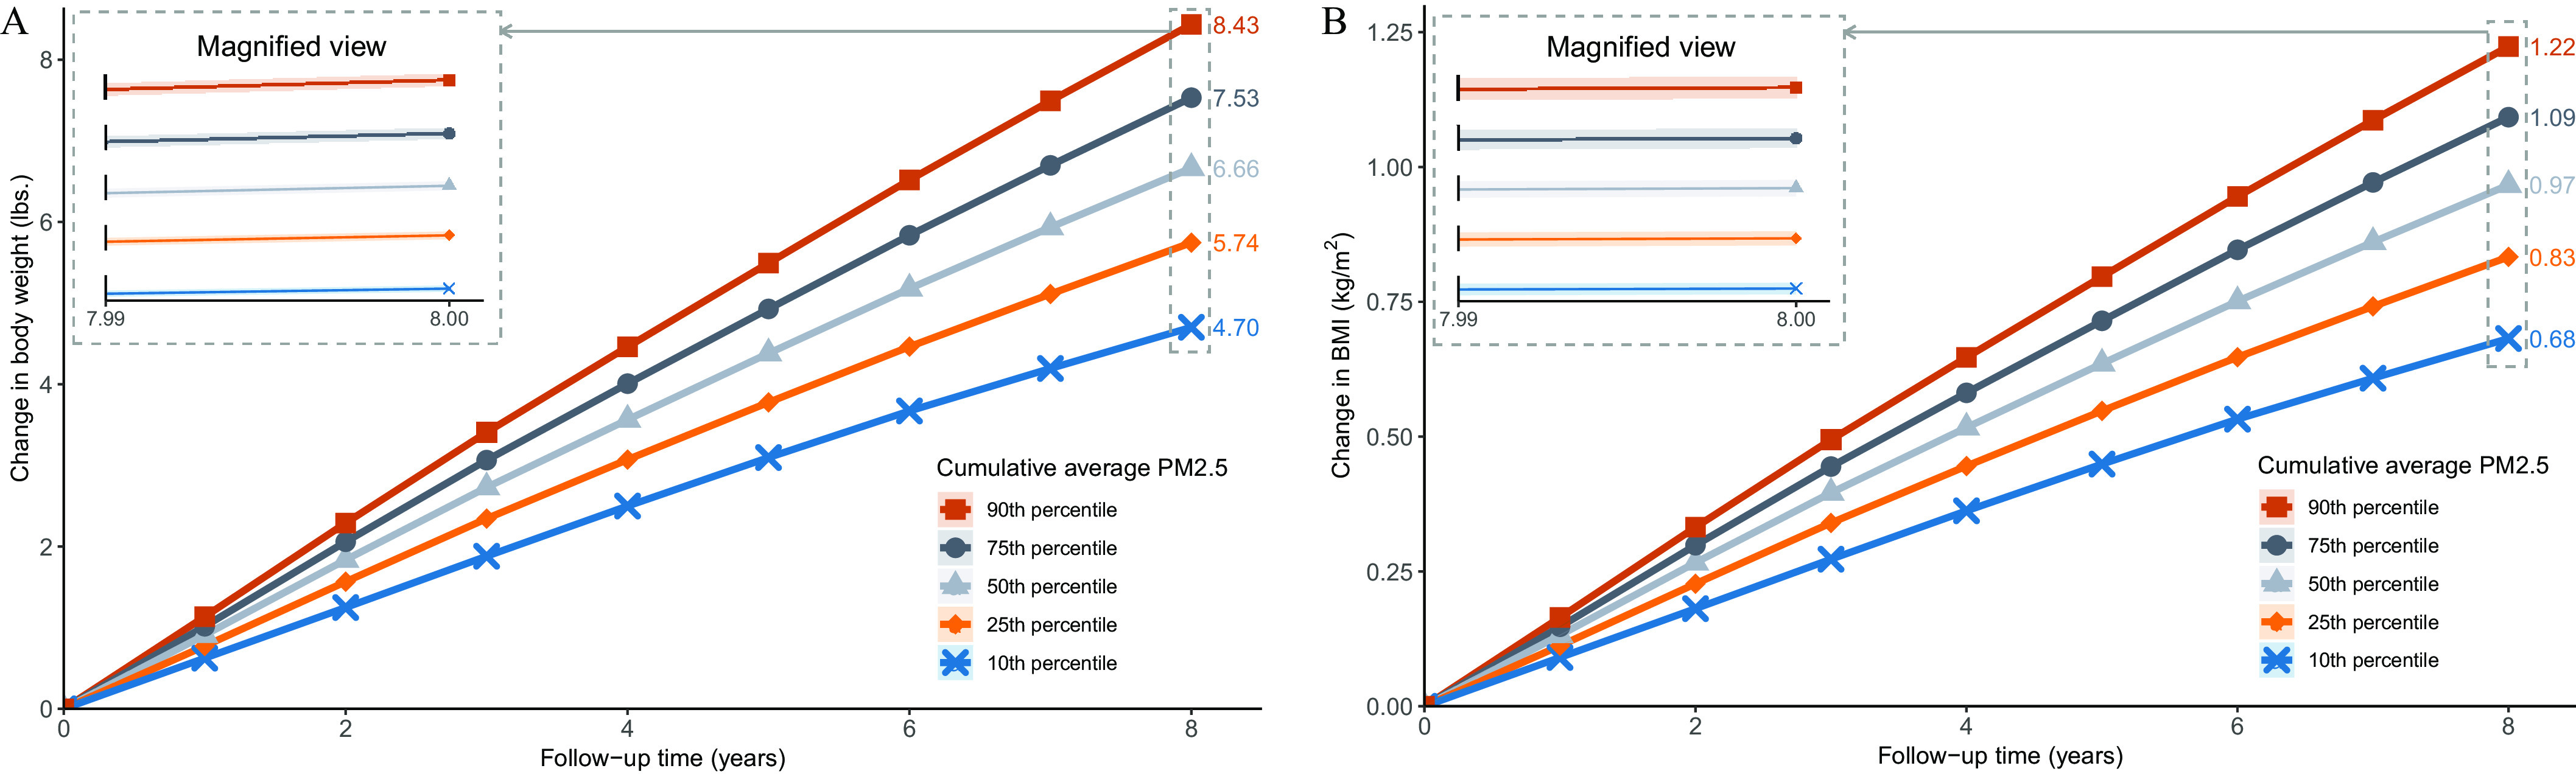
Association of exposure with intra-individual change in body weight and BMI in a national cohort of U.S. Veterans selected from 1 July 2010 through 31 June 2011 and followed until 31 December 2018 (). (A) body weight, (B) BMI. Average change for those at the 10th, 25th, 50th, 75th, and 90th percentile of the cumulative average exposure distribution. Bands represent 95% CI. The inset presents a 20-fold magnification of the y-axis of the plot. Linear mixed models were used to obtain rates of change in outcomes associated with . Models were adjusted for height (A), state of residence, age, race, sex, area deprivation index, normalized difference vegetation index, county-level percentage rural residency, population density, percentage limited access to healthy food, percentage access to exercise opportunities, percentage of adults reporting excessive alcohol consumption, and smoking status. Lines represent the change in outcome measured from the beginning of follow-up. Lines are labeled by the average total change in body weight (A) and BMI (B) from baseline by year 8 of follow-up. Shapes indicate different percentiles of the cumulative average . 2.205 lb = 1 kg. Note: BMI, body mass index; CI, confidence interval; , ambient fine particulate matter (particulate matter in aerodynamic diameter).
Positive and Negative Controls
As expected, a higher average annual was associated with all-cause mortality (positive outcome control) [ (95% CI: 1.23, 1.27)]. In addition, among those living within () of an air monitoring station (), a 1-IQR change () in ambient sodium levels (negative exposure control) was not associated with the risk of obesity [ (CI: 1.00, 1.00), ], a () weight gain [ (95% CI: 1.00, 1.00)], or intra-individual changes in BMI [ (95% CI: 0.000, 0.001)] and weight [ (95% CI: , 0.015)] ([ (95% CI: , 0.007)]).
Sensitivity Analyses
Results were generally consistent with the primary analyses when we assigned exposure levels based on mean annual measures from the nearest air monitoring station within of each residence ( for incident obesity and for all other outcomes) and () from each residence ( for incident obesity and otherwise); and when analyses were restricted to nonmovers ( for incident obesity, otherwise) (Table 3). Results were also consistent with the primary analyses after additional adjustment for the number of inpatient hospital stays and weight measurements in the year before baseline (as indications of the frequency of interactions with the health care system), and marital status at baseline (Table 3).
Table 3.
Sensitivity analyses in a national cohort of U.S. Veterans selected from 1 July 2010 and 31 June 2011 and followed until 31 December 2018 ().
| Model | Hazard ratio per of (95% CI) | Intra-individual increase per of per year (95% CI) | ||
|---|---|---|---|---|
| Obesity () | Body weight gain () | BMI () | Body weight (lbs.) | |
| Air monitoring station ( radius)a | 1.12 (1.09, 1.15) | 1.10 (1.09, 1.12) | 0.087 (0.084, 0.089) | 0.598 (0.580, 0.615) |
| Air monitoring station ( radius)b | 1.10 (1.03, 1.15) | 1.08 (1.04, 1.12) | 0.093 (0.090, 0.097) | 0.639 (0.615, 0.664) |
| Nonmoversc | 1.08 (1.05, 1.10) | 1.07 (1.05, 1.08) | 0.191 (0.189, 0.194) | 1.317 (1.300, 1.334) |
| Additional adjustment for baseline markers of hospital interactiond | 1.06 (1.04, 1.08) | 1.04 (1.03, 1.05) | 0.140 (0.138, 0.142) | 0.967 (0.955, 0.980) |
| Additional adjustment for baseline marital status | 1.05 (1.03, 1.08) | 1.04 (1.03, 1.05) | 0.137 (0.136, 0.139) | 0.947 (0.934, 0.960) |
Note: Cox proportional hazard models and linear mixed models provided hazard ratios and levels of intra-individual change, respectively. Models were adjusted for BMI (obesity outcome), height and body weight (body weight gain outcome), or height (body weight outcome), and state of residence, age, race, sex, area deprivation index, normalized difference vegetation index, county-level percentage rural residency, population density, percentage limited access to healthy food, percentage access to exercise opportunities, percentage of adults reporting excessive alcohol consumption, and smoking status. BMI, body mass index; CI, 95% confidence interval; , ambient fine particulate matter (particulate matter in aerodynamic diameter). . .
Within a cohort of those living within of an air monitoring station ( for obesity outcome, otherwise).
Within a cohort of those living within of an air monitoring station ( for obesity outcome, otherwise).
Within a cohort of those who did not move (no difference in latitude or longitude ) during follow-up ( for obesity outcome, otherwise).
Additionally adjusted for number of inpatient stays and number of weight measurements in the year prior to baseline.
Models of associations between incident obesity and a () weight gain also indicated positive associations when restricted to Veterans living within an MSA throughout follow-up, with HRs for a increase in within-city of 1.20 (95% CI: 1.16, 1.24), and 1.18 (95% CI: 1.15, 1.20), for incident obesity and a () weight gain, respectively (Table S6). Estimates were similar to primary models when Cox proportional hazard models were stratified to allow for differences in baseline hazards by age, race, sex, and BMI [ (95% CI: 1.03, 1.07) and (95% CI: 1.06, 1.08) for incident obesity and a () weight gain, respectively] (Table S6). The HR for the incidence of overweight or obesity among 835,212 Veterans with a at baseline was positive but closer to the null [ (95% CI: 1.01, 1.06)] than the corresponding HR for incident obesity, whereas the association was stronger for a () increase in weight [ (95% CI: 1.16, 1.20)] compared with the HR for a () increase (Table S7). Associations were also positive for a increase in and the incidence of 1- and increases in BMI, a 5% increase in BMI, and a 5% increase in weight relative to baseline (Table S7). Finally, estimates for intra-individual changes in BMI and weight with a increase in were similar to primary analyses when restricted to 1,955,448 Veterans who had at least one recorded weight measurement 6.5–7.5 y after baseline, with estimated mean increases in BMI and weight of (95% CI: 0.137, 0.142) and (95% CI: 0.947, 0.977) ( (95% CI: 0.430, 0.443)), respectively (Table S8).
Discussion
In this cohort of 3,902,440 U.S. Veterans followed for a median 8.1 (IQR: 7.3 to 8.4) y, who corresponded to more than person-years of follow-up, exposure to higher levels of was associated with an increased risk of weight gain and obesity, and with intra-individual increases in weight and BMI during follow-up. Estimated exposure–response functions for incident obesity and a () weight gain suggested positive associations at all concentrations above the minimum (), including concentrations below the 2012 National Ambient Air Quality Standard of (U.S. EPA 2013). Findings were consistent across multiple sensitivity analyses, including models using alternate exposure definitions, outcome definitions, and covariate adjustments. As expected, we also estimated a positive association with all-cause mortality (as a positive outcome control), whereas results were null for associations with ambient air sodium concentrations (as a negative exposure control). The constellation of evidence suggests that may be obesogenic.
Our results build on the seminal discoveries that inhaled nanoparticles when sufficiently small, may permeate through the alveolar space and enter the bloodstream where they may interact with extrapulmonary organs (Miller et al. 2017). Animal studies also suggest that exposure to particulate matter activates genes associated with lipogenesis in adipose tissue leading to increased adipocyte size, increased adiposity, and increased visceral fat mass (Hamanaka and Mutlu 2018; Mendez et al. 2013; Sun et al. 2009). Animals exposed by inhalation to particulate matter also exhibit increased macrophage infiltration into adipose tissue, elevated concentrations of pro-inflammatory cytokines, impaired adipose mitochondrial function, increased leptin and adiponectin, and increased insulin resistance (Hamanaka and Mutlu 2018; Mendez et al. 2013; Sun et al. 2009). These mechanistic findings are complemented by evidence from human studies indicating that is a metabolic risk factor (Pope et al. 2015) that has been associated with diabetes mellitus (Bowe et al. 2018b), chronic kidney disease, and other cardiometabolic conditions (Al-Aly and Bowe 2020; Bowe et al. 2020a, 2020b). Furthermore, epidemiologic literature has suggested that traffic density and traffic-related pollutant levels were associated with an increased risk of weight gain in children (Jerrett et al. 2010, 2014). Taken together, these prior studies provide biologic and epidemiologic plausibility for the findings reported in this study.
This study has several limitations. The cohort included U.S. Veterans who were mostly older, white, and male, which limits the generalizability of the study results. Models of incident obesity (or overweight) were necessarily restricted to Veterans who were not obese (or overweight) at baseline, and who may have therefore differed in their susceptibility to and other factors that may further limit generalizability. Although we adjusted for several known confounders, we cannot completely rule out the possibility of residual confounding. Individual information on diet and exercise was not available, and we adjusted for smoking and marital status at baseline only. Although we used high-resolution exposure data and linked it to residential addresses, exposure misclassification may have been present. Many contextual covariates were assessed at the county level, and we did not investigate interactions between contextual characteristics. The use of electronic health records, which contain only information recorded at receipt of care, may have resulted in misclassification of outcome measurements and the timing of incident outcomes. Our analyses did not account for indoor exposure to air pollutants, did not consider lags in the relation between exposure and outcome, and did not consider potential heterogeneity in effect across different populations and by differences in composition and toxic content of .
Strengths of the study include the large cohort size with well-characterized health characteristics and long follow-up time. concentrations spanned the spectrum of levels experienced by people throughout the United States. We leveraged the opportunity that the outcomes of interest (weight and BMI) are continuous variables recurrently measured in the same individual—which enabled us to develop an analytic approach to estimate intra-individual change in weight associated with . We used an ensemble modeling approach to characterize the shape of the association between and obesity in our cohort, which allowed for any nonlinearity in the relationship. Finally, we developed and tested a negative exposure and a positive outcome control, to lessen concerns about spurious associations.
In summary, in a cohort of Veterans followed for more than 8 y (corresponding to more than person-years of follow-up), air pollution was associated with a higher risk of obesity and weight gain. The association was evident for the incidence of obesity and a () gain in weight and for intra-individual changes in weight and BMI during follow-up. The shape of the estimated exposure–response function suggests that risk was evident at concentrations —the current U.S. EPA air quality standard for average annual ambient concentrations. Strategies aimed at addressing obesity may need to consider air pollution and other environmental exposures as potential causes.
Supplementary Material
Acknowledgments
This work was supported in part by funds from the Institute for Public Health at Washington University in St Louis (Z.A.A.), the U.S. Department of Veterans Affairs (Z.A.A.), the American Society of Nephrology (B.B.), and the American Society of Nephrology (Y.X.) and by the McKelvey School of Engineering at Washington University in Saint Louis (R.V.M.).
The funders had no role in the design and conduct of the study; collection, management, analysis, and interpretation of the data; preparation, review, or approval of the manuscript; and decision to submit the manuscript for publication.
The contents do not represent the views of the U.S. Department of Veterans Affairs or the U.S. government.
Veterans Health Administration data is available through the Department of Veterans Affairs. Data on is available through the Atmospheric Composition Analysis Group website (http://fizz.phys.dal.ca/∼atmos/martin/?page_id=140).
References
- Al-Aly Z, Balasubramanian S, McDonald JR, Scherrer JF, O’Hare AM. 2012. Greater variability in kidney function is associated with an increased risk of death. Kidney Int 82(11):1208–1214, PMID: 22854642, 10.1038/ki.2012.276. [DOI] [PubMed] [Google Scholar]
- Al-Aly Z, Bowe B. 2020. Air pollution and kidney disease. Clin J Am Soc Nephrol 15(3):301–303, PMID: 32125277, 10.2215/CJN.16031219. [DOI] [PMC free article] [PubMed] [Google Scholar]
- Bell WR, Basel WW, Maples JJ. 2016. An overview of the US Census Bureau’s small area income and poverty estimates program. Analysis of Poverty Data by Small Area Estimation 29:349–377, 10.1002/9781118814963.ch19. [DOI] [Google Scholar]
- Bloemsma LD, Wijga AH, Klompmaker JO, Janssen NAH, Smit HA, Koppelman GH, et al. 2019. The associations of air pollution, traffic noise and green space with overweight throughout childhood: the PIAMA birth cohort study. Environ Res 169:348–356, PMID: 30504077, 10.1016/j.envres.2018.11.026. [DOI] [PubMed] [Google Scholar]
- Bowe B, Artimovich E, Xie Y, Yan Y, Cai M, Al-Aly Z. 2020a. The global and national burden of chronic kidney disease attributable to ambient fine particulate matter air pollution: a modelling study. BMJ Glob Health 5(3):e002063, PMID: 32341805, 10.1136/bmjgh-2019-002063. [DOI] [PMC free article] [PubMed] [Google Scholar]
- Bowe B, Cai M, Xie Y, Gibson AK, Maddukuri G, Al-Aly Z. 2021. Acute kidney injury in a national cohort of hospitalized US Veterans with COVID-19. Clin J Am Soc Nephrol 16(1):14–25, PMID: 33199414, 10.2215/CJN.09610620. [DOI] [PMC free article] [PubMed] [Google Scholar]
- Bowe B, Xie Y, Li T, Yan Y, Xian H, Al-Aly Z. 2017. Associations of ambient coarse particulate matter, nitrogen dioxide, and carbon monoxide with the risk of kidney disease: a cohort study. Lancet Planet Health 1(7):e267–e276, PMID: 29851625, 10.1016/S2542-5196(17)30117-1. [DOI] [PubMed] [Google Scholar]
- Bowe B, Xie Y, Li T, Yan Y, Xian H, Al-Aly Z. 2018a. Particulate matter air pollution and the risk of incident CKD and progression to ESRD. J Am Soc Nephrol 29(1):218–230, PMID: 28935655, 10.1681/ASN.2017030253. [DOI] [PMC free article] [PubMed] [Google Scholar]
- Bowe B, Xie Y, Li T, Yan Y, Xian H, Al-Aly Z. 2018b. The 2016 global and national burden of diabetes mellitus attributable to PM2.5 air pollution. Lancet Planet Health 2(7):e301–e312, PMID: 30074893, 10.1016/S2542-5196(18)30140-2. [DOI] [PubMed] [Google Scholar]
- Bowe B, Xie Y, Li T, Yan Y, Xian H, Al-Aly Z. 2019a. Estimates of the 2016 global burden of kidney disease attributable to ambient fine particulate matter air pollution. BMJ Open 9(5):e022450, PMID: 31072847, 10.1136/bmjopen-2018-022450. [DOI] [PMC free article] [PubMed] [Google Scholar]
- Bowe B, Xie Y, Yan Y, Al-Aly Z. 2019b. Burden of cause-specific mortality associated with PM2.5 air pollution in the United States. JAMA Netw Open 2(11):e1915834, PMID: 31747037, 10.1001/jamanetworkopen.2019.15834. [DOI] [PMC free article] [PubMed] [Google Scholar]
- Bowe B, Xie Y, Yan Y, Xian H, Al-Aly Z. 2020b. Diabetes minimally mediated the association between PM2.5 air pollution and kidney outcomes. Sci Rep 10(1):4586, PMID: 32165691, 10.1038/s41598-020-61115-x. [DOI] [PMC free article] [PubMed] [Google Scholar]
- Burnett R, Chen H, Szyszkowicz M, Fann N, Hubbell B, Pope CA III, et al. 2018. Global estimates of mortality associated with long-term exposure to outdoor fine particulate matter. Proc Natl Acad Sci USA 115(38):9592–9597, PMID: 30181279, 10.1073/pnas.1803222115. [DOI] [PMC free article] [PubMed] [Google Scholar]
- Chen H, Zhang Z, van Donkelaar A, Bai L, Martin RV, Lavigne E, et al. 2020. Understanding the joint impacts of fine particulate matter concentration and composition on the incidence and mortality of cardiovascular disease: a component-adjusted approach. Environ Sci Technol 54(7):4388–4399, PMID: 32101425, 10.1021/acs.est.9b06861. [DOI] [PubMed] [Google Scholar]
- Cohen AJ, Brauer M, Burnett R, Anderson HR, Frostad J, Estep K, et al. 2017. Estimates and 25-year trends of the global burden of disease attributable to ambient air pollution: an analysis of data from the Global Burden of Diseases Study 2015. Lancet 389(10082):1907–1918, PMID: 28408086, 10.1016/S0140-6736(17)30505-6. [DOI] [PMC free article] [PubMed] [Google Scholar]
- Crouse DL, Philip S, van Donkelaar A, Martin RV, Jessiman B, Peters PA, et al. 2016. A new method to jointly estimate the mortality risk of long-term exposure to fine particulate matter and its components. Sci Rep 6:18916, PMID: 26732864, 10.1038/srep18916. [DOI] [PMC free article] [PubMed] [Google Scholar]
- Crouse DL, Pinault L, Balram A, Hystad P, Peters PA, Chen H, et al. 2017. Urban greenness and mortality in Canada’s largest cities: a national cohort study. Lancet Planet Health 1(7):e289–e297, PMID: 29851627, 10.1016/S2542-5196(17)30118-3. [DOI] [PubMed] [Google Scholar]
- Department of Veterans Affairs. 2009. VHA Handbook 1200.12 Transmittal sheet. Use of data and data repositories in VHA research. https://www.va.gov/vhapublications/ViewPublication.asp?pub_ID=1851 [accessed 1 March 2012].
- de Bont J, Casas M, Barrera-Gómez J, Cirach M, Rivas I, Valvi D, et al. 2019. Ambient air pollution and overweight and obesity in school-aged children in Barcelona, Spain. Environ Int 125:58–64, PMID: 30703612, 10.1016/j.envint.2019.01.048. [DOI] [PMC free article] [PubMed] [Google Scholar]
- GBD 2019 Risk Factors Collaborators. 2020. Global burden of 87 risk factors in 204 countries and territories, 1990–2019: a systematic analysis for the global burden of disease study 2019. Lancet 396(10258):1223–1249, PMID: 33069327, 10.1016/S0140-6736(20)30752-2. [DOI] [PMC free article] [PubMed] [Google Scholar]
- Goodloe R, Farber-Eger E, Boston J, Crawford DC, Bush WS. 2017. Reducing clinical noise for body mass index measures due to unit and transcription errors in the electronic health record. AMIA Jt Summits Transl Sci Proc 2017:102–111, PMID: 28815116. [PMC free article] [PubMed] [Google Scholar]
- Hamanaka RB, Mutlu GM. 2018. Particulate matter air pollution: effects on the cardiovascular system. Front Endocrinol (Lausanne) 9:680, PMID: 30505291, 10.3389/fendo.2018.00680. [DOI] [PMC free article] [PubMed] [Google Scholar]
- James P, Hart JE, Banay RF, Laden F. 2016. Exposure to greenness and mortality in a nationwide prospective cohort study of women. Environ Health Perspect 124(9):1344–1352, PMID: 27074702, 10.1289/ehp.1510363. [DOI] [PMC free article] [PubMed] [Google Scholar]
- Jerrett M, McConnell R, Chang CCR, Wolch J, Reynolds K, Lurmann F, et al. 2010. Automobile traffic around the home and attained body mass index: a longitudinal cohort study of children aged 10–18 years. Prev Med 50(suppl):S50–S58, PMID: 19850068, 10.1016/j.ypmed.2009.09.026. [DOI] [PMC free article] [PubMed] [Google Scholar]
- Jerrett M, McConnell R, Wolch J, Chang R, Lam C, Dunton G, et al. 2014. Traffic-related air pollution and obesity formation in children: a longitudinal, multilevel analysis. Environ Health 13:49, PMID: 24913018, 10.1186/1476-069X-13-49. [DOI] [PMC free article] [PubMed] [Google Scholar]
- Kind AJH, Buckingham WR. 2018. Making neighborhood-disadvantage metrics accessible—the Neighborhood Atlas. N Engl J Med 378(26):2456–2458, PMID: 29949490, 10.1056/NEJMp1802313. [DOI] [PMC free article] [PubMed] [Google Scholar]
- Lepeule J, Laden F, Dockery D, Schwartz J. 2012. Chronic exposure to fine particles and mortality: an extended follow-up of the Harvard Six Cities Study from 1974 to 2009. Environ Health Perspect 120(7):965–970, PMID: 22456598, 10.1289/ehp.1104660. [DOI] [PMC free article] [PubMed] [Google Scholar]
- Lipsitch M, Tchetgen Tchetgen E, Cohen T. 2010. Negative controls: a tool for detecting confounding and bias in observational studies. Epidemiology 21(3):383–388, PMID: 20335814, 10.1097/EDE.0b013e3181d61eeb. [DOI] [PMC free article] [PubMed] [Google Scholar]
- Madrigano J, Baccarelli A, Wright RO, Suh H, Sparrow D, Vokonas PS, et al. 2010. Air pollution, obesity, genes and cellular adhesion molecules. Occup Environ Med 67(5):312–317, PMID: 19884647, 10.1136/oem.2009.046193. [DOI] [PMC free article] [PubMed] [Google Scholar]
- Maynard C. 2017. Ascertaining Veterans’ Vital Status: VA data sources for mortality ascertainment and cause of death. Database & Methods Cyberseminar Series, Washington, DC, US Department of Veterans Affairs. https://www.hsrd.research.va.gov/for_researchers/cyber_seminars/archives/1242-notes.pdf [accessed 1 January 2020].
- McConnell R, Shen E, Gilliland FD, Jerrett M, Wolch J, Chang CC, et al. 2015. A longitudinal cohort study of body mass index and childhood exposure to secondhand tobacco smoke and air pollution: the Southern California Children’s Health Study. Environ Health Perspect 123(4):360–366, PMID: 25389275, 10.1289/ehp.1307031. [DOI] [PMC free article] [PubMed] [Google Scholar]
- McGinnis KA, Brandt CA, Skanderson M, Justice AC, Shahrir S, Butt AA, et al. 2011. Validating smoking data from the Veteran’s Affairs Health Factors dataset, an electronic data source. Nicotine Tob Res 13(12):1233–1239, PMID: 21911825, 10.1093/ntr/ntr206. [DOI] [PMC free article] [PubMed] [Google Scholar]
- Mendez R, Zheng Z, Fan Z, Rajagopalan S, Sun Q, Zhang K. 2013. Exposure to fine airborne particulate matter induces macrophage infiltration, unfolded protein response, and lipid deposition in white adipose tissue. Am J Transl Res 5:224–234, PMID: 23573366. [PMC free article] [PubMed] [Google Scholar]
- Miller KA, Siscovick DS, Sheppard L, Shepherd K, Sullivan JH, Anderson GL, et al. 2007. Long-term exposure to air pollution and incidence of cardiovascular events in women. N Engl J Med 356(5):447–458, PMID: 17267905, 10.1056/NEJMoa054409. [DOI] [PubMed] [Google Scholar]
- Miller MR, Raftis JB, Langrish JP, McLean SG, Samutrtai P, Connell SP, et al. 2017. Inhaled nanoparticles accumulate at sites of vascular disease. ACS Nano 11(5):4542–4552, PMID: 28443337, 10.1021/acsnano.6b08551. [DOI] [PMC free article] [PubMed] [Google Scholar]
- Murphy PA, Cowper DC, Seppala G, Stroupe KT, Hynes DM. 2002. Veterans Health Administration inpatient and outpatient care data: an overview. Eff Clin Pract 5(3 suppl):E4, PMID: 12166925. [PubMed] [Google Scholar]
- Muthalagu A, Pacheco JA, Aufox S, Peissig PL, Fuehrer JT, Tromp G, et al. 2014. A rigorous algorithm to detect and clean inaccurate adult height records within EHR systems. Appl Clin Inform 5(1):118–126, PMID: 24734128, 10.4338/ACI-2013-09-RA-0074. [DOI] [PMC free article] [PubMed] [Google Scholar]
- Nasari MM, Szyszkowicz M, Chen H, Crouse D, Turner MC, Jerrett M, et al. 2016. A class of non-linear exposure-response models suitable for health impact assessment applicable to large cohort studies of ambient air pollution. Air Qual Atmos Health 9(8):961–972, PMID: 27867428, 10.1007/s11869-016-0398-z. [DOI] [PMC free article] [PubMed] [Google Scholar]
- Noël PH, Copeland LA, Perrin RA, Lancaster AE, Pugh MJ, Wang CP, et al. 2010. VHA Corporate Data Warehouse height and weight data: opportunities and challenges for health services research. J Rehabil Res Dev 47(8):739–750, PMID: 21141302, 10.1682/JRRD.2009.08.0110. [DOI] [PubMed] [Google Scholar]
- Oddone EZ, Eisen S. 2008. Veterans Affairs Research and Development: using science to improve health care for veterans. N C Med J 69(1):35–37, PMID: 18429564, 10.18043/ncm.69.1.35. [DOI] [PubMed] [Google Scholar]
- Orioli R, Antonucci C, Scortichini M, Cerza F, Marando F, Ancona C, et al. 2019. Exposure to residential greenness as a predictor of cause-specific mortality and stroke incidence in the Rome Longitudinal Study. Environ Health Perspect 127(2):27002, PMID: 30775931, 10.1289/EHP2854. [DOI] [PMC free article] [PubMed] [Google Scholar]
- Pope CA III, Turner MC, Burnett RT, Jerrett M, Gapstur SM, Diver WR, et al. 2015. Relationships between fine particulate air pollution, cardiometabolic disorders, and cardiovascular mortality. Circ Res 116(1):108–115, PMID: 25348167, 10.1161/CIRCRESAHA.116.305060. [DOI] [PubMed] [Google Scholar]
- Remington PL, Catlin BB, Gennuso KP. 2015. The County Health Rankings: rationale and methods. Popul Health Metr 13:11, PMID: 25931988, 10.1186/s12963-015-0044-2. [DOI] [PMC free article] [PubMed] [Google Scholar]
- Robusto CC. 1957. The Cosine-Haversine formula. Am Math Mon 64(1):38–40, 10.2307/2309088. [DOI] [Google Scholar]
- Sun Q, Yue P, Deiuliis JA, Lumeng CN, Kampfrath T, Mikolaj MB, et al. 2009. Ambient air pollution exaggerates adipose inflammation and insulin resistance in a mouse model of diet-induced obesity. Circulation 119(4):538–546, PMID: 19153269, 10.1161/CIRCULATIONAHA.108.799015. [DOI] [PMC free article] [PubMed] [Google Scholar]
- Umberson D. 1992. Gender, marital status and the social control of health behavior. Soc Sci Med 34(8):907–917, PMID: 1604380, 10.1016/0277-9536(92)90259-S. [DOI] [PubMed] [Google Scholar]
- University of Wisconsin School of Medicine and Public Health. 2015. 2015 Area Deprivation Index v2.0. https://www.neighborhoodatlas.medicine.wisc.edu [accessed 28 February 2021].
- U.S. Department of Veterans Affairs Information Resource Center. 2007a. Research user guide: VHA medical SAS® inpatient datasets fy2006. U.S. Department of Veterans Affairs. VA information resource center: Hines, IL, September 2007. https://vaww.virec.research.va.gov/RUGs/RUGs-Index.htm [accessed 1 January 2020].
- U.S. Department of Veterans Affairs Information Resource Center. 2007b. Research user guide: VHA medical SAS® outpatient datasets fy2006. U.S. Department of veterans affairs. VA information resource center: Hines, IL, September 2007. https://vaww.virec.research.va.gov/RUGs/RUGs-Index.htm [accessed 1 January 2020].
- U.S. Department of Veterans Affairs Information Resource Center. 2009. Research user guide: Veterans health administration decision support system clinical national data extracts, Hines, IL, U.S. Department of Veterans Affairs. VA information resource center September 2009. https://vaww.virec.research.va.gov/RUGs/RUGs-Index.htm [accessed 1 January 2020].
- U.S. Department of Veterans Affairs Information Resource Center. 2015. VIREC Research User Guide: PSSG Geocoded Enrollee Files 2015 Edition. Washington, DC: U.S. Department of Veterans Affairs Health Services Research & Development. https://vaww.virec.research.va.gov/RUGs/RUGs-Index.htm [accessed 1 January 2020]. [Google Scholar]
- U.S. EPA (U.S. Environmental Protection Agency). 2013. National ambient air quality standards for particulate matter, final rule. Docket No. EPA-HQ-OAR-2007-0492. Fed Reg 78(10):3085–3287. https://www.federalregister.gov/documents/2013/01/15/2012-30946/national-ambient-air-quality-standards-for-particulate-matter [accessed 28 February 2021]. [Google Scholar]
- U.S. EPA. 2020. Annual summary data- concentration by monitor. https://aqs.epa.gov/aqsweb/airdata/download_files.html#Annual [accessed 28 February 2021].
- van Donkelaar A, Martin RV, Li C, Burnett RT. 2019. Regional estimates of chemical composition of fine particulate matter using a combined geoscience-statistical method with information from satellites, models, and monitors. Environ Sci Technol 53(5):2595–2611, PMID: 30698001, 10.1021/acs.est.8b06392. [DOI] [PubMed] [Google Scholar]
- Vermote E. 2019. NOAA Climate Data Record (CDR) of AVHRR Surface Reflectance, Version 5. Updated 28 December 2019. Washington, DC: National Oceanic and Atmospheric Administration National Centers for Environmental Information. https://data.noaa.gov/dataset/dataset/noaa-climate-data-record-cdr-of-avhrr-surface-reflectance-version-5 [accessed 28 February 2021]. [Google Scholar]
- Vienneau D, de Hoogh K, Faeh D, Kaufmann M, Wunderli JM, Röösli M, et al. 2017. More than clean air and tranquillity: residential green is independently associated with decreasing mortality. Environ Int 108:176–184, PMID: 28863390, 10.1016/j.envint.2017.08.012. [DOI] [PubMed] [Google Scholar]
- Xie Y, Bowe B, Gibson AK, McGill JB, Maddukuri G, Yan Y, et al. 2020. Comparative effectiveness of SGLT2 inhibitors, GLP-1 receptor agonists, DPP-4 inhibitors, and sulfonylureas on risk of kidney outcomes: emulation of a target trial using health care databases. Diabetes Care 43(11):2859–2869, PMID: 32938746, 10.2337/dc20-1890. [DOI] [PubMed] [Google Scholar]
- Xie Y, Bowe B, Li T, Xian H, Balasubramanian S, Al-Aly Z. 2016. Proton pump inhibitors and risk of incident CKD and progression to ESRD. J Am Soc Nephrol 27(10):3153–3163, PMID: 27080976, 10.1681/ASN.2015121377. [DOI] [PMC free article] [PubMed] [Google Scholar]
- Xie Y, Bowe B, Li T, Xian H, Yan Y, Al-Aly Z. 2017. Long-term kidney outcomes among users of proton pump inhibitors without intervening acute kidney injury. Kidney Int 91(6):1482–1494, PMID: 28237709, 10.1016/j.kint.2016.12.021. [DOI] [PubMed] [Google Scholar]
- Xie Y, Bowe B, Yan Y, Xian H, Li T, Al-Aly Z. 2019. Estimates of all cause mortality and cause specific mortality associated with proton pump inhibitors among US veterans: cohort study. BMJ 365:l1580, PMID: 31147311, 10.1136/bmj.l1580. [DOI] [PMC free article] [PubMed] [Google Scholar]
- Xu X, Yavar Z, Verdin M, Ying Z, Mihai G, Kampfrath T, et al. 2010. Effect of early particulate air pollution exposure on obesity in mice: role of p47phox. Arterioscler Thromb Vasc Biol 30(12):2518–2527, PMID: 20864666, 10.1161/ATVBAHA.110.215350. [DOI] [PMC free article] [PubMed] [Google Scholar]
- Zou MH. 2010. Is NAD(P)H oxidase a missing link for air pollution-enhanced obesity? Arterioscler Thromb Vasc Biol 30(12):2323–2324, PMID: 21084700, 10.1161/ATVBAHA.110.216648. [DOI] [PMC free article] [PubMed] [Google Scholar]
Associated Data
This section collects any data citations, data availability statements, or supplementary materials included in this article.