

Abstract
Introduction:
The Clinical Dementia Rating (CDR) is widely used in Alzheimer’s disease research studies and has well established reliability and validity. To facilitate the development of an online, electronic CDR (eCDR) for more efficient clinical applications, this study aims to produce a shortened version of the CDR, and to develop the statistical model for automatic scoring.
Methods:
Item response theory (IRT) was used for item evaluation and model development. An automatic scoring algorithm was validated using existing CDR global and domain box scores as the reference standard.
Results:
Most CDR items discriminate well at mild and very mild levels of cognitive impairment. The bi-factor IRT model fits best and the shortened CDR still demonstrates very high classification accuracy (81%~92%).
Discussion:
The shortened version of the CDR and the automatic scoring algorithm has established a good foundation for developing an eCDR and will ultimately improve the efficiency of cognitive assessment.
Keywords: Alzheimer’s disease, bi-factor model, Clinical Dementia Rating, cognitive assessment, dementia severity, item response theory
1 |. INTRODUCTION
The determination of the presence and severity of dementia symptoms is critical for observational studies of Alzheimer’s disease (AD) and for patient care. Severity of dementia may be used as entry criteria into clinical trials or analyzed as a primary outcome to assess treatment efficacy. The Clinical Dementia Rating (CDR) is a widely used multidimensional measure of intra-individual decline in cognition, behavior, and function, using the individual’s previously attained abilities in these domains as the reference.1,2 It thus minimizes confounding factors such as age, sex, education/literacy, race or ethnicity, and culture. When dementia is present, the CDR monitors its entire course from very mild to severe, avoiding floor and ceiling effects. Information to rate the CDR is obtained by independent semi-structured interviews conducted by an experienced clinician with the study participant and a study partner (typically the spouse or adult child). The information from the interviews and tests of cognitive function are used to rate each of six cognitive and functional domains (Memory, Orientation, Judgment and Problem Solving, Community Affairs, Home and Hobbies, Personal Care), on a 5-point scale on which a score of 0 represents no impairment, and 0.5, 1, 2, and 3 represent very mild, mild, moderate, and severe dementia, respectively. Descriptive anchors guide the appropriate rating for each severity level in each domain. The ratings in each of the six domains are synthesized by the experienced clinician using clinical judgment in accordance with well-established scoring rules to yield the global CDR, indicating cognitive normality (CDR 0) or very mild, mild, moderate, or severe dementia (CDR 0.5, 1, 2, or 3). The CDR is an ordinal scale; not all domains necessarily are impaired to the same degree. Totaling the ratings for each domain, or “box,” provides the more quantitative SumBox score (CDR-SB), with a range of 0 (no impairment) to 18 (severe impairment).3
The CDR has been validated by neuropathologic confirmation4 and has established content and criterion validity.5 Its reliability also has been established,6,7 including in multicenter settings.8,9 The CDR training and certification protocols are available at https://knightadrc.wustl.edu/CDR/CDR.htm, as is its scoring algorithm. The CDR is sensitive to even the mildest symptomatic stages of AD.10,11 These attributes have established the CDR as the research global staging instrument for dementia worldwide. The CDR-SB often is used as a primary outcome measure in clinical trials of investigational anti-AD drugs (eg, Clinical Trials.gov identifiers NCT0284547 and NCT03887455).
Potential drawbacks to the CDR include the time to conduct two interviews (limiting its use in the clinic) and the reliance on the judgment of an experienced clinician. As mentioned, a trained clinician synthesizes all available information from the participant and the study partner to determine the domain box score (0, 0.5, 1, 2, and 3). However, it is unclear the degree and manner to which each question affects the box score and whether specific questions may be more diagnostic of dementia status than others. Furthermore, there may be substantial variability of dementia severity within the same levels of a global CDR score.12,13 Item response theory (IRT) is a class of latent variable models which provides an ideal framework to thoroughly evaluate the individual CDR questions (items).14 Different from the classic test theory, IRT models the response pattern as a function of the respondent’s latent ability (eg, degree of cognitive impairment), as well as the difficulty and the discrimination level of each item. Previous studies have suggested the IRT method provides a more precise measure of dementia severity15,16 and can uniquely predict cognitive status and activities of daily living within global levels of CDR.12,13,17 However, a majority of the studies limited their IRT analysis to the individual box scores rather than the specific items from the CDR. Therefore the current research aims to (1) use IRT models to systematically evaluate each item in the CDR interview in terms of difficulty, discrimination, and information level to identify items that are most diagnostic of dementia severity and (2) develop the best fitting IRT model and the algorithm for automatically scoring dementia severity, and validate their performance using existing measures: CDR global and box scores. By identifying specific items that contribute most to the CDR staging, we then can develop a shortened version of the CDR that maintains the same level of psychometric properties as its original version, with decreased participant, study partner, and administrator burden. A shortened version of the CDR and an automatic scoring algorithm will facilitate the ongoing development of an electronic CDR (eCDR) that can be administered remotely to participants and study partner,18 without the need for an assessor for administration or scoring. An eCDR can ultimately be deployed as a screening tool in the general population, in online registries, and in various health-care settings; it can also accelerate proper enrollment into aging and dementia clinical and observational studies.
2 |. METHODS
2.1 |. Participants
A total of 2949 participants enrolled in the Memory and Aging Project (MAP) prior to 2018 at Washington University in St. Louis with at least one CDR assessment were considered for inclusion. Due to the challenge for people with moderate or severe dementia to do an online CDR and current AD clinical trials focusing more on prevention, 55 participants with more severe levels of impairment (baseline CDR of 2 or 3) were excluded. All participants provided written informed consent and the studies were approved by the Human Research Protections Office at Washington University in St. Louis.
2.2 |. Measures
The CDR consists of 71 questions/items designed to measure impairment in six cognitive and functional domains (Memory, Orientation, Judgment and Problem Solving, Community Affairs, Home and Hobbies, and Personal Care) on a five-point ordinal scale in which 0, 0.5, 1, 2, and 3 represent no impairment, very mild, mild, moderate, and severe impairment, respectively. The domain of Personal Care uses a 4-point scale (0, 1, 2, and 3). All the questions in the CDR were included in the analysis except (1) question 10 for informant from Community Affairs domain, which has no data available (this question was only asked between 1988 and 1993, and the data were not collected) and (2) all five questions in the Home and Hobbies domain because the MAP database only collected data from question 4. This left a total of 65 items to be included in the IRT analysis (see Table S1 in supporting information for the list of items and their response options with dummy coding).
2.3 |. Procedures
Participants in MAP receive comprehensive neurological, neuropsychological evaluation annually, including the CDR. Although many participants have longitudinal CDR data available, for the purposes of developing an IRT model, we only included baseline data in the present analyses. Details of the MAP assessment protocol can be found elsewhere.19
2.4 |. Data analysis
Items were modeled as ordinal variables containing two to five response options using two parameter logistic models (for dichotomous variable) and graded response models (for polytomous variable).20,21 Maximum likelihood method (for unidimensional IRT) and Metropolis-Hastings Robbins-Monro method (for multidimensional IRT) were used for parameter estimations.22 IRT analyses were first performed on the items for each domain separately, then all the items were modeled together. A flowchart for the statistical analysis performed is presented in Figure 1.
FIGURE 1.
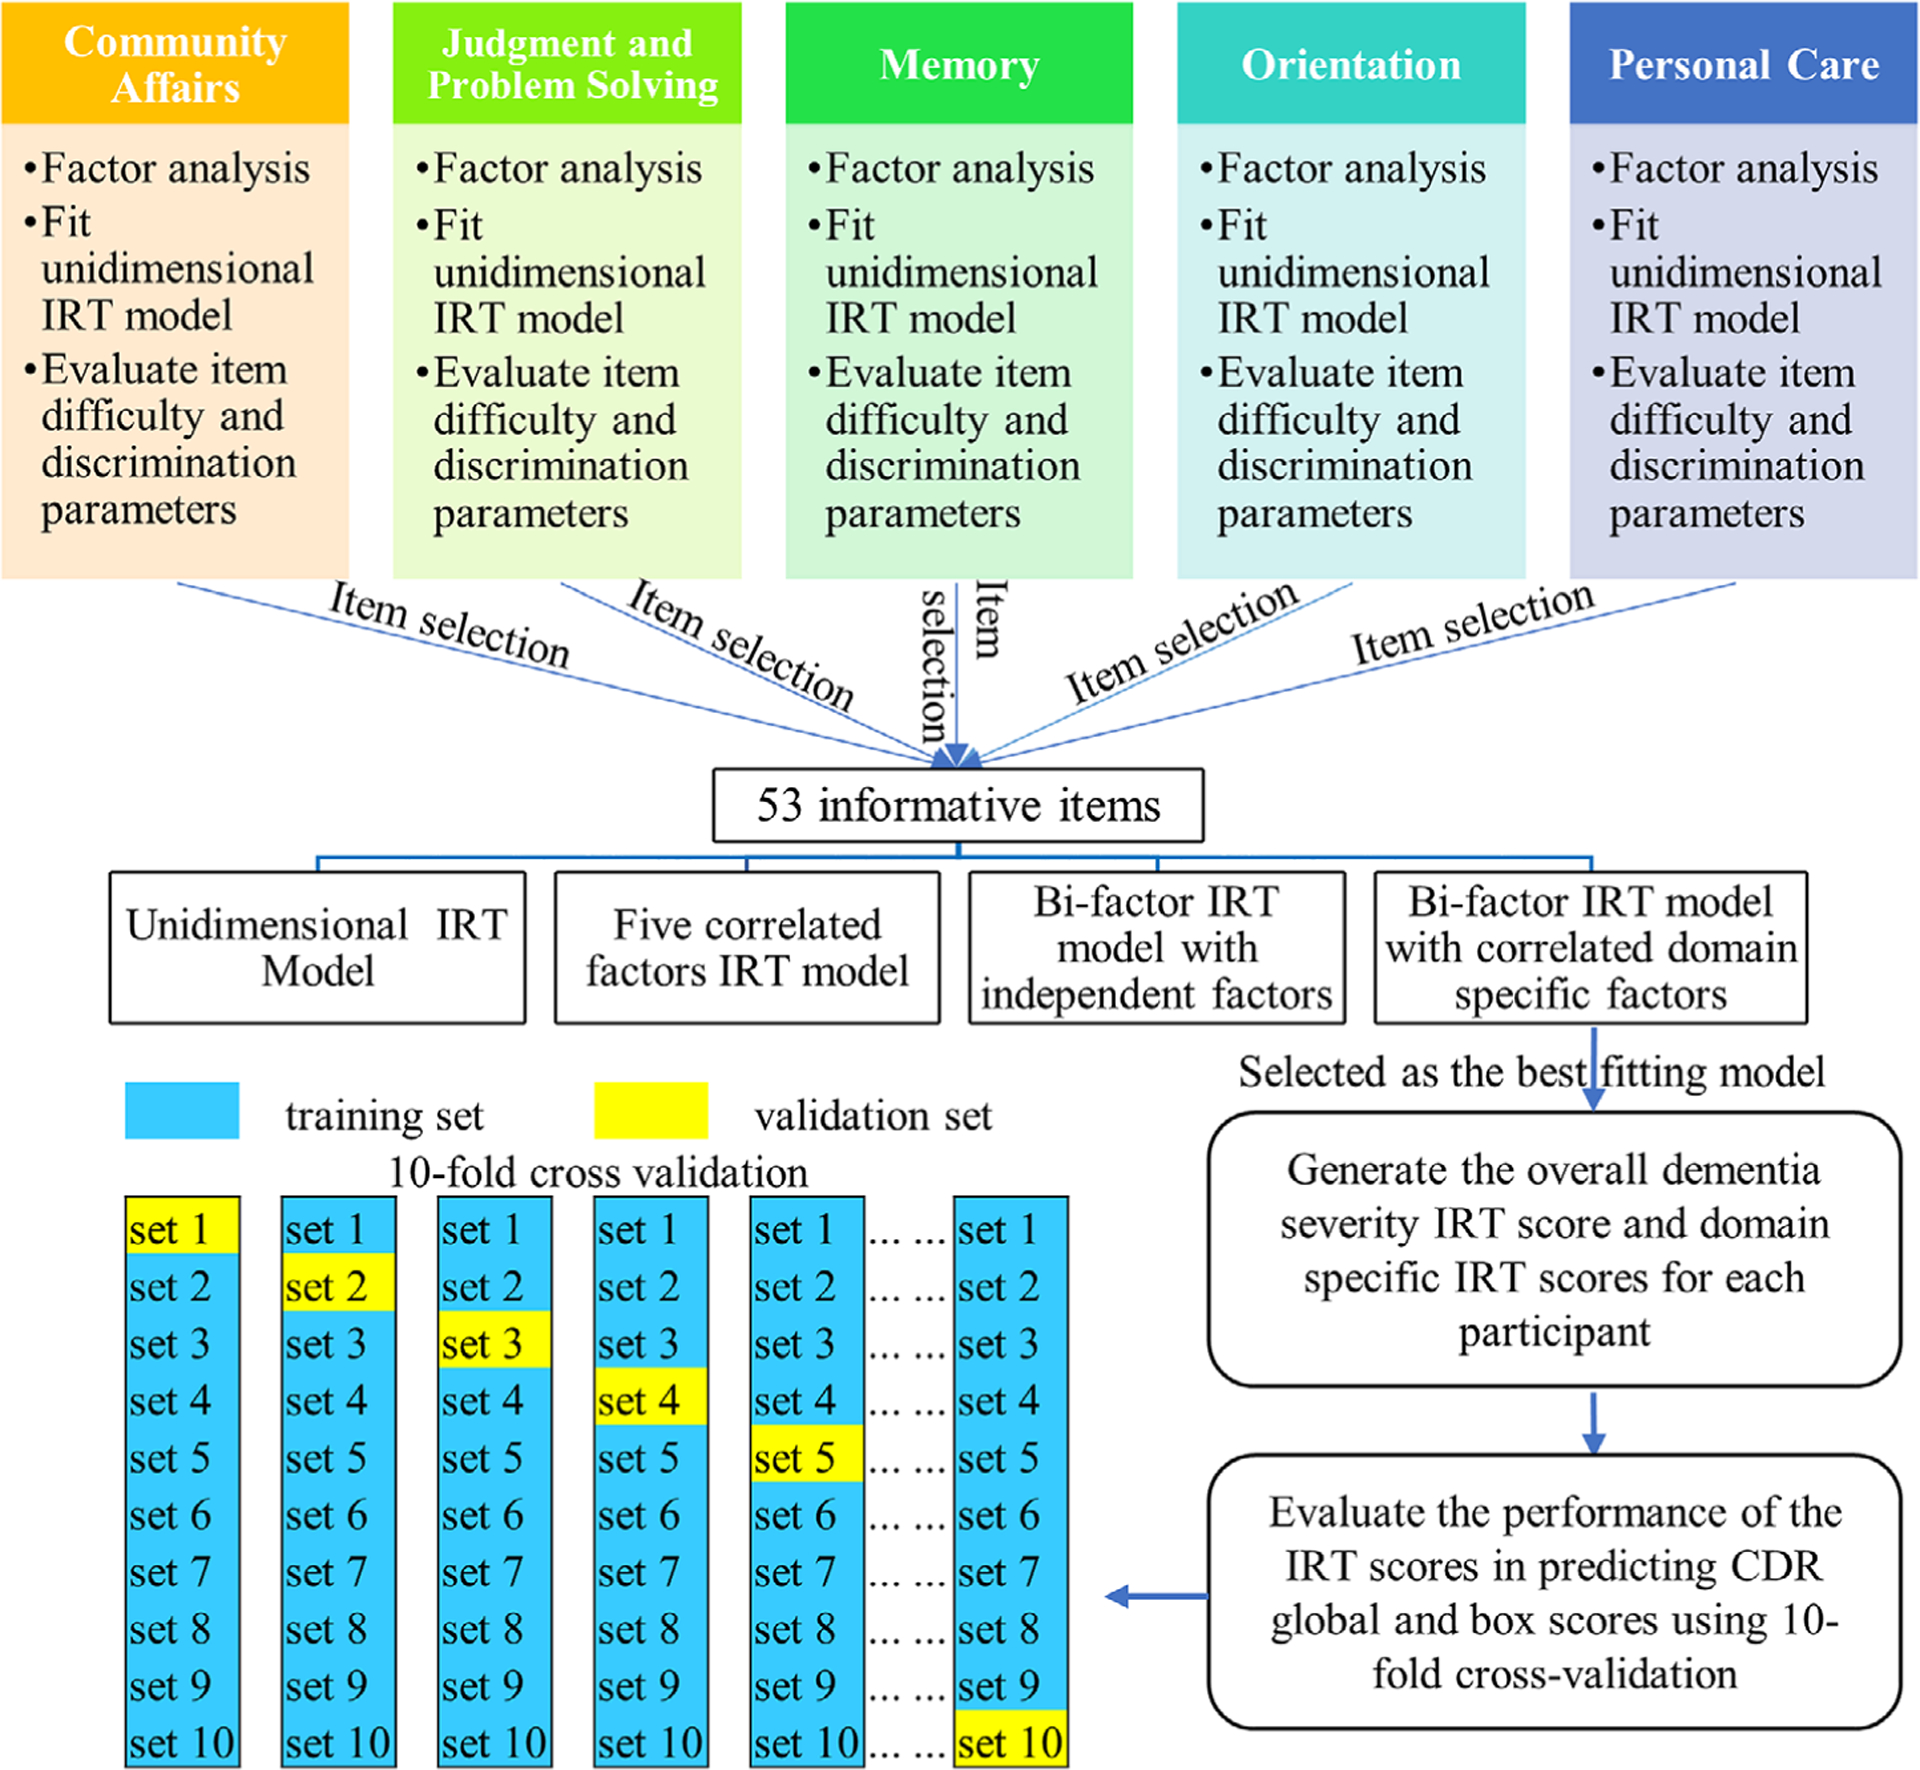
Flowchart of the statistical analysis. For 10-fold cross validation, the training set was used to (1) fit the bi-factor item response theory (IRT) model, which was then used to estimate the overall IRT scores and the domain-specific IRT scores for all participants in the training set and the validation set, (2) find the optimal cutoffs for the IRT scores that can classify participants in the training set into three groups (0, 0.5, and 1 for Clinical Dementia Rating global; 0, 0.5 and ≥1 for box scores). Then the same cutoffs derived from the training set will be applied to the IRT scores of the participants in the validation set to evaluate the classify accuracy of the IRT scores
To determine which items contribute most to the estimation of participants’ degree of cognitive impairment, a unidimensional model for each domain was fitted to evaluate the difficulty, discrimination, and information level of each item. Exploratory and confirmatory factor analyses were also performed to confirm the unidimensionality of each domain. Item information curves were used for item retention or removal within each domain. The total information curve before and after excluding those least informative items were compared to further verify that those least informative items could be excluded from a shortened version of the CDR.
Based on the selected 53 (out of 65) informative items and the latent structure of the CDR, we compared the fit of four predefined models as illustrated in Figure 2: (1) Model A: a unidimensional IRT model with all items contributing to a general factor; (2) Model B: a multidimensional IRT model23 with five correlated factors for five domains in the CDR; (3) Model C: a bi-factor model24,25 with a general factor contributed by all items, and five uncorrelated factors corresponding to the five domains of the CDR; (4) Model D: the same bi-factor model as Model C but allowing correlations between the domain specific factors because we expect some domains to be correlated, eg, memory and orientation are closely linked and interdependent process. Local dependence X2 indexes26 were examined to ensure local independence assumption was not violated. Model fit was examined using log likelihood, Akaike information criterion (AIC), and the Bayesian information criterion (BIC).27,28 Reliability was evaluated using Omega coefficient.29,30 The best-fitting model was selected for further measure development and refinement.
FIGURE 2.
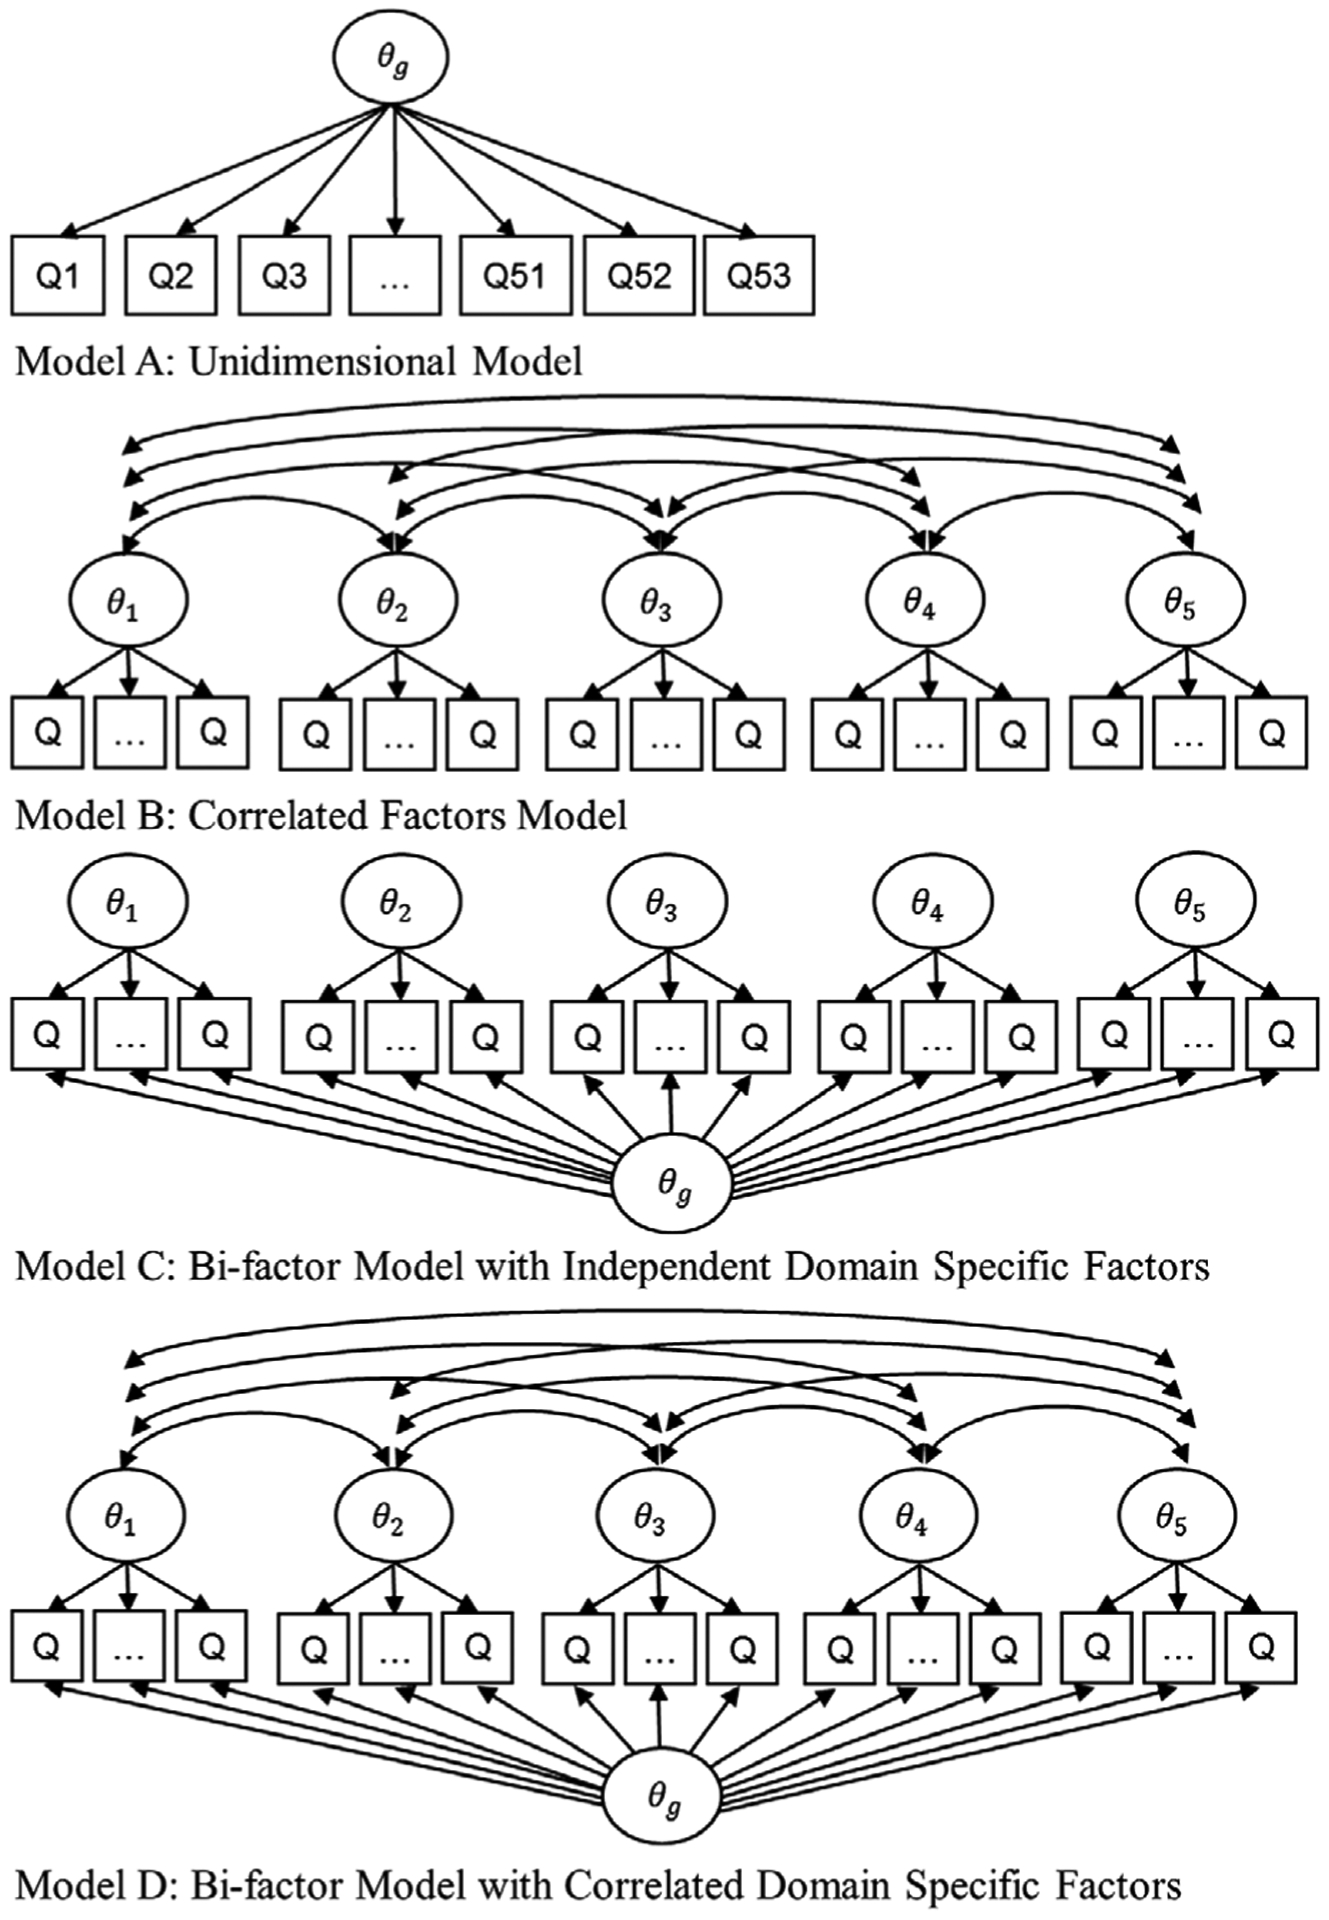
Latent factor structures of the four item response theory models. θg is the general factor and θ1, θ2, … , θ5 are the domain-specific factors. Q is for question
To generate box scores and CDR global scores automatically, domain-specific factors and general factors were first estimated from the best fitting model. From this model we extracted two scores: (1) domain scores: estimated as a weighted composite of the general factor and the corresponding domain specific factor, and (2) the overall score: estimated as a weighted composite of the general factor and all the domain-specific factors. These model-derived IRT scores can then map onto the box scores for the domains and the CDR global, respectively. The item discrimination parameters for the general factor and the domain-specific factors were used to compute the weights according to the Bi-factor M4 method proposed in Liu et al.31 This weighting scheme has been demonstrated to be the most accurate and reliable under most conditions.
Next, using the existing box scores and CDR global in the data as the frame of reference, the classification accuracy of the model-derived domain scores and the overall scores were evaluated using 10-fold cross-validation in terms of volume under the surface (VUS) for outcome with three ordinal diagnostic groups (0, 0.5, and ≥1 for box scores; 0, 0.5, and 1 for CDR global) and area under the curve (AUC) for Personal Care domain score with two groups (0, ≥1)32,33 Optimal cutoffs for maximizing the overall classification accuracy were also derived using the methods proposed by Luo and Xiong.34,35 As box scores of 2 or 3 are rare for participants who are CDR global ≤1, they were not counted as separate diagnostic groups (but grouped with box score of 1 as ≥1) to reduce the computational burden when evaluating the classification accuracy of the IRT scores.
IRT analyses were conducted using IRTPRO 4.2 (Scientific Software International, Inc) and the R mirt package.36 Classification analysis was carried out using the R DiagTest3Grp package.35
3 |. RESULTS
3.1 |. Characteristics of study participants
Demographic and clinical characteristics of the 2894 participants included in this study are presented in Table 1. The average age was 71.4 years (standard deviation [SD] 8.9). They had an average of 14.4 years of education (SD 3.4). Females made up 58.6%. In total 83.6% were White and 15.6% were Black. For cognition, 46% were CDR global of 0, 32% were CDR global of 0.5, and 22% were CDR global of 1.
TABLE 1.
Characteristics of study population
| Characteristic | Category | All (n = 2894) |
|---|---|---|
| Age (mean ± SD) | 71.4 ± 8.9 | |
| Education (mean ± SD) | 14.4 ± 3.4 | |
| Gender (n, %) | Female | 1695 (58.6%) |
| Race (n, %) | Black | 452 (15.6%) |
| White | 2418 (83.6%) | |
| other | 23 (0.8%) | |
| CDR global (n,%) | 0 | 1344 (46.5%) |
| 0.5 | 921 (31.8%) | |
| 1 | 629 (21.7%) |
Abbreviations: CDR, Clinical Dementia Rating; SD, standard deviation.
3.2 |. Item selection procedures
Factor analyses indicated that the unidimensionality assumption for each domain was reasonable for item selection purpose. Exploratory factor analysis revealed a large first (dominant) factor in each domain with an eigenvalue of 4.7 (47% of the variance) for Community Affairs,8.3 (56% of the variance) for Judgment and Problem Solving, 10.5 (55% of the variance) for Memory, 9.6 (60% of the variance) for Orientation, 2.7 (69% of the variance) for Personal Care. All the subsequent eigenvalues were substantially smaller than the first one. The unidimensionality was further supported by the high Tucker-Lewis index (TLI),37 comparative fit index (CFI),38 and the low root mean square error of approximation (RMSEA) from the confirmatory factor analysis (Table S2 in supporting information). TLIs and CFIs of the five domains are all close to or greater than 0.95, and RMSEAs were all less than 0.08, indicating reasonable model fit. According to Hu and Bentler, the hypothesized model provides a good fit when TLI and CFI values are close to 0.95, and RMSEA value is less than 0.05 (reasonable fit if RMSEA values <0.08).39 Omega coefficients for the reliability are also provided in Table S2.
The discrimination and difficulty level of each item estimated from the unidimensional model for each domain are reported in Table S3 in supporting information. Each individual item information curve (not shown due to the large number of items) indicated that the following 12 items contributed little information in estimating participants’ degree of cognitive impairment and were considered for exclusion: question (Q) 1, 2, 4a, 4b, 8, and 9 for study partner in Community Affairs domain; Q4 for study participant and Q6 for study partner in Judgment and Problem Solving domain; Q1 for study participant in Memory domain; Q6, 7, 8 for study participant in Orientation domain. To further confirm these least informative items can be excluded, we compared the total information curves with all the items and without the aforementioned items for each domain (Figure 3). The two information curves in each domain almost overlapped, which indicated the loss in information was negligible when excluding these least informative items, and therefore these 12 items were not included for further model development.
FIGURE 3.
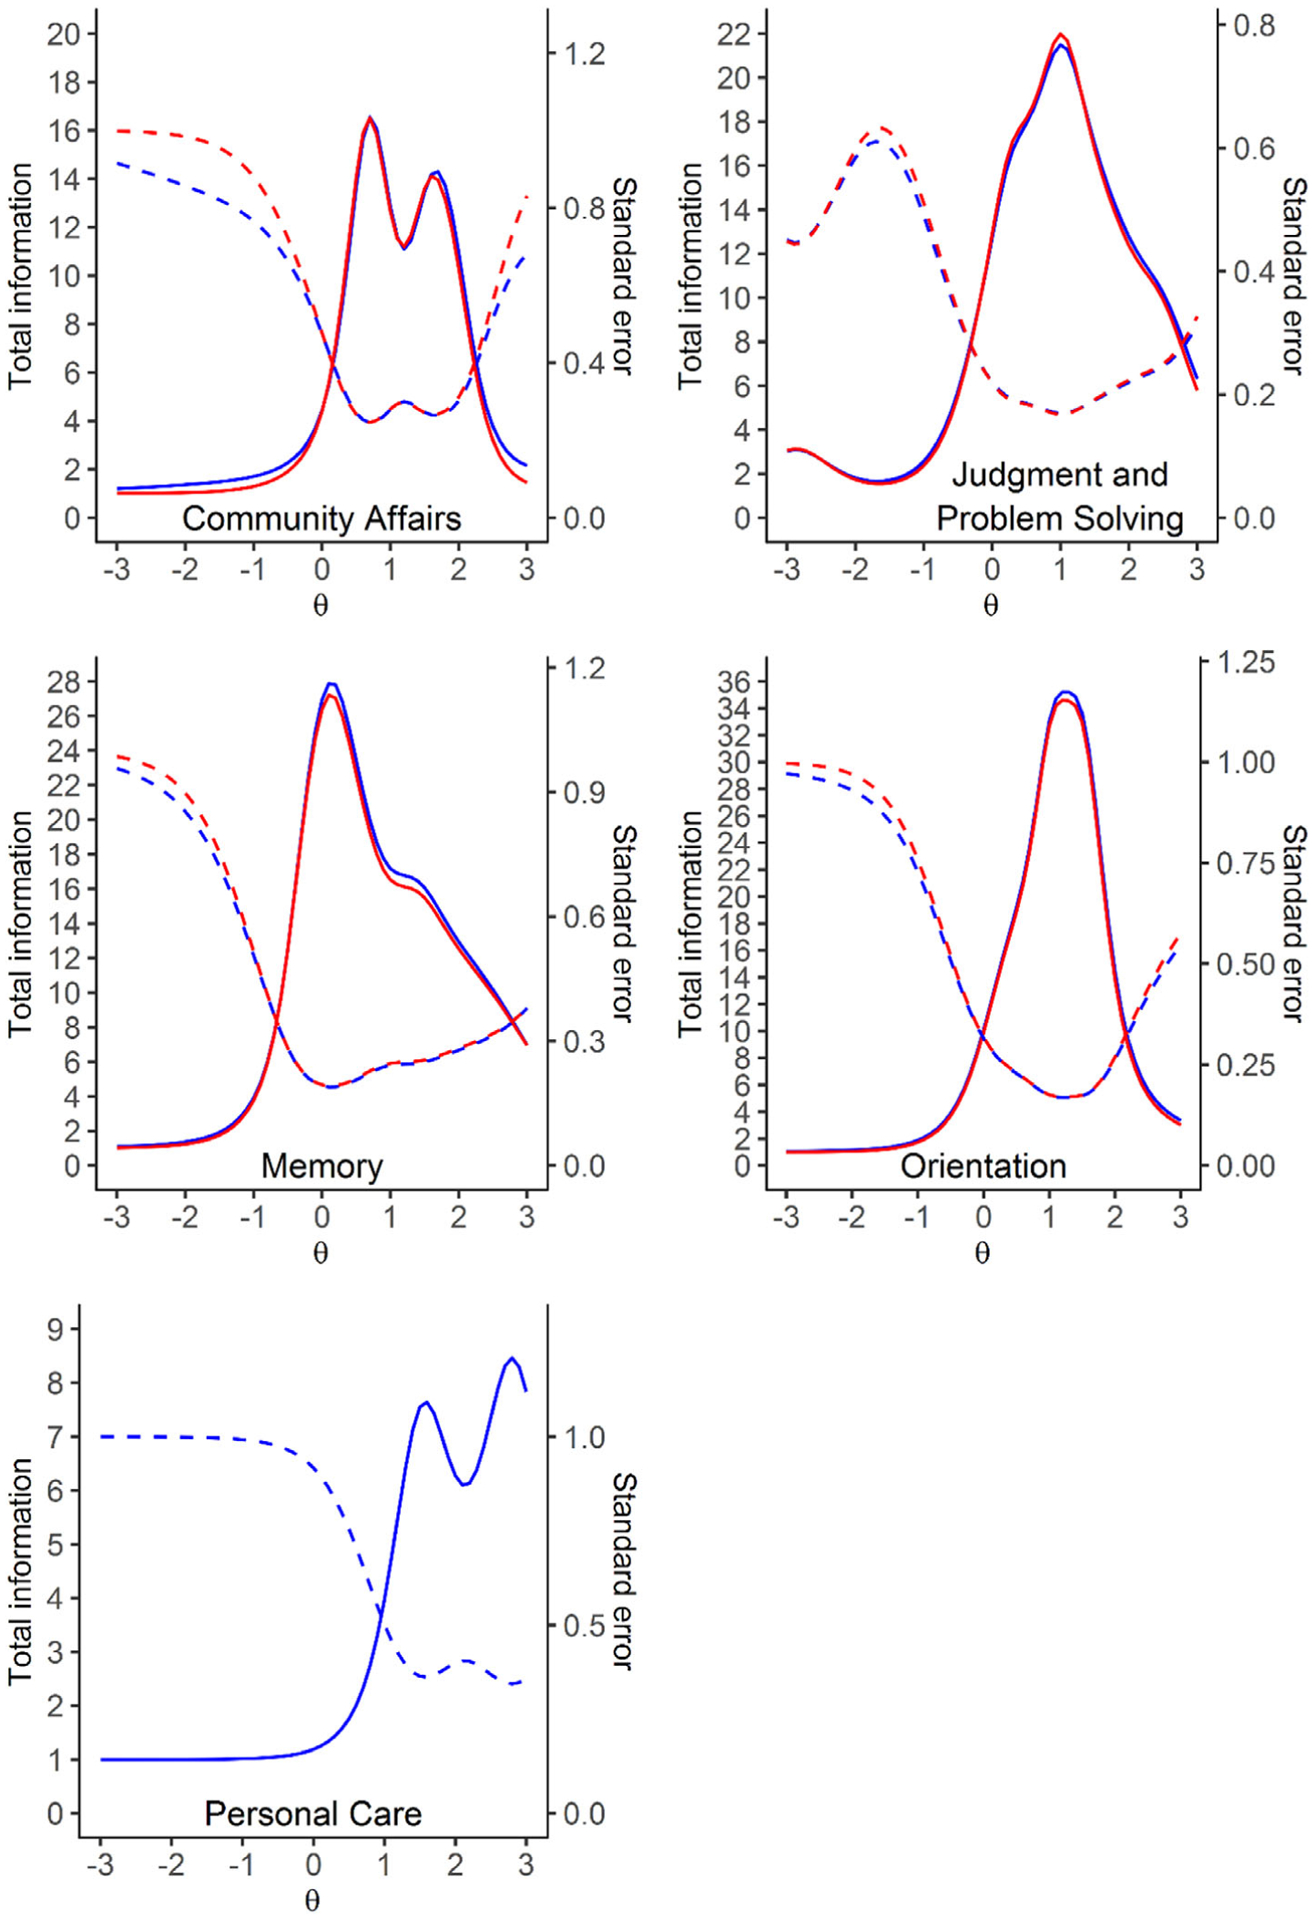
Total information curve. Solid lines are the total information curve and dashed lines are the standard error (blue: including all the items; red: after excluding those least informative items). Those least informative items are questions (Q) 1, 2, 4a, 4b, 8, and 9 for study partner in Community Affairs domain; Q4 for study participant and Q6 for study partner in Judgment and Problem solving domain; Q1 for study participant in Memory domain; Q6, 7, 8 for study participant in Orientation domain. The two information curves in each domain almost overlapped indicating the loss in information was negligible
3.3 |. Model selection
Comparisons of our four pre-specified models (see Figure 2) indicated that Model D—the bi-factor model with correlated domain-specific factors had significantly higher log likelihood (–53935, P < .0001), lower AIC and BIC than the other three models (see Table 2), and very high reliability (Omega coefficient is 0.99 for the general factor,0.89 for Community Affairs, 0.96 for Judgment and Problem Solving,0.97 for Memory, 0.97 for Orientation, and 0.90 for Personal Care), and was therefore chosen as the final model for cognitive measure development. Correlations (0.15 ~ 0.81) between domain-specific factors are shown in Suppleentary Table S4 in supporting information. Item statistics for each item and their respective domain can be found in Table S5 in supporting information. Factor loadings from the final model, which represent the correlation between each item and the factors, are reported in Table S6 in supporting information. For the primary factor, factor loadings ranged from 0.35 to 0.94 with majority of the items had primary factor loading greater than 0.5, which indicates items were moderately to highly correlated with the primary factor. For the domain-specific factors, factor loadings ranged from 0.03 to 0.73, which was on average lower than the primary factor loading. It is noteworthy that, for the Judgment and Problem Solving domain, Memory domain, and Orientation domain, in which there are questions for both the study participant and the study partner, primary factor loadings of questions for the study partner were much larger than that for the study participant (mean of primary factor loading 0.832 for study partner vs 0.560 for study participants), while it was the opposite for the domain-specific factor loadings (mean of primary factor loading 0.197 for study partner vs 0.563 for study participants).
TABLE 2.
Comparison of the goodness-of-fit statistics. Lower AIC or BIC values indicate better model performance
| Model | AIC | BIC | log likelihood | Chi-square* | DF* | P value* |
|---|---|---|---|---|---|---|
| One-factor (unidimensional) model | 111805 | 112677 | −55756 | |||
| Five correlated factors model | 110810 | 111741 | −55249 | 1015 | 10 | <.0001 |
| Bi-factor model (no correlation between factors) | 109009 | 110197 | −54305 | 1887 | 43 | <.0001 |
| Bi-factor model with correlated domain-specific factors | 108290 | 109538 | −53935 | 739 | 10 | <.0001 |
For the comparison to the model in the prior row.
Abbreviations: AIC, Akaike information criterion; BIC, Bayesian information criterion; DF, degree of freedom.
3.4 |. Accuracy of the IRT scores in estimating box score for each domain and CDR global
Domain scores and overall scores were automatically generated based on the bi-factor model and the scoring algorithm presented in section 2.4. The performance of these model-derived IRT scores in estimating the box score for each domain and the CDR global were evaluated using VUS (except for Personal Care domain for which AUC was used). The means of the VUSs and AUC from the 10-fold cross-validation and their 95% confidence interval (CI) are shown in Table 3. The mean VUSs and AUC are all greater than 0.8 (0.82 ~ 0.96), which demonstrates the high discriminative ability of the domain scores and the overall scores generated from the bi-factor model. The Memory domain scores (VUS 0.91) and the Personal Care domain scores (AUC 0.96) performs especially well in estimating their corresponding box scores, and the overall scores performs remarkably well in estimating the CDR global. The small SDs (0.01 ~ 0.03) of the VUSs and AUCs from the cross-validation indicate the parameter estimates for the bi-factor IRT model and the prediction performance were consistent across different subset of the data. The optimal cutoff values for classifying the box scores and the CDR global into three categories (0, 0.5, ≥1) and the classification accuracy are also provided in Table 3. As can be seen in Table 3, the overall classification accuracy were all above 0.8 (0.81 ~ 0.92).
TABLE 3.
Performance of the domain scores and the overall scores automatically generated from the bi-factor model in predicting the existing box scores and CDR global
| Classification accuracy** | ||||||||||
|---|---|---|---|---|---|---|---|---|---|---|
| VUS or AUC | 95% CI | Cutoff | Cutoff | Box score | ||||||
| 1 | 2 | 0 | 0.5 | ≥ 1 | Overall | |||||
| Community Affairs | mean | 0.82 | 0.76 | 0.89 | 0.15 | 0.86 | 0.85 | 0.75 | 0.8 | 0.81 |
| SD | 0.03 | 0.09 | 0.09 | 0.04 | 0.05 | 0.07 | 0.03 | |||
| Judgment and Problem Solving | mean | 0.87 | 0.82 | 0.92 | −0.07 | 0.65 | 0.86 | 0.79 | 0.83 | 0.83 |
| SD | 0.02 | 0.04 | 0.04 | 0.03 | 0.06 | 0.03 | 0.02 | |||
| Memory | mean | 0.91 | 0.87 | 0.95 | −0.16 | 0.56 | 0.89 | 0.84 | 0.87 | 0.87 |
| SD | 0.01 | 0.05 | 0.05 | 0.03 | 0.03 | 0.03 | 0.02 | |||
| Orientation | mean | 0.85 | 0.8 | 0.91 | 0.04 | 0.72 | 0.85 | 0.83 | 0.81 | 0.83 |
| SD | 0.02 | 0.03 | 0.04 | 0.03 | 0.04 | 0.05 | 0.02 | |||
| Personal Care* | mean | 0.96 | 0.97 | 0.99 | 0.63 | 0.91 | 0.96 | 0.92 | ||
| SD | 0.02 | 0.13 | 0.06 | 0.04 | 0.05 | |||||
| CDR global | mean | 0.94 | 0.91 | 0.96 | −0.13 | 0.7 | 0.91 | 0.85 | 0.91 | 0.89 |
| SD | 0.01 | 0.04 | 0.06 | 0.02 | 0.04 | 0.02 | 0.02 | |||
Personal Care domain doesn’t have box score of 0.5.
Detailed three by three classification tables (two by two for Personal Care domain) are presented in Table S7 in supporting information.
Abbreviations: AUC, area under the curve; CI, confidence interval; SD, standard deviation of estimates from the 10-fold cross-validation; VUS, volume under the surface.
4 |. DISCUSSION
Our IRT analysis results indicated that a majority of the items in the CDR discriminate well at mild and very mild levels of cognitive impairment, which is consistent with the reliability of the CDR. A small number of least-informative items (12 out of 65) could be excluded, which may reduce the burden on study participants and clinicians. The shortened version of the CDR (53 items) still demonstrated very high classification accuracy and reliability, and is well suited for the development of eCDR. Among all the IRT models we explored, the bi-factor model with correlated domain-specific factors fits best, which is consistent with the multifaceted structure of the CDR. We have demonstrated the model-derived IRT scores were highly accurate in estimating box score for each domain and CDR global. The automatic scoring algorithm we developed can be easily implemented in eCDR and can be shared upon request.
It is important to note that for items with open-ended responses, the responses coded based on clinicians’ judgment (eg, correct, incorrect) in the current MAP database were used for IRT analysis. However, without clinicians’ involvement in the eCDR, items with open-ended responses may need to be altered to have multiple-choice responses. This may change the construct of those questions and therefore affect how the instrument is scored. Adjustment to the item parameters in the bi-factor model and the cutoffs in the scoring algorithm based on the new data collected from the eCDR may be necessary. Future research will also need to examine the efficiency (cost-to-benefit ratio) and accuracy of the eCDR compared to the CDR, and the performance of the eCDR in handling complicated cases without clinicians’ judgment, such as the presence of discrepancies between study participants and study partners.
It is also worth mentioning that the model-derived IRT scores provide a continuous measure of dementia severity (as opposed to an ordinal ranking of CDR global and CDR-SB) that might be more useful in their own right than the IRT-based approximation of ordinal box scores and CDR global. Assigning domain box scores relies on clinician’s judgment while the IRT model provides a standard method for automatic scoring that requires no human judgment. The IRT scores can be used directly as a continuous outcome for clinical trials and observation studies to track participants’ cognitive performance cross-sectionally and longitudinally. The precision of these IRT scores in estimating cognitive change within individuals over time will be further evaluated in future research studies.
This study has a few limitations to note. First, the Home and Hobby domain only had one item with data available, and was excluded from this study. Therefore we are not certain whether including the Home and Hobby domain in the IRT model will further improve the accuracy of the estimation of dementia severity. Second, this study was designed to develop an automatic scoring algorithm for the eCDR, so the accuracy of the IRT scores was validated using the existing box scores (assigned by clinician) and CDR global. As both the IRT model and the existing box scores were both based on the same item-level data, this is somewhat different than the more typical validation for which the variables input as predictors would be excluded from consideration in assigning the outcome. Future studies will use other external cognitive outcomes that are independent of the CDR to further validate the accuracy of the IRT score in estimating dementia severity. Third, the IRT model was fitted using the data from the MAP participants, which is a cohort of mostly White and highly educated participants. Future research needs to evaluate the generalization ability of the results in this research using a more diverse population.
The shortened version of the CDR and the automatic scoring algorithm has laid the groundwork for developing and implementing the eCDR. As demonstrated in this research, IRT is a powerful statistical method in comprehensively evaluating an instrument both at item and scale/domain levels. Its utility can be greatly expanded to examine other cognitive tests and facilitate the development of new cognitive assessment, eg, selecting items that are more sensitive in detecting early changes in cognition from existing instruments to create a new instrument for prevention trials in AD.
Supplementary Material
RESEARCH IN CONTEXT.
1. Systematic review:
Literature was reviewed on the item response theory (IRT) analysis of the Clinical Dementia Rating (CDR) and other cognitive assessment commonly used in Alzheimer’s disease (AD). IRT analysis was not widely used in AD research despite its superiority compared to the classic test theory.
2. Interpretation:
IRT analysis demonstrated most CDR items discriminate well at mild and very mild levels of cognitive impairment. Twelve least informative items can be excluded from the CDR without compromising its reliability and clinical utility. The bi-factor IRT model and the automatic scoring algorithm we developed can accurately predict CDR global and domain box score. These will facilitate the development of an online, electronic CDR for more efficient clinical applications.
3. Future directions:
(1) Validate the bi-factor IRT model in different populations and (2) evaluate the precision of the model-derived IRT scores in tracking longitudinal cognitive change within individuals.
ACKNOWLEDGMENTS
We would like to express our gratitude to the research participants in the Memory & Aging Project and their supportive families. We thank the Clinical Core and Biostatistic Core at the Knight Alzheimer Disease Research Center for sample and data collection. This work was supported by the National Institutes of Health 1RF1AG059009-01. Data used in this research were from the Memory & Aging Project at Washington University funded by the National Institute on Aging (NIA) P50AG05681 and P01AG03991, and P01AG026276.
NIH funding 1RF1AG059009-01 (PI: Michael W. Weiner) provided financial support for the conduction of this research, but was not involved in the collection or analysis of the data. Data used in preparation of this article were obtained from the Memory and Aging Project (MAP) database at Washington University. As such, the investigators within the MAP provided data but did not participate in analysis of this project.
Footnotes
CONFLICTS OF INTEREST
Yan Li, Chengjie Xiong, Andrew J. Aschenbrenner, Chih-Hung Chang, Michael W. Weiner, Rachel L. Nosheny, Dan Munga, Krista L. Moulder, and John C. Morris have nothing to report. Randall J. Bateman serves as principal investigator of the DIAN-TU, which is supported by the Alzheimer’s Association, GHR Foundation, an anonymous organization and the DIAN-TU Pharma Consortium (Active: Eli Lilly and Company/Avid Radiopharmaceuticals, Hoffman-La Roche/Genentech, Biogen, Eisai, Janssen, and United Neuroscience). Randall J. Bateman receives lab research funding from the National Institutes of Health, Alzheimer’s Association, BrightFocus Foundation, Rainwater Foundation Tau Consortium, Association for Frontotemporal Degeneration, the Cure Alzheimer’s Fund, Centene Corporation, Tau SILK Consortium (AbbVie, Biogen, and Eli Lilly and Company), and an anonymous foundation. Randall J. Bateman has received honoraria as a speaker/consultant/advisory board member from Amgen, AC Immune, Eisai, Hoffman-LaRoche, Janssen, and Pfizer. Randall J. Bateman is a cofounder and serves on the scientific advisory board for C2N Diagnostics LLC. Randall J. Bateman has equity ownership interest in C2N Diagnostics and receives royalty income based on technology (stable isotope labeling kinetics and blood plasma assay) licensed by Washington University to C2N Diagnostics. Randall J. Bateman receives income from C2N Diagnostics for serving on the scientific advisory board. Jason Hassenstab serves as a consultant and advisory board member for Roche, Takeda, Biogen, and Lundbeck, and a DSMB member for Eisai.
SUPPORTING INFORMATION
Additional supporting information may be found online in the Supporting Information section at the end of the article.
REFERENCES
- 1.Morris JC. The Clinical Dementia Rating (CDR): current version and scoring rules. Neurology. 1993;43:2412–2414. [DOI] [PubMed] [Google Scholar]
- 2.Hughes CP, Berg L, Danziger WL, Coben LA, Martin RL. A new clinical scale for the staging of dementia. Br J Psychiatry. 1982;140:566–572. [DOI] [PubMed] [Google Scholar]
- 3.Berg L, Miller JP, Storandt M, et al. Mild senile dementia of the Alzheimer type: 2. Longitudinal assessment. Ann Neurol. 1988;23:477–484. [DOI] [PubMed] [Google Scholar]
- 4.Morris JC, McKeel DW Jr, Fulling K, Torack RM, Berg L. Validation of clinical diagnostic criteria for Alzheimer’s disease. Ann Neurol 1988;24:17–22. [DOI] [PubMed] [Google Scholar]
- 5.Fillenbaum GG, Peterson B, Morris JC. Estimating the validity of the clinical dementia rating scale: the CERAD experience. Aging Clin Exp Res. 1996;8:379–385. [DOI] [PubMed] [Google Scholar]
- 6.Burke WJ, Miller JP, Rubin EH, et al. Reliability of the Washington University Clinical Dementia Rating. Arch Neurol. 1988;45:31–32. [DOI] [PubMed] [Google Scholar]
- 7.McCulla MM, Coats M, Van Fleet N, Duchek J, Grant E, Morris JC. Reliability of clinical nurse specialists in the staging of dementia. Arch Neurol. 1989;46:1210–1211. [DOI] [PubMed] [Google Scholar]
- 8.Morris JC, Ernesto C, Schafer K, et al. Clinical dementia rating training and reliability in multicenter studies: the Alzheimer’s Disease Cooperative Study experience. Neurology. 1997;48:1508–1510. [DOI] [PubMed] [Google Scholar]
- 9.Rockwood K, Strang D, MacKnight C, Downer R, Morris JC. Interrater reliability of the clinical dementia rating in a multicenter trial. J Am Geriatr Soc. 2000;48:558–559. [DOI] [PubMed] [Google Scholar]
- 10.Morris JC, Storandt M, Miller JP, et al. Mild cognitive impairment represents early-stage Alzheimer’s disease. Arch Neurol. 2001;58:397–405. [DOI] [PubMed] [Google Scholar]
- 11.Storandt M, Grant EA, Miller JP, Morris JC. Longitudinal course and neuropathological outcomes in original versus revised MCI and in PreMCI. Neurology. 2006;67:467–473. [DOI] [PubMed] [Google Scholar]
- 12.Miller TM, Balsis S, Lowe DA, Benge JF, Doody RS. Item response theory reveals variability of functional impairment within clinical dementia rating scale stages. Dement Geriatr Cogn Disord. 2011;32:362–366. [DOI] [PubMed] [Google Scholar]
- 13.Lowe DA, Balsis S, Miller TM, Benge JF, Doody RS. Greater precision when measuring dementia severity: establishing item parameters for the clinical dementia rating scale. Dement Geriatr Cogn Disord. 2012;34:128–134. [DOI] [PMC free article] [PubMed] [Google Scholar]
- 14.Embretson SE, Reise SP. Item Response Theory. Hoboken, NJ: Taylor and Francis; 2013. [Google Scholar]
- 15.Balsis S, Unger AA, Benge JF, Geraci L, Doody RS. Gaining precision on the Alzheimer’s Disease Assessment Scale-cognitive: a comparison of item response theory-based scores and total scores. Alzheimers Dement. 2012;8:288–294. [DOI] [PubMed] [Google Scholar]
- 16.Lee YL, Lin KC, Chien TW. Application of a multidimensional computerized adaptive test for a Clinical Dementia Rating Scale through computer-aided techniques. Ann Gen Psychiatry. 2019;18:5. [DOI] [PMC free article] [PubMed] [Google Scholar]
- 17.Balsis S, Miller TM, Benge JF, Doody RS. Dementia staging across three different methods. Dement Geriatr Cogn Disord. 2011;31:328–333. [DOI] [PubMed] [Google Scholar]
- 18.Howell T, Nosheny RL, Mackin RS, et al. Progress & challenges in the development of electronic instruments to predict and monitor cognitive decline. J Prev Alzheimers Dis. 2019;6:S127. [Google Scholar]
- 19.Morris JC, Weintraub S, Chui HC, et al. The Uniform Data Set (UDS): clinical and cognitive variables and descriptive data from Alzheimer Disease Centers. Alzheimer Dis Assoc Disord. 2006;20:210–216. [DOI] [PubMed] [Google Scholar]
- 20.Birnbaum AL. Some latent trait models and their use in inferring an examinee’s ability. In: Lord FM and Novick MR, Eds., Statistical Theories of Mental Test Scores. Reading, MA: Addison-Wesley Pub. Co; 1968:397–479. [Google Scholar]
- 21.Samejima F Estimation of Latent Ability Using a Response Pattern of Graded Scores. Psychometrika monograph supplement. Richmond, VA: Byrd Press; 1969. [Google Scholar]
- 22.Cai L High-dimensional exploratory item factor analysis by a Metropolis-Hastings Robbins-Monro algorithm. Psychometrika. 2010;75:33–57. [Google Scholar]
- 23.Reckase MD. Multidimensional Item Response Theory Models. New York, NY: Springer; 2009:79–112. [Google Scholar]
- 24.Gibbons RD, Hedeker DR. Full-information item bi-factor analysis. Psychometrika. 1992;57:423–436. [Google Scholar]
- 25.Gibbons RD, Bock RD, Hedeker D, et al. Full-information item bifactor analysis of graded response data. Appl Psychol Meas. 2007;31:4–19. [Google Scholar]
- 26.Chen W-H, Thissen D. Local dependence indexes for item pairs using item response theory. J Educ Behav Stat. 1997;22:265–289. [Google Scholar]
- 27.Akaike H A new look at the statistical model identification. IEEE Trans Autom Control. 1974;19:716–723. [Google Scholar]
- 28.Schwarz G Estimating the dimension of a model. Ann Stat. 1978;6:461–464. [Google Scholar]
- 29.McDonald RP, Test Theory: A Unified Approach. Hoboken, NJ: Taylor & Francis; 1999. [Google Scholar]
- 30.Zinbarg RE, Yovel I, Revelle W, McDonald RP. Estimating generalizability to a latent variable common to all of a scale’s indicators: a comparison of estimators for ωh. Appl Psychol Meas. 2006;30:121–144. [Google Scholar]
- 31.Liu Y, Li Z, Liu H. Reporting valid and reliable overall scores and domain scores using bi-factor model. Appl Psychol Meas. 2019;43:562–576. [DOI] [PMC free article] [PubMed] [Google Scholar]
- 32.Ferri C, Hernández-Orallo J, Salido MA. Volume under the ROC Surface for Multi-class Problems. Proceedings of the Fourteenth European Conference on Machine Learning, Cavtat-Dubrovnik, Croatia, September 22–26, 2003. New York, NY: Springer; 2003:108–120. [Google Scholar]
- 33.Xiong C, van Belle G, Miller JP, Morris JC. Measuring and estimating diagnostic accuracy when there are three ordinal diagnostic groups. Stat Med. 2006;25:1251–1273. [DOI] [PubMed] [Google Scholar]
- 34.Luo J, Xiong C. Youden index and associated cut-points for three ordinal diagnostic groups. Commun Stat Simul Comput. 2013;42:1213–1234. [DOI] [PMC free article] [PubMed] [Google Scholar]
- 35.Luo J, Xiong C. DiagTest3Grp: an R Package for analyzing diagnostic tests with three ordinal groups. J Stat Softw. 2012;51:1–24. [DOI] [PMC free article] [PubMed] [Google Scholar]
- 36.Chalmers RP. mirt: a multidimensional item response theory package for the R environment. J Stat Softw. 2012;48:1–29. [Google Scholar]
- 37.Tucker LR, Lewis C. A reliability coefficient for maximum likelihood factor analysis. Psychometrika. 1973;38:1–10. [Google Scholar]
- 38.Bentler PM. Comparative fit indexes in structural models. Psychol Bull. 1990;107:238. [DOI] [PubMed] [Google Scholar]
- 39.Hu LT, Bentler PM. Cutoff criteria for fit indexes in covariance structure analysis: conventional criteria versus new alternatives. Struct Equ Modeling. 1999;6:1–55. [Google Scholar]
Associated Data
This section collects any data citations, data availability statements, or supplementary materials included in this article.