Abstract
Purpose
To perform a proof-of-concept study to investigate the clinical utility of perfusion maps derived from convolutional neural networks (CNNs) for the workup of patients with acute ischemic stroke presenting with a large vessel occlusion.
Materials and Methods
Data on endovascularly treated patients with acute ischemic stroke (n = 151; median age, 68 years [interquartile range, 59–75 years]; 82 of 151 [54.3%] women) were retrospectively extracted from a single-center institutional prospective registry (between January 2011 and December 2015). Dynamic susceptibility perfusion imaging data were processed by applying a commercially available reference method and in parallel by a recently proposed CNN method to automatically infer time to maximum of the tissue residue function (Tmax) perfusion maps. The outputs were compared by using quantitative markers of tissue at risk derived from manual segmentations of perfusion lesions from two expert raters.
Results
Strong correlations of lesion volumes (Tmax > 4 seconds, > 6 seconds, and > 8 seconds; R = 0.865–0.914; P < .001) and good spatial overlap of respective lesion segmentations (Dice coefficients, 0.70–0.85) between the CNN method and reference output were observed. Eligibility for late-window reperfusion treatment was feasible with use of the CNN method, with complete interrater agreement for the CNN method (Cohen κ = 1; P < .001), although slight discrepancies compared with the reference-based output were observed (Cohen κ = 0.609–0.64; P < .001). The CNN method tended to underestimate smaller lesion volumes, leading to a disagreement between the CNN and reference method in five of 45 patients (9%).
Conclusion
Compared with standard deconvolution-based processing of raw perfusion data, automatic CNN-derived Tmax perfusion maps can be applied to patients who have acute ischemic large vessel occlusion stroke, with similar clinical utility.
© RSNA, 2019
Summary
In patients with acute ischemic stroke, convolutional neural networks can produce brain perfusion maps with clinical utility similar to that of standard deconvolution-based estimates.
Key Points
■ The proposed method estimates time to maximum of the tissue residue function from raw dynamic susceptibility contrast material–enhanced MRI data by using deep learning.
■ In patients with acute ischemic stroke, the utility of the estimated perfusion maps was similar to that of a clinically used reference method.
■ The evaluated method is computationally fast and does not rely on an explicit definition of an arterial input function during testing.
Introduction
MRI perfusion is a valuable technique in the workup of patients suspected of having acute ischemic stroke (1). Data from MRI perfusion allow for the workup and correct diagnosis of transient ischemic attacks (2,3), help improve the prediction of infarct evolution (4–6), and, most important, facilitate selection of acute reperfusion therapies (7–10). With the exception of time-to-peak perfusion maps, MRI perfusion maps derived from dynamic susceptibility contrast material–enhanced (DSC) imaging require additional postprocessing steps, usually including deconvolution of the arterial input function (AIF) and tissue concentration–time curve by singular value decomposition (1,11). Although AIF can be detected automatically (12,13), manual correction may be needed in the case of suboptimal results. Manual adjustments to the AIF are time-consuming and not feasible for processing of large batches of imaging data.
Recently, deep learning methods, such as convolutional neural networks (CNNs), have been successfully tested for a variety of medical image analysis applications in neuroradiology (14,15). In particular, they have been successfully applied for prediction of ischemic stroke lesion outcome from acute MRI data (6,16,17). However, these methods rely on perfusion maps computed by parametric models as input data, making them dependent on the choice of algorithm, and, in turn, effectively hindering truthful end-to-end learning as well as hampering standardization of postprocessing routines. Recent deep learning methods showed promising results in prediction of perfusion maps from raw MRI data but lack thorough clinical evaluation (18–20). In particular, to our knowledge, the utility of perfusion maps derived from deep learning methods to quantify perfusion lesions and guide treatment eligibility has not been investigated so far.
Therefore, we hypothesized that deep learning methods may be transferred to the calculation of perfusion maps, including, in particular, time to maximum of the tissue residue function (Tmax). Taking existing commercial software–processed perfusion maps as ground truth, we trained a CNN for direct estimation of Tmax perfusion maps from raw DSC MRI data without additional user interaction or selection of AIFs. The purpose of this study was to investigate the clinical utility of CNN-derived Tmax perfusion maps in patients presenting with large vessel occlusion acute ischemic stroke.
Materials and Methods
Study Cohort
Data from patients treated between January 2011 and December 2015 were extracted from the prospective Bernese Stroke Registry. Details of the registry and further information on treatment modalities have been published in detail elsewhere (21).
Inclusion criteria for this study were (a) isolated occlusion of the intracranial internal carotid artery and first or second segment of the middle cerebral artery (M1 and M2, respectively), (b) treatment with mechanical thrombectomy or intra-arterial thrombolysis with or without intravenous tissue-type plasminogen activator, (c) MRI performed as the imaging modality at admission, and (d) follow-up MRI performed 8 days to 3 months after the index event. This led to the inclusion of 189 patients. After exclusion of patients with suboptimal AIF (38 patients), a total of 151 patients remained for the primary analysis (median age, 68 years; interquartile range [IQR], 59–75 years). The rationale behind this is to guarantee training and evaluation of the method with highest-quality data. Of these 151 patients, 82 were women (median age, 68 years; IQR, 61–75 years) and 69 were men (median age, 67 years; IQR, 56–75 years).
The cohort was randomly subdivided into a training, a validation, and a test cohort, consisting of 76, 30, and 45 patients, respectively. The following clinical data were extracted: age, sex, National Institutes of Health Stroke Scale (NIHSS) score at admission, time from symptom onset to admission, administration of intravenous tissue-type plasminogen activator, site of occlusion, 24-hour NIHSS score, 3-month modified Rankin Scale (mRS) score, vascular risk factors, and pathogenic stroke mechanism according to the Trial of Org 10172 in Acute Stroke Treatment trial criteria (22). The local ethics committee approved this retrospective study (Ethics Committee Bern, approval number: 231/14). Written informed consent was waived according to the retrospective nature of this analysis (general consent).
MRI Protocol
MRI examinations were performed with two 1.5-T scanners (Siemens Avanto, Siemens Aera; Siemens Healthineers, Zurich, Switzerland) and two 3-T scanners (Siemens Verio, Siemens Trio; Siemens Healthineers). DSC MR images were acquired in axial orientation with a T2*-weighted gradient echo-planar imaging sequence (single shot). The range of scan parameters included repetition time msec/echo time msec of 1400/1760, flip angle of 90°, imaging matrix of 128 × 128 or 256 × 256 with in-plane spacing of 0.898–1.875 mm, section thickness of 6–6.5 mm, and 70–80 measurements. The DSC protocol involved an intravenous injection of 7.5 mL of gadolinium-based contrast agent (Gadovist; Bayer Healthcare, Berlin, Germany) at a rate of 5 mL/sec, followed by 30 mL of NaCl at the same rate. Diffusion-weighted imaging examinations were performed in axial orientation with an echo-planar imaging sequence, including the following scan parameter ranges: repetition time msec/echo time msec of 3000–4100/64–89; flip angle of 90–180°; imaging matrix of 128 × 128, 176 × 176, or 192 × 192 with in-plane spacing of 1.198–1.797 mm; section thickness of 5–6.5 mm; and diffusion-encoding gradients at b values of 0, 500, and 1000 sec/mm2. The b value images were used in conjunction to obtain the apparent diffusion coefficient map.
Perfusion Analysis
The raw DSC MRI perfusion data were postprocessed by using Olea Sphere, version 2.3 (Olea Medical, La Ciotat, France). The Tmax perfusion maps were generated by using the oscillation index singular value decomposition (oSVD) method (23), with default settings as used in clinical routine. The AIF was automatically determined. The quality of the detected AIF was assessed visually, and patients were excluded if automatic AIF detection did not succeed (as stated in the preceding section on the study cohort). An example of a suboptimal AIF is shown in Figure E1 (supplement).
In addition, the same raw DSC MRI perfusion data were postprocessed by using a recently proposed deep learning method (19). This method relies on a CNN to infer Tmax perfusion maps from raw DSC MRI perfusion data in a fully automatic fashion. It does not rely on an explicit definition of an AIF during testing time or on a parametric model for brain perfusion. A key aspect of the method is a combination of temporal and spatial image information through the combined use of one-dimensional (temporal) and two-dimensional (spatial) convolutions. The computation time for a single patient is in the range of seconds. The CNN model was trained on the raw DSC MRI perfusion data and corresponding Tmax perfusion maps of 76 patients, where the latter (the Tmax perfusion maps) were estimated by using Olea Sphere. Model selection was performed by assessing the regression performance on the validation cohort of 30 patients. More details on the deep learning method, including a detailed description of the preprocessing, the network architecture, and an ablation study of key components, can be found in the respective publication (19) and in Appendix E1 (supplement).
Manual Annotation
After processing of the raw DSC MRI perfusion data, we obtained Tmax perfusion maps for the oSVD method and CNN method. The Tmax perfusion maps were rigidly coregistered with the B0 image of the diffusion-weighted imaging sequence by using the raw DSC MRI perfusion data. The perfusion lesion apparent on the Tmax image was manually segmented with the threshold-based brushing tool in Slicer 3D, version 4.8.0 (https://www.slicer.org/) (24). We used a Tmax threshold of greater than 4 seconds and used the co-registered B0 image to differentiate between brain parenchyma and ventricles. The segmentation was performed sectionwise in the axial direction. The Tmax images of the oSVD and CNN methods were presented to the human rater in a random order. For every patient in the test cohort (n = 45), the Tmax images generated by both methods were segmented consecutively to reduce intrarater variability. The Tmax images were annotated by a researcher with more than 6 years of experience in brain image analysis (R. Meier, rater 1) and a neuroradiologist with more than 3 years of experience in diagnosis of stroke (J.K., rater 2). We derived Tmax annotations of greater than 6 seconds and greater than 8 seconds by applying the respective thresholds to the segmented lesion of Tmax greater than 4 seconds. This results in three annotations (Tmax >4 seconds, >6 seconds, >8 seconds) for every patient and rater. An exemplary patient case with annotations by both raters is shown in Figure E2 (supplement).
To evaluate eligibility based on Endovascular Therapy Following Imaging Evaluation for Ischemic Stroke (DEFUSE 3) criteria (25), we relied on manual segmentations of the infarcted tissue (ischemic core) visible on the apparent diffusion coefficient image of the diffusion-weighted imaging sequence. The image obtained with a b value of 1000 sec/mm2 was used to rule out previous infarcts (b value of 1000 sec/mm2 hyperintensity with absent apparent diffusion coefficient hypointensity). The ischemic core was segmented by using the level tracing and brushing tool in Slicer 3D, version 4.8.0. The segmentation was performed sectionwise in the axial direction. The infarcted tissue was annotated by a third rater, who was a medical student previously trained in stroke image analysis (P.L.).
Statistical Analysis
The statistical analysis was conducted by using the R software package, version 3.1.2 (26). Assumption of normality was tested for the data with a Shapiro-Wilk test, and parametric or nonparametric tests were used accordingly. Tmax-based perfusion lesion quantifications were compared among the patients of the test cohort (n = 45). The spatial overlap between manual annotations was quantified by using the Dice coefficient. The agreement between the volume measurements derived from manual annotations on the different perfusion maps was assessed by using the Pearson correlation coefficient and Bland-Altman plots (27). Agreement on binary study eligibility (yes or no) for patients based on DEFUSE 3 criteria derived from the different perfusion maps was quantified by using the Cohen κ. The mean perfusion-diffusion mismatch ratio was computed on the basis of the volumes derived from the manual annotations and was plotted for different mRS scores (0 to 4 for n = 44 patients because mRS score was not reported for one patient). The significance level of the statistical analysis was set to α = .05.
Results
Patient Data
One hundred fifty-one patients (median age, 68 years [IQR, 59–75 years]; 82 of 151 [54.3%] woman), presenting with an acute occlusion of the intracranial internal carotid artery (n = 24), M1 (n = 99), or M2 (n = 28), were included. Patients presented with severe neurologic symptoms (median NIHSS score, 11; IQR, 7–17) and were admitted to the hospital after a median delay of 91 minutes (IQR, 65–185 minutes). Baseline characteristics, risk factor distributions, and etiologic mechanisms did not differ significantly between the training, validation, and test cohorts (Table 1).
Table 1:
Baseline Characteristics, Risk Factor Distributions, and Etiologic Mechanisms for Patient Data in Training, Validation, and Test Cohorts
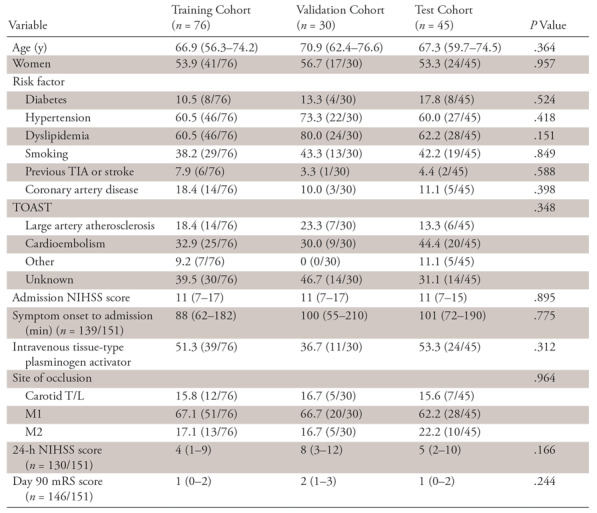
Note.—Data are percentages with numbers in parentheses for categorical variables and medians with interquartile ranges in parentheses for continuous or ordinally scaled variables. Statistical significance (with a significance level of α = .05) of differences among patient cohorts was estimated by using Fisher exact test (for categorical variables) or Kruskal-Wallis test (for ordinal or continuous variables). mRS = modified Rankin Scale, NIHSS = National Institutes of Health Stroke Scale, TIA = transient ischemic attack, T/L = T type and L type, TOAST = Trial of Org 10172 in Acute Stroke Treatment.
Prediction of Tmax Maps for Test Cohort
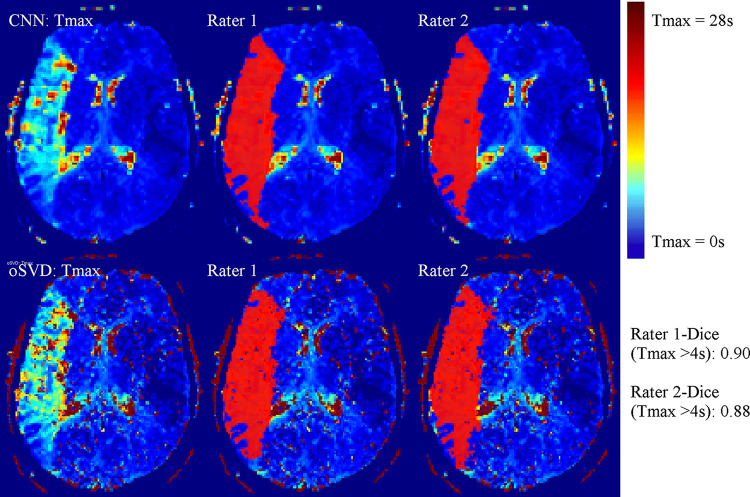
The total time to process the imaging data of the test cohort by using the CNN method was 9.87 minutes, which corresponds to a mean processing time per patient of 13.2 seconds. An exemplary Tmax perfusion map of the CNN method in comparison to the output of the oSVD method is shown in Figure 1 alongside manual annotations of the perfusion lesion. For all patients in the test cohort (45 of 45), there was agreement on the hemispheric localization (left or right) of the lesion apparent in the Tmax map estimated by use of the CNN or oSVD method.
Figure 1:
Axial section of time to maximum of tissue residue function (Tmax) perfusion maps for an exemplary patient case alongside the manual annotations (in red) of the Tmax greater than 4 seconds perfusion lesion for both raters. CNN = convolutional neural network, oSVD = oscillation index singular value decomposition.
Quantitative Comparison of Perfusion Lesions (Tmax)
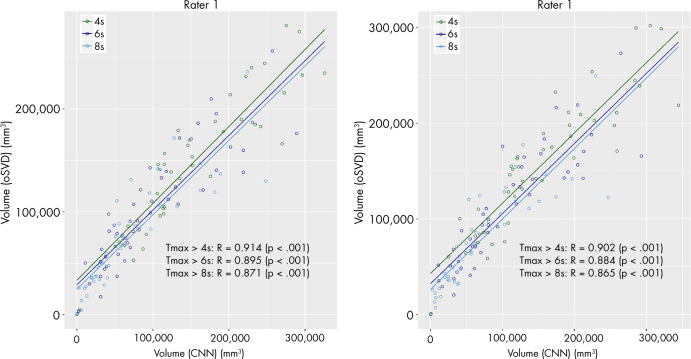
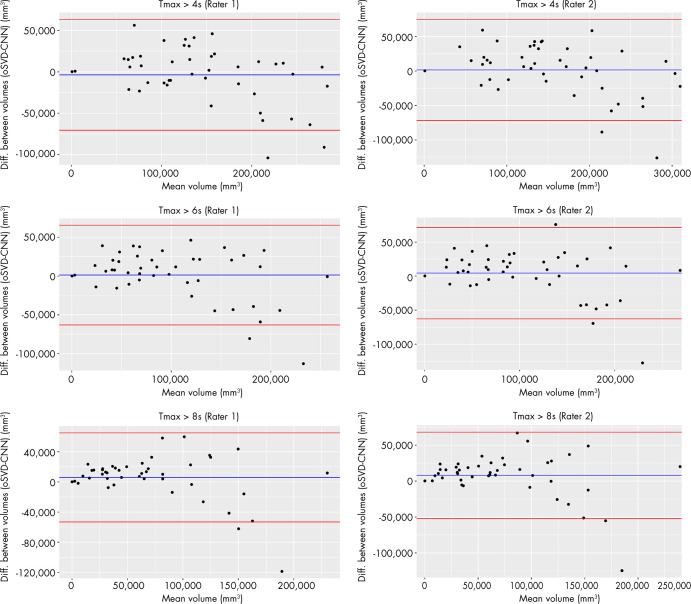
The median volumes and IQRs of the perfusion lesions for rater 1 and rater 2 are shown in Table 2. For both raters, the CNN provided a consistently lower median absolute volume than did oSVD. This tendency was found to be statistically significant (paired Wilcoxon signed-rank test: rater 1, P =.028; rater 2, P =.001). The spatial overlap in terms of Dice coefficient for both raters is reported in Table 3. The estimated volumes based on the CNN-derived perfusion maps were plotted against the estimations based on the oSVD method in Figure 2. Strong correlations were observed for all Tmax thresholds for rater 1 (Pearson R = 0.871–0.914; P <.0001) as well as for rater 2 (Pearson R = 0.865–0.902; P <.0001). The agreement between the estimated volumes of the CNN and oSVD methods was further analyzed by using Bland-Altman plots, as shown in Figure 3. The CNN tended to underestimate smaller lesions and overestimate larger lesions relative to analysis based on oSVD-derived maps. This behavior is consistent for different Tmax thresholds and raters.
Table 2:
Volume Estimates Derived from Tmax Perfusion Maps of CNN and oSVD Methods for Both Raters

Note.—Data are medians with interquartile ranges in parentheses of volume in milliliters. CNN = convolutional neural network, oSVD = oscillation index singular value decomposition.
Table 3:
Dice Coefficients for Increasing Thresholds of Tmax Values between Annotations Based on oSVD- and CNN-derived Tmax Perfusion Maps for Both Raters

Note.—Data are medians with interquartile ranges in parentheses. CNN = convolutional neural network, oSVD = oscillation index singular value decomposition, Tmax = time to maximum of the tissue residue function.
Figure 2:
Scatterplots of estimated volumes derived from time to maximum of tissue residue function (Tmax) maps of the convolutional neural network (CNN) and oscillation index singular value decomposition (oSVD) methods for both raters. Correlation is reported in terms of Pearson R. The different colors indicate different thresholds for Tmax values.
Figure 3:
Agreement between volume measurements derived from the time to maximum of tissue residue function (Tmax) perfusion maps of the convolutional neural network (CNN) and oscillation index singular value decomposition (oSVD) methods shown in Bland-Altman plots.
Comparison of Neuroimaging Inclusion Criteria
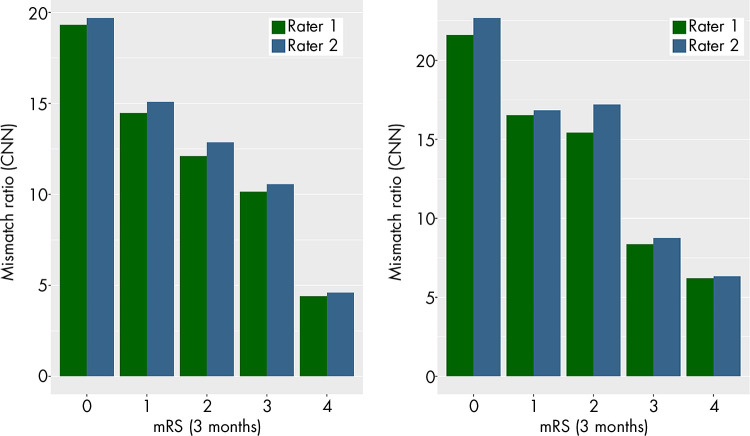
The perfusion-diffusion mismatch was quantified in terms of volumetric ratio and difference for all patients in the test cohort. The mean mismatch ratio was plotted against the mRS scores after 3 months for 44 of the 45 patients in the test cohort (for one patient, mRS score was not reported). For both raters, the mean mismatch ratio consistently decreases with an increasing mRS score (Fig 4). On the basis of these measurements, DEFUSE 3 criteria were applied to all patients for both methods. Using the measurements derived from the CNN perfusion maps, both raters rated 35 patients as eligible (interrater Cohen κ = 1; P <.001). Through use of the measurements derived from the oSVD perfusion maps, rater 1 rated 38 patients as eligible, whereas rater 2 rated 40 patients as eligible (interrater Cohen κ = 0.809; P <.001). For both raters, there was a disagreement for five patients in comparing the result between CNN and oSVD method (rater 1: Cohen κ = 0.64, P <.001; rater 2: Cohen κ = 0.609, P <.001). The summary statistics on DEFUSE 3 eligibility of patients in the test cohort are shown in Table 4, and complete data are presented in Table E1 (supplement).
Figure 4:
Mean values of perfusion-diffusion mismatch ratio for both raters plotted for increasing values of modified Rankin Scale (mRS) scores. CNN = convolutional neural network, oSVD = oscillation index singular value decomposition.
Table 4:
Summary Data for DEFUSE 3 Eligibility Criteria of Patients in Test Cohort of 45 Patients

Note.—Data are the number of patients for whom the combination of respective method (CNN or oSVD) and rater (rater 1 or rater 2) generated DEFUSE 3 eligibility or resulted in a disagreement among the methods (CNN vs oSVD). CNN = convolutional neural network, DEFUSE 3 = Endovascular Therapy Following Imaging Evaluation for Ischemic Stroke; oSVD = oscillation index singular value decomposition.
Generalizability to Excluded Cases
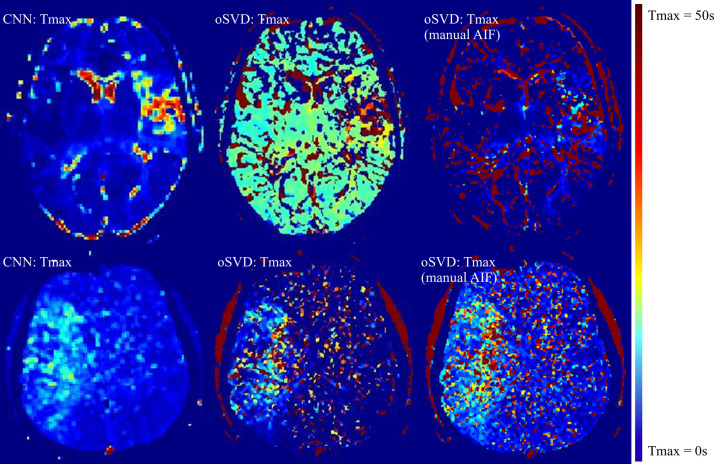
For exploratory reasons, we applied the CNN method to patients previously excluded because of failed AIF detection. The Tmax perfusion maps of two exemplary patient cases are shown in Figure 5. Results for three additional patients with failed AIF detection are shown in Figure E3 (supplement). The Tmax maps of the CNN present a perfusion lesion, which from a qualitative viewpoint is easier to distinguish from surrounding brain parenchyma than the lesions apparent in the maps of the oSVD method. Additionally, we performed a manual AIF selection in the proximal segment of the contralateral medial carotid artery and subsequently applied the oSVD method for further comparison.
Figure 5:
Axial sections of time to maximum of tissue residue function (Tmax) perfusion maps show two exemplary patient cases with failed arterial input function (AIF) detection of the oscillation index singular value decomposition (oSVD) method (middle column). Tmax maps of the oSVD method with manual AIF selection are shown in the right column. CNN = convolutional neural network.
Discussion
The present study revealed good radiologic agreement and clinical utility of Tmax perfusion maps derived from a trained CNN when compared with a Food and Drug Administration–cleared oSVD method. The CNN method was evaluated in terms of spatial overlap of perfusion lesions and volumetric agreement, the ability to guide patients’ eligibility for acute reperfusion treatment, and agreement with patient outcomes. Validation was performed on test cases not seen by the trained CNN before, accounting for potential overfitting.
Quantitative evaluation yielded a strong agreement across different threshold-based segmentations of Tmax perfusion maps, although an overestimation of larger volumes and underestimation of smaller volumes by the CNN method were observed (proportional error). Furthermore, we found complete interrater agreement on eligibility for late-window mechanical thrombectomy according to the DEFUSE 3 trial criteria when these ratings were based on CNN-derived Tmax maps. Although consistent, the number of patients rated eligible for acute reperfusion treatment was slightly lower (35 patients for both raters) than the number determined by assessment derived from the oSVD model (38 of 40 patients), potentially reflecting the slight underestimation in lower tissue-at-risk volumes. In particular, the patients not rated eligible on the basis of CNN-derived Tmax maps but eligible on the basis of the oSVD maps exhibited lesion volumes well below 100 mL. The mean mismatch ratios estimated from oSVD-derived perfusion maps and CNN-derived perfusion maps revealed a stringent agreement to patients’ functional outcome, reflecting the close association of expected benefit from reperfusion therapies and the proportion of salvageable tissue on admission (28).
Using a digital phantom, Kudo et al (29) found that numerous postprocessing software tools for perfusion-weighted images showed good correlations for calculated perfusion parameter values compared with the true values, although absolute values did differ significantly across different postprocessing tools and some delay-sensitive errors were observed. In their study, absolute values were most similar for estimation of Tmax in different software packages, further promoting its value in multicenter clinical trials which use different software tools. These findings are supported by the study of Zaro-Weber et al (30), who found that, on the basis of data from patients with acute and subacute stroke Tmax appears to be the most stable parameter when different deconvolution techniques are used. Therefore, most clinical trials evaluating treatment effect in subcohorts of patients with defined pattern of penumbra have based their definition of penumbral tissue on Tmax DSC perfusion maps (7,10,31). Consequently, we focused on the feasibility of predicting Tmax perfusion maps from raw DSC MRI data using deep learning.
Current machine learning methods for stroke lesion outcome prediction rely on parametric maps derived from the DSC MRI data generated by commercially available postprocessing tools. The accurate generation of these maps depends on the successful detection (manual or automatic) of an AIF. Furthermore, these postprocessing tools are decoupled from any subsequent machine learning method and vary strongly across different hospitals. This leads to three severe issues: difficult standardization of perfusion processing (which hampers interpretation of results from clinical trials), lack of robustness due to dependency on AIF detection (which reduces diagnostic yield), and less streamlined workflow (which results in loss of valuable time).
The deep learning method evaluated in this study attempts to tackle these issues. Clinical validation of a postprocessing software will most certainly depend on which perfusion processing software packages were used most often in clinical trials implementing perfusion-based patient selection or stratification. In that sense, the present proof-of-concept of a CNN has an advantage because a CNN will be agnostic to the type of output needed for training and can thus be easily adapted to software outputs, which are considered most clinically validated at a given time point. In addition, the proposed method removes the necessity of AIF detection after deployment, yields results within fast computation times (competitive with or faster than those reported elsewhere [32–34]), and might be used to automatically process large batches of perfusion data. Finally, it can potentially be extended for joint regression of perfusion maps and learning of stroke lesion prediction, thus opening the possibility of truthful end-to-end learning in lesion outcome prediction for patients with acute ischemic stroke.
The presented results on the utility of CNN-derived perfusion maps for assessing perfusion lesions in patients with acute ischemic stroke are limited to the setting of a single center and a single ground-truth perfusion postprocessing software. Future studies should determine how our method performs in a multicenter setting and in situations where alternative ground-truth perfusion maps are available. A main limitation of the current CNN-derived Tmax maps is the underestimation of smaller perfusion lesion volumes, which led to fewer patients deemed eligible on the basis of DEFUSE 3 trial criteria when compared with the assessment based on oSVD-derived maps. We plan to address this issue in the future by (a) increasing the number of samples in the training data (especially for patients with smaller perfusion lesions) and (b) extending the neural network to perform multitask learning of perfusion map regression and stroke lesion outcome prediction.
Compared with standard deconvolution (oSVD) of raw perfusion data, CNN-derived perfusion maps can be applied to patients with acute ischemic large vessel occlusion stroke with similar clinical utility. The evaluated algorithm provides the clinician with quickly available perfusion maps to estimate the tissue at risk and potentially guide eligibility for reperfusion regimens. Further validation of this method must include hypoperfusion patterns that are more complex (eg, multivessel occlusion, lacunar perfusion deficits and posterior circulation strokes) and an evaluation of the discriminative power of the derived maps with regard to stroke mimics, such as epilepsy and migraine.
APPENDIX
SUPPLEMENTAL FIGURES
Supported by the Swiss Heart Foundation, the SAMW/Bangerter Foundation, the Swiss Stroke Society, and Swiss National Science Foundation (grant no. 320030L_170060 [STRAY-CATS]).
Disclosures of Conflicts of Interest: R. Meier Activities related to the present article: institution received grant from Swiss National Science Foundation (grant no. 320030L_170060 (STRAY-CATS). Activities not related to the present article: disclosed no relevant relationships. Other relationships: disclosed no relevant relationships. P.L. disclosed no relevant relationships. S.J. disclosed no relevant relationships. U.F. Activities related to the present article: disclosed no relevant relationships. Activities not related to the present article: institution consults for Medtronic, Stryker, CSL Behring; institution receives grants from Medtronic (SWIFT DIRECT and BEYOND SWIFT study). Other relationships: disclosed no relevant relationships. J.G. Activities related to the present article: institution received grant from Swiss National Fund (scientific grant, MRI in stroke). Activities not related to the present article: institution consults for Medtronic (Global PI Swift Direct, stroke study). Other relationships: disclosed no relevant relationships. M.R. disclosed no relevant relationships. R.W. Activities related to the present article: disclosed no relevant relationships. Activities not related to the present article: institution receives grants from Swiss National Foundation (Swiss First SNF 180365, STRAY CATS SNF 170060, Swiss Heart Foundation). Other relationships: disclosed no relevant relationships. R. McKinley Activities related to the present article: institution received grant from Swiss National Science Foundation (grant no. 170060). Activities not related to the present article: disclosed no relevant relationships. Other relationships: disclosed no relevant relationships. J.K. Activities related to the present article: institution received grant from SAMW/Bangerter Foundation. Activities not related to the present article: institution receives grant from Swiss Stroke Society; institution receives travel accommodations from Pfizer (ESOC 2018 conference support). Other relationships: disclosed no relevant relationships.
Abbreviations:
- AIF
- arterial input function
- CNN
- convolutional neural network
- DEFUSE 3
- Endovascular Therapy Following Imaging Evaluation for Ischemic Stroke
- DSC
- dynamic susceptibility contrast material enhanced
- IQR
- interquartile range
- mRS
- modified Rankin Scale
- NIHSS
- National Institutes of Health Stroke Scale
- oSVD
- oscillation index singular value decomposition
- Tmax
- time to maximum of tissue residue function
References
- 1.Copen WA, Schaefer PW, Wu O. MR perfusion imaging in acute ischemic stroke. Neuroimaging Clin N Am 2011;21(2):259–283. [DOI] [PMC free article] [PubMed] [Google Scholar]
- 2.Restrepo L, Jacobs MA, Barker PB, Wityk RJ. Assessment of transient ischemic attack with diffusion- and perfusion-weighted imaging. AJNR Am J Neuroradiol 2004;25(10):1645–1652. [PMC free article] [PubMed] [Google Scholar]
- 3.Mlynash M, Olivot JM, Tong DC, et al. Yield of combined perfusion and diffusion MR imaging in hemispheric TIA. Neurology 2009;72(13):1127–1133. [DOI] [PMC free article] [PubMed] [Google Scholar]
- 4.McKinley R, Häni L, Gralla J, et al. Fully automated stroke tissue estimation using random forest classifiers (FASTER). J Cereb Blood Flow Metab 2017;37(8):2728–2741. [DOI] [PMC free article] [PubMed] [Google Scholar]
- 5.Livne M, Boldsen JK, Mikkelsen IK, Fiebach JB, Sobesky J, Mouridsen K. Boosted tree model reforms multimodal magnetic resonance imaging infarct prediction in acute stroke. Stroke 2018;49(4):912–918. [DOI] [PubMed] [Google Scholar]
- 6.Nielsen A, Hansen MB, Tietze A, Mouridsen K. Prediction of tissue outcome and assessment of treatment effect in acute ischemic stroke using deep learning. Stroke 2018;49(6):1394–1401. [DOI] [PubMed] [Google Scholar]
- 7.Albers GW, Marks MP, Kemp S, et al. Thrombectomy for stroke at 6 to 16 hours with selection by perfusion imaging. N Engl J Med 2018;378(8):708–718. [DOI] [PMC free article] [PubMed] [Google Scholar]
- 8.Campbell BCV, Parsons MW. Imaging selection for acute stroke intervention. Int J Stroke 2018;13(6):554–567. [DOI] [PubMed] [Google Scholar]
- 9.Ribo M, Molina CA, Rovira A, et al. Safety and efficacy of intravenous tissue plasminogen activator stroke treatment in the 3- to 6-hour window using multimodal transcranial Doppler/MRI selection protocol. Stroke 2005;36(3):602–606. [DOI] [PubMed] [Google Scholar]
- 10.Davis SM, Donnan GA, Parsons MW, et al. Effects of alteplase beyond 3 h after stroke in the Echoplanar Imaging Thrombolytic Evaluation Trial (EPITHET): a placebo-controlled randomised trial. Lancet Neurol 2008;7(4):299–309. [DOI] [PubMed] [Google Scholar]
- 11.Welker K, Boxerman J, Kalnin A, et al. ASFNR recommendations for clinical performance of MR dynamic susceptibility contrast perfusion imaging of the brain. AJNR Am J Neuroradiol 2015;36(6):E41–E51. [DOI] [PMC free article] [PubMed] [Google Scholar]
- 12.Mouridsen K, Christensen S, Gyldensted L, Østergaard L. Automatic selection of arterial input function using cluster analysis. Magn Reson Med 2006;55(3):524–531. [DOI] [PubMed] [Google Scholar]
- 13.Carroll TJ, Rowley HA, Haughton VM. Automatic calculation of the arterial input function for cerebral perfusion imaging with MR imaging. Radiology 2003;227(2):593–600. [DOI] [PubMed] [Google Scholar]
- 14.Zaharchuk G, Gong E, Wintermark M, Rubin D, Langlotz CP. Deep learning in neuroradiology. AJNR Am J Neuroradiol 2018;39(10):1776–1784. [DOI] [PMC free article] [PubMed] [Google Scholar]
- 15.Plis SM, Hjelm DR, Salakhutdinov R, et al. Deep learning for neuroimaging: a validation study. Front Neurosci 2014;8:229. [DOI] [PMC free article] [PubMed] [Google Scholar]
- 16.Maier O, Menze BH, von der Gablentz J, et al. ISLES 2015 - A public evaluation benchmark for ischemic stroke lesion segmentation from multispectral MRI. Med Image Anal 2017;35:250–269. [DOI] [PMC free article] [PubMed] [Google Scholar]
- 17.Pinto A, Pereira S, Meier R, et al. Enhancing clinical MRI perfusion maps with data-driven maps of complementary nature for lesion outcome prediction. ArXiv 1806.04413 [preprint] http://arxiv.org/abs/1806.04413. Posted June 12, 2018. Accessed February 1, 2019.
- 18.Ho KC, Scalzo F, Sarma KV, El-Saden S, Arnold CW. A temporal deep learning approach for MR perfusion parameter estimation in stroke. In: 2016 23rd International Conference on Pattern Recognition (ICPR). IEEE, 2016; 1315–1320 http://ieeexplore.ieee.org/document/7899819/. [Google Scholar]
- 19.Hess A, Meier R, Kaesmacher J, et al. (2019). Synthetic Perfusion Maps: Imaging Perfusion Deficits in DSC-MRI with Deep Learning. In: Crimi A., Bakas S., Kuijf H., Keyvan F., Reyes M., van Walsum T. (eds) Brainlesion: Glioma, Multiple Sclerosis, Stroke and Traumatic Brain Injuries. BrainLes 2018. Lecture Notes in Computer Science, vol 11383. Springer, Cham. [Google Scholar]
- 20.Ulas C, Tetteh G, Thrippleton MJ, et al. Direct estimation of pharmacokinetic parameters from DCE-MRI using deep CNN with forward physical model loss. Proceedings of the International Conference On Medical Image Computing & Computer Assisted Intervention 2018. ArXiv 1804.02745 [preprint] http://arxiv.org/abs/1804.02745. Posted April 8, 2018. Accessed February 1, 2019.
- 21.Broeg-Morvay A, Mordasini P, Slezak A, et al. Does antiplatelet therapy during bridging thrombolysis increase rates of intracerebral hemorrhage in stroke patients? PLoS One 2017;12(1):e0170045. [DOI] [PMC free article] [PubMed] [Google Scholar]
- 22.Adams HP Jr, Bendixen BH, Kappelle LJ, et al. Classification of subtype of acute ischemic stroke. Definitions for use in a multicenter clinical trial. TOAST. Trial of Org 10172 in Acute Stroke Treatment. Stroke 1993;24(1):35–41. [DOI] [PubMed] [Google Scholar]
- 23.Wu O, Østergaard L, Weisskoff RM, Benner T, Rosen BR, Sorensen AG. Tracer arrival timing-insensitive technique for estimating flow in MR perfusion-weighted imaging using singular value decomposition with a block-circulant deconvolution matrix. Magn Reson Med 2003;50(1):164–174. [DOI] [PubMed] [Google Scholar]
- 24.Fedorov A, Beichel R, Kalpathy-Cramer J, et al. 3D Slicer as an image computing platform for the quantitative imaging network. Magn Reson Imaging 2012;30(9):1323–1341. [DOI] [PMC free article] [PubMed] [Google Scholar]
- 25.Albers GW, Lansberg MG, Kemp S, et al. A multicenter randomized controlled trial of endovascular therapy following imaging evaluation for ischemic stroke (DEFUSE 3). Int J Stroke 2017;12(8):896–905. [DOI] [PMC free article] [PubMed] [Google Scholar]
- 26.R Core Team . R: A Language and Environment for Statistical Computing. Vienna, Austria: R Foundation for Statistical Computing, 2013. http://www.r-project.org/. [Google Scholar]
- 27.Altman DG, Bland JM. Measurement in medicine: the analysis of method comparison studies. J R Stat Soc Ser D (Stat) 1983;32(3):307–317. [Google Scholar]
- 28.Albers GW, Goyal M, Jahan R, et al. Relationships between imaging assessments and outcomes in solitaire with the intention for thrombectomy as primary endovascular treatment for acute ischemic stroke. Stroke 2015;46(10):2786–2794. [DOI] [PubMed] [Google Scholar]
- 29.Kudo K, Christensen S, Sasaki M, et al. Accuracy and reliability assessment of CT and MR perfusion analysis software. Radiology 2013;267(1):201–211. [DOI] [PMC free article] [PubMed] [Google Scholar]
- 30.Zaro-Weber O, Livne M, Martin SZ, et al. Comparison of the 2 most popular deconvolution techniques for the detection of penumbral flow in acute stroke. Stroke 2015;46(10):2795–2799. [DOI] [PubMed] [Google Scholar]
- 31.Amiri H, Bluhmki E, Bendszus M, et al. European Cooperative Acute Stroke Study-4: Extending the time for thrombolysis in emergency neurological deficits ECASS-4: ExTEND. Int J Stroke 2016;11(2):260–267. [DOI] [PubMed] [Google Scholar]
- 32.Schaafs LA, Porter D, Audebert HJ, Fiebach JB, Villringer K. Optimising MR perfusion imaging: comparison of different software-based approaches in acute ischaemic stroke. Eur Radiol 2016;26(11):4204–4212. [DOI] [PubMed] [Google Scholar]
- 33.Kim J, Leira EC, Callison RC, et al. Toward fully automated processing of dynamic susceptibility contrast perfusion MRI for acute ischemic cerebral stroke. Comput Methods Programs Biomed 2010;98(2):204–213. [DOI] [PubMed] [Google Scholar]
- 34.Kosior JC, Frayne R. PerfTool: a software platform for investigating bolus-tracking perfusion imaging quantification strategies. J Magn Reson Imaging 2007;25(3):653–659. [DOI] [PubMed] [Google Scholar]
- 35.Kendall A, Gal Y. What uncertainties do we need in Bayesian deep learning for computer vision? In: Proceedings of Advances in Neural Information Processing Systems 30 (NIPS), 2017. [Google Scholar]
- 36.Kingma DP, Ba J. Adam. A method for stochastic optimization. In: Proceedings of the 3rd International Conference on Learning Representations (ICLR), 2014. [Google Scholar]
- 37.Grant H, Kruger U, Pingkun Y. Deep learning in medical image registration: a survey. ArXiv 1903.02026 [preprint] http://arxiv.org/abs/1903.02026. Posted March 5, 2019. Accessed February 11, 2019. [Google Scholar]
Associated Data
This section collects any data citations, data availability statements, or supplementary materials included in this article.


