Significance
The importance of molecular understanding of the structure, dynamics. and properties of liquid water is recognized in many scientific disciplines. Here, we study experimentally the structure and thermodynamics of bulk liquid water as it is supercooled by evaporation down to ∼228 K. The unique aspect of this work is the use of ultrafast calorimetry that enables us to determine the specific-heat capacity of water to unprecedentedly low temperatures. The observed maximum of about 218 J/mol/K at 229 K is consistent with the liquid–liquid critical point model and supports a proposed fragile-to-strong transition at ∼220 K to explain the steep decrease in the estimated self-diffusion coefficient below 235 K.
Keywords: supercooled water, specific-heat capacity, fragile-to-strong transition, liquid–liquid critical point
Abstract
Knowledge of the temperature dependence of the isobaric specific heat (Cp) upon deep supercooling can give insights regarding the anomalous properties of water. If a maximum in Cp exists at a specific temperature, as in the isothermal compressibility, it would further validate the liquid–liquid critical point model that can explain the anomalous increase in thermodynamic response functions. The challenge is that the relevant temperature range falls in the region where ice crystallization becomes rapid, which has previously excluded experiments. Here, we have utilized a methodology of ultrafast calorimetry by determining the temperature jump from femtosecond X-ray pulses after heating with an infrared laser pulse and with a sufficiently long time delay between the pulses to allow measurements at constant pressure. Evaporative cooling of ∼15-µm diameter droplets in vacuum enabled us to reach a temperature down to ∼228 K with a small fraction of the droplets remaining unfrozen. We observed a sharp increase in Cp, from 88 J/mol/K at 244 K to about 218 J/mol/K at 229 K where a maximum is seen. The Cp maximum is at a similar temperature as the maxima of the isothermal compressibility and correlation length. From the Cp measurement, we estimated the excess entropy and self-diffusion coefficient of water and these properties decrease rapidly below 235 K.
Water is one of the most exceptional liquids due to its importance, abundance, and many properties that are anomalous with respect to a normal liquid (1–3). This anomalous behavior is already evident at ambient conditions and is enhanced when water is supercooled below the freezing point into the metastable regime (2, 4, 5). In particular, the observation that the isothermal compressibility (κT), heat capacity (Cp), thermal expansion coefficient (αP), and correlation length (ξ) appear to diverge toward a singular temperature (Ts) of about 228 K at 1 bar, as estimated by power-law fits (6, 7), has led to several hypotheses about the origin of water’s anomalous properties (2, 3, 8). One of the hypotheses proposes the existence of a liquid–liquid transition in supercooled water between high-density (HDL) and low-density (LDL) liquids, separated by a phase-coexistence line (8, 9) and terminating at a liquid–liquid critical point (LLCP) at positive pressure (8). Beyond the LLCP, at lower pressures, water is characterized by fluctuations between local structures of HDL and LDL (10). The locus of maxima in of these fluctuations defines the Widom line in the pressure–temperature phase diagram, which emanates from the LLCP as an extension of the phase-coexistence line (11). Near the Widom line, the other thermodynamic response functions could also have maxima defining κT and Cp Widom lines, merging with the Widom line in close proximity to the critical point. Such a merging was observed for the maxima in κT and Cp, and for the minimum in αP at the liquid–gas critical point (LGCP), based on molecular-dynamic (MD) simulations (12).
It has been challenging to experimentally determine the existence of a Widom line in supercooled water due to the extremely fast ice-forming crystallization at temperatures below 235 K. Nevertheless, rapid evaporative cooling of micrometer-sized droplets followed by ultrafast interrogation with an X-ray laser have allowed us to probe water at temperatures down to 227 K (13, 14). Recently, using this approach, maxima in and κT were observed at 229 K, coinciding with the temperature of the most rapid change of the local tetrahedral structure in the liquid (13). Other experiments using sound velocity in stretched liquid water (15) also predict a maxima in κT and Cp. Based on a combination of MD simulations and temperature-dependent structure factor measurements, a consistency was derived with which αP may also exhibit a minimum at 229 K (16). If all thermodynamic response functions showed evidence of a Widom line with maxima or minima, this would validate the LLCP scenario, more so if they were in close proximity in temperature. Currently, no measurements exist below 236 K (17) for Cp and it is necessary to develop experimental techniques to study water upon deep supercooling where rapid ice crystallization occurs. Measurements of the value of the Cp maximum also allow us to derive to which extent the excess entropy has decreased upon supercooling and compare this to the entropy of low-density amorphous ice (LDA) at the glass transition temperature (18–20). Interest in excess entropy was one of the original motivations in 1969 behind the study of supercooled water (18). Based on the expectation that Cp should decrease upon cooling, the excess entropy was expected to rapidly decrease, as Cp approaches that of LDA. Surprisingly, though, an accelerated increase was observed instead (21–23).
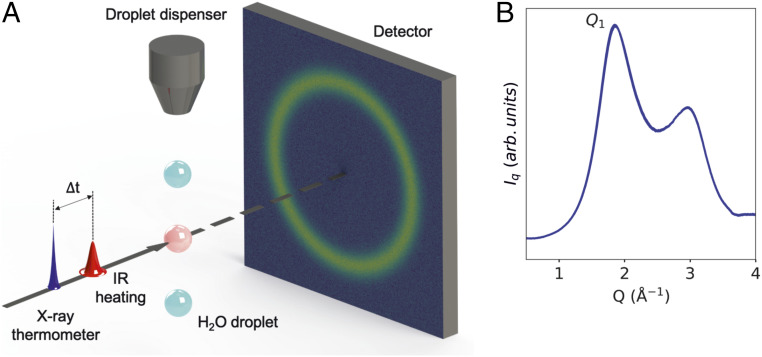
Here, we show that the Cp can be measured down to 228 K using a method based on ultrafast calorimetry. The data are consistent with the existence of a maximum of Cp at 229 K, as well as a rapid decrease of the excess entropy at temperatures beyond the Widom line. Fig. 1 shows the experimental setup of our ultrafast calorimetry approach. The droplets are cooled by evaporation and the temperature is calculated using Knudsen’s theory of evaporation and Fourier’s law of heat conduction (24, 25). This approach to determining droplet temperatures has been proven to be successful in various experimental setups (13, 14, 26) and has been validated using ME simulations (25). A 2.05-μm infrared (IR) pulse heats the sample, increasing the temperature of the droplets by 0.5–1 K. The droplets are then probed by a femtosecond X-ray pulse after a 1-µs delay time, allowing the liquid to expand. The difference in the X-ray scattering patterns between IR laser on and off is used as a thermometer. The pattern from each X-ray shot is also used to detect whether Bragg peaks appear from small ice crystals so that crystallized droplets can be excluded from the analysis. Using a calibration curve of the scattering signal versus temperature, we estimate the increase of temperature from the heating pulse and derive the heat capacity at constant pressure, Cp. We observe a rapid increase in Cp at temperatures below 235 K with a maximum appearing at 229 K, followed by a suggested decrease toward lower temperatures. The rise and maximum of Cp is consistent with the existence of a Widom line for Cp as previously observed for κT and (13).
Fig. 1.
(A) Schematic of the experimental setup (Left) and (B) angularly integrated scattering intensity (Right). The time delay (∆t) between the IR laser and the X-rays is 1 µs. IR laser is ON for every alternate X-ray pulse. The difference in the scattering profile of the laser ON and laser OFF shots is ∼2% of the signal.
Results
The key aim of the current study is to determine the changes in X-ray scattering due to IR-induced heating and measure how the magnitude of this change depends on the initial water temperature. We use two strategies to determine the temperature jump due to laser heating.
Temperature Jump Using Q1 Peak Shift.
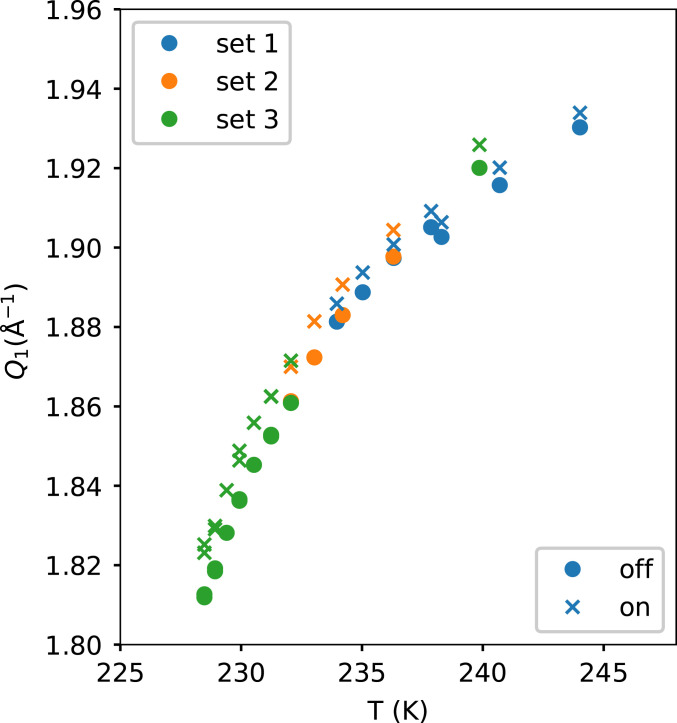
The first method consists of measuring the momentum transfer (Q) position of the first scattering peak of liquid water in the scattering intensity I(Q) situated at ∼2 Å−1 (Q1), as shown in Fig. 1. The Q1 position as function of temperature and the change due to the heat pulse is illustrated in Fig. 2. We use the following expression for determining the temperature jump:
| [1] |
The derivative (dQ1/dT)OFF is calculated using a central difference method where the closest higher and lower temperatures are used (SI Appendix, Eq. S1). The derivative (dQ1/dT)OFF increases on supercooling until a maximum is reached at 229.4 K. ∆Q1 increases slower than (dQ1/dT)OFF upon supercooling, which results in ∆TQ1 to decrease upon supercooling.
Fig. 2.
The first peak position (Q1) in liquid water’s X-ray scattering pattern I(Q) for the heated (IR laser ON, crosses) and unheated (IR laser OFF, filled circles) measurements. The three sets represent three different conditions of spatial overlap between X-ray and IR laser.
Temperature Jump Using the Area under the Heating Signal.
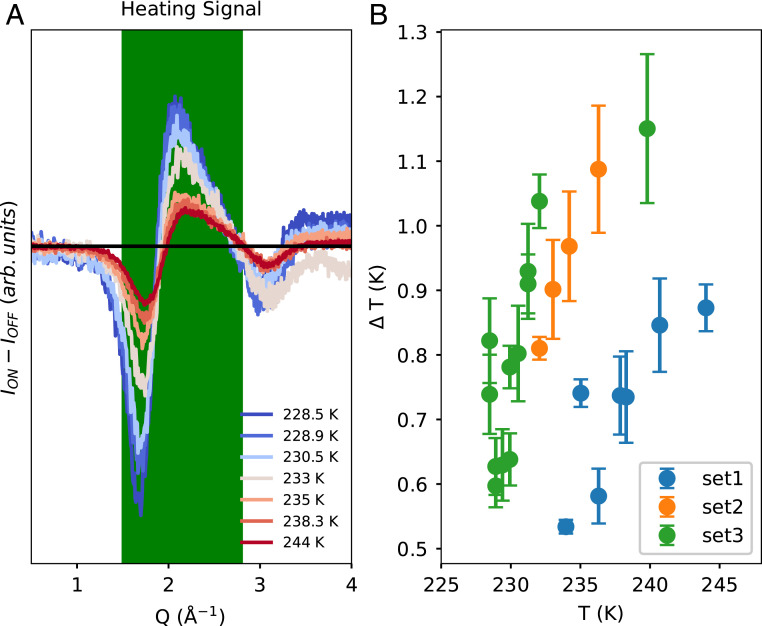
The second method employed to determine the temperature change is based on the area under the absolute value of the heating signal ∣ION–IOFF∣ as shown in Fig. 3A. The X-ray scattering intensity profile is averaged separately for the laser OFF and laser ON shots. The scattering intensity for the two profiles may differ due to sensitivity of the signal on the scattering volume, which may not be constant for each shot depending on whether the X-rays hit the droplet on-center or off-center. Thus, the scattering intensity is normalized so that the profiles have the same area under the region of Q = 1.5–3.5 Å−1. After this normalization, a difference profile of scattering intensity [∆I(Q)] of ON–OFF shots is plotted. This difference, ∆I(Q), is then compared with dI(Q)/dT based on the laser OFF shots (dI(Q)/dT)OFF). The shapes of ∆I(Q) and (dI(Q)/dT)OFF are similar. (dI(Q)/dT)OFF is calculated in between two consecutive temperatures, except for the coldest temperature of 228.5 K where it is extrapolated (see SI Appendix, Fig. S2 for details), according to the following equation:
| [2] |
The area under the absolute value of the heating signal and ∣(dI(Q)/dT)OFF∣ is calculated in the region Q =1.5–2.8 Å−1 (shaded region in Fig. 3A) to get ∆Tarea according to Eq. 3. This Q range is chosen after a singular value decomposition analysis (SI Appendix, section 2), which suggests that more than 65% of the signal variance in this Q range is due to heating and the remaining 35% can be attributed to noise.
| [3] |
Fig. 3.
(A) Heating signal (ION–IOFF) at selected temperatures. (B) The temperature rise (∆T) as a function of temperature for the three different datasets. The two values of ∆TQ1 and ∆Tarea give similar results and are shown in SI Appendix, Fig. S3. The average of ∆TQ1 and ∆Tarea is used to calculate the average value of ∆T and is shown in Fig. 3B. The three datasets represent different run conditions of spatial overlap between X-ray and IR laser and as a result, ∆T is not consistent between the different runs but consistent within each run series. The error bars are SEMs calculated according to SI Appendix, section 7.
Spatial Overlap.
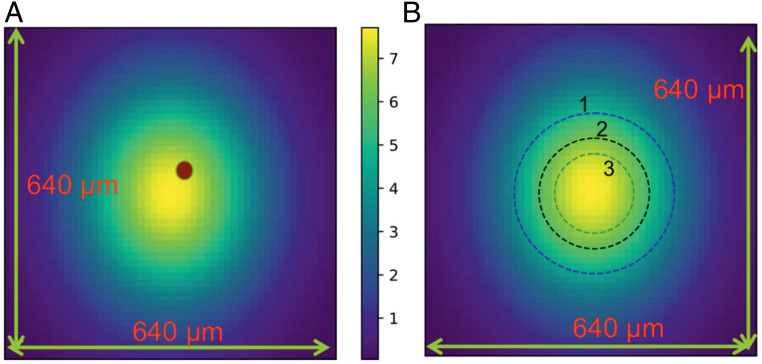
The experiment requires three entities, namely the X-ray pulse, IR laser, and the droplets to be in the same location (neglecting the movement of the droplets during the 1-µs time delay between the pulses). We ensure that the droplets and the X-rays coincide by monitoring the X-ray scattering signal on the detector. We use a fluorescent paper on the sample holder to ensure spatial overlap between the IR laser and the (attenuated) X-rays. We found that the spatial overlap is insensitive up to a distance of 4 mm along the direction of the propagation of the X-rays. This is well within the droplet train jitter of ±1 mm. The three datasets in Fig. 3B have different conditions of spatial overlap between the X-rays and the IR laser as shown in Fig. 4. It is necessary to compensate for this difference when combining the data. Cp calculated from dataset 1 (234 K < T < 244 K) is scaled to Cp from Voronov et al. (27) at T = 244 K. The Voronov et al. measurements (27) at 244 K are higher than Angell et al. measurements (17) at T = 244 K by 1.8 J/mol/K and our decision to scale Cp to Voronov et al. measurements instead of Angell et al. affects Cp negligibly. Cp calculated from dataset 2 (232 K < T < 236 K) is scaled to match Cp from dataset 1 and that from Angell et al. measurements (17). Cp from dataset 3 (228.5 K < T < 240 K) is scaled to match Cp from dataset 2 and the Angell et al. measurements (17).
Fig. 4.
Schematic of spatial overlap between X-ray (14 µm × 14 µm) and IR laser [305 µm (h) by 375 µm (v)]. (A) The image represents the flux of the IR laser (intensity in arbitrary units shown by the color bar) and the brown dot represents the position of the X-rays. The IR laser is adjusted to be concentric with the X-rays every 12 h. (B) The three dashed circles schematically illustrate the spatial overlap conditions for sets 1,2, and 3, respectively. Set 3 represents the best overlap between X-ray and IR laser. This is consistent with the real camera images of the spatial overlap.
Specific-Heat Capacity.
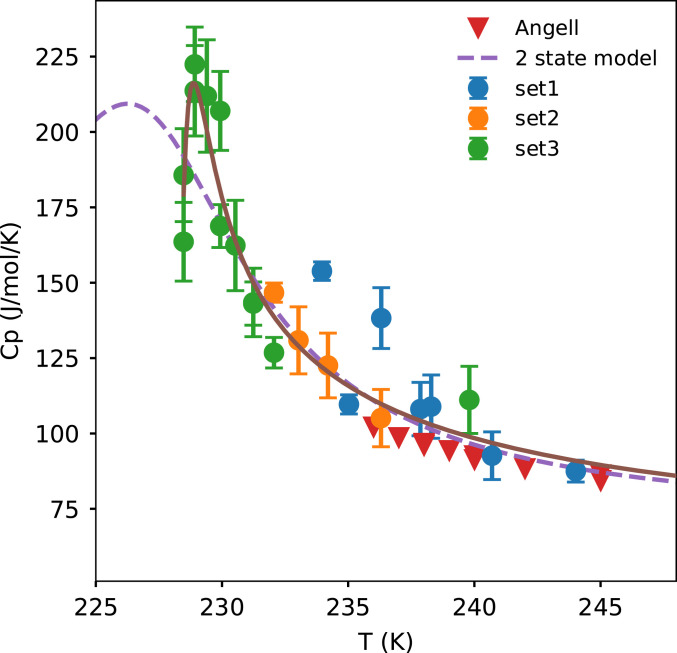
A detailed description of the calculation of Cp from ∆T is available in Cp from ∆T. In Fig. 5 we observe that Cp increases by almost a factor of 3 across the temperatures measured, rising from 75 J/mol/K at room temperature to about at 228.9 K. On further cooling to 228.5 K, there is a drop in the specific-heat capacity to an average value of . This decrease in Cp is observed for two independent measurements. Dataset 3 has the best spatial overlap and the coldest temperatures in the current experiment. In this dataset, we check for instrument drift with respect to time by returning to certain temperatures and repeating the measurements. Both measurements at 228.9 K result in higher Cp than for the two measurements at 228.5 K. The two-state model of water (28) shows a similar value at the maximum in water’s specific heat capacity but the maximum is at ∼226 K. The maximum for our data is at , as averaged from the Cp maximum from ∆TQ1 and ∆Tarea. An earlier study (13) using an almost identical experimental setup to measure water’s κT showed a maximum at . This temperature reported earlier was based on an extrapolated estimate of Cp below 236 K as input to the Knudsen evaporative cooling model. This study gives a value of Cp that is higher than previous estimates, resulting in a revised temperature of the κT and maxima (13) which is higher by 0.8 K. We also mention here that estimating Cp is an iterative process because the first estimates of Cp are used as an input in the Knudsen evaporation model, which subsequently yields new estimates of T and Cp until self-consistency occurs within 0.05 K.
Fig. 5.
The specific-heat capacity of water measured from three different datasets. The brown line is a guide to the eye. The Angell data are taken from ref. 17. and the two-state model data are taken from ref. 28. The error bars are SEMs calculated according to SI Appendix, section 7.
It is important to establish if our measurements could be affected by a small amount of nanocrystalline ice. Our threshold for detecting nanocrystalline ice was found to be 0.11% of ice by mass (SI Appendix, Fig. S7), which is similar to the previous estimate of 0.05% in ref. 14 using a similar experimental setup. This fraction of nanocrystalline ice would result in a decrease in Cp by 0.20 J/mol/K. This is a very small number as compared to what we observe in our measurements. We estimate a critical ice cluster size of 2.5 nm and nanocrystals that reach this size would quickly grow to a detectable size of 210 nm (SI Appendix, section 9) within 10 µs based on the growth rate of crystalline ice measured by Xu et al. (29), which is much faster than our X-ray measurements of 25 Hz. A scattering pattern with 1% nanocrystalline ice (30) would result in a large shift in Q1 to 1.78 Å−1, which we do not observe. This estimate is fully consistent with the observation that only a few crystals are formed as seen from the individual Bragg spots when ice is being detected, indicating nucleation-limited conditions (14, 31). Based on these observations, we conclude that nanocrystalline ice does not affect our measurements.
Excess Entropy and Dynamic Properties.
The excess entropy (Sex), i.e., the additional entropy present in a liquid with respect to its crystal at the same temperature, is useful in predicting the glass transition temperatures of liquids (18, 19). We estimate Sex from the excess specific-heat capacity at constant pressure from the following equation (32):
| [4] |
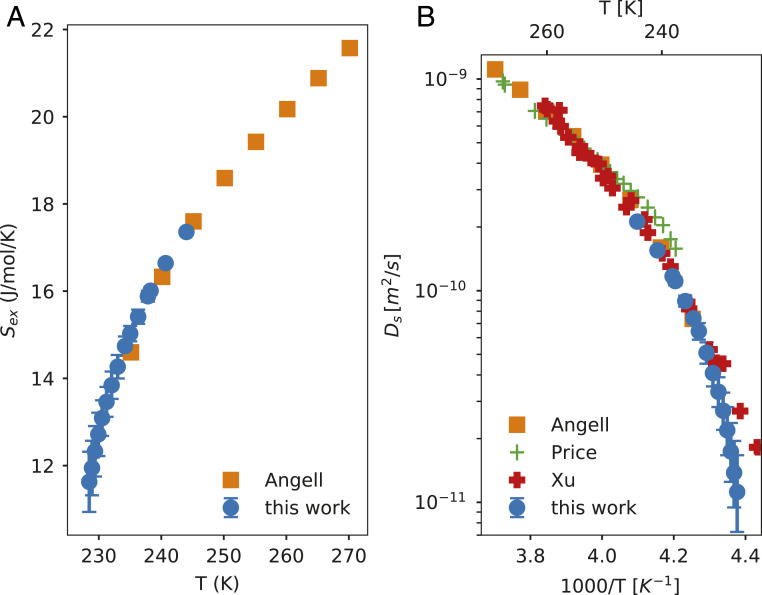
TM is the melting point of ice and Sex(TM) is the entropy of ice melting, which is 21.8 J/mol/K. Our data are presented in Fig. 6A and shows a steady decline on supercooling as expected. The data are consistent with the studies of Rasmussen and MacKenzie (23) and Angell et al. (19) who used emulsified water samples in heptane. We also observe that Sex is relatively insensitive to .
Fig. 6.
(A) Excess entropy for liquid water. Angell data are taken from ref. 19. (B) The self-diffusion coefficient of liquid water. Angell data are estimated by applying the Adam–Gibbs equation 5 to data from A. Price data are taken from ref. 38 and Xu data are taken from ref. 29. The error bars are based on a minimum and maximum value of Cp and are calculated according to SI Appendix, section 7.
We can also relate Cp and Sex of supercooled water to its dynamic properties and understand more about the proposed fragile-to-strong transition (1, 11) in water where there is a predicted sudden change in water’s self-diffusion coefficient. We use the Adam–Gibbs equation (33) to calculate the self-diffusion coefficient (Ds) of water.
| [5] |
Sconf is the configurational entropy, which is obtained by adding the residual entropy (Sres) to the excess entropy. This estimation of configurational entropy assumes that the vibrational entropy (Svib) is equal to that of the crystal (Scrystal). This assumption is not strictly valid (34), since the free-energy landscapes of liquids and crystals are not identical. However, it is widely used (32, 35), because Svib is proportional to Scrystal and the fitting parameters (A, DS0) in Eq. 5 account for that proportionality (32). The residual entropy is due to the proton disorder (36) and was estimated as Sres = R ln(3/2) = 3.47 J/mol/K, where R is the universal gas constant, but is experimentally found to be 3.54 J/mol/K (37). The constants A and Ds0 have been estimated by fitting the experimental data of liquid water in the temperature range from 373 to 237 K by Mallamace et al. (35) and are found to be A = −31.75 kJ/mol and Ds0 = 1.07 × 10⁻⁷ m2/s. Fig. 6B illustrates the self-diffusion coefficient of water. We compare our data to that derived in ref. (19) from emulsified supercooled water. More recent experiments of pulsed-laser heating of ice monolayers (29) and pulsed-gradient spin-echo NMR on water in a capillary (38) are also shown in Fig. 6B.
Discussion
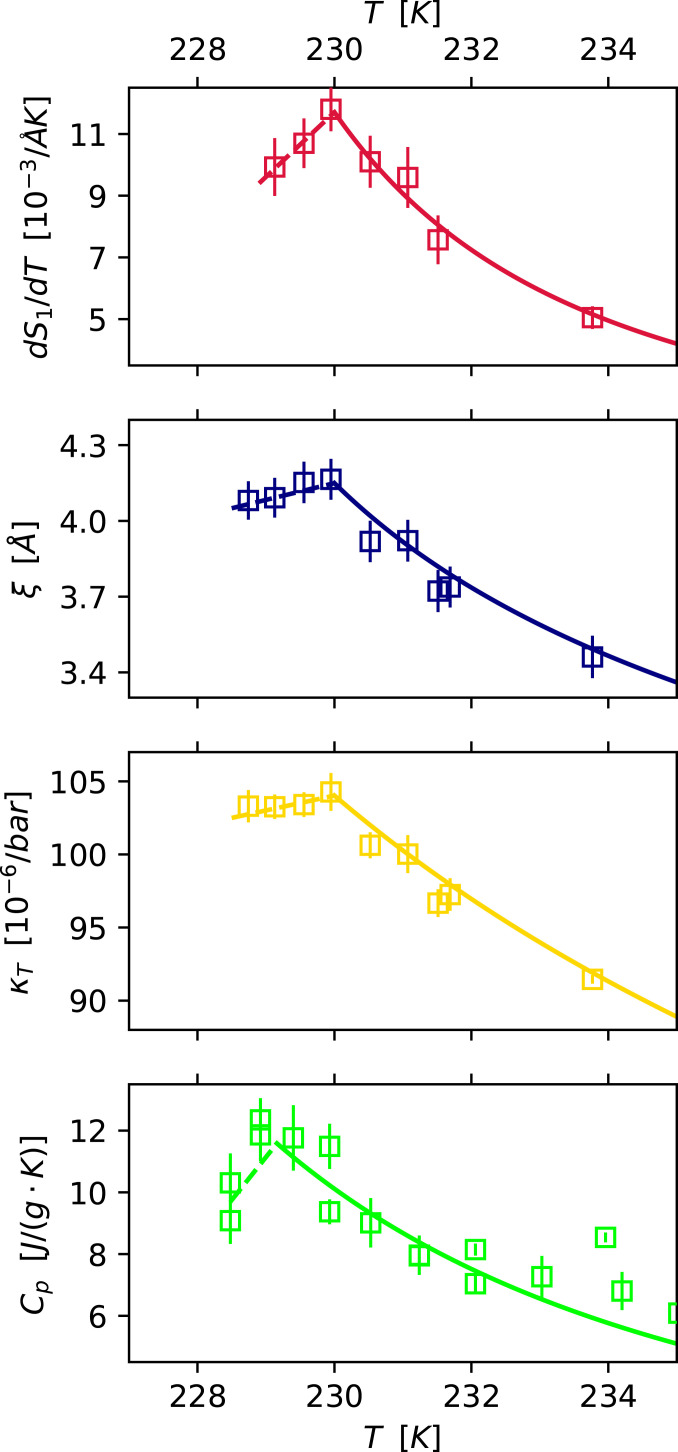
We have found that a maximum with respect to temperature exists for the isobaric specific-heat capacity of liquid water, which is at the same temperature as maxima in (dQ1/dT)OFF or , depending on the method to estimate temperature jump. We observed previously the experimental determination of the maxima of the isothermal compressibility, correlation length, and the derivative of the first peak in the structure factor (dS1/dT) (13). This observation brings a closure to the concept of the Widom line, that maxima of all the response functions are indeed observed, consistent with the existence of an LLCP at positive pressures (8).
Fig. 7 shows a direct comparison of the thermodynamic properties around the Widom line, with revised temperature for the previously studied κT, ξ, and dS1/dT (13). The magnitude of dS1/dT also changes due to the change in temperature and is revised in the same figure. As seen in Fig. 7, the maxima are close to each other in temperature. We also calculate dS1/dT for our experiment (SI Appendix, Section 6) and its maximum with respect to temperature is at as compared to from previous results (13). This is encouraging since the two different measurements with different detectors, X-ray facilities, and data analysis procedures give closely similar results. Our ability to accurately pinpoint the maximum is limited by the spacing between our consecutive data points, which is ∼0.5 K. Although there are errors in the absolute temperature from the Knudsen evaporation model, the relative errors in temperature within an experiment (13) is on the order of . This relative error is primarily due to vacuum fluctuation and precision of the sample position (13). There has been a debate about the accuracy of the droplet temperature in this setup of evaporating micrometer-sized water droplets in vacuum (26, 39, 40). Goy et al.’s observations (26) are consistent with our observations regarding the validity of the Knudsen evaporation model, but there is a disagreement with their conclusion that the degree of supercooling is overestimated in Sellberg et al. (14). This argument is based on the observed ice fraction from homogeneous ice nucleation rates and the insensitivity of the fit of droplet diameter vs. distance to the droplet velocity in the Goy et al. study, as discussed in the supplementary material of ref. 41. We calculate Cp for a lower and higher estimate of the temperature (SI Appendix, Fig. S6) and still observe a maximum in Cp.
Fig. 7.
Comparing the deeply supercooled region of κT, ξ, and dS1/dT (13) with the currently determined Cp. Note that the temperature scale is adjusted for κT, ξ, and dS1/dT with respect to ref. 13 by accounting for a remodeling of the evaporative cooling temperature, due to the rapid increase in Cp seen in the current measurements. The lines are power-law fits to the respective properties. The difference in maxima temperatures between Cp and the other properties are within the error bars.
Gallo et al. (12) showed that there are different lines of maxima in the P-T plane of κT, Cp, and αP as we approach the LGCP. In particular, the lines of maxima of Cp and αP follow each other closely, whereas the line of the maximum of κT deviates slightly. These lines only converge at 30 K and 90 bar above the LGCP. In the supercooled regime, the maxima of κT and Cp shown in Fig. 7 are only apart, which means that we might be close to an LLCP) of water. Previous studies have compared the experimental data to various molecular simulation models for water, locating the LLCP of real water at 600–1,000 bar (13, 16, 28, 41, 42).
The observed steep rise in Cp at T < 235 K means a rapid increase in entropy fluctuations. We also see a rapid change in κT and S1 position with respect to temperature at T < 235 K, which is correlated with tetrahedrality (16). We have the following relation between κT and Cp:
| [6] |
where ρ is the liquid density. By rewriting as ,
| [7] |
It is known that the constant volume heat capacity (Cv) has weak temperature dependence in the supercooled region (19) and T, , and are finite quantities and thus the rise in Cp should behave similarly as κT close to the putative LLCP. This rapid rise and maximum in Cp in metastable water is also seen in the two-state model of water (28) when fitted to the measured κT within “no-man’s land.” Although the maximum observed in that model is at a colder temperature of ∼226 K, the shift relative to κT is in the same direction as we observe.
The excess entropy of supercooled water decreases rapidly on supercooling below 235 K as shown in Fig. 6A. This rapid decrease extrapolated to lower temperatures would result in a theoretical glass transition temperature (Kauzmann temperature) at T ∼ 190 K. However, the glass transition temperature of LDA has been determined to be around 136 K (20) for the common experimental heating rate of 0.5 K/s and at higher temperatures translational diffusion of an ultraviscous liquid have been measured (29, 43). Therefore, it is expected that there exists a rapid change in the slope of Sex with respect to temperature below 227 K, pointing to a fragile-to-strong transition (1, 11, 44, 45). Recent studies (46) have been conducted to understand this transition in the 2005 revision of the transferable interaction potential with four points (TIP4P/2005) model of water, and proposed that the transition occurs at 220 K and is related to the change in the local-density environment of water from an HDL-rich phase to an LDL-rich phase. Such a hypothesis is consistent with the observation that the liquid is rapidly undergoing a structural change at the Widom line, becoming dominated by tetrahedral structures, as observed in the X-ray scattering data (13, 14). However, although the TIP4P/2005 model has some qualitative features resembling the anomalies of water, the values of maxima in Cp (47), as well as κT, ξ, and dS1/dT (16) at the Widom line are largely underestimated. Therefore, estimation of the fragile-to-strong transition using the TIP4P/2005 model would be far from quantitative and further experiments are necessary.
The derived diffusion coefficient agrees with other experiments, as seen in Fig. 6B. The data from Xu et al. (29) did not utilize bulk water but rather a 25-monolayer-thick layer of amorphous solid water that was heated to the liquid state by a nanosecond optical laser, resulting in a water thickness of 8 nm. This thickness is only 4× the average 2-nm length scale of the fluctuation at 230 K measured by small-angle X-ray scattering (13) and therefore the confinement could damp the fluctuations, which may somewhat affect the diffusion properties. Our Ds estimates at 229 K are 9.5 × 10⁻¹² – 2.0 × 10⁻¹¹ m2/s as compared to Xu’s measurements of 2.4–4.1 × 10⁻¹¹ m2/s at the same temperatures. It will be necessary to perform more accurate measurements of the diffusion coefficient of water upon deep supercooling, which could be obtained using X-ray photon correlation spectroscopy (43).
Conclusions
We have demonstrated a method for performing ultrafast calorimetry based on the usage of an IR pump as a heating source and an X-ray laser as a probe of temperature. A time delay between the pulses allows for thermal expansion and thereby provides heat capacity measurements at constant pressure (Cp). Since we used rather small temperature jumps (<1 K), Cp can be estimated to within 10% relative error and ±1 K. However, the signal of the X-ray scattering change is small, affecting the overall quality of the data so that each different run series depends on the specific spatial overlap of the pump and probe pulses, making it necessary to combine different runs together. Although the accuracy is lower than measurements of the isothermal compressibility (κT), correlation length (ξ), and the derivative of the structure factor (dS1/dT) all observing maxima at a temperature of 230 K, we conclude that the current data are consistent with Cp having a maximum at . Since the temperature difference between the κT and Cp maxima is small, it indicates that a critical point in the temperature-pressure phase diagram could be in the proximity of our measurement conditions.
Since the Cp maximum has a large value, it will affect the slope of the excess entropy temperature dependence toward lower temperatures. In order to connect to the glass transition at ∼136 K, it is necessary for a rapid change of slope of the excess entropy somewhere below 227 K, supporting a proposed fragile-to-strong transition at somewhat lower temperatures. Using the Adam–Gibbs equation and approximations regarding the configurational entropy, we show that the self-diffusion coefficient decreases rapidly as the liquid is cooled below 235 K, further favoring a dynamic transition at around 220 K.
Materials and Methods
We use milli-Q water for our measurements. We use ultrafast X-rays provided by the Bernina beamline (48) at SwissFEL at the Paul Scherrer Institute (PSI) with a photon energy of 9.55 keV with ∆E/E < 5 × 10⁻³ and a repetition rate of 25 Hz and pulse energy of 350–450 µJ/pulse. The X-ray focus size is measured by a knife-edge scan and is 14 µm by 14 µm full width at half maximum (FWHM). An IR femtosecond laser with a wavelength of 2.05 µm (bandwidth FWHM = 0.18 µm) and size (FWHM) of 305 µm (horizontal) by 375 µm (vertical) and energy of 290 ± 5 µJ (measured by a power meter) is used to excite the droplets. The wavelength is deliberately chosen to be slightly away from the absorption peak (49) of liquid water (1.94 µm at 26 °C) because of the relative insensitivity of the absorption coefficient with respect to temperature (50, 51). The droplets are 15 µm in diameter with a velocity of 16.6 m/s and are probed by X-rays at different positions in the vacuum chamber that correspond to different temperatures. There is a constant delay of 1 µs between the IR laser and the X-rays and the IR laser is switched OFF every alternate X-ray pulse. Assuming a Cp = 82 J/mol/K and an absorption coefficient of 55 cm−1 (based on the water absorption spectrum at room temperature and the laser profile), the laser is expected to cause a T jump of ∼2.6 K if the droplet is at the center of the laser (1 K if the droplet is 1 SD away in both the directions). This T jump is independent of the droplet size (our largest source of error) because the fraction of energy absorbed by the droplet is low (see Cp from ∆T). The scattering pattern is detected using a 16-M Jungfrau detector with a Q range from 0.3 to 4.3 Å−1. The X-ray intensity is measured using a 1.5-M Jungfrau detector. T jump and Cp are depicted in SI Appendix, Table S1.
Cp from ∆T.
Cp is calculated by dividing the energy absorbed (Eabs) by the droplet by the mass of the droplet (m) and the temperature jump (∆T).
| [8] |
where Ei = energy incident on the droplet, Eflux = incident IR laser flux on the water droplet, d = droplet diameter, deff = effective path length of the IR light through the droplet =2/3*d, and α = absorption coefficient of water.
We find that for , this Cp estimation is independent of the droplet size. for water was found to be 55 cm−1 at 26 °C by convoluting water’s absorption spectrum (49) with the laser bandwidth. The temperature dependence of the absorption coefficient was estimated based on the measurements of Jensen et al. (50) in the range of 30–42 °C and convoluting it with the laser bandwidth. Their studies indicate that the colder water has milder variation in the absorption coefficient. We use the value from their coldest measurements at 30 °C of that yields an absorption coefficient varying in a narrow range between 65 cm−1 at 244 K to 68 cm−1 at 228.5 K. Thus, variation in has a negligible effect on estimation of Cp from ∆T.
Supplementary Material
Acknowledgments
This work has been supported by the European Research Council Advanced Grant under Project 667205 and the Swedish Research Council under Grants 2013-8823, 2017-05128, and 2019-05542. The research leading to these results has also received funding from the European Union’s Horizon 2020 research and innovation programme under Grant Agreement 730872, Project CALIPSOplus, and the Göran Gustafsson Foundation under Grant Agreements 1808, 1909, and 2044. The experiments were performed at beamline Bernina of SwissFEL under Proposal p17743 funded by the PSI, Switzerland. K.H.K. and C.Y. were supported by a National Research Foundation of Korea grant funded by the Korean government (Grant 2020R1A5A1019141). We thank Francis Starr for valuable discussions and Frédéric Caupin for providing the data for the two-state model.
Footnotes
The authors declare no competing interest.
This article is a PNAS Direct Submission.
This article contains supporting information online at https://www.pnas.org/lookup/suppl/doi:10.1073/pnas.2018379118/-/DCSupplemental.
Data Availability.
All study data are included in the article and/or SI Appendix. Some study data are available upon request.
References
- 1.Angell C. A., Insights into phases of liquid water from study of its unusual glass-forming properties. Science 319, 582–587 (2008). [DOI] [PubMed] [Google Scholar]
- 2.Debenedetti P. G., Supercooled and glassy water. J. Phys. Condens. Matter 15, R1669–R1726 (2003). [Google Scholar]
- 3.Mishima O., Stanley H. E., The relationship between liquid, supercooled and glassy water. Nature 396, 329–335 (1998). [Google Scholar]
- 4.Angell C. A., Supercooled water. Annu. Rev. Phys. Chem. 34, 593–630 (1983). [Google Scholar]
- 5.Debenedetti P. G., Metastable Liquids: Concepts and Principles (Princeton University Press, 1996). [Google Scholar]
- 6.Huang C., et al., Increasing correlation length in bulk supercooled H2O, D2O, and NaCl solution determined from small angle x-ray scattering. J. Chem. Phys. 133, 134504 (2010). [DOI] [PMC free article] [PubMed] [Google Scholar]
- 7.Speedy R. J., Angell C. A., Isothermal compressibility of supercooled water and evidence for a thermodynamic singularity at −45°C. J. Chem. Phys. 65, 851–858 (1976). [Google Scholar]
- 8.Poole P. H., Sciortino F., Essmann U., Stanley H. E., Phase-behavior of metastable water. Nature 360, 324–328 (1992). [Google Scholar]
- 9.Palmer J. C., et al., Metastable liquid-liquid transition in a molecular model of water. Nature 510, 385–388 (2014). [DOI] [PubMed] [Google Scholar]
- 10.Nilsson A., Pettersson L. G., The structural origin of anomalous properties of liquid water. Nat. Commun. 6, 8998 (2015). [DOI] [PMC free article] [PubMed] [Google Scholar]
- 11.Xu L., et al., Relation between the Widom line and the dynamic crossover in systems with a liquid-liquid phase transition. Proc. Natl. Acad. Sci. U.S.A. 102, 16558–16562 (2005). [DOI] [PMC free article] [PubMed] [Google Scholar]
- 12.Gallo P., Corradini D., Rovere M., Widom line and dynamical crossovers as routes to understand supercritical water. Nat. Commun. 5, 5806 (2014). [DOI] [PubMed] [Google Scholar]
- 13.Kim K. H., et al., Maxima in the thermodynamic response and correlation functions of deeply supercooled water. Science 358, 1589–1593 (2017). [DOI] [PubMed] [Google Scholar]
- 14.Sellberg J. A., et al., Ultrafast X-ray probing of water structure below the homogeneous ice nucleation temperature. Nature 510, 381–384 (2014). [DOI] [PubMed] [Google Scholar]
- 15.Holten V., et al., Compressibility anomalies in stretched water and their interplay with density anomalies. J. Phys. Chem. Lett. 8, 5519–5522 (2017). [DOI] [PubMed] [Google Scholar]
- 16.Pathak H., et al., Temperature dependent anomalous fluctuations in water: Shift of ≈1 kbar between experiment and classical force field simulations. Mol. Phys. 117, 3232–3240 (2019). [Google Scholar]
- 17.Angell C. A., Sichina W. J., Oguni M., Heat capacity of water at extremes of supercooling and superheating. J. Phys. Chem. 86, 998–1002 (1982). [Google Scholar]
- 18.Angell C. A., Sare E. J., Glass‐forming composition regions and glass transition temperatures for aqueous electrolyte solutions. J. Chem. Phys. 52, 1058–1068 (1970). [Google Scholar]
- 19.Angell C. A., Shuppert J., Tucker J. C., Anomalous properties of supercooled water. Heat capacity, expansivity, and proton magnetic resonance chemical shift from 0 to -38%. J. Phys. Chem. 77, 3092–3099 (1973). [Google Scholar]
- 20.Johari G., Hallbrucker A., Mayer E., The glass–liquid transition of hyperquenched water. Nature 330, 552–553 (1987). [Google Scholar]
- 21.Angell C. A., Tucker J. C., Anomalous heat capacities of supercooled water and heavy water. Science 181, 342–344 (1973). [DOI] [PubMed] [Google Scholar]
- 22.Anisimov M A VAV., Zaugol’nikova N. S., Ovodov G., Specific heat of water near the melting point and ornstein-zernike fluctuation corrections. JETP Lett. 15, 317 (1972). [Google Scholar]
- 23.Rasmussen D. H., MacKenzie A. P., Clustering in supercooled water. J. Chem. Phys. 59, 5003–5013 (1973). [Google Scholar]
- 24.Knudsen M., Die maximale Verdampfungsgeschwindigkeit des Quecksilbers. Ann. Phys. 352, 697–708 (1915). [Google Scholar]
- 25.Schlesinger D., Sellberg J. A., Nilsson A., Pettersson L. G. M., Evaporative cooling of microscopic water droplets in vacuo: Molecular dynamics simulations and kinetic gas theory. J. Chem. Phys. 144, 124502 (2016). [DOI] [PubMed] [Google Scholar]
- 26.Goy C., et al., Shrinking of rapidly evaporating water microdroplets reveals their extreme supercooling. Phys. Rev. Lett. 120, 015501 (2018). [DOI] [PubMed] [Google Scholar]
- 27.Voronov V., Podnek V., Anisimov M., High-resolution adiabatic calorimetry of supercooled water. J. Phys. Conf. Ser. 1385, 012008 (2019). [Google Scholar]
- 28.Caupin F., Anisimov M. A., Thermodynamics of supercooled and stretched water: Unifying two-structure description and liquid-vapor spinodal. J. Chem. Phys. 151, 034503 (2019). [DOI] [PubMed] [Google Scholar]
- 29.Xu Y., Petrik N. G., Smith R. S., Kay B. D., Kimmel G. A., Growth rate of crystalline ice and the diffusivity of supercooled water from 126 to 262 K. Proc. Natl. Acad. Sci. U.S.A. 113, 14921–14925 (2016). [DOI] [PMC free article] [PubMed] [Google Scholar]
- 30.Moore E. B., Molinero V., Is it cubic? Ice crystallization from deeply supercooled water. Phys. Chem. Chem. Phys. 13, 20008–20016 (2011). [DOI] [PubMed] [Google Scholar]
- 31.Laksmono H., et al., Anomalous behavior of the homogeneous ice nucleation rate in “No-man’s land”. J. Phys. Chem. Lett. 6, 2826–2832 (2015). [DOI] [PMC free article] [PubMed] [Google Scholar]
- 32.Starr F. W., Angell C. A., Stanley H. E., Prediction of entropy and dynamic properties of water below the homogeneous nucleation temperature. Physica A 323, 51–66 (2003). [Google Scholar]
- 33.Adam G., Gibbs J. H., On the temperature dependence of cooperative relaxation properties in glass‐forming liquids. J. Chem. Phys. 43, 139–146 (1965). [Google Scholar]
- 34.Saito S., Bagchi B., Thermodynamic picture of vitrification of water through complex specific heat and entropy: A journey through “no man’s land”. J. Chem. Phys. 150, 054502 (2019). [DOI] [PubMed] [Google Scholar]
- 35.Mallamace F., et al., Specific heat and transport functions of water. Int. J. Mol. Sci. 21, (2020). [DOI] [PMC free article] [PubMed] [Google Scholar]
- 36.Pauling L., The structure and entropy of ice and of other crystals with some randomness of atomic arrangement. J. Am. Chem. Soc. 57, 2680–2684 (1935). [Google Scholar]
- 37.Giauque W. F., Stout J. W., The entropy of water and the third law of thermodynamics. The heat capacity of ice from 15 to 273°K. J. Am. Chem. Soc. 58, 1144–1150 (1936). [Google Scholar]
- 38.Price W. S., Ide H., Arata Y., Self-diffusion of supercooled water to 238 K using PGSE NMR diffusion measurements. J. Phys. Chem. A 103, 448–450 (1999). [Google Scholar]
- 39.Caupin F., et al., Comment on “Maxima in the thermodynamic response and correlation functions of deeply supercooled water”. Science 360, eaat1634 (2018). [DOI] [PubMed] [Google Scholar]
- 40.Kim K. H., et al., Response to Comment on “Maxima in the thermodynamic response and correlation functions of deeply supercooled water”. Science 360, eaat1729 (2018). [DOI] [PubMed] [Google Scholar]
- 41.Späh A., et al., Apparent power-law behavior of water’s isothermal compressibility and correlation length upon supercooling. Phys. Chem. Chem. Phys. 21, 26–31 (2018). [DOI] [PubMed] [Google Scholar]
- 42.Hestand N. J., Skinner J. L., Perspective: Crossing the Widom line in no man’s land: Experiments, simulations, and the location of the liquid-liquid critical point in supercooled water. J. Chem. Phys. 149, 140901 (2018). [DOI] [PubMed] [Google Scholar]
- 43.Perakis F., et al., Diffusive dynamics during the high-to-low density transition in amorphous ice. Proc. Natl. Acad. Sci. U.S.A. 114, 8193–8198 (2017). [DOI] [PMC free article] [PubMed] [Google Scholar]
- 44.Corradini D., Rovere M., Gallo P., A route to explain water anomalies from results on an aqueous solution of salt. J. Chem. Phys. 132, 134508 (2010). [DOI] [PubMed] [Google Scholar]
- 45.Abascal J. L. F., Vega C., Widom line and the liquid-liquid critical point for the TIP4P/2005 water model. J. Chem. Phys. 133, 234502 (2010). [DOI] [PubMed] [Google Scholar]
- 46.Saito S., Bagchi B., Ohmine I., Crucial role of fragmented and isolated defects in persistent relaxation of deeply supercooled water. J. Chem. Phys. 149, 124504 (2018). [DOI] [PubMed] [Google Scholar]
- 47.Vega C., Abascal J. L. F., Nezbeda I., Vapor-liquid equilibria from the triple point up to the critical point for the new generation of TIP4P-like models: TIP4P/Ew, TIP4P/2005, and TIP4P/ice. J. Chem. Phys. 125, 34503 (2006). [DOI] [PubMed] [Google Scholar]
- 48.Ingold G., et al., Experimental station Bernina at SwissFEL: Condensed matter physics on femtosecond time scales investigated by X-ray diffraction and spectroscopic methods. J. Synchrotron Radiat. 26, 874–886 (2019). [DOI] [PMC free article] [PubMed] [Google Scholar]
- 49.Max J.-J., Chapados C., Isotope effects in liquid water by infrared spectroscopy. III. H2O and D2O spectra from 6000 to 0 cm(-1). J. Chem. Phys. 131, 184505 (2009). [DOI] [PubMed] [Google Scholar]
- 50.Jensen P. S., Bak J., Andersson-Engels S., Influence of temperature on water and aqueous glucose absorption spectra in the near- and mid-infrared regions at physiologically relevant temperatures. Appl. Spectrosc. 57, 28–36 (2003). [DOI] [PubMed] [Google Scholar]
- 51.Jansen E. D., van Leeuwen T. G., Motamedi M., Borst C., Welch A. J., Temperature dependence of the absorption coefficient of water for midinfrared laser radiation. Lasers Surg. Med. 14, 258–268 (1994). [DOI] [PubMed] [Google Scholar]
Associated Data
This section collects any data citations, data availability statements, or supplementary materials included in this article.
Supplementary Materials
Data Availability Statement
All study data are included in the article and/or SI Appendix. Some study data are available upon request.


