

Abstract
Cucumis melo (melon or muskmelon) is an important crop in the family of the Cucurbitaceae. Melon is cross pollinated and domesticated at several locations throughout the breeding history, resulting in highly diverse genetic structure in the germplasm. Yet, the relations among the groups and cultivars are still incomplete. We shed light on the melonbreeding history, analyzing structural variations ranging from 50 bp up to 100 kb, identified from whole genome sequences of 100 selected melon accessions and wild relatives. Phylogenetic trees based on SV types completely resolve cultivars and wild accessions into two monophyletic groups and clustering of cultivars largely correlates with their geographic origin. Taking into account morphology, we found six mis-categorized cultivars. Unique inversions are more often shared between cultivars, carrying advantageous genes and do not directly originate from wild species. Approximately 60% of the inversion breaks carry a long poly A/T motif, and following observations in other plant species, suggest that inversions in melon likely resulted from meiotic recombination events. We show that resistance genes in the linkage V region are expanded in the cultivar genomes compared to wild relatives. Furthermore, particular agronomic traits such as fruit ripening, fragrance, and stress response are specifically selected for in the melon subspecies. These results represent distinctive footprints of selective breeding that shaped today’s melon. The sequences and genomic relations between land races, wild relatives, and cultivars will serve the community to identify genetic diversity, optimize experimental designs, and enhance crop development.
Keywords: Cucumis melo, structural variations, plant breeding history
Introduction
The family of the Cucurbitaceae consists of around 975 species across 98 genera, some of which have economic importance like the genus Cucumis of which species like melo (melon) and sativus (cucumber) are well known for their nutritious value and taste, while other species have a characteristic fragrance like dudaim, or fruit shape (e.g., “horned melon” and “armenian cucumber”). Cucumis melo is grown worldwide and has been cultivated into many varieties and include for example netted cultivars (e.g., cantaloupe) or smooth skinned varieties (e.g., honeydew, casaba). Over the past decades melon breeding focused on higher productivity and adaptation to different growing systems. According to the FAO, worldwide melon production in 2018 (www.fao.org/faostat) amounted to 27.4 million tons, reflecting the success of modern melon breeding. However, this massive production is threatened by lack of disease resistance and (a)biotic stress tolerance traits in melon. A few disease resistance genes have been identified in a few melon accessions such as Fom-2, Fom-1 locus for Fusarium wilt disease (Joobeur et al. 2004; Tezuka et al. 2009), QTL for Cucurbit yellow stunting disorder virus (Palomares-Ríus et al. 2016), cmv1 gene and two other QTLs for Cucumber mosaic virus (Guiu-Aragonés et al. 2014), and a QTL for powdery mildew (Li et al. 2017). Further research for discovering resistance genes and QTL as well as generating new commercial resistant lines are ongoing (https://cuccap.org/breeding/melon/). Furthermore, changing environmental conditions, the demand for improved food quality (nutritional properties, increased shelf life), and new consumer preferences become increasingly important. This motivates the development of adapted and advanced crops and efficient agricultural production systems that are more in line with environmental, economic, and social needs. To achieve this goal, it is important to disclose and use genetic diversity underlying important target crop traits by breeding. The wild species that are closely related to cultivated melon represent a rich genetic diversity that can be used for advanced introgression hybridization breeding to introduce economically important traits, either by direct crossing or via bridging species.
Selection of compatible breeding parents for inter-specific hybridization breeding requires insight into the phylogenetic relationships and the genomic context of target genes underlying key economical traits. However, phylogenetic relationships for the Cucumis clade are incomplete and are not undisputed. Cucumber and melon diverged only 10 million years ago (Sebastian et al. 2010). Although the chromosome number of cucumber (2n = 14) and melon (2n = 24) is different, there is high synteny between two genomes (Huang et al. 2009; Li et al. 2011). Ancestral fusion of five melon chromosome pairs in cucumber was suggested besides the observation of several intra- and interchromosomal rearrangements (Garcia-Mas et al. 2012). Phylogenetic trees based on internal transcribed spacer sequences of nuclear ribosomal DNA (Garcia-Mas et al. 2004) and partial mitochondrial DNA (Renner et al. 2007) revealed that the genus Cucumis is monophyletic and contains many diverse melon and cucumber like species. The two aforementioned studies, however, disagreed on the branching of species within Cucumis, most likely due to usage of nongenomic data. Cucumis melo is suggested to be domesticated several times independently in Africa, Australia, Asia, and two times in India (South Asia) (Endl et al. 2018; Gonzalo et al. 2019; Zhao et al. 2019). Currently, C. melo is divided into two subspecies, C. melo ssp. melo and C. melo ssp. agrestis based on morphology, yet the genetic data (SNP) also supports the distinction (Zhao et al. 2019). These subspecies have been further divided into groups even though some of these groups are heterogenous and phenotypically complex (mixed). The ssp. melo has been divided into eleven groups (cantalupensis, reticulatus, adana, chandalak, ameri, inodorus, chate, flexuosus, dudaim, chito, and tibish), whereas ssp. agrestis has been divided into five (momordica, conomon, chinensis, makuwa, and acidulus) (Pitrat 2008), referred to as the 16-group classification. A later study suggested a 19-group classification with changes as (1) to merge the reticulatus and cantalupensis; (2) to split the large inodorus into three sub groups; (3) and the addition of two new groups kachri and indicus (Pitrat 2016). It is also suggested to remove the subspecifies classification as these 19 groups sufficiently distinguish melon. Since the new classification has not been applied in the databases yet, we have followed the 16-group classification in this study. The population diversity of melon was further studied with genetic marker assays such as AFLP, SNP assays, and WGS (Esteras et al. 2013; Zhao et al. 2019). One study focused on the group level and found a mixed (diverse) population structure in the ssp. agrestis groups, more than the commercially important ssp. melo groups inodorus and cantalupensis (Esteras et al. 2013). Another study focused on the differences between cultivated and wild accessions within subspecies, revealing that cultivated melo has a much higher nucleotide diversity than cultivated agrestis (Zhao et al. 2019).
In addition to SNPs, structural variants (SVs) can hold valuable and distinctive phylogenetic information (Saxena et al. 2014). SVs provide information on variations in genic content such as copy number variation (CNV), inversions, translocations and deletions. SVs in melon were previously analyzed at a small scale, including seven accessions (González et al. 2013; Sanseverino et al. 2015). It has been found that the rate of occurrence of SVs is similar to that found in other species (Saxena et al. 2014; Sanseverino et al. 2015). In contrast to melon, an extensive SV study was conducted by Zhang et al. (2015) on 115 cucumber accessions. The study revealed that SVs derived mostly from nonhomologous rearrangement followed by transposable element (TE) movement, and very few by nonallelic homologous recombination (Zhang et al. 2015). Regions with increased recombination frequency were correlated (co-located) with high CNV in soybean and barley, but not in maize (Saxena et al. 2014). On the other hand, in maize, presence/absence variation (PAV) of SV was not influenced by recombination but by short direct repeats (Woodhouse et al. 2010). For genetic diversity assessments and Cucurbitaceae genomic studies, the production of an annotated melon reference genome represented a valuable resource (Garcia-Mas et al. 2012). This reference was constructed from the accession DHL92, which is a cross between accession Songwhan Charmi (C. melo ssp. agrestis) and Piel de Sapo (C. melo ssp. melo). The reference DHL92 genome is improved by optical mapping, and transposons were reannotated in the improved version (Ruggieri et al. 2018). The annotated reference revealed a considerable amount of the genome (44%) composed of TEs as a major source of SV. Three quarters of these TEs are retrotransposons, whereas the rest consists of DNA transposons and unclassified TEs (Ruggieri et al. 2018).
To benefit from the allelic richness occurring in wild species and to advance (introgression) breeding for melon crop improvement, assessment of genetic diversity and insight in chromosome topology is required, which at the moment is lacking. Disclosure of the genetic diversity and chromosome synteny and collinearity will not only be of use for precision breeding, but is also required to achieve a thorough understanding of the fundamentals of melon genome evolution and the genetic basis of complex traits. To achieve this goal, we have sequenced 94 melon (Cucumis melo) accessions and 6 wild species related to melon. We show that this provides a valuable resource for genome wide SV analysis across a large panel of accessions that is representative of the major phylogenetic groups. We have assessed these SVs in 100 melon and melon related wild accessions and use these data to shed light on the evolutionary history of melon breeding from a structural genomics point of view.
Materials and methods
Melon accessions
The melon accessions selected in this study consist of 25 ssp. agrestis, 69 ssp. melo, and 6 wild species C. zeyheri, C. prophetarum, C. anguria, C. dipsaceus, C. myriocarpus, and C. ficifolius. The details of accessions including country of origin, seed provider, accession number, common name and groups, and subspecies they belong to are given in Supplementary Table S1.
DNA isolation and sequencing
Leaf material from 100 melon accessions were grinded and subsequently used for DNA isolation using the Qiagen DNeasy Plant Mini Kit. DNA concentration was measured using Qubit fluorometric quantitation (Lifetechnologies, www. lifetechnologies.com/qubit.html). For each sample ∼2 μg DNA was used as input for TruSeq DNA PCR-Free Library Preparation. DNA was sheared using a Covaris M220 to an average insert size of ∼550 bp according to the manufacturer protocol. Samples were individually barcoded and combined in two pools of each 33 samples and one pool of 34 samples. Prior to sequencing on the HiSeq2500 a qPCR and a MiSeq Nano run were performed to balance the samples and optimize cluster density. Aired-end 126 bp sequences at a mean coverage of 31-fold (assuming a genome size of 450 Mbp) were generated.
Alignment of reads
The reads were trimmed by Trimmomatic version 0.36 (Bolger et al. 2014) with settings of minimum base quality of 20 and minimum read length of 50. Then the first 3 bp from the 5' end was trimmed by cutadapt v1.16 (Martin 2011). We mapped the Illumina short read by bwa mem v0.7.7 (Li and Durbin 2009) with default settings to melon reference genome CM3.6.1 which can be found in melonomics website (https://www.melonomics.net).
SV detection
We followed the method described in Fuentes et al. (2019) to identify the SV events with some modifications. Briefly, inversions, deletions, and duplication events were identified with four SV calling methods namely Pindel (Ye et al. 2009), LUMPY (Layer et al. 2014), GROM (Smith et al. 2017), and DELLY 2 (Rausch et al. 2012) based on the aligned reads. The results from different callers were merged if an SV event was called by at least two callers and the locations had 80% reciprocal overlap. When merging the SV events, the borders of the SV events were used from a single caller with the following priority: Pindel, DELLY, GROM, and LUMPY, as explained by benchmarking in Fuentes et al. (2019). The SV is filtered out if the ratio of the breakpoint error, or the span of inaccurate boundaries, to the intersection of the SV calls from different callers is larger than 1. We also discarded SV events in chromosome 0 (combination of unassigned contigs) and SV events shorter than 50 bp.
SV validation criteria
To validate each SV, we looked at the discordant read information and read coverage in the read alignment file via the Integrative genomics viewer, IGV version 2.5.2 (Robinson et al. 2011). A read pair is called proper if the first read is aligned in forward direction (F) and the second read is aligned in reverse direction (R)—so-called FR pair—and the insert size is approximately the library size; otherwise, the read pair is called discordant. We called a tandem duplication event if sufficient (at least 4) RF-oriented pairs are present at both ends of the duplication event. For the inversion events, we searched for either one of RR or FF-oriented pairs or presence of both of RR and FF-oriented pairs at the ends of inversion events. Finally, for large deletion events, we searched for FR pairs with insert size larger or smaller than expected insert size; for smaller deletion events, that is, smaller than the read size, we checked split reads. Alternatively, for deletions and duplications, when there is no supporting paired-read information, we looked at differences of read coverage at the inspected SV event compared to nearby regions (or its flanking regions).
Functional annotation (GO term enrichment)
The SVs were grouped based on their type (duplication, inversion, deletion) and based on the subspecies label of accession they were observed either C. melo ssp. melo or C. melo ssp. agrestis. The SVs observed in wild related species were grouped together under the name wilds. In total, nine groups were prepared. For each group, the genes overlapping with SV events are identified by using bedtools intersect tool version 2.25 (Quinlan and Hall 2010). Overlap is defined when either the full length of an SV is covered by a gene or 50% of a gene is covered by an SV. We used the genome annotation version 4.0: CM4.0.gff3 (Ruggieri et al. 2018) downloaded from the melonomics website (https://www.melonomics.net).
The genes overlapping with the SVs in a group were tested against a population of genes (present in all nine SV groups) on enrichment of a certain Gene Ontology (GO) term (molecular function, biological process and/or cellular component) in that group compared to the rest of the SVs. For GO term enrichment analysis, we used Ontologizer 2.1 (Bauer et al. 2008) with Parent-Child-Union approach (Grossmann et al. 2007) and Benjamini–Hochberg (BH) multiple testing correction method (Benjamini and Hochberg 1995). As a summary file for GO terms, the go-basic.obo file (http://purl.obolibrary.org/obo/go/go-basic.obo) is used. The gene association file (required by Ontologizer) is prepared with custom scripts from the melon genome annotation v4.0. The alternative GO term IDs given in CM4.0 annotation file were replaced with the main GO term IDs (as given in go-basics.obo file) as the current version (2.1) of ontologizer does not take alternative IDs into account.
Any GO term in any gene set was counted as significant if BH-adjusted P-values were less than 0.05. Subsequently, these GO terms were summarized for each SV type with REVIGO (Supek et al. 2011). A value is given to a GO term based on how many melon groups it was significantly overrepresented in [one for single, two for two groups, and three for all groups (ssp. agrestis, ssp. melo, and wilds)]. We did not take into account the GO terms which were significantly overrepresented in all groups.
Dendrograms
We constructed a cluster map as a combination of a heat map and a tree based on presence/absence of SV events. We used Euclidean distance to cluster the SV events via the clustermap function in the seaborn module version 0.9.0 (Waskom et al. 2017) with Python 3. The presence/absence of SV events in 100 genomes were used to construct a maximum-likelihood (ML) tree dendrogram via RAxML version 8.2.12 (Stamatakis 2014) with settings BINGAMMA and 100 bootstrap. The best tree was visualized in MEGA version 10.0.5 (Kumar et al. 2018) and Iroki (Moore et al. 2020).
Correlation between SV and genomic features
The gene models and transposon data of melon genome annotation version 4.0 were retrieved from the melonomics website. The genome was binned with 100 kb bin size. For each bin, the coverage of duplication, inversion, deletion, gene models, and transposons were calculated. Pearson’s correlation was applied to the coverage values of each pair of dataset.
Motif discovery
Sequence motif discovery was done with the MEME suite 5 (Bailey et al. 2009). The 1000 bp flanking regions of inversion breakpoints were extracted from the reference genome where the inversion size is more than 1 kb to eliminate the redundancy (n = 855). In total, 1710 sequences were used to discover sequence motifs around the breakpoints. We ran MEME in ‘any number of repetitions’ (anr) mode, allowing it to find motifs which may occur in any number as long as they are nonoverlapping; a minimum and maximum motif length of 6 and 50, respectively; and including reverse complement settings. As a background we used first-order Markov frequencies, in other words dinucleotide frequencies in the reference genome.
Data availability
The sequences generated during the current study are available in the European Nucleotide Archive repository, https://www.ebi.ac.uk under study PRJEB37978. Supplementary Figure S1 contains allele frequency counts for duplications, inversions, and deletions. Supplementary Figure S2 contains clustering of the duplications and melon accessions based on presence/absence of duplications. Supplementary Figures S3–S5 contain ML trees based on duplications, inversions, and deletions, respectively. Supplementary Figure S6 contains a ML tree with bootstrap values based on combined SV events. Supplementary Table S1 contains the details of accessions used in this study including country of origin, accession number, common name and groups, and subspecies they belong to. Supplementary Table S2 contains the PAV of 104 genes in linkage group V in 100 melon accessions. Supplementary Table S3 contains the overrepresented GO terms in genes overlapping with SV.
Supplemental material available at fighsare DOI: https://doi.org/10.25387/g3.13312088.
Results and discussion
We have identified SVs in 100 melon genomes by combining multiple SV detection tools which use different types of information, as this proved better than using a single type of information or a single tool (Kosugi et al. 2019). Briefly, the SVs are identified from whole genome pair-end sequencing data, using three types of information including read depth split-read and paired-end information detected by four SV detection algorithms (GROM, LUMPY, Pindel, and DELLY). SV events were categorized into three types: deletions (i.e., absence of sequence compared to the reference genome), inversions, and duplications. The observed length of SV events ranged from 50 bp (the minimum length threshold) to 500 kb (observed in deletions). In total, we find 1,805,000 SV events in 100 genomes, which were combined into 50,271 distinct events that are present in one or more accessions. The number and coverage of the SV events for each type is given in Table 1. A large number of deletions is observed compared to inversions and duplications. Similar large differences in number of observed SV between types are also reported in a population of cucumber and a few accessions of melon (Sanseverino et al. 2015; Zhang et al. 2015). Despite their large number, deletions in this melon population only cover twice the size of the genomic region covered by duplications and almost three times that of inversions. Most deletions are small in size. More than 65% of the deletions are shorter than 1 kb where only ∼35% and ∼45% of the events are shorter than 1 kb in inversions and duplications, respectively. The size compositions of events per SV type is given in Figure 1.
Table 1.
Basic statistics of SVs found in all 100 melon samples (nonredundant SVs)
| Duplication | Inversion | Deletion | |
|---|---|---|---|
| Number of SVsa | 3,375 | 1,330 | 45,566 |
| Coverage (total length of SV in bp) | 82,650,295 | 66,786,711 | 166,990,885 |
| Averageb number of SV of 100 genomes | 781 | 439 | 16,830 |
| Averageb coverage of 100 genomes (in bp) | 38,218,127 | 47,630,536 | 81,786,636 |
| Averageb coverage of 94 cultivar genomes (in bp) | 39,088,254 | 49,017,849 | 83,569,717 |
| Percentage of SV in genic regions (at least 50% of the gene is covered) | 28.39 | 37.59 | 5.77 |
| Percentage of SV in genic regions (at least 100 bp of SV overlaps) | 49.57 | 52.86 | 28.77 |
| Percentage of SV in Transposons (at least 100 bp of SV overlaps) | 67.38 | 69.32 | 47.77 |
The genome length is 375360399 bp (without chromosome 0).
Nonredundant SV list. An SV can be observed in more than one genome.
Average number of SVs per genome, over 100 genomes.
Figure 1.

Size distribution of SV events per SV type. DUP: duplications; INV: inversions; DEL: deletions.
Distribution of structural variations
To see the patterns of structural variation (SV) along the genome, we performed a correlation analysis of SV types with respect to TEs and genes and to each other (Figure 2). A high proportion of all the SV types (47%–69%) were found to be co-located with TEs (Table 1). In line with this, all SVs showed positive correlation with TEs. While inversions and duplications show a weak correlation (r = 0.1), deletions show a higher correlation (r = 0.4) with TEs. The correlation between deletions and TEs is similar but opposite to the correlation between genes and TEs (r = −0.47). Furthermore, Fuentes et al. (2019) reported that 51.2% of SV’s in the rice population overlap with TEs. A plausible explanation for the correlation between TEs and deletions is that TE insertions in the reference genome were identified as deletions in the studied genome. Additionally, a weak positive correlation of TEs with duplications might be due to the ‘copy and insert’ mechanism of TEs in new positions of the genome.
Figure 2.
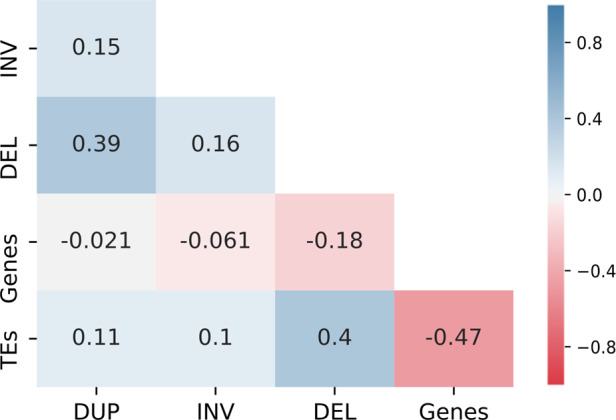
Correlation among SV events, genes and transposons. The Pearson correlation coefficients between pairs are given in cells. DUP, duplications; INV, inversions; DEL, deletions; TEs, transposable elements.
Half of the duplications and inversions partially overlap with genes, whereas only one quarter of deletions partially overlap with genes (Table 1). Despite this high rate of overlap, there is no correlation between duplications or inversions and genes, while there is a weak, negative correlation between deletions and genes (r = −0.18, Figure 2). In other words, inversions and duplications occur more in genic regions than deletions. Even though deletions have the lowest percentage of overlap with genes, since the number of deletions is much higher than other SV types, they affect more genes than inversions or duplications. Deletions affect 8869 genes of which 7821 were completely deleted, while inversions and duplications affected 4841 and 6198 genes, respectively.
We also observed a positive correlation between SV types. In particular, deletions and duplications (r = 0.39) showed a positive correlation. The overlapping sequences between duplications and deletions were 59 Mb (58,952,903 bp), comprising 15.7% of the melon genome. Highly variable regions of the genome are susceptible to more than one SV type. Specifically, we find that 62% of duplicated genes were deleted in either the same or different accessions. When a duplication occurs in one accession and a deletion of the same gene in another accession, this suggests that these genes were favored in some accessions, while in the other accessions the genes are lost or the gene function is compensated for by other genes. A possible explanation of the deletion and the duplication of the same gene on the same accession could be that these regions are hemizygous.
We further visualized the distribution of SV to capture the specific SV patterns in the chromosomes with respect to gene and TE distribution over the melon genome (Figure 3). The genome-wide correlation between deletions and TEs (r = 0.4) can be seen in Figure 3 as they follow a similar pattern. Both deletions and TEs frequently occur in gene depleted regions, a pattern which is most striking on chromosome 6. Although inversions and duplications are sparse and general patterns were hard to deduce by visual inspection, there are some noteworthy regions. Since consistently empty bins, shown as noncolored areas in the x-axis of Figure 3, coincide with assembly gaps (NNs), finding their origin is nontrivial. Nevertheless, there are some large (Mb scale) contiguous empty areas in the SV plots. In chromosome 3 inversions are almost absent from the 9 to 14 Mb region. This region has 162 genes, many TEs and a substantial number of duplications and deletions. Similar to chromosome 3, a low number of inversions were observed on chromosome 10 compared to other chromosomes. Interestingly, chromosome 10 has the lowest recombination rate among the 12 chromosomes when measured in hybrids of agrestis and melo accessions (Argyris et al. 2015; Chang et al. 2017). While genome structure and recombination influence each other, cause and effect are difficult to distinguish. The low number of inversions in low recombination regions seems in contrast with the assumption of inversions blocking recombination; however, it is in line with recombination as a source of SV (see section “Inversions are the result of meiotic recombinations”).
Figure 3.

The distribution of SV elements over melon chromosomes. DUP, duplication (red); INV, inversion (cyan); DEL, deletion (blue). TEs, transposable elements (light blue) and genes (purple) of melon reference genome were added for comparison reasons. The x-axis is Mb scale; the y-axis is the percentage of coverage over bins of 100 kb. On the y-axis, 50 means that 50 kb of the 100 kb in that bin is covered by a given element.
Allele frequency of SV among melon genomes
An SV event is regarded as unique if observed in only one accession. On the contrary, a general SV is observed in all genomes (such an event can also be regarded as unique to the reference genome). The unique SVs build up a large proportion of the total SVs, in particular for inversions (68%) and to a lesser extent also for duplications (30%) and deletions (22%) (Supplementary Figure S1). These SVs are specific to a single genome, conferring a high degree of diversity. Remarkably, the unique SVs originating from six wild species correspond to 30% of unique deletions, 25% of unique duplications, and 15% of inversions. An interesting observation is that a substantial number of unique inversions do not directly originate from wild species. It appears that inversions rather than duplications and deletions are distinctive in cultivars. Duplication and deletion events are more often shared between cultivars, perhaps reflecting breeding efforts carrying advantageous genes (or traits) into other lines.
Diversity in melon accessions based on SV
As SVs are a measure of genetic diversity (like SNPs), they are useful to investigate the evolutionary relationships within wild accessions, melon subspecies, and even melon groups. To analyze these relationships, two sets of phylogenetic trees (or dendrograms) based on SV events in 100 genomes were constructed by using two approaches: clustering and ML. Both approaches were based on the combination of common and unique SVs present in the accessions. The first approach revealed clustering of SV events separating melon accessions into four main subsets (Figure 4 for inversions; Supplementary Figure S2 for duplications) for which SVs form distinct patterns for wild species, melo, agrestis I, and II subsets. Following the clustering of accessions based on SVs, we used a second approach for differentiating the evolutionary (phylogenetic) relations between accessions. A ML tree was constructed not only on each SV type but also on the combined SVs. In the combined tree, the higher number of deletions likely influenced the branching more than the relatively lower number of duplications and inversions. To understand the effect on the tree topology, multiple ML dendrograms based on different SV types were analyzed (Supplementary Figures S3–S5). The observations were based on the tree constructed from combined SVs (Figure 5) and reported when consistent with at least two of the three SV types. As can be seen in the tree, a subset of accessions belonging to ssp. agrestis (agrestis I in Figure 5) is clustered together independent from phenotypic grouping. Interestingly, this branch contains all agrestis accessions found in eastern Asia (China, Japan, and Korea). The remaining agrestis accessions originate from middle-western Asia (India, Pakistan, and Afghanistan) and Africa in line with the suggested independent domestication events (Endl et al. 2018; Gonzalo et al. 2019; Zhao et al. 2019). These are polyphyletic, as they show high diversity within ssp. agrestis. This is in agreement with earlier phylogenetic studies, showing that ssp. agrestis is polyphyletic with accessions clustering by geographic origin (Stepansky et al. 1999; Esteras et al. 2013).
Figure 4.

Clustering of the inversions (top) and melon accessions (right) based on PAV of inversions. The leaves of the cladogram of accessions are color coded based on their species and subspecies; light green: C. melo ssp. melo, dark green: C. melo ssp. agrestis, light blue: C. zeyheri, blue: C. prophetarum, dark blue: C. anguria, rose: C. dipsaceus, pink: C. myriocarpus, and purple: C. ficifolius.
Figure 5.

ML tree based on combined SV events (duplications, inversions, and deletions). Color codes refer to species identity. Blue: ssp. agrestis; green: wild Cucumis species; pink: inodorus; brown: cantalupensis; light green: reticulatus; orange: the rest of ssp. melo (yellow Asia, chandalak, flexuosus, dudaim, ameri, chito, ungrouped ssp. melo).
Recently, Zhao et al. (2019) analyzed more than thousand melon accessions, including cultivars and landraces. In their SNP-based phylogenetic tree wild African agrestis accessions cluster (C. melo var. agrestis) and are sister to the cultivated African accesions (C. melo ssp. agrestis var. tibish). As can be seen in the SV-based tree (Figure 5), indeed the branch with tibish accessions, corresponding to the African group (as these accessions originate from Sudan, Senegal, and Nigeria), cluster together. The tibish subclade is sister to the agrestis II group represented by agrestis accessions predominantly originating from India (e.g., accs. Phoot, Kahkri, Velleri, Budama, Kacheri, Kahrbuza, and Teti). This is in line with Zhao et al (2019), reporting on the unexpected close relationship between African cultivated agrestis accessions with agrestis accessions from India. Furthermore, the momordica accessions from India grouped closely together with cultivated melon accessions in the SNP tree (Zhao et al. 2019). Indeed, we observed some cultivated melo accessions grouping with momordica accessions from India in the SV tree. Interestingly, the agrestis group with Indian accessions, is relatively closely related to six Cucumis species (C. ficipholus, C. zeyhri, C. myriocarpus, C. anguria, C. dipsaceus, and C. prophetarum) all originating from Africa, clearly separating the African/Indian agrestis group from the agrestis I group, containing cultivated agrestis accessions, predominantly originating from China, Japan, and Korea (e.g., accessions OM601, OM602, Ginsen Makuwa, Daejon Charmi, Songwhan Charmi, and Jinpinxiaozibaf). Consistent for the observation of wild and cultivated melo accessions by Zhao et al. (2019), the landraces of ssp. melo such as the flexuosus accessions, ameri CGN24626, and dudaim CUM254, which are wild melo accessions are branching of from the reticulatus, cantalupensis, and inodorus accessions, which are cultivated melo accessions. Both the SV-based tree and the SNP tree from Zhao et al. (2019) show strong geographic separation and the overall topology of distinct groups in both trees is comparable.
The reference genome (DHL92) is grouped with one of its parents, Songwhan Charmi (SC; ssp. agrestis) on one end of the tree. Although the other parental accession (T111, Piel de Sapo ssp. melo) is not included in the SV-based tree (Figure 5), accessions related to T111, cluster with the inodorus clade on the other end of the tree. Previous findings on the comparative analysis of parental lines to the DHL92 genome showed that SC has slightly less SNPs than T111 (Garcia-Mas et al. 2012; Sanseverino et al. 2015). On the other hand, PAV analyses of genes showed that DHL92 is closer to T111 (González et al. 2013). In conclusion, due to lack of T111 in the SV tree, and conflicting evidence from SNP and PAV analysis, we cannot confirm nor deny that DHL92 is closer to one or the other parent.
The wild accessions consistently grouped together; however, the relationship among the accessions could not be deducted as branching was not consistent among the trees (Figures 4 and 5, Supplementary Figures S2–S5). Previously, two studies have also found deviating branching (Garcia-Mas et al. 2004; Renner et al. 2007), probably due to the use of different sets of SV data and different algorithms. Therefore, the topological context of wild species should be considered cautiously. More consistent genomic relationships between these wild species could be obtained using whole genome assemblies.
The C. melo ssp. melo group together except for six accessions, five of which previously have not been assigned to any group. These six accessions currently group with ssp. agrestis [Meloncillo, PI 511890, Kachhri (chito group), Chapera Ki Kacheri, Teti, G22843]. It is likely that the level of mixture in some of these accessions makes it hard to categorize phenotypically. On the other hand, the morphology of G22843 and Kachhri accessions are similar to ssp. agrestis, they have a very small fruit size and green exocarp, suggesting that these accessions are possibly mis-categorized. Moreover, we observed phenotypic similarities between the rest of these ssp. melo accessions and their neighboring ssp. agrestis accessions. This raises suspicion for further mis-categorization of these ssp. melo accessions.
In the study by Sanseverino et al. (2015), the sample PI 124112 groups with ssp. melo, although it is assigned to the momordica group belonging to ssp. agrestis. In our study, accessions PI 124111 and PI 124112 also cluster with ssp. melo together with accession MR-1, a cultivar claimed from the cantalupensis group (bootstrap value 100, Figure 5, Supplementary Figure S6). Since the breeding line MR-1 was derived from PI 124111 (Thomas 1986; Li et al. 2017), it is logical that these lines cluster together. Moreover, PI 124111 and PI 124112 lines are landraces which could explain the location of the branch next to other landraces from ssp. melo and ssp. agrestis. Another accession showing discrepancies with previous studies is accession CUM254 from the dudaim group. This accession clusters with C. melo ssp. melo, in agreement with Sanseverino et al. (2015), but unlike previous studies where an unknown dudaim accession was grouped with ssp. agrestis (Stepansky et al. 1999; Esteras et al. 2013). Although only seven samples were studied in Sanseverino et al. (2015) and care should be taken to make conclusions about the phylogenetic tree position of dudaim, we suggest that the dudaim accession CUM254 is more similar to ssp. melo.
In summary, both phylogenetic trees based on SV types completely resolve cultivar and wild accessions into two monophyletic groups. The two C. melo ssp. agrestis and melo are separately grouped as shown previously by SNP (Esteras et al. 2013) and Inter-SSR (microsatellite) data (Stepansky et al. 1999). Only 6 cultivars out of 94 were misplaced in these two subspecies branches when taking into account their morphology. However, the groups within these branches have not been resolved completely (Figure 5), implying a lack of specific SV events. Alternatively, this could be partially due to outdated classification of groups. As stated in the introduction, it has been proposed to merge the reticulatus and cantalupensis and split the large inodorus into three subgroups (Pitrat 2016). Yet, even if the groups were reclassified based on morphology, we would still expect polyphyletic groups. As melon cultivars have been transported between continents/countries and frequently crossed, a mixed diversity can be expected. This is consistent with the findings of Esteras et al. (2013), showing the mixed population structure of momordica, inodorus landraces, ameri, flexuosus, indian agrestis, and dudaim. Yet, the clustering of commercial groups like cantalupensis and inodorus (Figure 5) suggests a close but distinct relationship.
Validation of SV
We manually verified the paired-read alignment file of each sample to validate the SVs. We randomly selected 50 SVs per SV type (in total 150 SVs) to determine whether there is evidence of SV in the paired-read alignment file, either by looking at discordant read information or read coverage. We find that 93% (139 out of 150) of the SV events were detected correctly. We also observed that 8 of the 11 incorrect events constituted a more complex event, such as overlapping or nested SVs. This is in line with earlier reports on complex SV occurrences in plant genomes (Saxena et al. 2014). Although we acknowledge the existence of complex events, for simplicity we reported all SVs as single SVs even though they might contribute to a complex event.
We observed that 48% (24 out of 50) of the deletion events overlap with assembly gaps (NN regions) of at least 80% of their size. This high rate of overlap between deletions and gaps is not observed between inversions or duplication and gaps. In fact, less than 1% of these events were found to overlap with gaps. Among all deletions observed (n = 1,154,949), only 36% overlap at least 80% of their size with a gap, less than in the 50 randomly selected deletions. These 36% show a similar pattern of allele distribution compared to all deletion events, which suggests that gaps do not bias deletion detection. Since deletion events are correlated with transposons (see section “Distribution of SV”), we argue that these gaps could be unassembled transposons in the reference genome. Due to the difficulty of the assembly of repeat regions, the unassembled repeat regions were filled with NNs to the same size as in the reference genome. Indeed, a recent study revealed young transposons in the melon genome assembly v4.0 in the regions that previously were unassembled (Castanera et al. 2020). Although probable, currently it is not yet clear whether these new young LTR transposons in the genome v4.0 can be assigned to the gaps of the v3.6.1 genome used in this study.
SV diversity in linkage group V
Previous studies showed that linkage group V, which contains resistance genes of melon including the NBS LRR TIR region and the CC NBS LRR protein coding Vat (Virus aphid transmission) locus, exhibits PAV (González et al. 2013; Sanseverino et al. 2015). In this study, we have not only confirmed the PAV genes in the same sample (Songwhan Charmi), we also find PAV in the genes annotated in the recent genome assembly version (Supplementary Table S2). The Vat locus shows either partial or full deletion in most of the samples (94%). The eight samples, having a complete Vat locus, belong to the inodorus (n = 7) and cantaloup (n = 1) group. This region might have originated from a related wild species. Indeed, wide-cross attempts between cultivated and wild Cucumis species, such as C. melo × C. metuliferus and C. metuliferus x C. dipsaceus, resulted in viable offspring (Van Raamsdonk et al. 1989; Chen and Zhou 2011). Also C. melo × C. dipsaceus resulted in fruit induction, although the fruits did not contain seeds. The closest wild species having nearly complete Vat locus genes is C. dipsaceus containing 10 out of 13 genes. C. dipsaceus could possibly be one of the ancestors of this region in melon perhaps via another “bridging species.” Alternatively, there could be other ancestors of this locus that we have not analyzed in this study.
For the NBS LRR TIR region, we observed that the last third of this region is deleted in four of the wild species and partially deleted in C. zeyheri and C. ficifolius. Noting that the beginning of the region is absent in C. zeyheri, we suspect that these two species contributed together to shape the current NBS LRR TIR region. A summary of PAV of the whole linkage region, spanning 1.1 Mb and 104 genes, is given in Supplementary Table S2.
Genes affected by SV events are linked to melon breeding
In our analysis, 17,300 genes with a GO annotation were found to be affected by SV events in 100 melons. To investigate whether genes with the same function are specific for a particular group of melon accessions, we applied GO enrichment analysis for genes affected by SV in three sets of melon accessions belonging to ssp. agrestis, ssp. melo and wild relatives of C. melo. We found 26 overrepresented GO terms related to molecular and biological processes (Supplementary Table S3) linked to genes that are likely targeted for breeding. These GO terms are related to fragrance, fruit ripening, and stress response. In particular, for the fragrance-related GO term, the l-phenylalanine metabolic process is found to be overrepresented in inversions of wild species, compared to cultivar SVs. l-phenylalanine is an aromatic amino acid, and secondary metabolites derived from l-phenylalanine are fragrance and plant defence related. Another GO term, fruit ripening-related pectinesterase inhibitor activity, likewise differentiates wild species from cultivars. It has been found to be overrepresented in deletions and duplications of ssp. melo and ssp. agrestis, but not in wild species. Pectinesterase inhibitors are regulators of pectin esterases which are involved in fruit ripening, thickness of morphology of peel (skin), as well as defense against pathogens (Bethke et al. 2016). Most likely, genes involved in pectin biosynthesis underlying fruit development have been selected for multiple times through different lines of breeding in different locations for particular cultivars, although it seems not specific for all melon subspecies. Beside general functions, we observed different stress response functions specific to melon subspecies. In agrestis duplications we observed enrichment of the wounding response process as well as oxylipin biosynthetic and metabolic processes. Oxylipins are an important class of signaling molecules in plants related to plant stress responses and innate immunity, and we speculate that ssp. agrestis gained resistance genes by duplication events during the breeding process. Additionally, another stress response-related function, calcium-dependent phospholipid binding, is found enriched in melo duplications. This function is associated with the annexin class of genes in duplications, which is differentially regulated by calcium changes induced by abiotic stress (Cantero et al. 2006). Given that the melon genome has relatively few resistance genes compared to other plant species (Garcia-Mas et al. 2012), it is not surprising that melon breeding resulted in an increase of stress response or resistance related genes via duplication events. We also see the effect of different domestication paths during melon breeding on the expansion of different sets of stress response genes as in two subspecies of melon.
Similar findings were reported for genes affected by SV in ssp. agrestis and melo by Sanseverino et al. (2015). Their study also finds genes associated with agronomically relevant pathways including disease resistance, aroma volatiles metabolism, sugar metabolism, and more. Together with results reported here, these findings shed more light on the selective breeding history that shaped today’s melon.
Inversions as a result of meiotic crossovers
Meiotic recombination can result in various SV types, including inversions (Gaut et al. 2007). It should therefore be possible to find the origin of SV from the breakpoint features. To this end, we searched for sequence motifs in the regions flanking the breakpoints of inversions whose size is more than 1 kb (n = 855). We observed a 29-bp long poly A/T motif present in 1000 out of 1710 sequences, with an E-value of 8.4e−10. The observation of similar poly A/T stretches (Figure 6), at meiotic recombination breakpoints in relatively gene-rich euchromatic regions of tomato and Arabidopsis (Wijnker et al. 2013; Demirci et al. 2017) suggests that inversions are mostly the result of meiotic recombination events in melon as well. Although heterochromatic regions that are known to have a low recombination rate also can show high rates of rearrangements such as observed in Arabidopsis and wheat (Hall 2006; Lysak et al. 2006; See et al. 2006), the rearrangement dynamics in heterochromatic regions is quite different, as in general natural selection is inefficient and less deleterious (Gaut et al. 2007), allowing for more uncompromised accumulation of rearrangements over time, while rearrangements in euchromatin swept through generations. Thus, our results for melon are consistent with the view that recombination is the major driving force for inversions in plants and possibly in all eukaryotes (Demirci et al. 2017).
Figure 6.
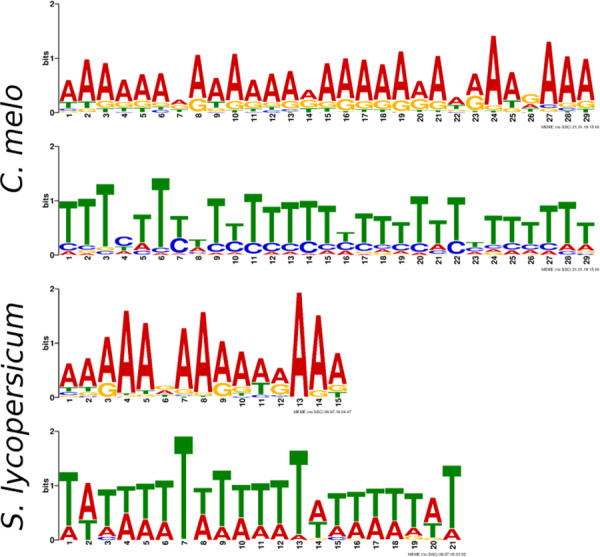
Sequence motifs around the inversion breakpoints (Cucumis melo) and crossover breakpoints (Solanum lycopersicum). Note: the two C. melo motifs are each other’s reverse complement.
Conclusions
In this study, we investigated the evolutionary history of melon breeding from a SV point of view. We presented a broad range of SVs in 100 melon genomes, ranging from 50 bp up to 100 kb, which gives an idea of how collinear these genomes are for a region of interest as well as over the whole genome. By analyzing the SVs among the cultivated melon and wild melon relatives, we shed light on the phylogenetic relation between melon accessions. We showed that the resistance genes in the linkage V region are expanded in the cultivar genomes compared to wild relatives. We also found that particular agronomic traits are specifically selected in the melon subspecies such as fruit ripening, fragrance, and stress response. The findings reported here can help us to understand the selective breeding history through backward deductive analysis of events that shaped today’s melon. Furthermore, we provide an inventory of SVs which can be used to shape future melon breeding strategies.
Acknowledgments
We thank Hortigenetics Research (S.E. Asia) Limited, Rijk Zwaan Zaadteelt en Zaadhandel B.V., Nunhems Netherlands B.V., Vilmorin & Cie for providing materials, Keygene N.V. for sequencing, Bas te Lintel Hekkert for sequencing, and Henri van de Geest for QC and bioinformatics support.
S.P. conceived the idea. E.S., T.H., and S.A. performed sequencing, QC, and data analyses. S.A. provided supporting phylogenetic analysis. W.v.D. identified and classified the melon accessions. R.R.F. identified the structural variations from read alignments. S.D. analyzed the structural variations. S.D., S.P., and A.D.J.v.D. interpreted the results. S.D., A.D.J.v.D., D.d.R., and S.P. wrote the manuscript.
Funding
S.D. was supported by the EU FP7 COMREC Marie Curie Initial Training Networks program project number 606956. This project was financed by the Topsector Horticulture and Propagation Materials project 100 Melon Genome Project (https://topsectortu.nl/nl/100-meloen-genoom-project) project number 1310-034.
Conflicts of interest: The authors declare that there is no conflict of interest.
Literature cited
- Argyris JM, Ruiz-Herrera A, Madriz-Masis P, Sanseverino W, Morata J, et al. 2015. Use of targeted SNP selection for an improved anchoring of the melon (Cucumis melo L.) scaffold genome assembly. BMC Genomics 16:4. [DOI] [PMC free article] [PubMed] [Google Scholar]
- Bailey TL, Boden M, Buske FA, Frith M, Grant CE, et al. 2009. MEME SUITE: tools for motif discovery and searching. Nucleic Acids Res. 37:W202–W208. [DOI] [PMC free article] [PubMed] [Google Scholar]
- Bauer S, Grossmann S, Vingron M, Robinson PN.. 2008. Ontologizer 2.0—a multifunctional tool for GO term enrichment analysis and data exploration. Bioinformatics. 24:1650–1651. [DOI] [PubMed] [Google Scholar]
- Benjamini Y, Hochberg Y.. 1995. Controlling the false discovery rate: a practical and powerful approach to multiple testing. J R Stat Soc Ser B. 57:289–300. [Google Scholar]
- Bethke G, Thao A, Xiong G, Li B, Soltis NE, et al. 2016. Pectin biosynthesis is critical for cell wall integrity and immunity in Arabidopsis thaliana. Plant Cell. 28:537–556. [DOI] [PMC free article] [PubMed] [Google Scholar]
- Bolger AM, Lohse M, Usadel B.. 2014. Trimmomatic: a flexible trimmer for Illumina sequence data. Bioinformatics. 30:2114–2120. [DOI] [PMC free article] [PubMed] [Google Scholar]
- Cantero A, Barthakur S, Bushart TJ, Chou S, Morgan RO, et al. 2006. Expression profiling of the Arabidopsis annexin gene family during germination, de-etiolation and abiotic stress. Plant Physiol Biochem. 44:13–24. [DOI] [PubMed] [Google Scholar]
- Castanera R, Ruggieri V, Pujol M, Garcia-Mas J, Casacuberta JM.. 2020. An improved melon reference genome with single-molecule sequencing uncovers a recent burst of transposable elements with potential impact on genes. Front Plant Sci. 10:1–10. [DOI] [PMC free article] [PubMed] [Google Scholar]
- Chang C-W, Wang Y-H, Tung C-W.. 2017. Genome-wide single nucleotide polymorphism discovery and the construction of a high-density genetic map for melon (Cucumis melo L.) using genotyping-by-sequencing. Front Plant Sci. 8:00125. [DOI] [PMC free article] [PubMed] [Google Scholar]
- Chen J, Zhou X.. 2011. Cucumis. In: Kole C, editor. Wild Crop Relatives: Genomic and Breeding Resources. Berlin, Heidelberg: Springer. p. 67–90. [Google Scholar]
- Demirci S, van Dijk ADJ, Sanchez Perez G, Aflitos SA, de Ridder D, et al. 2017. Distribution, position and genomic characteristics of crossovers in tomato recombinant inbred lines derived from an interspecific cross between Solanum lycopersicum and Solanum pimpinellifolium. Plant J. 89:554–564. [DOI] [PubMed] [Google Scholar]
- Endl J, Achigan-Dako EG, Pandey AK, Monforte AJ, Pico B, et al. 2018. Repeated domestication of melon (Cucumis melo) in Africa and Asia and a new close relative from India. Am J Bot. 105:1662–1671. [DOI] [PubMed] [Google Scholar]
- Esteras C, Formisano G, Roig C, Díaz A, Blanca J, et al. 2013. SNP genotyping in melons: genetic variation, population structure, and linkage disequilibrium. Theor Appl Genet. 126:1285–1303. [DOI] [PubMed] [Google Scholar]
- Fuentes RR, Chebotarov D, Duitama J, Smith S, De la Hoz JF, et al. 2019. Structural variants in 3000 rice genomes. Genome Res. 29:870–880. [DOI] [PMC free article] [PubMed] [Google Scholar]
- Garcia-Mas J, Benjak A, Sanseverino W, Bourgeois M, Mir G, et al. 2012. The genome of melon (Cucumis melo L.). Proc Natl Acad Sci USA. 109:11872–11877. [DOI] [PMC free article] [PubMed] [Google Scholar]
- Garcia-Mas J, Monforte AJ, Arús P.. 2004. Phylogenetic relationships among Cucumis species based on the ribosomal internal transcribed spacer sequence and microsatellite markers. Plant Syst Evol. 248:191–203. [Google Scholar]
- Gaut BS, Wright SI, Rizzon C, Dvorak J, Anderson LK.. 2007. Recombination: an underappreciated factor in the evolution of plant genomes. Nat Rev Genet. 8:77–84. [DOI] [PubMed] [Google Scholar]
- González VM, Aventín N, Centeno E, Puigdomènech P.. 2013. High presence/absence gene variability in defense-related gene clusters of Cucumis melo. BMC Genomics. 14: 782. [DOI] [PMC free article] [PubMed] [Google Scholar]
- Gonzalo MJ, Díaz A, Dhillon NPS, Reddy UK, Picó B, et al. 2019. Re-evaluation of the role of Indian germplasm as center of melon diversification based on genotyping-by-sequencing analysis. BMC Genomics. 20:1–13. [DOI] [PMC free article] [PubMed] [Google Scholar]
- Grossmann S, Bauer S, Robinson PN, Vingron M.. 2007. Improved detection of overrepresentation of Gene-Ontology annotations with parent child analysis. Bioinformatics. 23:3024–3031. [DOI] [PubMed] [Google Scholar]
- Guiu-Aragonés C, Monforte AJ, Saladié M, Corrêa RX, Garcia-Mas J, et al. 2014. The complex resistance to cucumber mosaic cucumovirus (CMV) in the melon accession PI161375 is governed by one gene and at least two quantitative trait loci. Mol Breeding. 34:351–362. [Google Scholar]
- Hall AE. 2006. Dynamic evolution at pericentromeres. Genome Res. 16:355–364. [DOI] [PMC free article] [PubMed] [Google Scholar]
- Huang S, Li R, Zhang Z, Li L, Gu X, et al. 2009. The genome of the cucumber, Cucumis sativus L. Nat Genet. 41:1275–1281. [DOI] [PubMed] [Google Scholar]
- Joobeur T, King JJ, Nolin SJ, Thomas CE, Dean RA.. 2004. The Fusarium wilt resistance locus Fom-2 of melon contains a single resistance gene with complex features. Plant J. 39:283–297. [DOI] [PubMed] [Google Scholar]
- Kosugi S, Momozawa Y, Liu X, Terao C, Kubo M, et al. 2019. Comprehensive evaluation of structural variation detection algorithms for whole genome sequencing. Genome Biol. 20:8–11. [DOI] [PMC free article] [PubMed] [Google Scholar]
- Kumar S, Stecher G, Li M, Knyaz C, Tamura K.. 2018. MEGA X: molecular evolutionary genetics analysis across computing platforms. Mol Biol Evol. 35:1547–1549. [DOI] [PMC free article] [PubMed] [Google Scholar]
- Layer RM, Chiang C, Quinlan AR, Hall IM.. 2014. LUMPY: a probabilistic framework for structural variant discovery. Genome Biol 15:R84. [DOI] [PMC free article] [PubMed] [Google Scholar]
- Li D, Cuevas HE, Yang L, Li Y, Garcia-Mas J, et al. 2011. Syntenic relationships between cucumber (Cucumis sativus L.) and melon (C. melo L.) chromosomes as revealed by comparative genetic mapping. BMC Genomics. 12:396. [DOI] [PMC free article] [PubMed] [Google Scholar]
- Li B, Zhao Y, Zhu Q, Zhang Z, Fan C, et al. 2017. Mapping of powdery mildew resistance genes in melon (Cucumis melo L.) by bulked segregant analysis. Sci Hortic. 220:160–167. [Google Scholar]
- Li H, Durbin R.. 2009. Fast and accurate short read alignment with Burrows-Wheeler transform. Bioinformatics. 25:1754–1760. [DOI] [PMC free article] [PubMed] [Google Scholar]
- Lysak MA, Berr A, Pecinka A, Schmidt R, McBreen K, et al. 2006. Mechanisms of chromosome number reduction in Arabidopsis thaliana and related Brassicaceae species. Proc Natl Acad Sci USA. 103:5224–5229. [DOI] [PMC free article] [PubMed] [Google Scholar]
- Martin M. 2011. Cutadapt removes adapter sequences from high-throughput sequencing reads. EMBnet J. 17:10. [Google Scholar]
- Moore RM, Harrison AO, McAllister SM, Polson SW, Wommack KE.. 2020. Iroki: automatic customization and visualization of phylogenetic trees. Peer J. 8:e8584. [DOI] [PMC free article] [PubMed] [Google Scholar]
- Palomares-Ríus FJ, Garcés-Claver A.. 2016. Detection of two QTLS associated to Cucurbit yellow stunting disorder virus in the TGR 1551 melon line. In: Kozik EU, Paris HS, Gómez-Guillamón ML, editors. Cucurbitaceae 2016, XIth Eucarpia Meeting on Genetics and Breeding of Cucurbitaceae, July 24–28, 2016. Warsaw, Poland. p. 334–337. [Google Scholar]
- Pitrat M. 2008. Melon. In: Prohens J, Nuez F, editors. Vegetables I. Handbook of Plant Breeding, vol. 1. New York: Springer. p. 283–315. [Google Scholar]
- Pitrat M. 2016. Melon genetic resources: phenotypic diversity and horticultural taxonomy. In: Grumet R, Katzir N, Garcia-Mas J, editors. Genetics and Genomics of Cucurbitaceae. Cham: Springer, p. 25–60. [Google Scholar]
- Quinlan AR, Hall IM.. 2010. BEDTools: a flexible suite of utilities for comparing genomic features. Bioinformatics. 26:841–842. [DOI] [PMC free article] [PubMed] [Google Scholar]
- Rausch T, Zichner T, Schlattl A, Stutz AM, Benes V, et al. 2012. DELLY: structural variant discovery by integrated paired-end and split-read analysis. Bioinformatics. 28:i333–i339. [DOI] [PMC free article] [PubMed] [Google Scholar]
- Renner SS, Schaefer H, Kocyan A.. 2007. Phylogenetics of Cucumis (Cucurbitaceae): cucumber (C. sativus) belongs in an Asian/Australian clade far from melon (C. melo). BMC Evol Biol. 7:58. [DOI] [PMC free article] [PubMed] [Google Scholar]
- Robinson JT, Thorvaldsdóttir H, Winckler W, Guttman M, Lander ES, et al. 2011. Integrative genomics viewer. Nat Biotechnol. 29:24–26. [DOI] [PMC free article] [PubMed] [Google Scholar]
- Ruggieri V, Alexiou KG, Morata J, Argyris J, Pujol M, et al. 2018. An improved assembly and annotation of the melon (Cucumis melo L.) reference genome. Sci Rep. 8:1–9. [DOI] [PMC free article] [PubMed] [Google Scholar]
- Sanseverino W, Hénaff E, Vives C, Pinosio S, Burgos-Paz W, et al. 2015. Transposon insertions, structural variations, and SNPs contribute to the evolution of the melon genome. Mol Biol Evol. 32:2760–2774. [DOI] [PubMed] [Google Scholar]
- Saxena RK, Edwards D, Varshney RK.. 2014. Structural variations in plant genomes. Briefings Funct. Genomics Proteomics. 13:c. 296. [DOI] [PMC free article] [PubMed] [Google Scholar]
- Sebastian P, Schaefer H, Telford IRH, Renner SS.. 2010. Cucumber (Cucumis sativus) and melon (C. melo) have numerous wild relatives in Asia and Australia, and the sister species of melon is from Australia. Proc Natl Acad Sci USA. 107:14269–14273. [DOI] [PMC free article] [PubMed] [Google Scholar]
- See DR, Brooks S, Nelson JC, Brown-Guedira G, Friebe B, et al. 2006. Gene evolution at the ends of wheat chromosomes. Proc Natl Acad Sci USA 103:4162–4167. [DOI] [PMC free article] [PubMed] [Google Scholar]
- Smith SD, Kawash JK, Grigoriev A.. 2017. Lightning-fast genome variant detection with GROM. Gigascience 6. [DOI] [PMC free article] [PubMed] [Google Scholar]
- Stamatakis A. 2014. RAxML version 8: a tool for phylogenetic analysis and post-analysis of large phylogenies. Bioinformatics. 30:1312–1313. [DOI] [PMC free article] [PubMed] [Google Scholar]
- Stepansky A, Kovalski I, Perl-Treves R.. 1999. Plant systematics and evolution intraspecific classifcation of melons (Cucumis melo L.) in view of their phenotypic and molecular variation. Plant Syst Evol. 217:313–332. [Google Scholar]
- Supek F, Bošnjak M, Škunca N, Šmuc T.. 2011. REVIGO summarizes and visualizes long lists of gene ontology terms. PLoS One 6:e21800. [DOI] [PMC free article] [PubMed] [Google Scholar]
- Tezuka T, Waki K, Yashiro K, Kuzuya M, Ishikawa T, et al. 2009. Construction of a linkage map and identification of DNA markers linked to Fom-1, a gene conferring resistance to Fusarium oxysporum f.sp. melonis race 2 in melon. Euphytica. 168:177–188. [Google Scholar]
- Thomas CE. 1986. Downy and powdery mildew resistant muskmelon breeding line MR-1. Hortic Sci. 21:329. [Google Scholar]
- Van Raamsdonk LWD, den Nijs APM, Jongerius MC.. 1989. Meiotic analyses of Cucumis hybrids and an evolutionary evaluation of the genus Cucumis (Cucurbitaceae). Plant Syst Evol. 163:133–146. [Google Scholar]
- Waskom M, Botvinnik O, O’Kane D, Hobson P, Lukauskas S, et al. 2017. mwaskom/seaborn: v0.8.1, September 2017. 10.5281/zenodo.883859 [DOI]
- Wijnker E, Velikkakam James G, Ding J, Becker F, Klasen JR, et al. 2013. The genomic landscape of meiotic crossovers and gene conversions in Arabidopsis thaliana. Elife. 2:e01426. [DOI] [PMC free article] [PubMed] [Google Scholar]
- Woodhouse MR, Schnable JC, Pedersen BS, Lyons E, Lisch D, et al. 2010. Following tetraploidy in maize, a short deletion mechanism removed genes preferentially from one of the two homeologs. PLoS Biol. 8:e1000409. [DOI] [PMC free article] [PubMed] [Google Scholar]
- Ye K, Schulz MH, Long Q, Apweiler R, Ning Z.. 2009. Pindel: a pattern growth approach to detect break points of large deletions and medium sized insertions from paired-end short reads. Bioinformatics. 25:2865–2871. [DOI] [PMC free article] [PubMed] [Google Scholar]
- Zhang Z, Mao L, Chen H, Bu F, Li G, et al. 2015. Genome-wide mapping of structural variations reveals a copy number variant that determines reproductive morphology in cucumber. Plant Cell. 27:1595–1604. [DOI] [PMC free article] [PubMed] [Google Scholar]
- Zhao G, Lian Q, Zhang Z, Fu Q, He Y, et al. 2019. A comprehensive genome variation map of melon identifies multiple domestication events and loci influencing agronomic traits. Nat Genet. 51:1607–1615. [DOI] [PubMed] [Google Scholar]
Associated Data
This section collects any data citations, data availability statements, or supplementary materials included in this article.
Data Availability Statement
The sequences generated during the current study are available in the European Nucleotide Archive repository, https://www.ebi.ac.uk under study PRJEB37978. Supplementary Figure S1 contains allele frequency counts for duplications, inversions, and deletions. Supplementary Figure S2 contains clustering of the duplications and melon accessions based on presence/absence of duplications. Supplementary Figures S3–S5 contain ML trees based on duplications, inversions, and deletions, respectively. Supplementary Figure S6 contains a ML tree with bootstrap values based on combined SV events. Supplementary Table S1 contains the details of accessions used in this study including country of origin, accession number, common name and groups, and subspecies they belong to. Supplementary Table S2 contains the PAV of 104 genes in linkage group V in 100 melon accessions. Supplementary Table S3 contains the overrepresented GO terms in genes overlapping with SV.
Supplemental material available at fighsare DOI: https://doi.org/10.25387/g3.13312088.