

Summary
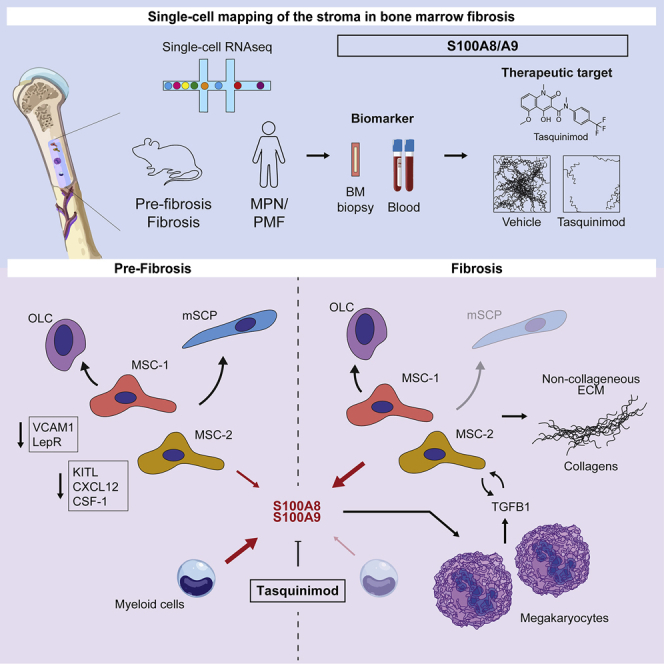
Functional contributions of individual cellular components of the bone-marrow microenvironment to myelofibrosis (MF) in patients with myeloproliferative neoplasms (MPNs) are incompletely understood. We aimed to generate a comprehensive map of the stroma in MPNs/MFs on a single-cell level in murine models and patient samples. Our analysis revealed two distinct mesenchymal stromal cell (MSC) subsets as pro-fibrotic cells. MSCs were functionally reprogrammed in a stage-dependent manner with loss of their progenitor status and initiation of differentiation in the pre-fibrotic and acquisition of a pro-fibrotic and inflammatory phenotype in the fibrotic stage. The expression of the alarmin complex S100A8/S100A9 in MSC marked disease progression toward the fibrotic phase in murine models and in patient stroma and plasma. Tasquinimod, a small-molecule inhibiting S100A8/S100A9 signaling, significantly ameliorated the MPN phenotype and fibrosis in JAK2V617F-mutated murine models, highlighting that S100A8/S100A9 is an attractive therapeutic target in MPNs.
Keywords: hematopoietic stem cells, mesenchymal stromal cells, bone marrow fibrosis, microenvironment, single cell RNA sequencing, myeloproliferative neoplasms, biomarker, alarmins, DAMP, drug target
Graphical abstract
Highlights
-
•
Mesenchymal progenitor cells are fibrosis-driving cells in the bone marrow
-
•
Inflammation in the stroma characterizes pre-fibrosis and TGF-β signaling fibrosis
-
•
Stromal S100A8/S100A9 marks disease progression in MPN patients
-
•
Tasquinimod, inhibiting S100A8/S100A9 signaling, ameliorates the MPN phenotype
Leimkühler and colleagues demonstrate that mesenchymal stromal progenitor cells are fibrosis-driving cells in mice and patients, that inflammation in the bone-marrow stroma precedes TGF-β signaling-driven fibrosis, and that the alarmin heterocomplex S100A8/S100A9 holds promise as MPN progression marker and therapeutic target.
Introduction
Bone-marrow (BM) fibrosis is characterized by continuous replacement of blood-forming cells in the BM by excessive scar tissue. Primary myelofibrosis (PMF) is the prototypic example of progressive development of BM fibrosis. The hallmark feature of overt PMF is the excess deposition of extracellular matrix (ECM), which is accompanied by a progressive loss of hematopoiesis and splenomegaly due to extramedullary hematopoiesis. Although the molecular alterations in hematopoietic cells, which drive the development of myeloproliferative neoplasms (MPNs) have been largely defined (Vainchenker et al., 2011; Rampal et al., 2014), reactive cellular alterations in the non-hematopoietic compartment remain rather obscure. The BM morphology in patients with PMF suggests that there is a stepwise evolution from an initial pre-fibrotic phase to a fibrotic phase with marked reticulin/collagen fibrosis. However, the initial changes and sequential events underlying the pre-fibrotic phase of the disease are not well characterized (Barbui et al., 2018).
The plethora of stromal cells in a normal hematopoietic stem cell (HSC) niche (Baryawno et al., 2019; Tikhonova et al., 2019) suggests that different stromal subtypes have distinct roles not only in normal hematopoiesis but also in BM fibrosis. In solid organ fibrosis, mesenchymal stromal cells (MSCs) are thought to be a major cellular source for fibrosis-driving cells (El Agha et al., 2017). These findings are mainly derived from genetic fate tracing experiments, which allow us to study the cell fate in response to a pathological stimulus. The well-accepted hypothesis in solid organ fibrosis is that fibrosis-inducing insults, e.g., pro-inflammatory and pro-fibrotic cytokines, affect MSCs and lead to a fate switch toward myofibroblasts, which, in turn, drive fibrosis by depositing ECM. In the BM, we and others demonstrated that MSCs contribute to fibrosis-driving Gli1+ myofibroblasts (Decker et al., 2017; Schneider et al., 2017), but it remains an open question whether they are the only source of fibrosis-driving cells in the BM microenvironment or whether other cell types of the non-hematopoietic BM niche contribute to the fibrotic transformation. Here, we explored the cellular composition of the murine and human BM stroma by specifically profiling purified non-hematopoietic BM cells by scRNA sequencing (scRNA-seq) to identify fibrosis-driving cells and underlying mechanisms in MPNs using an unbiased approach.
Results
Single-cell RNA-Seq of the BM niche captures eight major non-hematopoietic cell populations
To dissect the cellular composition and transcriptional changes of the murine BM stroma in the progression of BM fibrosis, we profiled non-hematopoietic BM cells by scRNA-seq in ThPO-induced BM fibrosis (Schneider et al., 2017). We analyzed (1) initial changes (pre-fibrotic stage) and (2) progression of BM fibrosis (fibrotic stage). Mice in the “pre-fibrotic” stage showed features of myeloproliferation and dysmorphic megakaryocytes but no reticulin fibers (reticulin grade 0, Figure 1A). In the fibrotic stage, mice developed severe BM fibrosis (Figure 1A). The hemoglobin (Hb) levels significantly decreased in ThPO-overexpressing mice as a surrogate marker for progression of BM fibrosis (Figure 1B). Mice exhibited significant thrombocytosis, when transplanted with ThPO-overexpressing HSPCs (Figure 1B), recapitulating the peripheral myeloproliferative phenotype observed in patients. We purified stromal cells from murine BMs at the pre-fibrotic time point and also the late, fibrotic time point (Table S1).
Figure 1.

Identification of eight distinct non-hematopoietic cell populations
(A) HSPCs transduced with either thrombopoietin (ThPO) cDNA or control cDNA (EV) were transplanted (tx) at 0 weeks; n = 4 mice per time point and condition. Endpoint: 5 weeks (pre-fibrosis) and 10 weeks (fibrosis). Representative HE and reticulin staining. Scale bar, 50 μm.
(B) Hemoglobin (Hb) and platelet counts over time (mean ± SEM). Two-way-ANOVA with post hoc pairwise t test was used.
(C) UMAP of the non-hematopoietic BM niche identified by unsupervised clustering (n = 2,294 cells).
(D) Average gene expression of top marker genes within major cell populations (left panel). Feature plot of top markers in UMAP (right panel) is shown. Wilcoxon rank-sum test, p < 0.01). A full list of marker genes and corresponding GO terms is in Table S2.
(E) Heatmap of different MSC marker genes. Wilcoxon rank-sum test, p < 0.01.
(F) Venn diagram of the four identified MSC populations. Shared markers are highlighted in intersections.
(G) Heatmap SCP marker genes. Wilcoxon rank-sum test, p < 0.01.
Unsupervised clustering of only non-hematopoietic niche cells identified eight distinct subclusters, which were grouped into four major cell populations (Figure 1C). The most dominant cluster was characterized by high expression of Leptin receptor (Lepr), platelet-derived growth factor receptor α (Pdgfra), and vascular cellular adhesion molecule 1 (Vcam1) as well as high levels of hematopoiesis supporting factors like Cxcl12, Kit ligand (Kitl), and angiopoietin (Angpt1), and was thus classified as MSCs (Figure 1D). The other clusters were identified as osteolineage cells (OLCs; Bglap, Sp7, Alpl), arterial cells/adventitial fibroblasts (ACs; Cd34, Ly6a, Ly6c1), and Schwann cell progenitors (SCPs; Mog, Mal, Plp1; Figures 1C and 1D).
Within the Lepr+ fraction, four subpopulations of MSCs were identified, in line with recent reports (Baryawno et al., 2019; Tikhonova et al., 2019). The dominant cluster exhibited an adipogenic signature with high levels of Matrix Gla protein (Mgp) and Adiponectin (Adipoq, Figure S1B) as well as a strong expression of hematopoiesis supporting genes (e.g., Cxcl12, Kitl; referred to as MSC-1; adipogenic MSCs; Figures 1C and 1E). The second MSC subcluster was characterized by an osteogenic expression pattern (Spp1, Wif1, Ibsp, Sp7, Bglap; MSC-2; osteogenic MSCs; Figures 1C and 1E). In the third cluster (MSC-3), high transcript levels of genes involved in chromatin remodeling and RNA processing indicated that these cells are in a transition state between different functional states of MSCs (Wu et al., 2017; Figure S1D). Gene set enrichment analysis of cluster 4 (MSC-4) revealed that these cells are strongly primed by a response to type 1 and type 2 interferons (Figure 1E; Figure S1D). Comparison of the identified MSC marker genes between the different subpopulations and their respective aggregate gene expression analysis confirmed four distinct MSC populations (Figure 1F; Figure S1E).
We further identified two distinct populations characterized by a Schwann cell precursor (SCP) signature (Figure 1G) indicated by Cdh19 expression (SCPs; Figure S1C): non-myelinating SCPs (nmSCPs) and myelinating SCPs (mSCPs; Figure 1G).
Increased frequency of MSCs and glial cells in BM fibrosis
All identified cell clusters were present in fibrosis and control, but significant changes in cellular compositions of particular clusters were detected (Figure 2A). In fibrosis, MSC-1 and OLCs significantly increased in their frequency, while MSC-3 and -4 significantly decreased (Figure 2A, right panel). Interestingly, mSCPs depicted the most drastic cell expansion in fibrosis. SCPs are cells with high regenerative potential and their contribution to HSC maintenance was recently demonstrated (Yamazaki et al., 2011). Potentially, mSCPs expand in response to the myeloproliferative stimulus in MPNs as a regenerative mechanism.
Figure 2.

Mesenchymal stromal cells −1 and −2 represent the fibrosis-driving cells in ThPO-induced bone-marrow fibrosis
(A) Left panel: UMAP of non-hematopoietic cells from mice transplanted with thrombopoietin (ThPO; blue) or empty vector (EV; red; 5 and 10 weeks). Right panel: bar plot of cells per cluster (ThPO versus EV). Normalization to overall number of input per condition is shown. Fisher’s exact test with Bonferroni correction was used.
(B) Ridgeline plot comparing expression of NABA matrisome-associated gene sets (ThPO; blue versus control EV; red) condition. Competitive gene set enrichment analysis was used.
(C) Normalized differential gene expression (ThPO versus EV) of indicated genes in MSCs (Wilcoxon rank-sum test, two tailed).
(D) Overlap of the non-hematopoietic compartment and FACS Gli1+ cells in UMAP space.
Two distinct subpopulations of MSC are functionally reprogrammed in BM fibrosis to ECM-secreting cells
ECM production is considered the key feature of fibrosis (Friedman et al., 2013). We therefore asked which cells show the most significant expression of ECM specific genes in order to identify cells that drive BM fibrosis, so called myofibroblasts. We dissected the expression of gene sets defined for matrisome-associated genes among the different clusters (Naba et al., 2016). In particular, MSCs, OLCs, and ACs showed the highest expression of ECM in fibrosis (Figure 2B) (Naba et al., 2016). Importantly, only MSC-1 and MSC-2 showed a significant upregulation of ECM proteins in BM fibrosis, indicating that these two populations are the cellular drivers of the fibrotic progression and acquire myofibroblast characteristics. The most significantly de-regulated genes in MSCs were grouped into (1) downregulated genes and (2) upregulated genes with onset of the MPN phenotype (Figures 2C; Figure S2A). The downregulated genes comprised (1) MSC markers (Vcam, Lepr, Adipoq) and (2) hematopoiesis support (Kitl, Il7, Igf1, Cxcl12, Csf1, Bmp4). The upregulated genes were defined through four major biological processes: (1) secreted factors (S100a8, S100a9, Pdgfa), (2) osteogenesis (Mgp, Fndc1), (3) neoangiogenesis (Vegfa, C3), and (4) ECM synthesis (Col8a1, Col1a1).
As MSC-1 and -2 by gene expression seemed to be the most primitive MSCs and fibrosis-driving cells, we wondered whether they can be discriminated by surface markers from MSC-3 and -4. We isolated MSC-1 and -2 (Pdgfra/b+, Vcam1+, CD63+, Lamp1+) and MSC-3 and -4 (Pdgfra/b+, Vcam1+, CD63–, and Lamp1–) by fluorescence-activated cell sorting (FACS) for subsequent functional testing (Figures S2B and S2C). MSC-1 and -2 formed significantly more colony-forming units fibroblast (CFU-F) and had a higher cell-division rate, as compared to MSC-3 and MSC-4, highlighting their progenitor status (Figures S2D and S2E). Importantly, they were also more sensitive to pro-fibrotic transforming growth factor (TGF)-β stimulation in vitro as indicated by higher upregulation of Col1a1 and Acta2 mRNA as compared to MSC-3 and -4 (Figure S2F). In the context of differentiation into fibrosis-driving ɑ-SMA and Col1a1 expressing cells, MSC-1 and -2 strikingly downregulated Cxcl12, supporting our finding that these cells lose their hematopoiesis support during myofibroblast differentiation. Quantification of the frequency of MSC-1 and -2 in ThPO-induced BM fibrosis further supported the finding that these progenitor subsets are expanded in fibrosis while MSC-3 and -4 were decreased in their frequency (Figure S2G), in line with the data on the single-cell level (cf. Figure 2A).
Gli1+ cells comprise fibrosis-driving MSC-1 and -2 and Schwann cell precursors
Surprisingly, SCPs and mSCPs, which most drastically expanded in fibrosis, only revealed minor transcriptomic changes in ThPO versus EV conditions. However, mSCPs were characterized by high and specific expression of Interleukin-33 (Il-33) and Prostaglandin D2 synthase (Ptgds), implied to play central roles in solid organ fibrosis (Ito et al., 2012; Kotsiou et al., 2018) (Figure S2H). Previously, we demonstrated that Gli1+ cells are fibrosis-driving cells in the BM. To reliably label Gli1+ cellular subsets of the BM niche, we used Gli1CreER;tdTomato reporter mice (Schneider et al., 2017) for FACS-based purification for scRNA-seq. We integrated the data with stromal cells derived from the negative selection approach (Figure 2D; cf. Figure 1C; Table S1). Interestingly, Gli1+ cells are mostly MSCs, comparable to LepR+ cells but particularly annotated as MSC-1 (41%) and -2 (19%), the fibrosis-driving cells, explaining our previous finding that genetic ablation of these cells ameliorates BM fibrosis (Schneider et al., 2017). Gli1+ cells are also represented in the mSCP cluster (26%), in line with MSC being derived from neural crest and comparable to the Nestin+ population, which also contains SCPs (Isern et al., 2014).
MSCs are functionally reprogrammed in pre-fibrosis and acquire a secretory, fibrotic, and osteogenic phenotype in manifest fibrosis
Next, we asked which cellular composition and transcriptional changes are characteristic for niche cells in the stepwise evolution of BM fibrosis (Figures 3A and 3B). Fibrosis-inducing MSC-1, both SCP populations and OLCs expanded in the pre-fibrotic phase while all other MSC populations decreased. In manifest fibrosis, IL33-expressing mSCPs, OLCs, and ACs expanded (cf. Figure 1A). To understand overall transcriptional changes across the different populations in pre-fibrosis and fibrosis, we performed differential expression analysis. All MSC clusters (MSC-1 to -4) showed mostly downregulated genes in pre-fibrosis compared to control (Figure 3C; Figure S3A) while none of the other niche cell types showed transcriptional changes, neither in pre-fibrosis nor in fibrosis (Figures S3B and S3C).
Figure 3.

Mesenchymal stromal cells −1 and −2 are reprogrammed in pre-fibrosis and acquire a pro-fibrotic phenotype in fibrosis
(A) UMAP of non-hematopoietic single cells in pre-fibrosis (5 weeks; red) and fibrosis (10 weeks; blue).
(B) Bar plot of cells per cluster in ThPO versus EV after normalization to input per condition. Fisher’s exact test with Bonferroni correction was used.
(C and D) Volcano plot (ThPO versus EV) of differentially expressed genes (Wilcoxon rank-sum test, two tailed; calculated per cluster individually; top panel). Associated gene ontology terms (biological processes; BP; Fisher exact test; single tailed) plotted semantically (bottom panel) in (C) pre-fibrosis and (D) fibrosis. (For a complete list of GO-terms and corresponding genes, see Tables S2 and S3.)
(E) Ridgeline plot of functional gene sets (as indicated) in ThPO (blue) versus EV (red). Competitive gene set enrichment analysis.
(F) PROGENy analysis of MSC-1 and MSC-2 in pre-fibrosis and fibrosis. Sampling based permutation (10,000 permutations). Pathway activity scores as Z scores.
In pre-fibrosis, fibrosis-driving MSC-1 revealed ER stress and a significant downregulation of genes compared to the control condition (Figure 3C). The downregulated genes in MSC-1 and -2 indicated significant “transcriptional reprogramming” of these populations with loss of their core cellular characteristics: (1) loss of niche and hematopoiesis support as well as neurotrophic (e.g., Fzd1, Cebpb) and vascular signaling (e.g., Foxc2, Hes1), (2) loss of MSC multipotent progenitor status (e.g., Arntl, Arhgdib, Ddr1, Lamb1), (3) decreased cellular function (e.g., Mapk3, Msn), and (4) metabolic inactivation (e.g., Cat, Tblxr1, Dgat1, Pank2). In manifest fibrosis, MSC-1 and -2 upregulated numerous genes, which confirmed the functional reprogramming with loss of niche-supportive characteristics and loss of multipotent progenitor status (Figure 3D). MSC-1 was characterized by marker genes for myofibroblasts (e.g., upregulation of Igfbp7, Limch-1, Wisp-2) and extensive ECM and collagen synthesis (mainly Col1a1, Col8a1). Changes in MSC-2 indicated that these cells differentiate into (1) myofibroblasts (e.g., upregulation of Limch1, Gas7, Acta1), (2) osteoblasts (e.g., upregulation of Bglap), and (3) also glial cells (e.g., upregulation of S100a8, S100a9), potentially also compensating for the neuropathy and Schwann cell death in MPNs.
To validate our hypothesis that MSCs are reprogrammed in early stages of fibrosis and are fibrosis-driving myofibroblasts, which do not support normal hematopoiesis in manifest fibrosis, we defined gene sets based on the literature (Table S4) to interrogate “hematopoiesis support,” “MSC progenitor phenotype,” “non-collagenous ECM,” and “collagenous ECM” and plotted the dynamics of these gene sets in pre-fibrosis and fibrosis (Figure 3E). In pre-fibrosis, MSCs are characterized by downregulated hematopoiesis support (MSC-3 and -4) and MSC characteristics (MSC-1, -2, -3). Even at this early time point, genes defining non-collagenous ECM proteins were significantly upregulated mainly in MSC-1 and -2, the fibrosis-driving cells. In overt fibrosis, MSCs showed highly significant downregulation of hematopoiesis support, MSC characteristics, and strong upregulation of ECM proteins (in all MSC clusters) and collagen (in MSC-1 and -2).
By comparing the differential expression signature of our single cell data with 14 signatures of pathway perturbation in pre-fibrosis and fibrosis (pathway responsive genes [PROGENy] analysis; Schubert et al., 2018), we detected increased activity of pro-inflammatory and pro-angiogenic pathways, specifically tumor necrosis factor (TNF)-α, and also of the JAK-STAT pathway, in fibrosis-driving MSC-1 and -2 (Figure 3F). Interestingly in pre-fibrosis, pro-fibrotic TGF-β signaling was significantly decreased in MSC-1 and -2, while in fibrosis it showed the most extreme upregulation (Figure 3F). The TGF-β pathway, considered to be the master regulator of fibrosis (Meng, Nikolic-Paterson and Lan, 2016), thus seems to play a central role in BM fibrosis but is not one of the earliest events, which are rather inflammation driven.
Single-cell analysis of niche cells confirms MSC-1 and -2 as fibrosis-driving cells and expansion of mSCPs in JAK2(V617F)-induced myelofibrosis
We validated our findings by using retroviral expression of the JAK2V617F mutation, which is the most common mutation in patients (Mullally et al., 2012; Schneider et al., 2017). After 24 weeks, mice developed severe fibrosis (Figure 4A), low hemoglobin levels, and high platelets (Figure 4B; Figure S4A).
Figure 4.

Mesenchymal stromal cells −1 and −2 are reprogrammed in JAK2V617F-induced primary myelofibrosis
(A) Representative HE and reticulin staining of JAK2V617F-induced fibrosis or control (EV, n = 4 mice per condition). Scale bar, 50 μm.
(B) Hemoglobin levels (mean ± SEM). Two-way ANOVA with post hoc pairwise t test was used.
(C) UMAP of non-hematopoietic BM cells (n = 1,292 cells).
(D) Top marker genes. Wilcoxon rank-sum test, p < 0.01. A full list of marker genes and corresponding GO terms is provided in Table S2.
(E) Bar plot of cells number in JAK2V617F versus control (EV) after normalization to total number. Fisher’s exact test with Bonferroni correction was used.
(F) Volcano plot; Wilcoxon rank-sum test, two tailed; calculated per cluster between JAK2V617F and JAK2WT (top panel). Associated gene ontology terms (biological processes; BP) plotted semantically (bottom panel) are shown. (For a complete list of GO-terms and corresponding genes, see Table S3.)
(G) Ridgeline plot for matrisome gene sets in MSC and OLC clusters (JAK2V617F; blue versus control; red) condition. Competitive gene set enrichment analysis was used.
(H) PROGENy analysis of MSC-1 and MSC-2. Sampling based permutation (10,000 permutations). Pathway activity scores as Z scores are shown.
Single cell RNA-seq recovered 1,292 cells non-hematopoietic cells, with an average of 1,000 genes per cell (Table S1). Exactly the same eight populations identified in the ThPO-induced BM fibrosis model were detected (Figure 4C; Figure 4D cf. Figure 1D; Figures S3B–S3D): (1–4) MSCs (MSC-1: adipogenic, MSC-2: osteogenic, MSC-3: transition, MSC-4: interferon high, (5 and 6) Schwann cell precursors (SCPs; 1: non-myelinating SCPs, nmSCPs; 2: myelinating SCPs, mSCPs), (7) osteoblastic lineage cells (OLCs), and (8) arterial fibroblasts (ACs). Cells from all identified populations were present in both the JAK2V617F-induced fibrosis and in non-fibrotic control mice. The integration of all cells indicated an expansion of MSC-1, MSC-4 (interferon-primed), and mSCPs in fibrosis compared to control (Figure 4E). The expansion of mSCPs was comparable to ThPO-induced BM fibrosis, again highlighting the role of glial cells in MPNs.
JAK2V617F induces a phenotypic switch toward myofibroblasts and osteoblasts in MSC-1 and -2
MSC-1 and -2 and OLCs expressed the highest number of differentially expressed genes compared to the control condition (Figure 4F). MSC-1 and -2 were characterized by a strong osteogenic signature (ossification) in line with the advanced fibrosis grade (MF3). In MSC-1 and -2 the strong upregulation of Bglap (bone gamma carboxyglutamate protein, also known as Osteocalcin) indicated an osteogenic differentiation bias. In MSC-2, Spp1 (Secreted Phosphoprotein 1; also known as Osteopontin) was significantly upregulated. MSC-2 showed a strong inflammation/wound healing signature. MSC-1 and -2 further acquired a “myofibroblast” phenotype (upregulation of Limch1; Dcn) and expression of Col1a1, Col8a1, Fndc1 (Table S3).
Our data show that MSC-1 and -2 in JAK2V617F-induced BM fibrosis acquire an osteogenic and myofibroblast phenotype with loss of MSC progenitor characteristics. SCPs and ACs only showed few changes in their transcriptome in JAK2V617F-induced PMF (Figure S4E). Exactly as observed in the ThPO-model of BM fibrosis, the expanded mSCP population was characterized by expression of the fibrosis-relevant genes Il33 and Ptgds (Figure S4F).
MSC-1 and MSC-2 showed the highest upregulation of ECM proteins, in particular, “core matrisome,” collagen, and glycoproteins in myelofibrosis, confirming that these two MSC populations are the cellular drivers of fibrosis and acquire myofibroblast characteristics (Figure 4G). The significantly upregulated pathways in MSC-1 and -2 were TGF-β, TNF-α, and also JAK-STAT signaling, exactly as seen in the ThPO model, highlighting the importance of these pathways in BM fibrosis (Figure 4H).
Transcriptionally inferred cellular interactions decrease in pre-fibrosis while niche cells show a self-supporting network in fibrosis
We aimed to dissect how cellular interactions within the niche affect the perturbation of signaling pathways detected in fibrosis by employing CellphoneDB (Efremova et al., 2020; Türei et al., 2016). Most ligand-receptor interactions were markedly decreased in ThPO-induced pre-fibrosis (Figure 5A; Table S5). In fibrosis (ThPO-induced), an overall decrease of cellular interactions was detected, while interactions between OLCs and SCPs increased. Interactions involving fibrosis-driving MSC-1 and MSC-2 showed distinct upregulation, indicating their activation as fibrosis-driving cells (Figure 5A). In the JAK2V617F dataset, a strong upregulation of intercellular communication between all niche populations was observed (Figure 5A). These findings support the hypothesis of a progressive reprogramming of the niche in fibrosis: niche populations first lose their physiological interactions and are then remodeled into a self-supporting network in advancing fibrosis.
Figure 5.

Tgfb1-driven cellular interaction and biased differentiation of MSCs in MPN
(A) Network plot of ligand-receptor activity in control and fibrosis.
(B) Bar plot of top 10 most abundant ligands in all inferred ligand-receptor interactions per dataset. Datasets are shown side by side (ThPO: pre-fibrosis, light blue; ThPO: fibrosis, dark blue; JAK2V617F: fibrosis, green).
(C) Top 20 deregulated interactions mediated by Tgfb1 targeting MSC-1 and MSC-2. Interactions ordered based on difference in mean LR expression between fibrosis and control. (For a full list of inferred ligand-receptor interactions, see Table S5.)
(D) Reconstructed cell differentiation trajectory of MSC populations.
(E) Bar plot of numerical changes between fibrosis and control in respective branches as identified in pseudotime analysis. Fisher’s exact test with Bonferroni correction was used.
(F) Expression levels of highlighted genes projected onto differentiation trajectory in pseudotime space.
(G) Expression levels of indicated genes with respect to their pseudotime coordinates. Black line indicates differentiation trajectory toward OLC branch and dotted lines toward SCP branch.
We quantified the absolute number of interactions for each unique ligand and ranked them by their absolute frequency (Figure 5B). ECM proteins (Col1a1, Fn1) and integrins involved in cell-ECM-interactions (Itgb1, Itga1, Itgav) were among the top hits. Tgfb1, Egfr, and Nfkb1 were also among the top 10 most abundant ligands. We next focused on interactions involving fibrosis-driving MSC-1 and -2 and Tgfb1 as a master switch in fibrosis (Figure 5C, first and second panel). Interestingly, MSCs themselves were predicted to be a main source of Tgfb1-driven cellular communication and showed upregulation of auto- and paracrine Tgfb1 signaling in manifest fibrosis. Tgfb1-mediated signals between OLCs and MSC-1/2 decreased over time, whereas those originating from SCPs increased. This is particularly interesting as Schwann cells have been described to participate in BM TGFβ G signaling (Yamazaki et al., 2011). In JAK2V617F-induced myelofibrosis an upregulation of Tgfb1 signaling in the niche was also observed. Our findings suggest that niche intrinsic TGFβ signaling contributes to the overall reprogramming of MSC-1 and MSC-2 in fibrosis.
MSCs have higher differentiation propensity toward SCPs and osteoblasts in PMF
To understand the differentiation capacities of MSCs in fibrosis, we performed cell-fate trajectory analysis and identified a transcriptional continuum of the 4 MSC populations. SCPs and OLCs represented two distinct differentiated cell populations (terminal branch) starting at MSCs (Figure 5D). The trajectory implied a transition from MSC-1 and MSC-2 through MSC-3, as a transitory state, to one of the two terminal branches (Figure S5A). MSC-2, as osteogenic primed MSCs, showed the highest tendency toward osteoblastic differentiation (Figure 5D) and OLCs increased in fibrosis (Figure 5E). Interestingly, in the ontogeny of the BM HSC niche, some MSCs expressing Nestin share a common origin with sympathetic peripheral neurons and also glial cells. This might explain why some MSCs retain the plasticity to differentiate into glial cells/SCPs and Gli1+ cells can also be found in the SCP cluster ((Cai et al., 2017); cf. Figure 2D). To validate differentiation of MSCs into SCPs, we applied published differentiation protocols. MSCs in the differentiation condition showed a significant upregulation of S100b and p75 neurotrophin receptor (p75ntr), indicating differentiation into SCPs (Figure S5B). We thus hypothesize that mutant (and fibrosis-inducing) HSCs can induce the terminal differentiation of MSCs into (1) matrix-secreting myofibroblasts, (2) osteolineage cells, or (3) to a lower extent Schwann cell precursors/Schwann cells.
Branched expression analysis modeling (BEAM) (Qiu et al., 2017) revealed a gradual loss of MSC-specific markers along the trajectory, which was particularly pronounced in the transdifferentiation toward SCPs (LepR). At the same time these cells acquire expression of S100b, a well-known marker for the Schwann cell lineage, at progenitor stages, which is also expressed on MSCs differentiated into SCPs (Figure 5F). The expression of S100b at a later stage is associated with increasing expression of Ncam1 (CD56) in both OLCs and SCPs (Figures 5F and 5G). Projecting the measured expression levels to the pseudotime trajectory confirmed a rather sparse pattern of cells differentiating toward SCPs, in particular, compared to OLCs (Figures 5F and 5G).
We next wondered whether the strong bias toward OLCs and myelinating SCP differentiation is reflected in patient samples. Systematic analyses of BM biopsies showed that spindle-shaped CD56/NCAM positive cells are activated from the endosteal niche (normal location) in the progression of BM fibrosis when they can be found abundantly in the marrow (Figures S5C–S5E, Figures S5D and S5E). S100b positive cells in control BMs (MF0) were mostly located in a periarteriolar localization (Figure S5F). In advanced MF, they were mobilized from their normal niche and were increased in their frequency (Figures S5F and S5G). Double immunohistochemistry for IL-33 and S100b confirmed occasional double positive spindle-shaped cells in the BM, as observed in our scRNA-seq data (Figure S5H).
Single-cell RNA-seq of the BM niche in PMF patients and controls confirms the molecular reprogramming of fibrosis-driving MSCs
Next, we validated our findings in clinical patient samples. One of the major challenges in late-stage myelofibrosis is that accessibility of liquid BM by aspiration is often limited (dry tap), and hematopoietic tissue for diagnosis is only available in the form of a BM biopsy. We received ~5 mm long pieces of biopsies (excess material not needed for diagnostics; Figure S6A) of two control patients (Figure 6A; Figure S6B) and 1 patient with JAK2V617F MPNs/PMF (VAF 13% in BM; MF grade 2–3; Figure 6A; Figure S6C). Stromal cells were enriched from BM biopsies after crushing and flow-based cell sorting of CD45–/CD71–/CD235a–/7AAD– cells (Figure S6D; Figure 6B; Table S1).
Figure 6.

MSCs are fibrosis-driving cells in patients characterized by upregulation of S100A8/A9
(A) Diagnostic BM images of the patients. Representative H&E and reticulin stainings. For additional images (all controls) and detailed patient characteristics, see Figure S5.
(B) UMAP of cells in 1 PMF patient (MF2, n = 243 cells) and two control patients (MF0, n = 255 cells). In the left panel, cells are color coded by their annotated cellular identity, and in the right panel, by their patient source.
(C) Top marker genes. Wilcoxon rank-sum test, p < 0.01.
(D) Ridgeline plot comparing PMF (blue) versus control (red) condition. Competitive gene set enrichment analysis was used.
(E) PROGENy analysis. Sampling-based permutation (10,000 permutations). Pathway activity scores are given as Z scores.
(F) Ridgeline plot of S100A8/A9 expression in PMF (blue) or control (red). Significance estimated by modeling the dropout rate as a binomial process with the observed dropout rate per condition as estimator of p for both conditions, respectively.
(G) Network plot of ligand-receptor activity in PMF compared to control.
(H) Bar plot of top 10 most abundant ligands in all inferred ligand-receptor interactions.
(I) Sankey plot of top 20 deregulated TGFB1-mediated ligand-receptor interactions. The absolute difference in mean LR expression was used as a metric for the extent of deregulation.
(J) Sankey plot of top 20 deregulated ligand-receptor interactions mediated by PF4, PF4V1, or PPBP. The absolute difference in mean LR expression was used as a metric for the extent of deregulation.
Unsupervised clustering identified 5 distinct major cell populations (Figure 6B): two hematopoietic and three stromal cell clusters. Stromal cell clusters were defined as (1) MSCs, (2) fibroblasts (Fib), and (3) Schwann cells (SC). MSCs were characterized, in line with the murine data, by high expression of Leptin receptor (LEPR), platelet-derived growth factor receptor b (PDGFRB), and CXCL12 (Figure 6C). Fibroblasts do not express these MSC-specific markers but express ECM proteins as collagen 1a1 (COL1A1) and fibronectin-1 (FN1); (Figure 6C). The Schwann cell cluster showed concordance with the murine dataset, in particular, in expression of myelin-associated oligodendrocyte basic protein (MOBP). The hematopoietic clusters were characterized by megakaryocyte-specific (Meg) markers (PF4, PPBP, and ITGA2B) and markers for myeloid cells (S100A8, ELANE, MPO); Figure 6C). Importantly, all cell clusters were present in the control and PMF sample in comparable distribution (Figure 6B).
Strikingly, MSCs transcriptionally showed loss of their core cellular characteristics as (1) downregulated niche and hematopoiesis support and (2) decreased MSC multipotent progenitor status (MSC signature; Figure 6D). They further showed significant upregulation of ECM proteins, specifically collagens, in PMF compared to normal BMs. Exactly as observed in the murine models, significantly upregulated pathways in those cells were JAK-STAT and TGF-β in MSCs as fibrosis-driving cells (Figure 6E).
The alarmin heterocomplex S100A8/S100A9, which can be considered a myeloid marker and is highly expressed in myeloid cells, was significantly upregulated in non-hematopoietic stromal cells that do not show S100A8/S100A9 expression in steady state (Figure 6F), in line with our murine datasets (Figure S6E). Previous data indicate that upregulated S100A8/S100A9 expression (and release) can be a stress response, impair normal hematopoiesis, and induce genotoxic stress and might thus reflect disease progression (Schneider et al., 2016; Vainchenker and Plo, 2016; Yang et al., 2016; Zambetti et al., 2016; Ribezzo et al., 2019). There is indication that S100A8/S100A9 exerts its biological effects specifically in the vicinity of the producing cell (Vogl et al., 2018). In PMF, this means that MSCs upregulate the alarmin complex and mainly affect HSCs in their vicinity but also megakaryocytes and Schwann cells, which in turn start to express S100A8/S100A9.
The S100A8/S100A9-driven cross-talk in PMF patients originated strongly from myeloid cells. Importantly, the interaction with almost all niche cells and specifically MSCs was increased in PMF (Figure S6F). This provides further evidence for the broad effect of S100A8/A9 on populations involved in fibrotic transformation. In PMF, megakaryocytes dominated cellular interactions with all niche cells while other hematopoietic-niche cell interactions rather decreased (Figure 6G). As seen in the murine models, megakaryocyte-derived TGFB1 signals were highly upregulated (Figure 6H) while TGFB1 signals from other clusters, such as fibroblasts and myeloid cells, were downregulated in PMF (Figure 6I). Other megakaryocyte-derived mediators with implication in PMF were also upregulated: PF4 (CXCL4), its homolog PF4V1 and platelet-basic protein precursor (PPBP) (Schneider et al., 2017; Gleitz et al., 2020). Signaling through pro-fibrotic receptors as VCAN and GF2 was also upregulated in PMF compared to controls (Figure 6J). This provides evidence that the interaction between megakaryocytes and fibrosis-driving MSCs is central in the priming and fibrotic transformation of MSCs.
The alarmin S100A8/S100A9 complex is systemically increased in MPNs and stromal alarmin expression marks the onset and progression of BM fibrosis
Our data in patient samples and murine models indicated that S100A8/S100A9 expression in MSCs is already upregulated in pre-fibrosis and significantly increased in fibrotic stages in almost all niche cells, suggesting S100A8/S100A9 as a sensitive marker for disease/fibrosis progression. We thus asked whether S100A8, one subunit of the heterodimeric complex, is also secreted and can mark the progression of BM fibrosis in patients. We quantified S100A8 in plasma samples (peripheral blood) from MPN patients by ELISA (Figure S7A). S100A8 was significantly increased in MPN patients (Figure 7A) and demarcated the transition from MF0 to MF1 and higher MF grades, indicating S100A8 as a sensitive marker for fibrosis onset or progression in PMF when follow-up samples are taken (Figure 7B). The S100A8 plasma concentration did not correlate with white blood cell counts, emphasizing that the elevated concentration is not only caused by the disease-specific myeloproliferation (Figure S7B). In previous work, we linked increased S100A8 expression in the stroma (in MDS) to decreased hematopoiesis support (Ribezzo et al., 2019). We performed immunohistochemistry for S100A8 on BM biopsies (Figures S7C and S7D). S100A8+ hematopoietic cells were expanded in MPNs in MF grade 0–1 but rather decreased in MF grade 2–3 due to progressing fibrosis (Figure 7C). Detailed analysis of S100A8 expression in the BM revealed distinct staining and distribution patterns, which we defined as four grades of S100A8 expression (Figures 7D and 7E): in grade 0 the S100A8 expression is limited to hematopoietic/myeloid cells, in grade 1 interstitial S100A8 staining is detected, in grade 2 distinct patches of stromal cells stain positive for S100A8, in grade 3 the S100A8 expression is significantly reduced in hematopoietic cells, but dense patches of positively stained stromal cells can be found (Figure S7D). Control BMs were consistently graded as grade 0 while, in particular, S100A8 grade 2 marked the progression of BM fibrosis, suggesting that stromal expression of the heterodimeric S100A8/S100A9 alarmin complex is a sensitive marker for disease progression (Figure S7E).
Figure 7.

Spatial kinetics of S100A8/S100A9 detects disease progression in MPN and their pharmacological targeting ameliorates the disease
(A) ELISA of S100A8 (and S100A9) in MPN (blue) and controls (red) plasma. Two-tailed, two-sample Welch test was used.
(B) ELISA of S100A8 (and S100A9) in MPN with different MF grades (blue) and controls (red) plasma. Mean ± SEM. One-way-ANOVA with post hoc Tukey’s was used.
(C) Frequency of S100A8+ cells BM biopsies; n = 64 patients. One-way-ANOVA with post hoc Tukey’s HSD was used.
(D and E) Grading of S100A8 in the non-hematopoietic compartment in BM biopsies. Scale bar, 100 μm. n = 64 patients. Kruskal-Wallis H test with post hoc Wilcoxon rank-sum test was used. p values were adjusted for multiple hypothesis testing by the Holm-Bonferroni method.
(F) White blood cell counts of WT mice transplanted with either JAK2V617F (blue) or JAK2WT overexpressing HSPCs (red) each either treated with Tasquinimod 30 mg/kg/day or vehicle control. Two-way repeated ANOVA pairwise comparisons were analyzed by estimated marginal means.
(G) Spleens at sacrifice as indicated.
(H) Relative spleen weights. Mean ± SEM. One-way-ANOVA with post hoc Tukey’s HSD.
(I) Reticulin (MF) grade. Kruskal-Wallis H test with post hoc Wilcoxon rank-sum test.
See also Figure S6.
S100A8/S100A9 is a therapeutic target in PMF
To determine whether the alarmin complex is a therapeutic target in MPNs associated with fibrosis, we tested Tasquinimod in the murine JAK2V617F MF model (Figure S7F). Tasquinimod binds to the S100A8/S100A9 alarmin heterodimer and impedes its interaction with TLR4 and RAGE receptors (Isaacs et al., 2006). Tasquinimod treatment ameliorated the myeloproliferation in JAK2V617F mice comparable to leukocyte, hemoglobin, and platelet counts in controls (Figure 7F; Figures S7G and S7H). Severe splenomegaly, which is a major clinical manifestation in PMF patients, was observed in vehicle-treated JAK2V617F mice but completely normalized with Tasquinimod treatment (Figures 7G and 7H). Importantly, Tasquinimod treatment in JAK2V617F mice significantly reduced the fibrosis grade and restored the BM architecture in MPNs (Figure 7I; Figures S7I–S7J).
To investigate the direct effect of Tasquinimod on the fibrotic transformation of MSCs, we induced the fibrotic transformation of isolated primary MSCs by addition of TGF-β as a strong pro-fibrotic stimulus in the absence or presence of Tasquinimod. The addition of TGF-β induced the differentiation of MSCs into α-SMA-positive myofibroblasts. Tasquinimod significantly reduced the frequency of α-SMA positive myofibroblasts but did not completely block this important step in the fibrotic transformation.
These results provide strong indication that S100A8/S100A9 plays a central role in the fibrotic transformation, directly on MSCs but also through the hematopoietic-stromal cross-talk, and that its pharmacological targeting ameliorates both the MPN phenotype but also fibrosis and exerts effects on stromal cells and the mutant hematopoietic clone.
Discussion
Our findings supplement the picture of the BM microenvironment in the presence of a malignant hematopoietic MPN clone, which induces a regenerative but pro-fibrotic environment leading to (mal-)differentiation of distinct MSC populations with loss of their normal function. MSCs are increasingly recognized as a major source of fibrosis-associated myofibroblasts in various organs (El Agha et al., 2017). These findings are almost solely based on genetic fate tracing, which is the gold-standard approach for studying cell-fate switching in response to pathological stimuli (Kramann et al., 2015; Schneider et al., 2017). Here, we applied single-cell RNA-seq to better understand fate switching of distinct precursor cells/MSC populations during injury induced by a malignant clone. Several key observations were only possible due to the single cell-level resolution of our study, highlighting the power of single-cell technologies in understanding disease pathology and biomarker identification for pre-fibrotic stages.
We demonstrate that two distinct MSC populations (MSC-1 and MSC-2) are the main drivers of BM fibrosis in two well-established models. These two MSC populations are LepR+, adipogenic-, or osteogenic-biased progenitor populations under steady-state conditions with high expression of Cxcl12, indicating their hematopoiesis-supporting capacity. Importantly, the different MSC populations identified in our study are in line with the four different MSC populations described before using either lineage-negative selection as in our approach; (Baryawno et al., 2019) or sort purification of LepR-positive cells (Tikhonova et al., 2019), respectively. Gli1+ cells on the single-cell level are MSCs, which are enriched for MSC-1 and -2, as fibrosis-driving cells and also in part have SCP character. These data highlight that some MSCs are also derived from neural crest and thus have a common origin with sympathetic peripheral neurons and glial cells, reflected by their expression profile (Isern et al., 2014). Given their expression profile and the pseudotime analysis, MSC-1 and -2 seem to be (multipotent) mesenchymal progenitor cells, which means mesenchymal cells that are capable of differentiating into a limited number of cell types. These two progenitor populations are the predominant Col1a1-producing cells in overt BM fibrosis. Importantly, collagen I is considered the hallmark ECM protein of fibrosis. Our data identified these two populations as key drivers of myelofibrosis and add novel insight into the role of these populations in this most extensive form of remodeling of the BM microenvironment. The functional characterization of sort-purified MSC- 1 and -2 confirmed the transcriptional data on the single-cell level and demonstrated their progenitor profile. Thus, the proposed antibody panel for enrichment of MSC-1 and -2 is also interesting for approaches requiring an enrichment of more immature progenitor cells, e.g., in regenerative medicine. It is important to note that in all approaches we were able to cover the majority of cell populations known to be part of the hematopoietic niche, yet only MSCs proved to be responsive to the malignant hematopoietic clone with regards to ECM production. This makes therapeutical targeting of the niche highly attractive (Curto-Garcia, Harrison, and McLornan 2020; Méndez-Ferrer et al., 2020; Schneider et al., 2017).
We demonstrate that MSCs are functionally reprogrammed in fibrosis with loss of their progenitor status and normal function in the BM microenvironment. We show that the reprogramming of MSCs is a stepwise process, which starts with loss of “MSC characteristics” in all 4 MSC populations, not only in the fibrosis-driving ones, already in the pre-fibrotic phase. This indicates that all MSC populations react to the fibrosis-inducing hematopoietic clone while only MSC-1 and -2 are capable of differentiation into ECM-producing myofibroblasts. Interestingly, all MSC subsets lose their hematopoiesis support over time and contribute to the production of non-collagenous ECM with scaffolding function for collagen fibrosis. Our data indicate that TGF-β plays a central role in the reprogramming as addition of TGF-β to fibrosis-driving MSCs leads to downregulation of CXCL12 with central role in hematopoiesis support. The increased differentiation of all MSC populations in BM fibrosis can be interpreted as excessive maldifferentiation, in particular, the osteogenic differentiation, which leads to bone formation in the marrow. Maldifferentiation of MSCs has also been described in other organs under reactive and regenerative conditions, e.g., the heart (Breitbach et al., 2007) and the kidney (Kunter et al., 2007). In the persistence of a malignant, fibrosis-inducing hematopoietic clone, MSCs are continuously pushed toward differentiation, which leads to a vicious cycle of loss of tissue function and scarring with high resemblance to solid organ fibrosis.
Inflammation plays a critical role within this vicious circle and we here demonstrate that the alarmin heterodimer S100A8/S100A9 is an important pro-inflammatory player in MPNs with distinct kinetics: strong expression in hematopoietic cells demarcates the myeloproliferative phase and expression in the stroma demarcates the fibrotic progression. Myeloid cells express S100A8/S100A9 at baseline (as a marker) but do not show upregulation in fibrosis/MPNs. Stromal cells, however, do not express S100A8/S100A9 at steady state but upregulate the expression in disease. In previous work, we linked increased S100A8/S100A9 expression in the stroma (where it is not expressed in healthy individuals) to decreased hematopoiesis support (Ribezzo et al., 2019), underlining that S100A8/S100A9 might be a good marker for the reprogramming of the stroma from hematopoiesis support toward fibrotic transformation, in particular, if followed up in patients over time. Strikingly, Tasquinimod ameliorated the MPN phenotype and fibrosis, suggesting that it affects both the mutated hematopoietic clone but also the fibrotic transformation. Our data indicate that pharmacological targeting of S100A8/S100A9 has huge translational value providing first evidence for the design of clinical phase I studies.
Limitations of study
The aim of our study was to investigate changes in non-hematopoietic cells of the BM in the progress of myelofibrosis. It is well accepted that the isolation process of niche cells is associated with a bias toward certain cell types (Baccin et al., 2020). Thus, niche populations can be underrepresented. The number of tools for inferring ligand-receptor interactions is rapidly increasing. The overlap between the databases, however, is relatively small. Identified interactions will need to be validated in the future and used for prospective curation of the available tools. Finally, liquid BM frequently cannot be aspirated in advanced myelofibrosis. Hence, purifying a high number of cells for scRNA-seq is very challenging. Therefore, the data generated here will be validated in a larger cohort in the future.
STAR★Methods
Key resources table
| REAGENT or RESOURCE | SOURCE | IDENTIFIER |
|---|---|---|
| Antibodies | ||
| BD Pharm Lyse | BD Biosciences | Cat#555899; RRID: AB_2869057 |
| Biotin anti-mouse CD45 Antibody | Biolegend | Cat#103104; RRID: AB_312969 |
| Biotin anti-mouse CD71 Antibody | Biolegend | Cat#113803; RRID: AB_313564 |
| CD41-Biotin | Biolegend | Cat#133930; RRID: AB_2572133 |
| Lineage Cell Depletion Kit, mouse | Miltenyi Biotec | Cat#130-090-858 |
| APC/Cyanine7 anti-mouse CD41 Antibody | Biolegend | Cat#133928; RRID: AB_2572131 |
| APC/Cyanine7 anti-mouse CD3 Antibody | Biolegend | Cat#100222; RRID: AB_2242784 |
| APC/Cyanine7 anti-mouse/human CD11b Antibody | Biolegend | Cat#101226; RRID: AB_830642 |
| APC/Cyanine7 anti-mouse Ly-6G/Ly-6C (Gr-1) Antibody | Biolegend | Cat#108424; RRID: AB_2137485 |
| APC/Cyanine7 anti-mouse TER-119/Erythroid Cells Antibody | Biolegend | Cat#116223; RRID: AB_2137788 |
| APC/Cyanine7 anti-mouse/human CD45R/B220 Antibody | Biolegend | Cat#103224; RRID: AB_313007 |
| APC/Cyanine7 anti-mouse CD45.1 Antibody | Biolegend | Cat#110716; RRID: AB_313505 |
| APC/Cyanine7 anti-mouse CD45.2 Antibody | Biolegend | Cat#109824; RRID: AB_830789 |
| PerCP/Cy5.5 anti-mouse Ly-6A/E (Sca-1) | Sony Biotechnologies | Cat#1212615; RRID: AB_2877117 |
| APC anti-mouse CD31 Antibody | Biolegend | Cat#102410; RRID: AB_312905 |
| PE anti-mouse CD51 Antibody | Biolegend | Cat#104106; RRID: AB_2129493 |
| Hoechst Solution 33342 | BD Biosciences | Cat#561908 |
| Pacific Blue anti-mouse CD45 Antibody | Biolegend | Cat#103125; RRID: AB_493536 |
| CD11b Monoclonal Antibody (M1/70), eFluor 450 | ThermoFisher | Cat#48-0112-80; RRID: AB_1582237 |
| PE/Cy7 anti-mouse CD140a Antibody | Biolegend | Cat#135911; RRID: AB_2715973 |
| APC CD140b (PDGFRB) Monoclonal Antibody (APB5) | ThermoFisher | Cat#14-1402-82; RRID: AB_467493 |
| PE anti-mouse CD106 Antibody | Biolegend | Cat#105713; RRID: AB_1134166 |
| FITC CD107a antibody | BD Biosciences | Cat#553793; RRID: AB_395057 |
| Recombinant Anti-MRP8 antibody [EPR3554] | abcam | Cat#ab92331; RRID: AB_2050283 |
| Rabbit anti-CD56 (clone RCD56, Isotype IgG) | Zytomed Systems | Cat#RBK050; RRID: AB_2864528 |
| APC anti-human CD105 Antibody | Biolegend | Cat#323208; RRID: AB_755960 |
| PE anti-human CD271 (NGFR) Antibody | Biolegend | Cat#345106; RRID: AB_2152647 |
| APC/Cyanine7 anti-human CD31 Antibody | Biolegend | Cat#303120; RRID: AB_10640734 |
| FITC anti-human CD45 Antibody | Biolegend | Cat#368508; RRID: AB_2566368 |
| FITC anti-human CD235ab Antibody | Biolegend | Cat#306610; RRID: AB_756046 |
| FITC anti-human CD71 Antibody | Biolegend | Cat#334104; RRID: AB_2201482 |
| FITC anti-human CD41 Antibody | Biolegend | Cat#303704; RRID: AB_314374 |
| FITC anti-human CD61 Antibody | Biolegend | Cat#336404; RRID: AB_1227580 |
| 7-AAD Viability Staining Solution | Biolegend | Cat#420404 |
| goat anti-IL-33 Antibody | R&D Systems | Cat#AF3626; RRID: AB_884269 |
| Rabbit anti goat Antibody | DAKO | Cat#E0466 |
| rabbit-anti-S100-Antibody | DAKO | Cat#Z0311 |
| goat anti-rabbit-Antibody | Vector | Cat#BP-9100 |
| Anti-Actin, α-Smooth Muscle - FITC Antibody | Sigma Aldrich | Cat#F3777; RRID: AB_476977 |
| Bacterial and Virus Strains | ||
| pRRL.PPT.SFFV.IRES2.EGFP.WPRE | Axels Schambach, Dirk Heckl | N/A |
| MSCV-IRES-EGFP | Tannishtha Reya | Addgene Plasmid #20672; RRID:Addgene_20672 |
| pMIG-JAK2WT-IRES-EGFP | Melanie Curie | N/A |
| pMIG-JAK2V617F-IRES-EGFP | Melanie Curie | N/A |
| Biological Samples | ||
| Chemicals, Peptides, and Recombinant Proteins | ||
| Murine thrombopoietin | Peprotech | Cat#351-14 |
| Murine stem cell factor | Peprotech | Cat#250-03 |
| Retronectin | Takara Bio | Cat#T100A/B |
| Polybrene | Merck Millipore | Cat#TR-1003-G |
| Fugene | Promega | Cat#E2691 |
| StemSpan SFEM | Stem Cell Technologies | Cat#09600 |
| Collagenase II | Invitrogen | Cat#17101015 |
| Murine bFGF | Peprotech | Cat#450-33 |
| Murine EGF | Peprotech | Cat#315-09 |
| Recombinant murine IL-33 | Peprotech | Cat#210-33 |
| Recombinant human TGF-β1 | InvivoGen | Cat#rcyc-htgfb1 |
| Poly(ethylene glycol) BioUltra 300 | Sigma | Cat#90878-250ML-F |
| Tasquinimod (ABR-215050) | Biorbyt | Cat#ORB251345 |
| B-27 Supplement (50X), serum free | ThermoFisher | Cat#17504044 |
| Forskolin | Sigma-Aldrich | Cat#F6886 |
| Recombinant Human PDGF-AA | Peprotech | Cat#100-13A |
| Heregulin-β3, Epidermal growth factor (EGF) domain | Sigma-Aldrich | Cat#01-201 |
| Liberase | Roche | Cat#5401020001 |
| DNaseI | Sigma | Cat#DN25 |
| Antigen unmasking solution | Vector | Cat#H-3300 |
| Hematoxylin Solution, Gill No. 1 | Sigma | Cat#GHS1128 |
| Critical Commercial Assays | ||
| Chromium Single Cell 3′ Reagent Kits (v2) | 10x Genomics | Cat#PN-120237 |
| Chromium Single Cell A Chip Kit (v2) | 10x Genomics | Cat#PN-120236 |
| i7 Multiplex Kit, 96 rxns | 10x Genomics | Cat#PN-120262 |
| Single Cell 3′Reagent Kits (v2) User Guide | 10x Genomics | Cat#CG00052, Rev D |
| High-Capacity cDNA Reverse Transcription Kits | Thermo Fisher | Cat#4368814 |
| Fast SYBR Green Master Mix | Applied Biosystems | Cat#4385616 |
| MesenCult Expansion Kit (Mouse) | STEMCELL | Cat#05513 |
| Reticulin silver plating kit acc. to Gordon & Sweets | Sigma | Cat#1002510001 |
| Human S100A8 DuoSet ELISA | R&D Systems | Cat#DY4570-05 |
| Chromium Single Cell 3′ Reagent Kits (v2) | 10x Genomics | Cat#PN-120237 |
| Chromium Single Cell A Chip Kit (v2) | 10x Genomics | Cat#PN-120236 |
| i7 Multiplex Kit, 96 rxns | 10x Genomics | Cat#PN-120262 |
| Single Cell 3′Reagent Kits (v2) User Guide | 10x Genomics | Cat#CG00052, Rev D |
| AVIDIN/BIOTIN blocking Kit | Vector | Cat#SP-2001 |
| Peroxidase substrate Kit | Vector | Cat#SK-4100 |
| ABC-Kit | Vector | Cat#PK-6100 |
| Deposited Data | ||
| Genome Reference Consortium Mouse Build 38 patch release 6, mm10 | Genome Reference Consortium | https://www.ncbi.nlm.nih.gov/assembly/GCF_000001635.26 |
| Raw Data | This paper | GEO: GSE156644 |
| Analyzed Data | This paper | 10.5281/zenodo.3979087 |
| Experimental Models: Cell Lines | ||
| Hek293T | ATCC | CRL-3216; RRID:CVCL_0063 |
| Experimental Models: Organisms/Strains | ||
| B6.SJL-Ptprca Pepcb/BoyJ Mus musculus | The Jackson Laboratory | Cat#JAX:002014; RRID:IMSR_JAX:002014 |
| C57BL/6J Mus musculus | The Jackson Laboratory | Cat# JAX:000664; RRID:IMSR_JAX:000664 |
| Gli1tm3(re/ERT2)Alj/J | The Jackson Laboratory | Cat#007913 |
| Rosa26tdTomato (i.e., B6-Cg-Gt(ROSA)26Sorttm(CAG-tdTomato)Hze/J) | The Jackson Laboratory | Cat#007909 |
| Oligonucleotides | ||
| See Table S6 | See Table S6 | See Table S6 |
| Recombinant DNA | ||
| psPAX2 (lentivral packaging) | Didier Trono | Addgene Plasmid #12259; RRID:Addgene_12259 |
| pCMV-VSV-G (lentiviral envelope) | Didier Trono | Addgene Plasmid #8454; RRID:Addgene_8454 |
| pCL-Eco (retroviral packaging) | Novus Biologicals | Cat# NBP2-29540 |
| Software and Algorithms | ||
| GraphPadPrism v8 | GraphPad Software Inc. | RRID:SCR_002798 |
| FlowJo v10 | Tree Star Inc. | RRID:SCR_008520 |
| Adobe Phostoshop CC 2018 | Adobe Systems Inc. | RRID:SCR_014199 |
| Adobe Illustrator CC 2018 | Adobe Systems Inc. | RRID:SCR_010279 |
| Cellranger v 2.1.1 | 10x Genomics | https://support.10xgenomics.com/single-cell-gene-expression/software/release-notes/2-1 |
| Seurat (v2.3.4; v3.1.0) | Butler et al., 2018 | https://satijalab.org/seurat |
| clusterProfiler v3.12.0 | (Yu et al., 2012) | https://git.bioconductor.org/packages/clusterProfiler |
| edgeR v3.26.7 | McCarthy et al., 2012 | https://git.bioconductor.org/packages/edgeR |
| Monocle v2.12.0 | Trapnell et al., 2014 | https://git.bioconductor.org/packages/monocle |
| Qiu et al., 2017 | ||
| R v3.6.1 | CRAN | https://www.R-project.org |
| Progeny v1.11.0 | Schubert et al., 2018 | https://github.com/saezlab/progeny |
| Viper v1.20.0 | (Alvarez et al., 2016) | https://git.bioconductor.org/packages/viper |
| CellPhoneDB v2.0.5 | Efremova et. al, 2020 | https://github.com/Teichlab/cellphonedb |
| biomaRt v1.2.0 | (Durinck et al., 2009) | https://git.bioconductor.org/packages/biomaRt |
Resource availability
Lead contact
Further information and requests for resources and reagents should be directed to and will be fulfilled by the Lead Contact, Rebekka K. Schneider, MD, PhD (reschneider@ukaachen.de).
Materials availability
This study did not generate new unique reagents. For specific details on availability please refer to the Key Resources Table.
Data and code availability
Single cell sequencing experiments are deposited at GEO with accession number GEO: GSE156644. Seurat objects of datasets, sample markdown code and tables with complete marker genes, differential expression, gene expression enrichment analysis and ligand receptor analysis are deposited at Zenodo (https://doi.org/10.5281/zenodo.3979087).
Experimental model and subject details
Animal studies
All mouse studies were approved by the Animal Welfare/Ethics committee of the EDC in accordance with legislation in the Netherlands (approval No. AVD1010020173387). PtprcaPepcb/BoyCrl (B6.SJL) mice were purchased from Charles River (Netherlands) and maintained in specific-pathogen-free conditions. Mice were maintained on a 12-hr light/dark cycle and were provided with water and standard mouse chow ad libitum. Mice were randomly assigned to experimental groups.
Gli1CreERt2 (i.e., Gli1tm3(re/ERT2)Alj/J, JAX Stock #007913), Rosa26tdTomato (i.e., B6-Cg-Gt(ROSA)26Sorttm(CAG-tdTomato)Hze/J JAX Stock #007909) were purchased from Jackson Laboratories (Bar Harbor, ME, USA). Offspring was genotyped by PCR according to the protocol from the Jackson laboratory.
Human studies
For single cell studies from bone marrow biopsies only excess material was used. In accordance with MEC-2018-1445 all patient material was de-identified at inclusion. Unprocessed bone marrow biopsies were obtained approximately 1-2h after successful bone marrow biopsy via the Department of Pathology. More detailed information on patient characteristics can be found in Figures S7A and S7C.
MPN Patient plasma samples were collected and supplied by the University Clinic Hamburg-Eppendorf (UKE), obtained via the German Study Group MPN Aachen and the Department for Molecular Diagnostics at the Erasmus Medical Center (MC) in Rotterdam. Control samples were obtained via the Institute for Clinical Chemistry at Erasmus MC. Surplus material was collected from dermatological, and cardiological, orthopedic or neurological patients after diagnostics according to the ethical vote MEC-2018-1445 and processed on the day of acquisition. All subjects had no history or indication of any hematological or non-hematological malignancy. Samples were de-identified at the time of inclusion. All patients provided informed consent and the data collection was performed in accordance with the Declaration of Helsinki.
For samples from Bern all patients and healthy donors gave written informed consent and all analyses of the samples were approved by the Cantonal Ethics Committee of Bern (2016-01949). Human bone marrow tissues were provided by the Tissue Bank Bern.
Human bone marrow biopsies from a subcohort of patients whose plasma was used were chosen for histological examination from archived patient samples of paraffin-embedded tissue from the Biobank of Dr. G. Büsche at the Department of Pathology, Hannover Medical School, Hannover, Germany. Biopsies were primarily taken during earlier hospitalization. Additional control bone marrow slides were acquired from the Department of Pathology at Erasmus Medical Center. All reference patients showed normal bone marrow characteristics and had no evidence for a history of hematological malignancies.
Cell lines and cell culture
For MSC isolation, bones of WT mice were crushed and digested with Collagenase II (Invitrogen, #17101015) for 90 min at 37°C. Bone chips were washed three times with alpha-MEM/ 10% FCS/ 1% Penicillin/Streptomycin, transferred to a 15cm culture dish and cultured in full medium (alpha-MEM, 10% FCS, 1% Penicillin/Streptomycin, 1ng/ml murine bFGF (Peprotech, #450-33), 5ng/ml murine EGF (Peprotech #315-09)). After 72h bone chips were transferred to a new culture dish to dispose of contaminating macrophages. After 7–9 days, the bone chips were discarded. Attached MSCs were washed, trypsinated, centrifuged, and replated. Cells were passaged every 2-4 days at approximately 80% confluence.
Method details
Viral transduction
For retroviral and lentiviral transduction, c-kit+-enriched cells from 8-12-week-old WT mice were isolated by crushing compact bone and lineage depleted by magnetic separation (Miltenyi Biotec). c-kit+ BM cells were pre-stimulated for 24 h in CellGro media (CellGenix) supplemented by murine stem-cell factor (m-Scf., 50ng/ml, Peprotech) and murine thrombopoietin (m-Tpo, 50ng/ml, Peprotech). Oncoretroviral vectors were pseudotyped with an Ecotropic Envelope Vector and produced using standard protocols.
Retroviral transduction was performed on retroNectin (Takara Bio)-coated cell culture dishes loaded with unconcentrated virus. Cells were resuspended in medium containing concentrated virus in the presence of 4 μg/ml polybrene at 37°C for a minimum of 24 h.
Lentiviral particles were produced by transient transfection with lentiviral plasmid together with pSPAX and VSVG packaging plasmids using Fugene (Promega). Lentiviral and retroviral particles were concentrated by ultracentrifugation at 4°C.
Induction of myelofibrosis by overexpression of ThPO or JAK2V617F
8-10-week-old female B6.SJL recipients mice were irradiated with 10.5 Gy and received 4-5x10⁵ cells from 8-week-old WT littermates that had been harvested 48 h prior to transplantation and transduced with ThPO (GFP+) lentivirus or control empty vector lentivirus (Empty Vector-GFP+). For JAK2V617F studies (JAK2), WT BM cells were transduced with JAK2V617F retrovirus or control pMIG retrovirus (control: JAK2 empty vector).
Mice from the early ThPO cohort were sacrificed 5 weeks post-transplant andmice in the late ThPO cohort were sacrificed 10 weeks post-transplant. Mice used in the JAK2 experiments were sacrificed at 26 weeks post-BM transplant. Mice in the JAK2 and ThPO late cohort were sacrificed when they had signs of advanced fibrosis as indicated by dropping hemoglobin levels and apparent weight loss.
Blood was periodically collected from mice via submandibular bleeds into Microtainer tubes coated with K2EDTA (Becton Dickinson, NJ, USA) and complete blood counts were performed on a Horiba SciI Vet abc Plus hematology system.
For the quantification of MSC-1/2 and MSC-3/4 in ThPO-setting, 6-10 week old B6.Cg-Tg(Grem1-cre/ERT)3Tcw/J recipient mice were injected 4x30mg with tamoxifen in corn oil/ 3% ethanol (Sigma) intraperitoneally. Three weeks after last tamoxifen injection, mice were irradiated using a split-scheme of 2 × 6.02Gy and received 4-5x10⁵ cells from 8-week-old littermates that had been harvested 48 h prior to transplantation and transduced with ThPO (GFP+) lentivirus or control empty vector lentivirus (Empty Vector-GFP+).
Isolation of bone marrow stromal cells for scRNA sequencing
After sacrifice bones (femurs, hip, spine) were crushed and flushed in PBS/2% FCS on ice. The cells were dissociated by filtering through a 70μm nylon mesh. Cells were lineage depleted using biotinylated antibodies directed against lineages (CD5, CD45R (B220), CD11b, Anti-Gr-1 (Ly-6G/C), 7-4 and Ter-119) (Miltenyi Biotec) and CD45, CD71 and CD41 (Biolegend). The cells were stained for 10 min at 4°C. After washing, the cells were incubated with anti-biotin beads (Miltenyi biotec) for 15 min at 4°C prior to magnetic depletion using a cell separation magnet (BD). The cells that were not bound to the magnet were used for FACS staining and sorting.
Human biopsies were crushed and flushed with PBS/10% FCS on ice and filtered through a 70μm nylon mesh. Cleaned bone chips were digested in 10ml collagenase II (1mg/ml) at 37°C for 90 min under gentle agitation. The cell suspension was strained through a 70μm mesh and bone chips were additionally washed twice with PBS/10% FCS before pooling it with the flushed fraction. Both fractions were used for FACS staining and sorting.
FACS-staining and sorting of bone marrow stromal cells for scRNA sequencing
Cells were resuspended in 300μl PBS/2% FCS and stained at 4°C for 20 min with the antibodies described below. Washing was performed by adding 1ml PBS/2% FCS and centrifuging for 5 min at 300 × g, 4°C. After resuspension and addition of Hoechst (1:10000), lineage/CD45/Ter119 negative cells were sorted into 50μl DMEM/10% FCS (BD Aria III) and used for the 10x platform. Unstained cells were used as negative controls to define gating. All antibodies were acquired from Biolegend.
The following fluorochrome conjugated antibodies were used for murine samples: CD41-APC-Cy7, CD3-APC-Cy7, CD11b-APC-Cy7, Gr1-APC-Cy7, Ter119-APC-Cy7, B220-APC-Cy7, CD45.1-APC-Cy7, CD45.2-APC-Cy7, Sca1-PerCP, CD31-APC, CD51-PE.
Patient derived cells were stained following the same protocol using the following conjugated antibodies: CD105-APC, CD271-PE, CD31-APC-Cy7, CD45-FITC, CD235a-FITC, CD71-FITC, CD41-FITC, CD61-FITC
Isolation of Gli1+ stromal cells in homeostasis for scRNaseq
For lineage tracing, 6-7 week old mice were injected intraperitoneally with 4x3 mg tamoxifen in corn oil / 3% ethanol (Sigma). Mice were sacrificed 2 weeks after the last injection of tamoxifen. At sacrifice, compact bones were crushed and flushed in PBS/2% FCS and dispersed into a single cell suspension prior to red blood cell lysis to obtain the bone marrow fraction. Bone chips were digested with Liberase (0.2mg/ml; 5401020001, Roche) in the presence of DNase I (60Units/mL, DN25-100MG) for 30 min at 37°C with agitation. The cell suspension was then filtered through a 70μm nylon mesh and combined with the bone marrow fraction before addition of Hoechst (1:10000). Viable Gli1-tdTom+ cells were sorted (BD Aria II) into DMEM/10% FCS and used for the 10x platform.
Single cell library preparation and sequencing
The libraries were prepared using the Chromium Single Cell 3′ Reagent Kits (v2): Single Cell 3′ Library & Gel Bead Kit v2 (PN-120237), Chromium Single Cell A Chip Kit v2 (PN-120236) and i7 Multiplex Kit (PN-120262) (10x Genomics), and following the Single Cell 3′ Reagent Kits (v2) User Guide (manual part no. CG00052, Rev D). Finalized libraries were sequenced on a Novaseq6000 platform (Illumina), aiming for a minimum of 50.000 reads/cell using the 10x Genomics recommended number of cycles (28-8-0-91 cycles).
Single cell RNA seq data analysis of ThPO and Jak2 mouse models
We used cellranger (version 2.1.1) to align reads to mouse genome mm10 and for detection of cells with default parameters. Next, we used Seurat (v3.1.0) for high level analysis of the scRNA-seq (Satija et al., 2015). We filtered cells with a high amount of mitochondrial genes (< 0.1), high amount of ribosomal genes (< 0.25). We also removed cells with more than 30.000 UMIs as they represent potential multiplets. Finally, we filtered cells with less than 30 genes detected. See Table S1 for quality statistics of RNA-seq libraries.
Next, we regressed out cell cycle, the proportion of mitochondrial, ribosomal and UMI counts and performed a log-normalization of read counts using Seurat for data. Next, samples from ThPO (and Jak2) experiments were integrated with canonical correlation analysis (CCA) based on the first 15 CCs (Butler et al., 2018). Unsupervised clustering was performed selecting k = 15 with a shared nearest neighbors graph with resolution 0.8. UMAP representations were generated using the following parameters: min_dist = 0.3, max.dim = 2, seed.use = 36). We used FindMarkers gene function with adjusted p value < 0.05 to find cluster specific makers.
Differential gene expression analysis was performed with Seurat changing between distinct phenotypes. For this, we considered only genes with an absolute fold change greater than 0.5 and adjusted p value < 0.01. GO and pathway enrichment analysis were based on clusterProfiler (Version 3.12.0; (Yu et al., 2012)) and CAMERA from edgeR (Version 3.26.7;(McCarthy, Chen and Smyth, 2012)). Obtained GO terms were summarized via the REVIGO web application using p values as input metric allowing a similarity of 0.7 (Supek et al., 2011). We have also defined gene sets describing “hematopoiesis-support,” “MSC progenitor phenotype,” “non-collagenous ECM” and “collagenous ECM” (Table S2). These were used in a pre-ranked GSEA analysis (Version 4.0; (Subramanian et al., 2005)). All p values were corrected by Benjamini-Hochberg correction. A full list of identified marker genes and differentially expressed genes for each dataset including corresponding statistics is supplied in Tables S2 and S3.
Integration of single cell RNA seq data of Gli1 sorted cells
We used the previously described computational pipeline for analysis of Gli1 sorted scRNA-seq cells. We filter cells by fraction of mitochondrial genes (< 0.1), low amount of ribosomal genes (< 0.08) or cells with less than 200 genes detected. The Gli1 data were integrated with the ThPO data using a label transfer procedure from Seurat (v3.1.0). This allowed us to associate Gli1 cells to the 7 clusters detected in ThPO cells.
Single cell RNA seq data analysis of human samples
We used the previously described computational pipeline for normalization and integration of human samples. Reads were aligned to the genome GRCh38 and we filtered cells with high fraction of mitochondrial genes (< 0.2), high fraction of ribosomal genes (< 0.4) and lower number of UMIs (> 45). Also, cells with less than 200 genes detected and cells with more than 12.000 UMIs were removed. Integration, clustering analysis was performed by Seurat (v3.1.0) as described before.
Reconstructing cell development trajectories
We used monocle (version 2.12.0, (Trapnell et al., 2014)) to reconstruct the cell development trajectories by combining all mouse data (ThPO, Jak2 and Gli1 cells) with default parameters. We used the 1000 most relevant genes identified by Monocle’s unsupervised feature selection approach (dpFeature) for the cell development trajectories reconstructing. Next, we used the Branched expression analysis modeling (BEAM, version 2.12.0, (Qiu et al., 2017)) to find genes with branch specific expression patterns. Only genes with an adjusted p value < 0.05 were further considered.
PROGENy analysis
PROGENy analysis was conducted as described using the Progeny package (R, V1.11.0) for human and murine datasets. Reference Progeny papers for each interrogated cluster the generated list of genes differentially expressed between fibrotic and non-fibrotic conditions was used. The scala products of obtained log2-fold changes and PROGENy weights were calculated for respective pathway scores. To estimate significance label permutation was performed 10000 times to generate a Null distribution for each pathway. The pathway scores were scaled to their respective Null distribution to generate a normalized pathway score.
Ligand-receptor analysis
For ligand-receptor analysis we used the CellPhoneDB (Version 2.0.5) tool with some modifications ((Vento-Tormo et al., 2018); Efremova et. al, 2020). Aiming to increase the amount of ligand-receptor pairs available, the original database was extended by OmniPath interactions which are publicly available (https://github.com/saezlab/cellphonedb_omnipath; Türei et al., 2016; (Ceccarelli et al., 2020)). We used log-normalized and scaled scRNA-seq matrices as input. Gene IDs were converted to ENSEMBl IDs using biomaRt (Version 1.2.0; (Durinck et al., 2009)) and EWCE (Version 0.99.2; (Skene and Grant, 2016)). Each data expression table was split based on the respective conditions (experiment versus control for murine datasets and MF versus control for the human dataset). Then, CellPhoneDB was executed for each dataset using the ‘statistical_analysis’. CPDB results were used to build Ligand Receptor networks. We only considered ligand receptor pairs which are expressed in at least 10% of cells of the corresponding cluster in mouse data. Due to the sparsity of the data and the presence of interactions specific to either the fibrotic or the non-fibrotic bone marrow, unfiltered LR lists were considered for human data. Only statistically significant interactions (p value < 0.05) were considered for further analyses. For network plots the expression differences for all inferred ligands and all inferred receptors were averaged for each pair of cell clusters. For individual LR interactions the difference in mean expression between fibrotic and non-fibrotic condition was calculated as described below. Next, we ranked the individual receptor (or ligands) by their number of interactions and normalized them to the number of all possible cell-cell interactions to identify the most influential receptor (ligand) regarding all conditions. For an exhaustive list of ligand-receptor pairs with corresponding statistics, refer to Table S5.
Quantification of S100A8 in human plasma samples
Plasma was isolated from whole blood anticoagulated with EDTA by centrifugation (2000 × g, 7 min) and stored at −80°C. Samples were thawed gently on ice and centrifuged for 5 min at 2500 × g before further processing. Samples were diluted 1:50 - 1:150 and S100A8 concentration was quantified using the Human S100A8 DuoSet ELISA (R&D Systems, DY4570-05) according to the manufacturer’s instructions. For each run samples with values outside of the respective standard curve were adjusted to the highest or lowest reliably measurable standard respectively.
Histological and immunohistological analysis
Murine organs were fixed in 4% paraformaldehyde for 24 h and transferred to 70% ethanol. Spleens were weighed before fixation. Femurs were decalcified in 10% EDTA/Tris-HCl (pH 6.6) solution for 72 h, dehydrated, and paraffin embedded. H&E and reticulin staining were performed on 4 μm sections according to established routine protocols.
Human bone marrow biopsies were fixed for 24 h using the Hannover Solution (12% buffered formaldehyde plus 64% methanol), decalcified (EDTA), dehydrated and embedded in paraffin. For the patients, whose material was used for scRNaseq, fixed and stained diagnostic slides were obtained via the Department of Pathology at Erasmus MC.
For immunohistochemical analysis of S100A8 and NCAM1 (CD56), antigen retrieval was performed using citrate-buffer in a conventional lab microwave (Vector, antigen unmasking solution). Sections were treated with 3% H2O2 and blocked with Avidin/Biotin blocking kit (Vector), and subsequently incubated with primary antibody (rabbit-anti-S100A8: ab92231, Abcam, 1:200; rabbit-anti-CD56: RBK050, Zytomed Systems, 1:100) for 1 h at room temperature. Biotinylated monoclonal goat anti-rabbit-antibody (Vector) was used as a secondary antibody for 30 min at room temperature. Slides were incubated with AB complex for 30 min at room temperature, washed, and incubated for a further 10 min with DAB substrate. Slides were counterstained with hematoxylin and mounted with glass coverslip using DPX mountant (Sigma).
Immunohistochemical stainings for S100b were performed with an automated, validated, and accredited staining system (Ventana Benchmark ULTRA, Ventana Medical Systems, Tucson, AZ, USA) using optiview universal DAB detection Kit (#760-700). In brief, following deparaffinization and heat-induced antigen retrieval the tissue samples were incubated with rabbit-anti-S100-antibody (DAKO) diluted 1:6000 for 16 min at 36°C. Incubation was followed by hematoxylin II counter-stain for 12 min and then a blue coloring reagent for 8 min according to the manufacturer’s instructions (Ventana).
Slides were scanned and digitized in an automated fashion using a Hamamatsu Nanozoomer 2.0 HT system. Images were analyzed and exported using the NDP.view software (Hamamatsu, V2.5.19).
Co-staining of human bone marrow samples for S100b/IL-33
Double immunostaining was performed by automated staining using a Bond RX immunostainer (Leica Biosystems). In brief, all slides were dewaxed in Bond dewax solution (#AR9222, Leica Biosystems). Heat-induced epitope retrieval was done at pH 9 in Tris buffer (#AR9640, Leica Biosystems) for 30 min. at 95°C. The primary antibodies were incubated sequentially. In a first step, goat anti-IL-33 antibody (#AF3626, R&D Systems) was diluted 1:400, incubated for 30 min, and a rabbit anti-goat antibody (#E0466, Dako) was used at a 1:400 dilution for 15 min as secondary antibody. All samples were subsequently incubated with horseradish peroxidase (HRP)-polymer for 15 min. and thereafter visualized using 3,3-Diaminobenzidine (DAB) as brown chromogen (#DS9800, bond polymer refine detection, Leica Biosystems) for 10 min. In a second step, a rabbit anti-S100 antibody (#Z0311, Dako) was diluted 1:6000 and incubated for 30 min. This antibody was detected using a kit solution containing a polymeric alkaline phosphatase (AP)- linker antibody conjugate system (for 15 min.) and visualized using fast red as red chromogen (#DS9390, red polymer refine detection, Leica Biosystems). Finally, the samples were counter-stained with Haematoxylin and mounted with Aquatex (#108562, Merck).
FACS-staining and sorting of MSC-1/2 and MSC-3/4 for functional analysis
Primary murine stromal cells were used at passage 1. The following fluorochrome conjugated antibodies were used: CD45-ef450 (BioLegend, 103125), CD11b-ef450 (ThermoFisher, 48-0112-80), CD140a-PE-Cy7 (BioLegend, 135911), CD140b-APC (ThermoFisher, 17-1402-82), CD106(VCAM-1)-PE (BioLegend, 105713), Lamp-1-FITC (BD PharMingen, 553793), CD63-APC-Cy7(BioLegend), and Hoechst 33342 (BD PharMingen, 561908) for live staining. Cells were sorted from the singlet alive CD45neg CD11bneg gate. MSC 1+2 was sorted as: CD140a+/CD140b+/VCAM-1+/CD63+/Lamp-1+. MSC 3+4 were sorted as: 1) CD140a+/CD140b+/VCAM-1+/CD63-/Lamp-1-, and as 2) CD140a-/CD140b-/VCAM-1+. Cells were either seeded directly for CFU-F assay or expanded in culture.
CFU-F assay
1,000 sort-purified primary cells were seeded per well in a 6-well adherent tissue culture plate using MesenCult Expansion Kit (STEMCELL Technologies), in the presence of MesenPure (STEMCELL Technologies), and 0.5% penicillin-streptomycin. On day 15, cells were stained with Giemsa (Merck) according to standard protocol and colonies were counted manually.
Growth curve
Sorted cells were cultured in alpha-MEM, 10% FCS, 1% Penicillin/Streptomycin, 1ng/ml murine bFGF (Peprotech, #450-33), 5ng/ml murine EGF (Peprotech #315-09) in a 6-well plate. Twice a week cells were counted and replated in the same concentration (20.000 cells/well).
Recombinant cytokine stimulation of primary murine stromal cells
For recombinant cytokine stimulation, primary stromal cells were seeded at 40,000 cells/well in a 6-well plate and stimulated with recombinant human TGF-β (10ng/ml, Invivogen) for 72 h. Cells were harvested using TriZol (ThermoFisher) and processed for RNA extraction. 500ng of total RNA was reversely transcribed using the high-capacity cDNA Reverse Transcription kit (Applied Biosystems). Quantitative polymerase chain reactions were performed with SYBRGreen PCR master mix (ThermoFisher) on an Applied Biosystems 7500 Real-Time PCR System. Glyceraldehyde-3-phosphate dehydrogenase (Gapdh) was used as a housekeeping gene. Differences in RNA levels were calculated using the 2ˆ-ΔΔCT method. Primer sequences can be found in the Key Resources Table.
MSC to SCP transition
Harvested MSCs were cultured in glutamine-free α-MEM (Sigma) containing 15% FCS.
MSCs at passage 8 were seeded at 100,000 cells/mL in 1:1 (v/v) DMEM/F12 and Neurobasal medium (Invitrogen) with basic fibroblast growth factor (bFGF; 40 ng/mL; Peprotech), epidermal growth factor (20 ng/mL; Peprotech), and B27 (2%, v/v, Invitrogen) in ultra-low-attachment poly(2-hydroxyethyl methacrylate)-coated culture plates (Corning). Medium was replenished every two days. This non-adherent fraction was maintained until the neurospheres reached the size of 80-120μm. The neurospheres were seeded onto poly-L-lysine/laminin-coated culture dishes with a density of 8–10 spheres/cm2. Cultures were maintained in glutamine-free α-MEM (Sigma) containing 10% FCS and glia inducing factors including forskolin (5 μM; Sigma), platelet-derived growth factor (PDGF)-AA (5 ng/mL; Peprotech), bFGF (10 ng/mL; Peprotech), and β-heregulin (200 ng/mL; Millipore) for 10 days. Medium was refreshed every 3 days.
Treatment of mice with Tasquinimod
WT recipient mice (n = 7-10/group) were lethally irradiated (10.5Gy) and transplanted with c-kit+ HSPCs that were retrovirally transduced with either JAK2V617F- or JAK2WT as described above. Tasquinimod treatment (ABR-215050, Biorbyt) was administered via drinking water at 30mg/kg/day dissolved in 3% sucrose in autoclaved water. Tasquinimod was first dissolved in DMSO, then mixed with 3% sucrose, 2% PEG300 (Sigma) in water. Vehicle-treated groups received DMSO-, PEG300-treated water with 3% sucrose. Drinking bottles were renewed twice a week. Treatment was started at 5 weeks post-transplant until 10 weeks post-transplant and resumed at 13 weeks post-transplant until sacrifice.
Treatment of cells with Tasquinimod
For in vitro studies using Tasquinimod, 20,000 Gli1+ tdTom+ stromal cells were seeded per well in a 6-well plate, in aMEM supplemented by 20% FCS, 1ng/ml bFGF (Peprotech, #450-33), 5 ng/ml murine EGF (Peprotech #315-09). At 24 and 48 h after seeding, cells were treated with recombinant TGF-β (10ng/ml, Invivogen) or PBS control, followed by Tasquinimod treatment (50uM) or DMSO control. For confocal imaging of in vitro Tasquinimod experiments, Gli1+ tdTom+ stromal cells (20,000 cells/well in 6-well plate) were cultured on glass coverslips and treated as described above. At 72 h post-seeding, cells were fixed in 4% paraformaldehyde for 10 min at room temperature. Cells were stained with mouse primary antibody αSMA-FITC (1:100, Sigma, F3777), counterstained with DAPI (4′,6′-′diamidino-2-phenylindole) and mounted in Prolong Diamond. Images were obtained by confocal microscopy on a Leica SP8 microscope.
Image processing
All plots were generated with GraphPad Prism Version 8.0 or R Version 3.6.1. To ensure readability line thickness, labels and font size were adjusted manually using Adobe Illustrator CC 2018. For joint plotting only identically scaled graphs were used. Unless otherwise specified, images were representatively chosen and jointly rescaled, before manual alignment if necessary.
Quantification and statistical analysis
Statistical analysis - excluding that for single cell RNaseq data - was conducted using either GraphPad Prism Version 8.0 or R Version 3.6.1. Unless otherwise specified, data are presented as mean ± SEM. Two independent groups with (approximately) normally distributed samples were compared with an unpaired t test. When normality could not be assumed, Wilcoxon Rank Sum test was used. For ≥ 2 groups and continuous response variables, ANOVA was employed with post hoc paired t test and Holm-Bonferroni correction for multiple hypothesis testing. For ≥ 2 groups and discrete/ordinal response variables, Kruskal-Wallis H test with post hoc pairwise Wilcoxon Rank Sum test was performed.
For trend analysis the Jonckheere-Terpstra-test was employed. p values were calculated for each researcher independently and corrected for multiple hypothesis testing by the Benjamini–Hochberg procedure.
p values lower or equal to 0.05 were considered statistically significant. Significance is depicted throughout the manuscript as follows: p ≤ 0.05: ∗; p ≤ 0.01: ∗∗; p ≤ 0.0001: ∗∗∗.
Acknowledgments
R.K. was supported by grants from the Deutsche Forschungsgemeinschaft German Research Foundation (DFG; SCHN1188/5-1, SFBTRR219, and SFBTRR57), a grant from the European Research Council (ERC-StG 677448), and a grant from the Interdisciplinary Centre for Clinical Research (IZKF) within the faculty of Medicine at the RWTH Aachen University (O3-11). R.K.S. is an Oncode Institute investigator and was supported by grants from the MPN Foundation (2017 MPNRF/LLS Award), a KWF Kankerbestrijding young investigator grant (11031/2017–1, Bas Mulder Award; Dutch Cancer Foundation), and an ERC grant (deFIBER; ERC-StG 757339). This work was in part supported by grants of the Deutsche Forschungsgemeinschaft (DFG) (German Research Foundation) to R.K. (KR 4073/9-1), R.K.S. (SCHN1188/6-1), T.B. (BR1782/5-1), S.K. (KO2155/7-1), and I.C. (GE2811/4-1) within the clinical research unit CRU344. R.K., I.G.C., and R.K.S. are members of the E:MED Consortia Fibromap funded by the German Ministry of Education and Science (BMBF). P.B. was financially supported by DFG (SFB/TRR57, SFB/TRR219, BO3755/6-1), BMBF (STOP-FSGS-01GM1901A), and the IZKF (O3-2). N.B.L. was supported DFG (BA 6349/1-1). H.F.E.G. was supported by the European Union’s Horizon 2020 research and innovation program under a Marie Curie-Sklodowska grant (707404 LEaDing Fellow). I.G.C. was supported by an IZKF grant (E8-15). We thank the team of the Translational Research Unit of the Institute of Pathology of the University of Bern as well as the team of the Institute for Clinical Chemistry, Molecular Diagnostics and Pathology (PARTS) at Erasmus Medical Center, Rotterdam. We further would like to thank Remco Hoogenboezem for excellent support in processing raw sequencing data for downstream analysis.
Author contributions
N.B.L. and H.F.E.G. designed and carried out experiments, analyzed results, and wrote the manuscript. L.R. performed the biocomputational analysis, interpreted the results, and wrote the manuscript. I.A.M.S., J.S.N., S.F., C.K., U.S.A.S., B.B., and E.B. performed experiments, analyzed, interpreted data, and reviewed the manuscript. G.B., H.K., I.G., P.K., T.V., K.H.L. Y.B., P.B., E.W.-Y.T., T.H.B., S.K., and M.C. selected patient specimens, performed stainings on murine and human tissues, and reviewed the manuscript. R.K., I.G.C., and R.K.S. obtained funding, designed the study, performed experiments, analyzed data, and wrote the manuscript. All authors provided critical analysis of the manuscript.
Declaration of interests
The authors declare no competing interests.
Published: December 9, 2020; Corrected online: December 10, 2020
Footnotes
Supplemental information can be found online at https://doi.org/10.1016/j.stem.2020.11.004.
Supplemental information
References
- Alvarez M., Shen Y., Giorgi F. Functional characterization of somatic mutations in cancer using network-based inference of protein activity. Nat Genet. 2016;48:838–847. doi: 10.1038/ng.3593. [DOI] [PMC free article] [PubMed] [Google Scholar]
- Baccin C., Al-Sabah J., Velten L., Helbling P.M., Grünschläger F., Hernández-Malmierca P., Nombela-Arrieta C., Steinmetz L.M., Trumpp A., Haas S. Combined single-cell and spatial transcriptomics reveal the molecular, cellular and spatial bone marrow niche organization. Nat. Cell Biol. 2020;22:38–48. doi: 10.1038/s41556-019-0439-6. [DOI] [PMC free article] [PubMed] [Google Scholar]
- Barbui T., Thiele J., Gisslinger H., Kvasnicka H.M., Vannucchi A.M., Guglielmelli P., Orazi A., Tefferi A. The 2016 WHO classification and diagnostic criteria for myeloproliferative neoplasms: document summary and in-depth discussion. Blood Cancer J. 2018;8:15. doi: 10.1038/s41408-018-0054-y. [DOI] [PMC free article] [PubMed] [Google Scholar]
- Baryawno N., Przybylski D., Kowalczyk M.S., Kfoury Y., Severe N., Gustafsson K., Kokkaliaris K.D., Mercier F., Tabaka M., Hofree M. A Cellular Taxonomy of the Bone Marrow Stroma in Homeostasis and Leukemia. Cell. 2019;177:1915–1932. doi: 10.1016/j.cell.2019.04.040. [DOI] [PMC free article] [PubMed] [Google Scholar]
- Breitbach M., Bostani T., Roell W., Xia Y., Dewald O., Nygren J.M., Fries J.W.U., Tiemann K., Bohlen H., Hescheler J. Potential risks of bone marrow cell transplantation into infarcted hearts. Blood. 2007;110:1362–1369. doi: 10.1182/blood-2006-12-063412. [DOI] [PubMed] [Google Scholar]
- Butler A., Hoffman P., Smibert P., Papalexi E., Satija R. Integrating single-cell transcriptomic data across different conditions, technologies, and species. Nat. Biotechnol. 2018;36:411–420. doi: 10.1038/nbt.4096. [DOI] [PMC free article] [PubMed] [Google Scholar]
- Cai S., Tsui Y.P., Tam K.W. Directed Differentiation of Human Bone Marrow Stromal Cells to Fate-Committed Schwann Cells. Stem Cell Reports. 2017;9:1097–1108. doi: 10.1016/j.stemcr.2017.08.004. [DOI] [PMC free article] [PubMed] [Google Scholar]
- Ceccarelli Francesco, Turei Denes, Gabor Attila, Saez-Rodriguez Julio. Bringing data from curated pathway resources to Cytoscape with OmniPath. Bioinformatics. 2020;36:2632–2633. doi: 10.1093/bioinformatics/btz968. [DOI] [PubMed] [Google Scholar]
- Curto-Garcia N., Harrison C., McLornan D.P. Bone marrow niche dysregulation in myeloproliferative neoplasms. Haematologica. 2020;105:1189–1200. doi: 10.3324/haematol.2019.243121. [DOI] [PMC free article] [PubMed] [Google Scholar]
- Decker M., Martinez-Morentin L., Wang G., Lee Y., Liu Q., Leslie J., Ding L. Leptin-receptor-expressing bone marrow stromal cells are myofibroblasts in primary myelofibrosis. Nat. Cell Biol. 2017;19:677–688. doi: 10.1038/ncb3530. [DOI] [PMC free article] [PubMed] [Google Scholar]
- Durinck S., Spellman P., Birney E. Mapping identifiers for the integration of genomic datasets with the R/Bioconductor package biomaRt. Nat Protoc. 2009;4:1184–1191. doi: 10.1038/nprot.2009.97. [DOI] [PMC free article] [PubMed] [Google Scholar]
- Efremova M., Vento-Tormo M., Teichmann S.A., Vento-Tormo R. CellPhoneDB: inferring cell-cell communication from combined expression of multi-subunit ligand-receptor complexes. Nat. Protoc. 2020;15:1484–1506. doi: 10.1038/s41596-020-0292-x. [DOI] [PubMed] [Google Scholar]
- El Agha E., Kramann R., Schneider R.K., Li X., Seeger W., Humphreys B.D., Bellusci S. Mesenchymal Stem Cells in Fibrotic Disease. Cell Stem Cell. 2017;21:166–177. doi: 10.1016/j.stem.2017.07.011. [DOI] [PubMed] [Google Scholar]
- Friedman S.L., Sheppard D., Duffield J.S., Violette S. Therapy for fibrotic diseases: nearing the starting line. Sci. Transl. Med. 2013;5:167sr1. doi: 10.1126/scitranslmed.3004700. [DOI] [PubMed] [Google Scholar]
- Gleitz H.F.E., Dugourd A.J.F., Leimkühler N.B., Snoeren I.A.M., Fuchs S.N.R., Menzel S., Ziegler S., Kröger N., Triviai I., Büsche G. Increased CXCL4 expression in hematopoietic cells links inflammation and progression of bone marrow fibrosis in MPN. Blood. 2020;136:2051–2064. doi: 10.1182/blood.2019004095. [DOI] [PMC free article] [PubMed] [Google Scholar]
- Isaacs J.T., Pili R., Qian D.Z., Dalrymple S.L., Garrison J.B., Kyprianou N., Björk A., Olsson A., Leanderson T. Identification of ABR-215050 as lead second generation quinoline-3-carboxamide anti-angiogenic agent for the treatment of prostate cancer. Prostate. 2006;66:1768–1778. doi: 10.1002/pros.20509. [DOI] [PubMed] [Google Scholar]
- Isern J., García-García A., Martín A.M., Arranz L., Martín-Pérez D., Torroja C., Sánchez-Cabo F., Méndez-Ferrer S. The neural crest is a source of mesenchymal stem cells with specialized hematopoietic stem cell niche function. eLife. 2014;3:e03696. doi: 10.7554/eLife.03696. [DOI] [PMC free article] [PubMed] [Google Scholar]
- Ito H., Yan X., Nagata N., Aritake K., Katsumata Y., Matsuhashi T., Nakamura M., Hirai H., Urade Y., Asano K. PGD2-CRTH2 pathway promotes tubulointerstitial fibrosis. J. Am. Soc. Nephrol. 2012;23:1797–1809. doi: 10.1681/ASN.2012020126. [DOI] [PMC free article] [PubMed] [Google Scholar]
- Kotsiou O.S., Gourgoulianis K.I., Zarogiannis S.G. IL-33/ST2 Axis in Organ Fibrosis. Front. Immunol. 2018;9:2432. doi: 10.3389/fimmu.2018.02432. [DOI] [PMC free article] [PubMed] [Google Scholar]
- Kramann R., Schneider R.K., DiRocco D.P., Machado F., Fleig S., Bondzie P.A., Henderson J.M., Ebert B.L., Humphreys B.D. Perivascular Gli1+ progenitors are key contributors to injury-induced organ fibrosis. Cell Stem Cell. 2015;16:51–66. doi: 10.1016/j.stem.2014.11.004. [DOI] [PMC free article] [PubMed] [Google Scholar]
- Kunter U., Rong S., Boor P., Eitner F., Müller-Newen G., Djuric Z., van Roeyen C.R., Konieczny A., Ostendorf T., Villa L. Mesenchymal stem cells prevent progressive experimental renal failure but maldifferentiate into glomerular adipocytes. J. Am. Soc. Nephrol. 2007;18:1754–1764. doi: 10.1681/ASN.2007010044. [DOI] [PubMed] [Google Scholar]
- McCarthy D.J., Chen Y., Smyth G.K. Differential expression analysis of multifactor RNA-Seq experiments with respect to biological variation. Nucleic Acids Res. 2012;40:4288–4297. doi: 10.1093/nar/gks042. [DOI] [PMC free article] [PubMed] [Google Scholar]
- Méndez-Ferrer S., Bonnet D., Steensma D.P., Hasserjian R.P., Ghobrial I.M., Gribben J.G., Andreeff M., Krause D.S. Bone marrow niches in haematological malignancies. Nat. Rev. Cancer. 2020;20:285–298. doi: 10.1038/s41568-020-0245-2. [DOI] [PMC free article] [PubMed] [Google Scholar]
- Meng X.-M., Nikolic-Paterson D.J., Lan H.Y. TGF-β: the master regulator of fibrosis. Nat. Rev. Nephrol. 2016;12:325–338. doi: 10.1038/nrneph.2016.48. [DOI] [PubMed] [Google Scholar]
- Mullally A., Lane S.W., Brumme K., Ebert B.L. Myeloproliferative neoplasm animal models. Hematol. Oncol. Clin. North Am. 2012;26:1065–1081. doi: 10.1016/j.hoc.2012.07.007. [DOI] [PMC free article] [PubMed] [Google Scholar]
- Naba A., Clauser K.R., Ding H., Whittaker C.A., Carr S.A., Hynes R.O. The extracellular matrix: Tools and insights for the “omics” era. Matrix Biol. 2016;49:10–24. doi: 10.1016/j.matbio.2015.06.003. [DOI] [PMC free article] [PubMed] [Google Scholar]
- Qiu X., Hill A., Packer J., Lin D., Ma Y.-A., Trapnell C. Single-cell mRNA quantification and differential analysis with Census. Nat. Methods. 2017;14:309–315. doi: 10.1038/nmeth.4150. [DOI] [PMC free article] [PubMed] [Google Scholar]
- Rampal R., Al-Shahrour F., Abdel-Wahab O., Patel J.P., Brunel J.-P., Mermel C.H., Bass A.J., Pretz J., Ahn J., Hricik T. Integrated genomic analysis illustrates the central role of JAK-STAT pathway activation in myeloproliferative neoplasm pathogenesis. Blood. 2014;123:e123–e133. doi: 10.1182/blood-2014-02-554634. [DOI] [PMC free article] [PubMed] [Google Scholar]
- Ribezzo F., Snoeren I.A.M., Ziegler S., Stoelben J., Olofsen P.A., Henic A., Ferreira M.V., Chen S., Stalmann U.S.A., Buesche G. Rps14, Csnk1a1 and miRNA145/miRNA146a deficiency cooperate in the clinical phenotype and activation of the innate immune system in the 5q- syndrome. Leukemia. 2019;33:1759–1772. doi: 10.1038/s41375-018-0350-3. [DOI] [PubMed] [Google Scholar]
- Satija R., Farrell J.A., Gennert D., Schier A.F., Regev A. Spatial reconstruction of single-cell gene expression data. Nat. Biotechnol. 2015;33:495–502. doi: 10.1038/nbt.3192. [DOI] [PMC free article] [PubMed] [Google Scholar]
- Schneider R.K., Schenone M., Ferreira M.V., Kramann R., Joyce C.E., Hartigan C., Beier F., Brümmendorf T.H., Germing U., Platzbecker U. Rps14 haploinsufficiency causes a block in erythroid differentiation mediated by S100A8 and S100A9. Nat. Med. 2016;22:288–297. doi: 10.1038/nm.4047. [DOI] [PMC free article] [PubMed] [Google Scholar]
- Schneider R.K., Mullally A., Dugourd A., Peisker F., Hoogenboezem R., Van Strien P.M.H., Bindels E.M., Heckl D., Büsche G., Fleck D. Gli1+ Mesenchymal Stromal Cells Are a Key Driver of Bone Marrow Fibrosis and an Important Cellular Therapeutic Target. Cell Stem Cell. 2017;20:785–800. doi: 10.1016/j.stem.2017.03.008. [DOI] [PMC free article] [PubMed] [Google Scholar]
- Schubert M., Klinger B., Klünemann M., Sieber A., Uhlitz F., Sauer S., Garnett M.J., Blüthgen N., Saez-Rodriguez J. Perturbation-response genes reveal signaling footprints in cancer gene expression. Nat. Commun. 2018;9:20. doi: 10.1038/s41467-017-02391-6. [DOI] [PMC free article] [PubMed] [Google Scholar]
- Skene N.G., Grant S.G. Identification of Vulnerable Cell Types in Major Brain Disorders Using Single Cell Transcriptomes and Expression Weighted Cell Type Enrichment. Front Neurosci. 2016 doi: 10.3389/fnins.2016.00016. [DOI] [PMC free article] [PubMed] [Google Scholar]
- Subramanian A., Tamayo P., Mootha V.K., Mukherjee S., Ebert B.L., Gillette M.A., Paulovich A., Pomeroy S.L., Golub T.R., Lander E.S., Mesirov J.P. Gene set enrichment analysis: a knowledge-based approach for interpreting genome-wide expression profiles. Proc. Natl. Acad. Sci. USA. 2005;102:15545–15550. doi: 10.1073/pnas.0506580102. [DOI] [PMC free article] [PubMed] [Google Scholar]
- Supek F., Bošnjak M., Škunca N., Šmuc T. REVIGO summarizes and visualizes long lists of gene ontology terms. PLoS ONE. 2011;6:e21800. doi: 10.1371/journal.pone.0021800. [DOI] [PMC free article] [PubMed] [Google Scholar]
- Tikhonova A.N., Dolgalev I., Hu H., Sivaraj K.K., Hoxha E., Cuesta-Domínguez Á., Pinho S., Akhmetzyanova I., Gao J., Witkowski M. The bone marrow microenvironment at single-cell resolution. Nature. 2019;569:222–228. doi: 10.1038/s41586-019-1104-8. [DOI] [PMC free article] [PubMed] [Google Scholar]
- Trapnell C., Cacchiarelli D., Grimsby J., Pokharel P., Li S., Morse M., Lennon N.J., Livak K.J., Mikkelsen T.S., Rinn J.L. The dynamics and regulators of cell fate decisions are revealed by pseudotemporal ordering of single cells. Nat. Biotechnol. 2014;32:381–386. doi: 10.1038/nbt.2859. [DOI] [PMC free article] [PubMed] [Google Scholar]
- Türei D., Korcsmáros T., Saez-Rodriguez J. OmniPath: guidelines and gateway for literature-curated signaling pathway resources. Nat. Methods. 2016;13:966–967. doi: 10.1038/nmeth.4077. [DOI] [PubMed] [Google Scholar]
- Vainchenker William, Plo Isabelle. EZH2: A Molecular Switch of the MPN Phenotype. Blood. 2016;127:3297–3298. doi: 10.1182/blood-2016-04-711770. [DOI] [PubMed] [Google Scholar]
- Vainchenker W., Delhommeau F., Constantinescu S.N., Bernard O.A. New mutations and pathogenesis of myeloproliferative neoplasms. Blood. 2011;118:1723–1735. doi: 10.1182/blood-2011-02-292102. [DOI] [PubMed] [Google Scholar]
- Vento-Tormo R., Efremova M., Botting R.A. Single-cell reconstruction of the early maternal–fetal interface in humans. Nature. 2018;563:347–353. doi: 10.1038/s41586-018-0698-6. [DOI] [PMC free article] [PubMed] [Google Scholar]
- Vogl T., Stratis A., Wixler V., Völler T., Thurainayagam S., Jorch S.K., Zenker S., Dreiling A., Chakraborty D., Fröhling M. Autoinhibitory regulation of S100A8/S100A9 alarmin activity locally restricts sterile inflammation. J. Clin. Invest. 2018;128:1852–1866. doi: 10.1172/JCI89867. [DOI] [PMC free article] [PubMed] [Google Scholar]
- Wu H., Gordon J.A.R., Whitfield T.W., Tai P.W.L., van Wijnen A.J., Stein J.L., Stein G.S., Lian J.B. Chromatin dynamics regulate mesenchymal stem cell lineage specification and differentiation to osteogenesis. Biochim. Biophys. Acta. Gene Regul. Mech. 2017;1860:438–449. doi: 10.1016/j.bbagrm.2017.01.003. [DOI] [PMC free article] [PubMed] [Google Scholar]
- Yamazaki S., Ema H., Karlsson G., Yamaguchi T., Miyoshi H., Shioda S., Taketo M.M., Karlsson S., Iwama A., Nakauchi H. Nonmyelinating Schwann cells maintain hematopoietic stem cell hibernation in the bone marrow niche. Cell. 2011;147:1146–1158. doi: 10.1016/j.cell.2011.09.053. [DOI] [PubMed] [Google Scholar]
- Yang Y., Akada H., Nath D., Hutchison R.E., Mohi G. Loss of Ezh2 cooperates with Jak2V617F in the development of myelofibrosis in a mouse model of myeloproliferative neoplasm. Blood. 2016;127:3410–3423. doi: 10.1182/blood-2015-11-679431. [DOI] [PMC free article] [PubMed] [Google Scholar]
- Yu G., Wang L.-G., Han Y., He Q.-Y. clusterProfiler: an R package for comparing biological themes among gene clusters. OMICS. 2012;16:284–287. doi: 10.1089/omi.2011.0118. [DOI] [PMC free article] [PubMed] [Google Scholar]
- Zambetti N.A., Ping Z., Chen S., Kenswil K.J.G., Mylona M.A., Sanders M.A., Hoogenboezem R.M., Bindels E.M.J., Adisty M.N., Van Strien P.M.H. Mesenchymal Inflammation Drives Genotoxic Stress in Hematopoietic Stem Cells and Predicts Disease Evolution in Human Pre-leukemia. Cell Stem Cell. 2016;19:613–627. doi: 10.1016/j.stem.2016.08.021. [DOI] [PubMed] [Google Scholar]
Associated Data
This section collects any data citations, data availability statements, or supplementary materials included in this article.
Supplementary Materials
Data Availability Statement
Single cell sequencing experiments are deposited at GEO with accession number GEO: GSE156644. Seurat objects of datasets, sample markdown code and tables with complete marker genes, differential expression, gene expression enrichment analysis and ligand receptor analysis are deposited at Zenodo (https://doi.org/10.5281/zenodo.3979087).