

Abstract
Dental pulp stem cells (DPSCs) are the primary stem cell source for regenerative endodontics. DPSCs need to undergo a polarization process and retain the permanent polarization status to perform the function of odontoblasts. However, the factors that control DPSC polarization and its underlying mechanism remain unknown. In this study, we established a unique nanofibrous tubular three-dimensional (3D) platform to explore DPSC polarization. The 3D platform has a “clean” background and confines one single DPSC in each microisland of the platform; therefore, it is capable of deciphering any signal that initiates or regulates DPSC polarization. Using the biomimetic platform, we identified that the nanofibrous tubular architecture is the crucial factor to initiate DPSC polarization. Dynamic morphological observation showed that the cellular process of the polarized DPSCs continuously extended and reached a plateau at 72 h. Meanwhile, Golgi apparatus, a cell polarization marker, continuously moved from a juxtanuclear region, passed the nucleus, and eventually settled down at a final position that was a few micrometers away from the nucleus. Inhibition of microfilament and microtubule polymerization demonstrated the indispensable role of cytoskeleton reorganization in modulating DPSC polarization. In addition, cell tension was involved in the regulation of DPSC polarization. The findings of this work expand the in-depth understanding of DPSC polarization, which helps design new bioinspired materials for regenerative endodontics.
Keywords: polarization, odontoblast, micropattern, tubular dentin, dental pulp stem cell, nanofiber
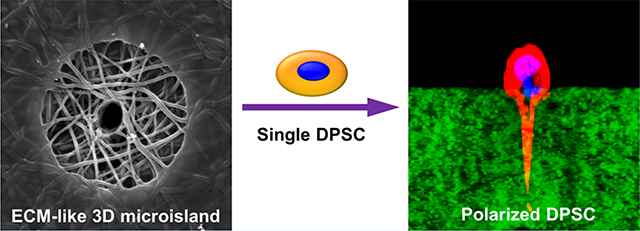
Graphical Abstract
1. INTRODUCTION
Cell polarization touches on essentially every aspect of cell and developmental biology.1,2 Many progenitor/stem cells undergo a polarization process to achieve destined cellular fates and retain the permanent polarization status to perform their functions. One typical example is odontoblasts—one of the major building blocks in forming a healthy tooth. Following a polarization process, a mature odontoblast displays a unique cell morphology, characterized by a columnar cell body aligned at the periphery of dental pulp and a long cytoplasmic process extending from the cell body to a dentinal tubule that can be as long as several hundred micrometers. The polarization of odontoblasts is a prerequisite for odontoblast differentiation and the formation of tubular dentin that is crucial for maintaining the normal biological functions of a tooth.3,4
Dental pulp stem cells (DPSCs) are the mesenchymal stem cells in dental pulp tissue and the primary cell source for odontoblasts.5 DPSCs have been extensively explored for dental tissue regeneration.6–9 Under certain conditions, DPSCs have been observed to polarize and differentiate into odontoblasts that further form tubular dentin.10–13 However, the factors that control DPSC polarization and the underlying mechanism remain unknown. Because of this knowledge gap, most of the tissue engineering approaches using DPSCs for regenerative endodontics only regenerated nontubular bone-like tissues that could not fulfill desired biological functions.14–16 Therefore, it is of great significance to dissect the factors that control DPSC polarization and understand the underlying mechanism.
It is widely accepted that DPSC polarization and modulation is controlled by a dynamic signaling network composed of biophysical/biochemical factors and cell—cell interactions. Considering the complexity and numerous interfering factors in the body, an in vivo model is not a feasible choice to address the above challenges. Hence, the development of an appropriate in vitro platform is pivotal in dissecting the factors that control DPSC polarization. Although the dental basement membrane was used as an in vitro substrate to study odontoblast polarization,17 the membrane is a mixture of a variety of unknown components that severely interfere with the outcome. Furthermore, the basement membrane platform cannot exclude the effect of cell–cell interaction from other biophysical and/or biochemical factors on DPSC polarization. Meanwhile, most synthetic in vitro platforms for cell–material interactions are two-dimensional (2D) and cannot replicate the complex fibrous three-dimensional (3D) meshwork microenvironment in vivo.18 In addition, these platforms are usually composed of nonbiodegradable materials, such as polystyrene, polydimethylsiloxane, and polyacrylamide, and cannot mimic the compositions of the natural extracellular matrix (ECM). Therefore, there is an unmet need to develop a “clean” 3D in vitro platform that not only mimics the cellular microenvironment but also is capable of deciphering the signals that initiate and regulate single DPSC polarization.
Recently, we developed a unique approach that integrates the processes of nanofabrication, micropatterning, and computer-assisted laser ablation to create a bioinspired, nanofibrous tubular 3D matrix.19 This biomimetic matrix provides an excellent platform for studying DPSC polarization. First, this platform is entirely composed of gelatin; therefore, it provides a “clean” background that excludes the interference of various components in natural dentin matrix, making it an excellent platform to identify any factor that regulates DPSC polarization. Second, this platform mimics the chemical composition of dentin matrix because gelatin is derived from collagen and has almost the same chemical composition as the collagen that is the dominant organic component of dentin matrix.20 Third, this platform is composed of a 3D nanofibrous network; therefore, it also mimics the physical architecture of dentin matrix. Fourth, the 3D platform accurately confines one single cell in each microisland of the platform; therefore, it eliminates the interference of cell–cell contact communications when studying single DPSC polarization. Using this biomimetic 3D platform, we successfully initiated DPSC polarization and recorded the dynamic polarization process at the single cell level in this study. Our work demonstrates that the tubular structure of the nanofibrous 3D matrix is the essential biophysical factor to initiate DPSC polarization.
2. RESULTS AND DISCUSSION
We developed a unique approach that integrates nanofabrication, micropatterning, and laser ablation to generate a bioinspired, nanofibrous tubular 3D platform for DPSC polarization (Figure 1A). First, a nanofibrous methacrylate-modified gelatin (GelMA) matrix was fabricated using an electrospinning process. The addition of GelMA into the gelatin matrix introduced double bonds in the substrate of the platform, therefore facilitating chemical cross-linking with polyethylene glycol diacrylate (PEGDA) to create a stable cellular nonadhesive background for the nanofibrous platform. After PEGDA was cast onto the matrix surface, a UV-induced photolithography process was performed to form a micropatterned matrix. Finally, a computer-assisted laser ablation technology was used to create a 3D nanofibrous micropatterned tubular (NF-MT) platform. Figure 1B,C shows well-organized circular microislands with a diameter of 25 μm surrounded by a layer of PEGDA that covered the rest of the surface on the platform. The size and shape of the microislands were precisely controlled by the photomask used during photolithography. Each microisland of the matrix was composed of gelatin nanofibers with an average diameter of approximately 200 nm, which is at the same scale as the collagen fibers in natural ECM (Figure 1D). In addition, each microisland possessed one tubule with the size of 4.5 ± 0.7 μm, which is at the same range of a natural dentinal tubule.21 Therefore, the tubular microisland of the 3D platform resembled the architecture and composition of natural dentin matrix. In other words, this bioinspired 3D platform offered a “clean” and biomimetic environment that enabled us to examine the polarization of a single DPSC.
Figure 1.

Fabrication and characterization of the bioinspired nanofibrous tubular 3D platform. (A) Schematic illustration of the fabrication of the nanofibrous tubular 3D platform. (B) SEM image of the 3D platform. (C) High magnification of (B), showing one microisland of the 3D platform. (D) High magnification of the microisland, showing ECM-like nanofibers. The magnifications of (B–D) are ×400, ×2000, and ×5000, respectively.
The micropatterned 3D platform had excellent capability to constrain DPSCs within the microislands (Figure S1). Moreover, when DPSCs were seeded on 25 μm microislands, both a high cell occupation ratio and a high single cell ratio were obtained (Figure S1). There was no difference of DPSC adhesion on the nontubular and tubular microislands, indicating that the laser ablation process had negligible influence on the constraining effect or biocompatibility of the microislands. Therefore, the 3D tubular platform with the microislands of 25 μm was used to examine single DPSC polarization in this study.
As shown in Figure 2B, a DPSC cultured on a tubular microisland for 72 h exhibited a stereoscopic spherical morphology. The cross-sectional image, which was obtained by embedding and cryosectioning the matrix, displayed a long cellular process that extended deeply in the tubule (Figure 2C). A confocal image further confirmed the morphology of the cellular process and illustrated the position of the nucleus that was located at the basal pole of the cell body (Figure 2D). This result shows that the DPSC was successfully polarized by the 3D tubular microisland.
Figure 2.

Morphologies of single DPSCs cultured on tubular (A–D) and nontubular microislands (E–H). Top-view SEM morphology of a tubular microisland (A) and a nontubular microisland (E) before DPSC seeding. Top-view SEM morphologies of a tubular microisland (B) and a nontubular microisland (F) with single seeded DPSCs. Cross-sectional view morphologies of a tubular microisland (C) and a nontubular microisland (G) with single seeded DPSCs under a confocal microscope. Both the top-view and the cross-sectional view morphologies of a tubular microisland (D) and a nontubular microisland (H) with single seeded DPSCs obtained with a confocal microscope stack mode. In (C,D,G,H), red represents phalloidin-633-conjugated actin filaments, green represents FITC-conjugated gelatin nanofibers, and blue represents nuclei.
To understand whether the tubular structure is the essential factor to initiate DPSC polarization, a single DPSC was seeded on the same microisland without a tubule (Figure 2E). As shown in Figure 2F, the DPSC was well spread and occupied most of the area on the microisland. However, the cross-sectional image indicated that the DPSC presented a spindle morphology without forming any process (Figure 2G). A confocal image further confirmed that the DPSC was not polarized on the nontubular microisland (Figure 2H). This result demonstrated that the tubular structure of the 3D platform is the crucial factor in initiating DPSC polarization.
Gelatin is transparent in an aqueous solution, and thus it allowed us to conveniently observe cells embedded in the gelatin matrix using optical microscopies. To take advantage of the feature, we further explored the dynamic changes of cellular components during DPSC polarization using high-resolution confocal microscopy. First, two cell adhesion markers (integrin β1 and vinculin) were selected to examine DPSC adhesion in the tubular microisland. Only weak expressions of both markers were detected on the cell–nanofiber interface (Figure 3A,B). Integrin β1 (a trans-membrane protein) and vinculin (a cytoplasmic protein) are the components of the membrane-associated adhesion complexes that tether cells to the ECM and transfer extracellular signals into cells.22 The low expression pattern of cell adhesion markers was observed in many other 3D cell culture systems and is probably owed to the point-to-point contact between the cells and nanofibers.23,24
Figure 3.

Confocal cross-sectional images showing the cellular components of a single DPSC on a tubular microisland. Cell adhesion markers integrin β1 (A) and vinculin (B). Cytoskeletal components, microtubule (C) and intermediate filament vimentin (D). Mitochondria distribution (E) and collagen expression (F) within a DPSC. Red represents phalloidin-633-conjugated actin filaments, green represents FITC-conjugated nanofibers, blue represents nuclei, and yellow indicates integrin β1 (A), vinculin (B), β-tubulin (C), vimentin (D), mitochondria (E), and collagen I (F).
Next, the distributions of three cytoskeletal components (microfilament, microtubule, and intermediate filament) were also examined during DPSC polarization. As shown in Figure 3C,D, microtubules (yellow, represented by β-tubulin) and intermediate filaments (yellow, represented by vimentin) were strongly expressed along the edge of the polarized DPSC, including the long cell process. In addition, the expressions of microtubules and intermediate filaments were closely accompanied by that of microfilaments (red, represented by actin), indicating the functional participation of the three cytoskeletal elements in the cytological activities of the DPSC. The cytoskeleton distribution pattern of the polarized DPSC was identical to that of the polarized odontoblast in vivo.25
Apart from forming cellular processes, cytoskeletal elements of polarized odontoblasts were previously found to concentrate on the apical pole (process pole) of cells, indicating their functional participation in secretory activity.25 One organelle indispensable for the function of odontoblasts is mitochondria, whose distribution and status are recognized as the indicators of odontoblast activity. We used a DsRed-labeled adenovirus to mark the mitochondria of the DPSC on the tubular microisland. As shown in Figure 3E, a strong mitochondria-indicating signal was expressed not only at the perinuclear region in the cell body but also at the tip of processes, indicating an active metabolic status of the cellular process. In addition, the strong expression of collagen I also demonstrated the high activity of the DPSC on the tubular microisland (Figure 3F). Moreover, a high amount of collagen I was found outside of the cell body, indicating that the polarized DPSC actively secreted and deposited collagen when culturing the DPSC in a nonodontogenic medium for 3 days. It was reported that it took at least 7 days for DPSCs to secret collagen when the DPSCs were cultured on a 2D flask or in a 3D matrix without tubular architecture.10,26 Our result indicates that the 3D tubular microisland promoted not only the formation of an odontoblast-like cell morphology but also the performance of DPSC physiological functions.
The dynamic morphological change of the DPSCs in the tubular matrix was traced to examine the polarization process of a single DPSC (Figure 4A). At 12 h after cell seeding, the DPSC produced pseudopodia that interacted with adjacent nanofibers and started to project into the tubule. A cellular process that extended in the tubule was clearly observed at 24 h. The process continuously extended at 48 h and reached a plateau at 72 h. Quantitative analysis indicated that the process increased from 7.8 μm at 12 h to 25.6 μm at 72 h (Figure 4B). Further prolonging the culture time to 96 h did not induce a longer process (Figure 4B). Moreover, multiple branches spreading from the DPSC process were detected, probably owing to the porous structure of the nanofibrous gelatin matrix.
Figure 4.

Dynamic polarization process of single DPSCs on a tubular microisland. (A) Cellular process formation within the tubules after the cells were seeded for 12, 24, 48, 72, and 96 h. Red represents phalloidin-633-conjugated actin filaments, green represents FITC-conjugated GelMA nanofibers, and blue represents nuclei. (B) Change of the cellular process length over time. (C) Change of the ratio of single DPSC with a process over time. * represents P < 0.05 and ** represents P < 0.01 compared to the group of 12 h.
In addition, the ratio of a single DPSC with a process increased with time (Figure 4C). Approximately 68.2% of the DPSCs on the microislands were polarized at 12 h, whereas over 92.2% of the DPSCs on the microislands displayed a noticeable process at 72 h, confirming the efficacy of the 3D tubular matrix in inducing DPSC polarization. Moreover, as shown in the mitochondria tracing images (Figure S2), the DPSC process was metabolically active at each time point during the culture period.
One distinctive feature used to characterize a polarized odontoblast was the location of the Golgi apparatus within the cell. As the workshop for protein packaging and secretion, the Golgi apparatus is located at the juxtanuclear region between the nucleus and the cellular process in a polarized odontoblast.27 The specific location of Golgi apparatus was proposed to facilitate its function in efficiently packaging and processing proteins for secretion both at the tip of the odontoblast processes and at the terminal web where the process is projected from the cell body.28 Moreover, the characteristic location of the Golgi apparatus has been well recognized as a marker of cell polarization for in vitro studies.29 We examined the location of the Golgi apparatus in a single DPSC on the tubular microisland at different time points (Figure 5A). During the first 12 h, the Golgi apparatus was adjacent to the nucleus at random orientations. The Golgi apparatus started detouring around the nucleus and moving toward the long process as the time increased from 12 to 72 h. After 72 h, the Golgi apparatus ceased its movement to a position between the nucleus and the cellular process, indicating a fully polarized DPSC on the tubular microisland. To quantify the movement of the Golgi apparatus, a rectangular coordinate was established within the 3D reconstructed cell (Figure 5B), and the geometric center of the nucleus was defined as the “origin” of the coordinate. The line that passed through the “origin” and the process end was defined as the “Y axis”, with the direction toward the process end as positive. As shown in Figure 5C, the Golgi apparatus was initially located at a slightly negative juxtanuclear region (−1.92 μm) at 12 h. After this position, it continuously moved toward the positive pole, bypassed the nucleus, and subsequently settled down at a final position of 7.79 μm. These results further confirmed that the DPSC polarization is a dynamic process initiated by the 3D tubular matrix.
Figure 5.

Movement of the Golgi apparatus in a DPSC seeded on a tubular microisland. (A) Typical locations of Golgi apparatus in a DPSC at 12, 24, 48, and 72 h after being seeded on the tubular microisland. Red indicates phalloidin-633-conjugated actin filaments, green indicates FITC-conjugated nanofibers, blue indicates the nuclei, and yellow indicates the Golgi apparatus. (B) Construction of a coordinate system to locate Golgi apparatus and measure its distance to the nucleus. (C) Quantitative results of the Golgi apparatus locations over time.
Finally, we examined the role of the cytoskeletal network in DPSC polarization. We first added cytochalasin D, an inhibitor of actin polymerization, into the culture of the DPSC/tubular matrix system and found the cell attachment ratio on the tubular microislands dramatically decreased to 3.2% (Figure 6A). Moreover, no discernible cell processes were found in the cells that survived (Figure 6B,C). This result indicated that actin polymerization played a fundamental role in cell adhesion, and the disruption of this process resulted in the failure of DPSC adhesion and polarization. When nocodazole (a reagent that disrupts microtubule assembly) was added into the culture medium, it also significantly reduced the DPSC attachment ratio to 43.3% (Figure 6A). Besides, the ratio of polarized DPSCs decreased from 73 to 5.9% (Figure 6B), and the average process length decreased from 15.8 to 0.6 μm (Figure 6C). Moreover, the Golgi apparatus translocation was completely interrupted with the addition of nocodazole (Figure 6D). These results indicated that microtubules were also critical in DPSC attachment and polarization, although their effect was less prominent than actin polymerization (microfilaments). Intermediate filaments, unlike microfilaments or microtubules, are more stable in nature, and their components are more complex. As a result, there is no well-accepted inhibitor available to inhibit the assembly of intermediate filaments, and likewise their effect in inducing DPSC polarization cannot be studied.
Figure 6.

Effects of three cytoskeletal network inhibitors on DPSC polarization. (A) Cell occupation ratio with the addition of the inhibitors. (B) Ratio of the cell with a process with the addition of the inhibitors. (C) Process length of DPSCs with the addition of the inhibitors. (D,E) Addition of nocodazole or Y27632 prevents the DPSC polarization and disrupts the Golgi apparatus movement. Red indicates phalloidin-633-conjugated actin filaments, green indicates FITC-conjugated nanofibers, yellow indicates Golgi apparatus, and blue indicates the nuclei. * represents P < 0.05 and ** represents P < 0.01, compared to the control group. (D,E) have the same scale bar of 10 μm.
The RhoA/ROCK signaling pathway has been well demonstrated to regulate the organization and distribution of cytoskeletal elements and modulate intracellular tension. Moreover, it is the main regulator in various cytological activities that require cellular reshaping and movement, such as cell migration and cell polarity.30 In our previous study, we showed the close relationship between cytoskeleton tension and cell morphology.31 Consequently, in this experiment, we examined the change of DPSC morphology on the tubular matrix by adding Y27632, a Rho-associated protein kinase (ROCK) inhibitor. Our result shows that the cell attachment ratio was not affected (Figure 6A). However, the polarized cell ratio decreased to 48.1% (Figure 6B) and the cellular process length reduced to 9.6 μm (Figure 6C), significantly shorter than that without the addition of Y27632. The movement of the Golgi apparatus was still observed, but it stopped at a juxtanuclear position after 3 days of culture (Figure 6E), indicating that the DPSC was not fully polarized. This result indicates that cell tension did not influence DPSC adhesion but played a role in inducing cell polarization.
In summary, this work highlights the development of a bioinspired 3D platform for studying single DPSC polarization. One unique feature of the “clean” platform is its capability to dissect any factor that may play a role in DPSC polarization. Currently, we are examining the effects of other biophysical factors (e.g., matrix surface architecture, stiffness, and gravity) and biochemical factors (e.g., growth factors) on DPSC polarization. By tailoring the microisland size and tubule number in each microisland, we can also control the cell number in each microisland to examine the effect of cell–cell interactions on DPSC polarization. However, these experiments are beyond the scope of this study and will be reported somewhere in the future.
3. CONCLUSIONS
In this work, a bioinspired, nanofibrous tubular 3D platform was developed to explore DPSC polarization at the single cell level. Our results revealed that the nanofibrous, tubular structure of the 3D matrix is crucial in initiating DPSC polarization. The polarization of DPSCs was a dynamic and sequential process, as evidenced by different positions of the Golgi apparatus inside the DPSCs at various polarization stages. During the polarization, the cytoskeletons, including microfilaments, microtubules, and intermediate filaments, were reorganized to modulate DPSC polarization. Inhibiting the reorganization of the cytoskeletons led to a complete or partial abortion of DPSC polarization. In addition, cell tension was involved in the regulation of DPSC polarization. The findings of this work greatly expanded our in-depth understanding of DPSC polarization in vitro and provided significant hints for future tubular dentin regeneration studies. In addition, the unique 3D “clean” platform developed in this study can be applied to explore cell polarization for many other types of cells in vitro, although it might need a slight modification to provide a cell-specific ECM-like 3D environment.
4. MATERIALS AND METHODS
4.1. Fabrication of Bioinspired 3D “Clean” Platforms.
Fabrication of the 3D nanofibrous micropatterned tubular gelatin platform was conducted as illustrated in Figure 1. First, methacrylate-modified nanofibrous gelatin (GelMA) was prepared using an electrospinning process. The electrospun GelMA matrix was chemically cross-linked to stabilize its structure as we reported previously.32,33 Next, the cross-linked GelMA was placed under a photomask and induced to react with PEGDA (20% v/v) using 2-hydroxy-4-(2-hydroxyethoxy)-2-methylpropiophenone (1% v/v) as a photoinitiator under UV light (CS2010, Thorlabs. Inc., 40 mW/cm2) for 60 s. A photomask with 25 μm diameter circular microshades was selected as it offered the highest single cell ratio according to our previous study.19 Afterward, the matrix was immersed in absolute ethanol for dehydration and dried on a PEN (polyethylene naphthalate) frame slide (Leica, 11600289) in a vacuum desiccator. The matrix was placed under a microdissection system (LMD 7000) to generate dentinal tubules using a laser-assisted ablation process. A 3 μm2 circle was drawn within software, and a laser screw mode was selected. The laser parameters were set as power 40, aperture 8, speed 15, specimen balance 10, head current 100%, pulse frequency 201, offset 101, and repeat 8. The NF-MT matrix was then removed from the PEN frame slide and soaked in 75% alcohol for later use.
4.2. DPSC Culture and Seeding.
Human DPSCs were a gift from Dr. Songtao Shi at the University of Pennsylvania School of Dentistry. Cells were cultured in an ascorbic acid-free α-modified essential medium (α-MEM) (Gibco, A1049001) supplemented with 10% (v/v) FBS (Gibco, #26140079) and 1% penicillin/streptomycin (Sigma, #P333) in a humidified cell incubator. After sterilization with 75% ethanol, the 3D NF-MT platforms were washed thoroughly with phosphate-buffered saline (PBS) in a 48-well plate before the cells were seeded. The DPSCs from passages 3–8 were trypsinized and isolated into single cells, and 6 × 10⁵ cells within 400 μL medium were seeded onto each platform. The platforms were transferred to an incubator to allow cell attachment for 50 min and then gently washed with FBS-supplemented α-MEM to remove unattached cells. The medium was changed every other day. For inhibition assays, cytochalasin D (1 μM), nocodazole (1 μg/mL), and Y27632 (2 μM) were added to the medium to inhibit the activity of actin polymerization, microtubule polymerization, and ROCK activity for 3 days, respectively.
4.3. Scanning Electron Microscopy (SEM) Observation.
NF-MT platforms were dehydrated with graded ethanol solution series (50% ethanol for 5 min, 70% ethanol for 10 min, 95% ethanol for 30 min, and 100% ethanol for 30 min) and dried in a vacuum desiccator. The dehydrated samples were coated with gold for 2 min using a sputter coater (SPI-module Sputter Coater Unit, SPI Supplies/Structure Probe, Inc.) and observed under a SEM machine (JSM6010, JEOL).
4.4. Mitochondria Adenovirus Transfection.
Ad-Mito-DsRed (SignaGen Laboratories #SL100744) was a gift from Dr. Jerry Feng at Texas A&M University College of Dentistry. After the DPSCs were seeded and established on NF-MT platforms, a culture medium containing 5 × 10⁵ PFU/mL Ad-Mito-DsRed was added to replace the normal medium 12 h before the NF-MT samples were harvested.
4.5. Immunofluorescence Staining.
For actin staining, the NF-MT samples were permeated with 0.3% Triton X-100 for 10 min, blocked with 5% goat serum for 30 min at room temperature, and incubated with 10 U/mL CF633 phalloidin (Biotium, 00046) for 60 min at 37 °C. For nuclear staining, the samples were immersed into 1 μg/mL Hoechst 33342 (Thermo Scientific, 62249) for 10 min at room temperature. For immunofluorescence staining, the NF-MT samples were permeated with Triton X-100 for 10 min and blocked with 5% goat serum to prevent nonspecific staining for 4 h at room temperature. Afterward, the samples were incubated with primary antibodies that included an anti-integrin beta-1 antibody (1:1000, Abcam 179471), anti-vinculin antibody (1:150, Abcam 129002), anti-β tubulin antibody (1:400, Abcam 52901), anti-vimentin antibody (1: 500, Abcam 92547), anti-collagen I antibody (1:200, Abcam 6308), and anti-Golgi antibody (1:200, Invitrogen PA3–910). The samples were then washed with PBS and incubated with an Alexa Fluor Plus 555 secondary antibody (1:200, Invitrogen, A32732) with 1% goat serum (1:200, Invitrogen, A32732) for 2 h at room temperature.
4.6. Cryosection Preparation.
After being stained with immunofluorescent dyes, the NF-MT samples were immersed in 30% sucrose for 1 h for dehydration and embedded with optimal cutting temperature (OCT, Leica) medium for cryosection. Sections with a thickness of 30 μm were harvested and immediately mounted for confocal observations.
4.7. Confocal Observations.
Both sectioned NF-MT slides (for lateral views) and nonsectioned NF-MT samples (for top views) were placed under a confocal laser scan microscope (TCS SP5, Leica, Buffalo, USA) for high-resolution images. A stack mode with a step size of 0.4 μm was used to record the images of a single cell. Series images were then exported to Imaris 9.0 software to reconstruct the 3D morphology of a single DPSC.
4.8. Cell Tracing.
Five time points (12, 24, 36, 72, and 96 h) after initial cell seeding were selected to trace the morphological change of isolated DPSCs on the NF-MT samples. The NF-MT samples were stained with CF633 phalloidin and Hoechst 33342 and embedded in OCT medium for cryosectioning. Lateral images of a single DPSC on a NF-MT sample were acquired and imported to Image ProPlus 7 for quantitative analysis. The ratio of DPSC with the process was calculated as the percentage of single DPSCs that displayed a cellular process within the tubules.
4.9. Statistical Analysis.
At least 50 cells and images within three samples were counted for each assay, and each assay was repeated three times. Quantitative results were presented as mean ± standard deviation (SD). An unpaired Student’s t test was used to test the significance between the two groups, and a p value smaller than 0.05 indicated a statistically significant difference between the compared groups.
Supplementary Material
ACKNOWLEDGMENTS
This study was supported by NIH/NIDCR DE024979 and DE029860 (X.L.). The authors thank Dr. Songtao Shi for providing DPSCs. The authors thank Meghann Holt for her assistance with the editing of this article.
Footnotes
The authors declare no competing financial interest.
ASSOCIATED CONTENT
Supporting Information
The Supporting Information is available free of charge at https://pubs.acs.org/doi/10.1021/acsami.0c17730.
Brief statement and illustration regarding the biocompatibility of the tubular microislands and the mitochondria tracking images (PDF)
Complete contact information is available at: https://pubs.acs.org/10.1021/acsami.0c17730
Contributor Information
Bei Chang, Department of Biomedical Sciences, Texas A&M University College of Dentistry, Dallas, Texas 75246, United States.
Chi Ma, Department of Biomedical Sciences, Texas A&M University College of Dentistry, Dallas, Texas 75246, United States.
Xiaohua Liu, Department of Biomedical Sciences, Texas A&M University College of Dentistry, Dallas, Texas 75246, United States.
REFERENCES
- (1).Chang B; Svoboda KKH; Liu X Cell Polarization: From Epithelial Cells to Odontoblasts. Eur. J. Cell Biol. 2019, 98, 1–11. [DOI] [PMC free article] [PubMed] [Google Scholar]
- (2).Drubin DG; Nelson WJ Origins of Cell Polarity. Cell 1996, 84, 335–344. [DOI] [PubMed] [Google Scholar]
- (3).Ruch JV; Lesot H; Bègue-Kirn C Odontoblast Differentiation. Int. J. Dev. Biol. 1995, 39, 51–68. [PubMed] [Google Scholar]
- (4).Arana-Chavez VE; Massa LF Odontoblasts: The Cells Forming and Maintaining Dentine. Int. J. Biochem. Cell Biol. 2004, 36, 1367–1373. [DOI] [PubMed] [Google Scholar]
- (5).Gronthos S; Mankani M; Brahim J; Robey PG; Shi S Postnatal Human Dental Pulp Stem Cells (Dpscs) in vitro and in Vivo. Proc. Natl. Acad. Sci. U.S.A. 2000, 97, 13625–13630. [DOI] [PMC free article] [PubMed] [Google Scholar]
- (6).Kawashima N Characterisation of Dental Pulp Stem Cells: A New Horizon for Tissue Regeneration? Arch. Oral Biol. 2012, 57, 1439–1458.22981360 [Google Scholar]
- (7).Qu T; Liu X Nano-Structured Gelatin/Bioactive Glass Hybrid Scaffolds for the Enhancement of Odontogenic Differentiation of Human Dental Pulp Stem Cells. J. Mater. Chem. B 2013, 1, 4764–4772. [DOI] [PMC free article] [PubMed] [Google Scholar]
- (8).Qu T; Jing J; Jiang Y; Taylor RJ; Feng JQ; Geiger B; Liu X Magnesium-Containing Nano-Structured Hybrid Scaffolds for Enhanced Dentin Regeneration. Tissue Eng., Part A 2014, 20, 2422–2433. [DOI] [PMC free article] [PubMed] [Google Scholar]
- (9).Qu T; Jing J; Ren Y; Ma C; Feng JQ; Yu Q; Liu X Complete Pulpodentin Complex Regeneration by Modulating the Stiffness of Biomimetic Matrix. Acta Biomater. 2015, 16, 60–70. [DOI] [PubMed] [Google Scholar]
- (10).Li Y; Lü X; Sun X; Bai S; Li S; Shi J Odontoblast-Like Cell Differentiation and Dentin Formation Induced with Tgf-β1. Arch. Oral Biol. 2011, 56, 1221–1229. [DOI] [PubMed] [Google Scholar]
- (11).Li X; Ma C; Xie X; Sun H; Liu X Pulp Regeneration in a Full-Length Human Tooth Root Using a Hierarchical Nanofibrous Microsphere System. Acta Biomater. 2016, 35, 57–67. [DOI] [PubMed] [Google Scholar]
- (12).Demarco FF; Casagrande L; Zhang Z; Dong Z; Tarquinio SB; Zeitlin BD; Shi S; Smith AJ; Nör JE Effects of Morphogen and Scaffold Porogen on the Differentiation of Dental Pulp Stem Cells. J. Endod. 2010, 36, 1805–1811. [DOI] [PubMed] [Google Scholar]
- (13).Huang GT-J Dental Pulp and Dentin Tissue Engineering and Regeneration: Advancement and Challenge. Front. Biosci., Elite Ed. 2011, 3, 788–800. [DOI] [PMC free article] [PubMed] [Google Scholar]
- (14).Yang B; Chen G; Li J; Zou Q; Xie D; Chen Y; Wang H; Zheng X; Long J; Tang W; Guo W; Tian W Tooth Root Regeneration Using Dental Follicle Cell Sheets in Combination with a Dentin Matrix - Based Scaffold. Biomaterials 2012, 33, 2449–2461. [DOI] [PubMed] [Google Scholar]
- (15).Chen G; Chen J; Yang B; Li L; Luo X; Zhang X; Feng L; Jiang Z; Yu M; Guo W; Tian W Combination of Aligned Plga/Gelatin Electrospun Sheets, Native Dental Pulp Extracellular Matrix and Treated Dentin Matrix as Substrates for Tooth Root Regeneration. Biomaterials 2015, 52, 56–70. [DOI] [PubMed] [Google Scholar]
- (16).Ji B; Sheng L; Chen G; Guo S; Xie L; Yang B; Guo W; Tian W The Combination Use of Platelet-Rich Fibrin and Treated Dentin Matrix for Tooth Root Regeneration by Cell Homing. Tissue Eng., Part A 2015, 21, 26–34. [DOI] [PubMed] [Google Scholar]
- (17).Karcher-Djuricic V; Osman M; Meyer JM; Staubli A; Ruch JV Basement Membrane Reconstitution and Cytodifferentiation of Odontoblasts in Isochronal and Heterochronal Reassociations of Enamel Organs and Pulps. J. Biol. Buccale 1978, 6, 257–265. [PubMed] [Google Scholar]
- (18).Yao X; Peng R; Ding J Cell–Material Interactions Revealed Via Material Techniques of Surface Patterning. Adv. Mater. 2013, 25, 5257–5286. [DOI] [PubMed] [Google Scholar]
- (19).Ma C; Chang B; Jing Y; Kim H; Liu X Bio-Inspired Micropatterned Platforms Recapitulate 3d Physiological Morphologies of Bone and Dentinal Cells. Adv. Sci. 2018, 5, 1801037. [DOI] [PMC free article] [PubMed] [Google Scholar]
- (20).Gómez-Guillén MC; Giménez B; López-Caballero ME; Montero MP Functional and Bioactive Properties of Collagen and Gelatin from Alternative Sources: A Review. Food Hydrocolloids 2011, 25, 1813–1827. [Google Scholar]
- (21).Lo Giudice G; Cutroneo G; Centofanti A; Artemisia A; Bramanti E; Militi A; Rizzo G; Favaloro A; Irrera A; Lo Giudice R Dentin Morphology of Root Canal Surface: A Quantitative Evaluation Based on a Scanning Electronic Microscopy Study. BioMed Res. Int. 2015, 2015, 164065. [DOI] [PMC free article] [PubMed] [Google Scholar]
- (22).Anderson LR; Owens TW; Naylor MJ Structural and Mechanical Functions of Integrins. Biophys. Rev. 2014, 6, 203–213. [DOI] [PMC free article] [PubMed] [Google Scholar]
- (23).Cabahug-Zuckerman P; Stout RF Jr.; Majeska RJ; Thi MM; Spray DC; Weinbaum S; Schaffler MB Potential Role for a Specialized β3 Integrin-Based Structure on Osteocyte Processes in Bone Mechanosensation. J. Orthop. Res. 2018, 36, 642–652. [DOI] [PMC free article] [PubMed] [Google Scholar]
- (24).Cukierman E; Pankov R; Yamada KM Cell Interactions with Three-Dimensional Matrices. Curr. Opin. Cell Biol. 2002, 14, 633–640. [DOI] [PubMed] [Google Scholar]
- (25).Diekwisch T Localization of Microfilaments and Microtubules During Dental Development in the Rat. Acta Histochem., Suppl. 1989, 37, 209–212. [PubMed] [Google Scholar]
- (26).Couble M-L; Farges J-C; Bleicher F; Perrat-Mabillon B; Boudeulle M; Magloire H Odontoblast Differentiation of Human Dental Pulp Cells in Explant Cultures. Calcif. Tissue Int. 2000, 66, 129–138. [DOI] [PubMed] [Google Scholar]
- (27).Ruch J; Lesot H; Bègue-Kirn C Odontoblast Differentiation. Int. J. Dev. Biol. 1995, 39, 51–68. [PubMed] [Google Scholar]
- (28).Linde A; Goldberg M Dentinogenesis. Crit. Rev. Oral Biol. Med. 1993, 4, 679–728. [DOI] [PubMed] [Google Scholar]
- (29).Chan EWL; Yousaf MN A Photo-Electroactive Surface Strategy for Immobilizing Ligands in Patterns and Gradients for Studies of Cell Polarization. Mol. BioSyst. 2008, 4, 746–753. [DOI] [PubMed] [Google Scholar]
- (30).Vicente-Manzanares M; Ma X; Adelstein RS; Horwitz AR Non-Muscle Myosin Ii Takes Centre Stage in Cell Adhesion and Migration. Nat. Rev. Mol. Cell Biol. 2009, 10, 778–790. [DOI] [PMC free article] [PubMed] [Google Scholar]
- (31).Chang B; Ma C; Liu X Nanofibers Regulate Single Bone Marrow Stem Cell Osteogenesis Via Fak/Rhoa/Yap1 Pathway. ACS Appl. Mater. Interfaces 2018, 10, 33022–33031. [DOI] [PMC free article] [PubMed] [Google Scholar]
- (32).Liu X; Smith LA; Hu J; Ma PX Biomimetic Nanofibrous Gelatin/Apatite Composite Scaffolds for Bone Tissue Engineering. Biomaterials 2009, 30, 2252–2258. [DOI] [PMC free article] [PubMed] [Google Scholar]
- (33).Liu X; Ma PX Phase Separation, Pore Structure, and Properties of Nanofibrous Gelatin Scaffolds. Biomaterials 2009, 30, 4094–4103. [DOI] [PMC free article] [PubMed] [Google Scholar]
Associated Data
This section collects any data citations, data availability statements, or supplementary materials included in this article.