

Abstract
Navy beans contain bioactive phytochemicals with colon cancer prevention properties as demonstrated in carcinogen-induced animal models. Human studies support that dietary navy bean intake modulates metabolism by the gut microbiome. This study investigated the effect of navy bean ingestion on plasma and urine metabolite profiles of overweight and obese colorectal cancer (CRC) survivors. Twenty participants completed a single-blinded, randomized-controlled dietary intervention with pre-cooked navy beans (35g bean powder/day) or control (0g/day) for 4 weeks. Plasma and urine were collected at baseline, 2 weeks and 4 weeks following consumption. Non-targeted metabolomics was applied to study meals and snacks, navy beans, plasma, and urine. Increased navy bean consumption was hypothesized to a) delineate dietary biomarkers and b) promote metabolic shifts relevant for cancer protection in the plasma and urine metabolome. At 4 weeks, 16 plasma and 16 urine metabolites were significantly different in the navy bean intervention group compared to placebo-control (p< 0.05). Increased plasma 2,3-dihydroxy-2-methylbutyrate (1.34-fold), S-methylcysteine (1.92-fold), and pipecolate (3.89-fold), and urine S-adenosylhomocysteine (2.09-fold) and cysteine (1.60-fold) represent metabolites with cancer protective actions following navy bean consumption. Diet-derived metabolites were detected in plasma or urine and confirmed for presence in the navy bean intervention meals and snacks. These included 3-(4-hydroxyphenyl)propionate, betaine, pipecolate, S-methylcysteine, choline, eicosapentaenoate (20:5n3), benzoate, S-adenosylhomocysteine, N-delta-acetylornithine, cysteine, 3-(4-hydroxyphenyl)lactate, gentisate, hippurate, 4-hydroxyhippurate, and salicylate. The navy bean dietary intervention for 4 weeks showed changes to pathways of metabolic importance to CRC prevention and merit continued attention for dietary modulation in future high-risk cohort investigations.
Keywords: Navy beans, Metabolomics, Colorectal Cancer, Bioactive Food Components
Introduction
Legumes are globally recognized as high-quality sources of dietary fibers with pre-biotic functions, and are sustainable sources of essential amino acids and many other bioactive plant secondary metabolites [1–3]. Epidemiological studies and multiple clinical cohort investigations now support regular consumption of common beans for colorectal cancer (CRC) prevention [4–7], and additionally promote lower risk of chronic diseases such as obesity [8–13], cardiovascular disease [14, 15], and type II diabetes [16]. Hughes et al. reported that 59g of pinto beans per 100g of diet reduced colon tumor (azomethane-induced) incidence by 50% in rats compared to 24% by casein-fed rats [17]. Similar to the findings of previous studies, Hangen and Bennink found that diets fed to rats containing 75% navy beans resulted in 44% decreased colon tumor and adenocarcinoma incidence [18]. The consumption of ~ ½ cup of cooked dry beans per day for adults was practical and significantly increased intake of fiber, protein, and minerals such as folate, zinc, iron, and magnesium, while lowers the intake of saturated fats and total fat [19–21].
Emerging evidence exists for diet-derived small molecules to signal as modifiers of cancer risk and tumor behavior. Reliable dietary intake assessment methods are required to understand the associations between diet, nutritional status, and colon cancer risk. Non-targeted metabolomics is a well-established and sensitive tool for the comprehensive and concomitant characterization of multiple metabolites within a biological matrix, and is increasingly applied to cancer research to screen and discover shifts in metabolism [22, 23]. In recent years, metabolomics has also been used for identifying putative biomarkers of food consumption and dietary patterns [24, 25]. Less is known about whether bioactive food components reach effective cancer protective concentrations in people due to extensive inter-individual variability that can occur in host digestion and gut metabolism. Some mechanisms linking common dry bean consumption and cancer prevention include, but are not limited to, induction of apoptosis and modulation of cell cycle and proliferation [26–28]. Other mechanisms for common bean intake to inhibit colon carcinogenesis involve changes to energy metabolism [29] and phase II detoxification [30] as shown by tissue microarray analysis in animals. Metabolomics has utility for measuring downstream products of metabolic disturbances shown by gene expression and for associations with environmental exposures involved in cancer risk [31, 32].
Plasma and urine are ideal biological fluids to examine the physiological effects of dietary exposures and have shown sensitivity to detect subtle and major changes in metabolite abundance over time [33, 34]. A non-targeted metabolite approach was applied herein to assess metabolic modulation of CRC risk following increased navy bean intake. The purpose of this study was to assess the impact of navy bean consumption on the plasma and urine metabolome for CRC prevention when compared to placebo-control foods, and to identify a suite of metabolites that originated from navy beans. It was hypothesized that increased consumption of navy beans would deliver bioactive metabolites to individuals at high-risk for CRC recurrence and produce metabolic shifts in plasma and urine profiles.
Materials and Methods
Study design and dietary interventions
Twenty overweight or obese CRC survivors that were a minimum of 4 months post-cancer treatment were recruited for this single-blinded, placebo-controlled, randomized intervention trial as previously described [3, 35, 36]. All the participants were blinded to the study arms, and only the study coordinator was aware of the participant study group allocation group. The study design adhered to CONSORT guidelines (http://www.consort-statement.org/). The recruitment took place through the University of Colorado Health-North Cancer Center Network (Fort Collins, CO). Supplementary Figure 1 illustrates the eligibility criteria and the allocation of 20 CRC survivors that completed a study titled Beans/Bran Enriching Nutritional Eating For Intestinal health Trial (BENEFIT) (NCT01929122). Participants were randomized by body mass index (BMI between 25–35), sex, and daily caloric intake [37] prior to dietary intervention. Supplementary Table 1 shows study population characteristics at baseline. In this 4-week intervention, participants assigned to the navy bean intervention consumed 35g of cooked whole navy beans in powder form (daily intake of one meal and one snack that each contained 17.5g of cooked navy bean powder) [37]. The control study arm received placebo meals and snacks without the addition of navy bean powder as previously described [35, 37]. The study protocol and written informed consent was approved by the Colorado State University Research Integrity and Compliance Review Board and the University Colorado Cancer Center-North Institutional Review Board (Protocol # 09–1530H and 10–1038, respectively) in accordance with the 1964 Helsinki Declaration and its 2013 amendments. The 20 individuals completed the 4-week pilot dietary intervention trial between August 2010 and December 2014.
Blood and urine sample collection for metabolomics
Fasting blood samples were collected into 4 ml ethylene-diamine-tetra-acetic acid (EDTA) blood collection tubes from the 20 participants who completed study visits at baseline, 2 weeks, and week 4 and kept immediately on ice until the centrifugation step to extract the plasma (1500 rpm for 10 minutes). Plasma was further stored at −80°C until processed for metabolomics analysis using ultra-high-performance liquid chromatography-tandem mass spectrometry (UHPLC-MS/MS). At each study visit (baseline, 2 weeks, and 4 weeks), participants were given study-labeled containers for self-collection of first void of the morning urine. Urine was stored at −80°C until extracted for analysis by UHPLC-MS/MS. Urine samples were subjected to the osmolality normalization using a Fiske™ 210 Micro-Sample Osmometer to correct for the fluid intake variability between participants.
Plasma and urine extraction for metabolomics
The global non-targeted metabolomics was performed through Metabolon, Inc. (Durham, NC, USA). The extraction method has been described previously [34]. Briefly, 80% methanol was added on plasma and urine in a ratio of 300 μL solvent per 100 mg plasma or urine. The samples were shaken for 2 min, and then centrifuged for 10 min at 4 °C (12000 rpm). The metabolite extracts from plasma and urine were analyzed using UHPLC-MS/MS with positive and negative ion mode electrospray ionization (ESI).
UHPLC-MS/MS analysis
Samples were analyzed using a Waters ACQUITY UHPLC system coupled with a Thermo Scientific Q-Exactive high resolution/accurate mass spectrometer and interfaced with a heated electrospray ionization (HESI-II) source and Orbitrap mass analyzer. Prior to analysis, samples were resuspended in acidic or basic UHPLC-compatible solvents. The acidic and basic solutions were analyzed using positive and negative ESI, and both HILIC (hydrophilic interaction chromatography) and reverse phase (RP) chromatography [38]. In HILIC mode, the extracts were injected into a BEH Amide column (2.1 mm × 100 mm, 1.7 μm; Waters Corporation, Milford, MA). The mobile phase was delivered at 0.35mL/min consist of water, acetonitrile, and 10mM ammonium formate at pH 10.8 (HILIC positive), methanol + water, and 6.5mM ammonium bicarbonate at pH 8.0 (HILIC negative). In RP positive and negative ion optimized conditions, extracts were gradient eluted from a C18 column (2.1 mm × 150 mm, 1.7 μm; Corporation, Milford, MA). In RP positive, extracts were eluted from the column with water + methanol, containing 0.05% perfluoropentanoic acid and 0.1% formic acid, while in RP negative, water + methanol, containing 0.05% perfluoropentanoic, 0.01% formic acid, and acetonitrile was used as mobile phase. For the MS data acquisition of study meals and snacks, plasma and urine, an extended dynamic exclusion was used with the instrumental ion acquirement of 70–1000 m/z. The peak picking process was performed by Metabolon through in-house peak detection and integration software. Compound identification (level 1 identification) was completed using library of over 3,300 purified standards and based on the experimentally MS-MS spectra matching the accurate mass the standard within 8 ppm, retention time, and m/z ratio.
The non-targeted metabolomics analysis of cooked navy bean powder has been previously described [3]. The plasma and urine metabolites from participants in both dietary groups were cross-referenced with metabolites identified in the navy beans and in the one meal and three snacks metabolome after 4 weeks of either control or navy bean consumption.
Statistical Analyses
Plasma and urine metabolite intensity levels underwent median-scaled normalization as previously described [34]. A Welch’s two-sample t-test and two-way ANOVA were performed for between group comparisons. Repeated measures ANOVA was used for comparisons at 2 and 4 weeks from baseline and within each study group. An estimate of false discovery rate (q-value) was calculated. Statistical significance was defined as a p-values of <0.05 and q-values below the threshold of <0.2 for within group comparisons.
Results
Metabolome profile of study provided meals and snacks
The metabolomes of one meal and three snacks used in this study comprised of 653 metabolites with confirmed identifications. Eight groups were used for the overarching metabolite classifications: amino acids, carbohydrates, cofactors and vitamins, energy metabolism, lipids, nucleotides, peptides, and xenobiotics. The meals and snacks metabolome contained 143 amino acids, 41 carbohydrates, 27 cofactors and vitamins, 14 energy metabolism related metabolites, 226 lipids, 61 nucleotides, 32 peptide, and 111 xenobiotics. Supplementary Table 2 shows the metabolite raw abundance for one meal and three snacks. Composition of meals and snacks was analyzed by chemical classes for placebo-control (0g/serving navy bean powder) and navy bean intervention (17.5g/serving navy bean powder). Supplementary Figure 2A displays the meals and snacks metabolite profiles for placebo-control and navy bean intervention, whereby each bar represents total number of identified metabolites in the chemical class, and the shaded portion represents the number of metabolites that appeared in navy bean intervention meals and snacks but not in the control. The navy bean source of metabolites in meals and snacks were determined by overlapping presence of metabolite in the navy bean powder metabolome. Supplementary Figure 2B-D displays normalized relative abundance values in placebo-control and navy bean intervention meals and snacks for the following metabolites: pipecolate, S-methylcysteine, and N-delta-acetylornithine. Pipecolate, S-methylcysteine, and N-delta-acetylornithine had higher abundance in the bean intervention meals and snacks compared to control that was due to the high relative abundance shown for these compounds in the navy bean powder.
Dietary modulation of plasma metabolome in CRC survivors after 2 and 4 weeks
There were 854 identified metabolites from plasma (N = 20 participants) across all time points, including baseline, 2 weeks, and 4 weeks post intervention. Supplementary Table 3 shows the relative abundance of plasma metabolites classified into metabolic pathways for all participants. Table 1 lists 22 plasma metabolites that were significantly modulated in either the control, navy bean, or both study groups for 20 participants at 2 and/or 4 weeks compared to baseline (p < 0.05, q <0.2). All data are presented as the mean fold-change in the median-scaled relative abundance of each metabolite. After consuming navy beans for 2 weeks, 21 metabolites including two gut microbial metabolites, four amino acids, one cofactors & vitamins, 11 lipids, and three xenobiotics were significantly modulated in plasma when compared to baseline.
Table 1.
Plasma metabolites following consumption of control foods or navy bean-based foods for 2 and 4 weeks. Post intervention metabolite profiles were compared to baseline (0 weeks).
| Fold-changec | |||||||||||||
|---|---|---|---|---|---|---|---|---|---|---|---|---|---|
| Control group | Navy bean group | ||||||||||||
| Metabolite | 2wk/ 0wk | p-value | q-value | 4wk 0wk | p-value | q-value | 2wk 0wk | p-value | q-value | 4wk 0wk | p-value | q-value | |
| Amino Acids | |||||||||||||
| Leucine, Isoleucine and Valine | 2,3-dihydroxy-2-methylbutyrate | 1.15 | 0.676 | 1 | 1.16 | 0.415 | 1 | 1.71 | 0.000 | 0.025 | 1.73 | 0.000 | 0.014 |
| Lysine | Pipecolatea,b | 1.22 | 0.550 | 1 | 1.10 | 0.677 | 1 | 2.59 | 0.000 | 0.025 | 2.67 | 0.000 | 0.014 |
| Methione, Cysteine, SAM and Taurine | S-methylcysteinea,b | 1.20 | 0.548 | 1 | 1.41 | 0.059 | 1 | 1.88 | 0.000 | 0.070 | 1.88 | 0.001 | 0.173 |
| S-methylcysteine sulfoxide | 1.53 | 0.032 | 1 | 1.66 | 0.008 | 1 | 1.86 | 0.001 | 0.123 | 2.07 | 0.001 | 0.173 | |
| Polyamine | Tryptophan betaine | 0.98 | 0.629 | 1 | 1.31 | 0.183 | 1 | 0.74 | 0.002 | 0.138 | 0.68 | 0.000 | 0.017 |
| Urea cycle; Arginine and Proline | N-δ-acetylornithinea,b | 1.15 | 0.725 | 1 | 1.28 | 0.091 | 1 | 1.55 | 0.002 | 0.145 | 1.69 | 0.002 | 0.255 |
| Cofactors & Vitamins | |||||||||||||
| Tocopherol | γ-CEHC | 0.81 | 0.047 | 1 | 1.12 | 0.37 | 1 | 0.66 | 0.002 | 0.124 | 0.72 | 0.016 | 0.567 |
| Lipids | |||||||||||||
| Diacylglycerol | Diacylglycerol (16:1/18:2 [2], 16:0/18:3 [1])* | 1.04 | 0.961 | 1 | 0.92 | 0.283 | 1 | 1.72 | 0.002 | 0.124 | 1.44 | 0.021 | 0.64 |
| Linoleoyl-linolenoyl-glycerol (18:2/18:3) [2]* | 1.02 | 0.671 | 1 | 0.95 | 0.412 | 1 | 1.73 | 0.011 | 0.296 | 1.50 | 0.09 | 0.698 | |
| Oleoyl-linoleoyl-glycerol (18:1/18:2) [1] | 0.95 | 0.483 | 1 | 0.90 | 0.192 | 1 | 1.47 | 0.001 | 0.124 | 1.28 | 0.063 | 0.688 | |
| Oleoyl-linoleoyl-glycerol (18:1/18:2) [2] | 1.01 | 0.890 | 1 | 0.90 | 0.231 | 1 | 1.49 | 0.004 | 0.176 | 1.38 | 0.019 | 0.608 | |
| Oleoyl-oleoyl-glycerol (18:1/18:1) [1]* | 1.02 | 0.930 | 1 | 0.88 | 0.055 | 1 | 1.35 | 0.003 | 0.145 | 1.14 | 0.228 | 0.825 | |
| Oleoyl-oleoyl-glycerol (18:1/18:1) [2]* | 1.06 | 0.654 | 1 | 0.89 | 0.087 | 1 | 1.42 | 0.000 | 0.106 | 1.21 | 0.082 | 0.698 | |
| Palmitoyl-linoleoyl-glycerol (16:0/18:2) [2]*b | 1.05 | 0.93 | 1 | 0.98 | 0.643 | 1 | 1.59 | 0.005 | 0.196 | 1.46 | 0.01 | 0.567 | |
| Palmitoyl-oleoyl-glycerol (16:0/18:1) [1]* | 1.07 | 0.681 | 1 | 0.96 | 0.348 | 1 | 1.45 | 0.002 | 0.139 | 1.24 | 0.093 | 0.698 | |
| Palmitoyl-oleoyl-glycerol (16:0/18:1) [2]*b | 1.10 | 0.518 | 1 | 0.96 | 0.38 | 1 | 1.50 | 0.000 | 0.106 | 1.30 | 0.028 | 0.678 | |
| Palmitoyl-palmitoyl-glycerol (16:0/16:0) [2]* | 1.15 | 0.513 | 1 | 1.00 | 0.603 | 1 | 1.83 | 0.002 | 0.124 | 1.61 | 0.015 | 0.567 | |
| Steroid | Cortisone | 0.83 | 0.022 | 1 | 0.92 | 0.267 | 1 | 1.43 | 0.005 | 0.19 | 1.29 | 0.073 | 0.688 |
| Xenobiotics | |||||||||||||
| Benzoate Metabolism | Hippuratea,b | 1.34 | 0.860 | 1 | 1.19 | 0.563 | 1 | 1.29 | 0.39 | 0.964 | 2.91 | 0.002 | 0.174 |
| Food Component/Plant | Piperinea | 1.94 | 0.451 | 1 | 1.91 | 0.901 | 1 | 13.77 | 0.000 | 0.036 | 3.72 | 0.001 | 0.174 |
| 4-allylphenol sulfate | 4.45 | 0.000 | 0.009 | 7.58 | 0.000 | 0.000 | 3.59 | 0.000 | 0.025 | 4.54 | 0.000 | 0.011 | |
| Drug | 4-hydroxycoumarin | 6.82 | 0.030 | 1 | 2.22 | 0.225 | 1 | 8.04 | 0.001 | 0.124 | 5.68 | 0.104 | 0.698 |
CEHC, carboxyethyl-hydroxychromans
Indicates that the metabolite identified was not made against a purified chemical standard.
Metabolite also identified from the Navy Bean metabolome.
Metabolite also identified from study food metabolome.
Values presented are fold-change of the mean relative abundance within control, navy bean group at 2 and 4 weeks compared to their baselines (p<0.05, are bold) and (q<0.2). Statistically-significant fold-changes are bolded and shaded. Light shaded represent metabolites and pathways that showed trends towards significance (0.05 < p < 0.10).
Navy bean powder significantly increased 3 amino acid metabolites in plasma of CRC survivors at week 2 and at week 4 when compared to the baseline levels (Table 1). Figure 1A–C illustrates median-scaled relative abundance for pipecolate, S-methylcysteine, and N-delta-acetylornithine. Individual responses over time are shown in Supplementary Figure 3. Notably, these three metabolites were highlighted for abundance in navy bean powder and study meals and snacks metabolomes.
Figure 1.
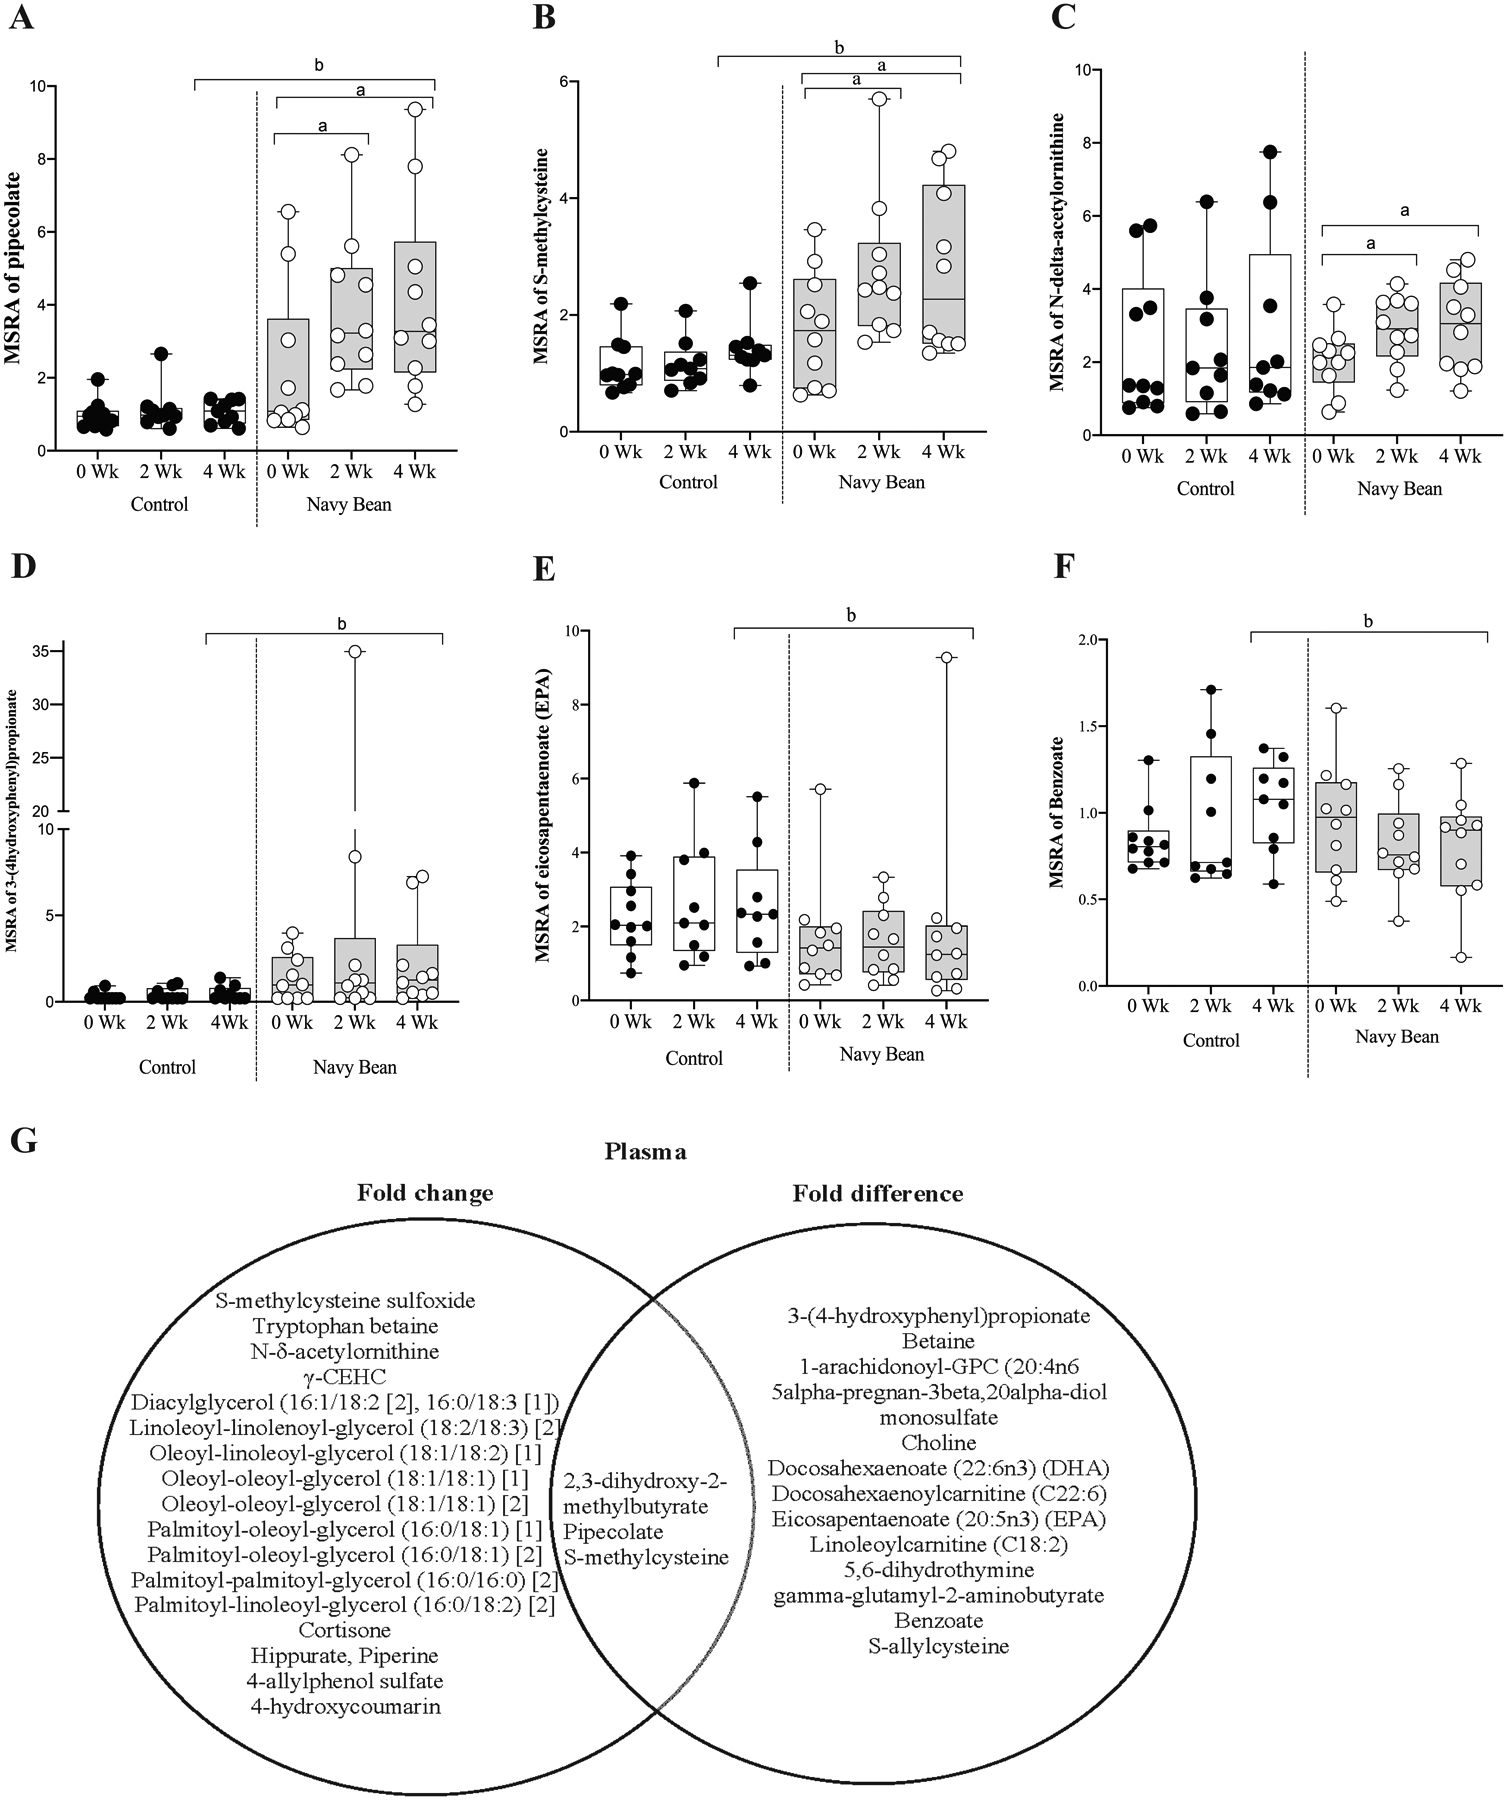
Median-scaled relative abundance (MSRA) of selected amino acids, gut microbial metabolites, lipid and phytochemicals for control or navy bean at 0, 2 and 4 weeks post dietary intervention in plasma. a = significant fold change, b = significant fold difference (p < 0.05).
A. pipecolate, B. S-methylcysteine, C. N-delta-acetylornithine, D. 3–4(hydroxyphenyl)propionate, E. eicosapentaenate, F. benzoate. G. Venn diagram summarizes plasma metabolites with statistical significance to navy bean intake. The left circle includes metabolites with fold changes at two or four weeks of navy bean intake compared to baseline, and the right circle shows metabolites with fold differences between the control and bean groups (4-week timepoint). Overlapping metabolites of statistical significance in each analysis are listed in the center.
Table 2 lists 16 plasma metabolites with significant differences in the abundance between intervention and control groups for the 20 participants at 4 weeks (p < 0.05, q < 0.2. For all participants, data are presented as the mean fold-difference between intervention and control groups at 4 weeks. The five plasma metabolites increased in abundance for the navy bean group were 3-(4-hydroxyphenyl)propionate (4.48-fold), S-allylcysteine (4.08-fold), pipecolate (3.88-fold), S-methylcysteine (1.92-fold), and 2,3-dihydroxy-2-methylbutyrate (1.34-fold). The 11 plasma metabolites with significant decreased levels compared to control at 4 weeks were betaine (0.84-fold), 1-arachidonoyl-GPC (20:4n6) (0.80-fold), 5alpha-pregnan-3beta-20alpha-diol monosulfate (0.12-fold), choline (0.80-fold), DHA (0.74-fold), docosahexaenoylcarnitine (C22:6) (0.63-fold), eicosapentaenoate (EPA) (0.77-fold), linoleoylcarnitine (C18:2) (0.71-fold), 5,6-dihydrothymine (0.71-fold), gamma-glutamyl-2-aminobutyrate (0.30-fild), and benzoate (0.77-fold). The eight metabolites identified in the plasma that were also present in the cooked navy beans include pipecolate, S-methylcysteine, betaine, EPA, docosahexaenoate (DHA), choline, gamma-glutamyl-2-aminobutyrate, and benzoate (see Table 2, footnote a) and 6 metabolites were identified in the study meals and snacks metabolome including 3-(4-hydroxyphenyl)propionate, betaine, pipecolate, S-methylcysteine, choline, and benzoate (see Table 2, footnote b). Figure 1D illustrates median-scaled relative abundance for 3-(4-hydroxyphenyl)propionate. This phenolic acid derivative was significantly increased after consuming navy beans for 4 weeks when compared to the control group. This phenolic acid was also found in the study meals and snacks metabolome (Table 2). Figure 1E and 1F show the median-scaled relative abundances for EPA and benzoate. These endogenous and/or diet-derived metabolites were significantly decreased after consuming navy beans for 4 weeks when compared to the control group (Table 2). Both metabolites were identified in the navy bean metabolome, while benzoate was also identified in the study meals and snacks. Figure 1G shows a Venn diagram of 33 plasma metabolites with fold-change or fold-differences identified at 2 or 4 weeks post intervention. The center metabolites in the Venn diagram illustrate those with overlapping significance from each of the statistical comparisons applied, and were Pipecolate, S-methylcyteine, and 2,3-dihydroxy-2methylbutyrate.
Table 2.
Navy bean consumption revealed distinct plasma metabolites after 4 weeks compared to a control intervention for 4 weeks.
| Fold-differencec | |||
|---|---|---|---|
| Metabolite | HMDB | Navy Bean | p-value |
| Gut Microbial Metabolites | |||
| 2,3-dihydroxy-2-methylbutyrate | HMDB29576 | 1.34 | 0.036 |
| 3-(4-hydroxyphenyl)propionateb | HMDB02199 | 4.48 | 0.031 |
| Amino Acids | |||
| Betainea,b | HMDB00043 | 0.84 | 0.032 |
| Pipecolatea,b | HMDB00070 | 3.88 | 0.000 |
| S-methylcysteinea,b | HMDB02108 | 1.92 | 0.006 |
| Lipids | |||
| 1-arachidonoyl-GPC (20:4n6) | HMDB10395 | 0.80 | 0.045 |
| 5alpha-pregnan-3beta,20alpha-diol monosulfate | - | 0.12 | 0.043 |
| Cholinea,b | HMDB00097 | 0.80 | 0.008 |
| Docosahexaenoate (22:6n3) (DHA)a | HMDB02183 | 0.74 | 0.014 |
| Docosahexaenoylcarnitine (C22:6) | - | 0.63 | 0.043 |
| Eicosapentaenoate (20:5n3) (EPA)a | HMDB01999 | 0.77 | 0.039 |
| Linoleoylcarnitine (C18:2) | HMDB06469 | 0.71 | 0.037 |
| Nucleotide | |||
| 5,6-dihydrothymine | HMDB00079 | 0.71 | 0.022 |
| Peptide | |||
| gamma-glutamyl-2-aminobutyratea | - | 0.30 | 0.005 |
| Xenobiotics | |||
| Benzoatea,b | HMDB01870 | 0.77 | 0.029 |
| S-allylcysteine | HMDB34323 | 4.08 | 0.019 |
GPC, glycerophosphocholine; HMDB, Human Metabolome Database
Metabolite also identified from the Navy Bean metabolome.
Metabolite also identified from the study food metabolome.
Values presented are fold-difference of the mean relative abundance between navy bean compared to control at 4 weeks (p<0.05). Statistically-significant fold-differences are bolded.
Dietary modulation of urine metabolome in CRC survivors after 2 and 4 weeks
There were 703 identified metabolites from urine of 20 participants at all time points. The urine metabolites were classified in the metabolic pathways as shown for plasma. Supplementary Table 4 lists the relative abundance of all the identified urine metabolites and the respective metabolic pathways for the control and navy bean groups. Table 3 lists 10 urine metabolites that were significantly modulated in either the control, navy bean, or both study groups for 20 participants at 2 and/or 4 weeks compared to baseline (p < 0.05, q < 0.2). All data are presented as the mean fold-change in the median-scaled relative abundance of each metabolite. Figure 2A–D illustrates median-scaled relative abundance for gentisate, hippurate, salicylate, and N2,N5-diacetlyornithine that were significantly increased at week 4 when compared to their baseline in the intervention group. Individual change over time are shown in Supplementary Figure 4. These metabolites were chosen for their potential CRC protection and the four metabolites were identified in navy bean and study meals and snacks metabolomes.
Table 3.
Urine metabolites following consumption of control foods or navy bean-based foods for 2 and 4 weeks. Post intervention metabolite profiles were compared to baseline (0 weeks).
| Fold-changec | |||||||||||||
|---|---|---|---|---|---|---|---|---|---|---|---|---|---|
| Control group | Navy bean group | ||||||||||||
| Metabolite | 2wk/ 0wk | p-value | q-value | 4wk/ 0wk | p-value | q-value | 2wk/ 0wk | p-value | q-value | 4wk/ 0wk | p-value | q-value | |
| Amino Acids | |||||||||||||
| Histidine | N-acetyl-1-methylhistidine* | 0.78 | 0.072 | 0.791 | 0.62 | 0.000 | 0.147 | 1.00 | 0.998 | 1 | 1.00 | 0.975 | 1 |
| Lecine, Isoleucine and Valine | N6,N6,N6-trimethyllysine | 0.93 | 0.561 | 1 | 0.64 | 0.000 | 0.147 | 0.98 | 0.869 | 1 | 0.95 | 0.650 | 1 |
| Methionine, Cysteine, SAM and Taurine | N-methyltaurine | 2.70 | 0.018 | 0.584 | 2.05 | 0.084 | 0.534 | 4.20 | 0.001 | 0.111 | 2.29 | 0.048 | 0.927 |
| Urea cycle; Arginine and Proline | N2,N5-diacetylornithinea | 1.07 | 0.511 | 1 | 1.19 | 0.093 | 0.544 | 1.38 | 0.003 | 0.315 | 1.62 | 0.000 | 0.007 |
| pro-hydroxy-pro | 0.86 | 0.207 | 1 | 0.59 | 0.000 | 0.020 | 0.98 | 0.880 | 1 | 1.13 | 0.296 | 1 | |
| Carbohydrate | |||||||||||||
| Pentose | Ribonatea,b | 1.52 | 0.033 | 0.684 | 1.58 | 0.022 | 0.398 | 2.15 | 0.000 | 0.049 | 1.83 | 0.002 | 0.324 |
| Cofactors & Vitamins | |||||||||||||
| Tocopherol | gamma-CEHC glucuronide* | 0.76 | 0.137 | 1 | 0.86 | 0.423 | 0.817 | 0.52 | 0.000 | 0.109 | 0.58 | 0.004 | 0.405 |
| alpha-CEHC glucuronide* | 0.79 | 0.196 | 1 | 0.97 | 0.867 | 0.996 | 0.49 | 0.000 | 0.049 | 0.71 | 0.061 | 0.927 | |
| alpha-CEHC sulfate | 0.71 | 0.061 | 0.751 | 0.74 | 0.089 | 0.536 | 0.50 | 0.000 | 0.049 | 0.73 | 0.083 | 0.935 | |
| Xenobiotics | |||||||||||||
| Food Component/Plant | 4-allylphenol sulfate | 3.95 | 0.000 | 0.000 | 5.09 | 0.000 | 0.000 | 4.07 | 0.000 | 0.000 | 4.25 | 0.000 | 0.000 |
CEHC, Carboxyethyl-hydroxychromans
Indicates that the metabolite identified was not made against a purified chemical standard.
Metabolite also identified from the Navy Bean metabolome.
Metabolite also identified from the study food metabolome.
Values presented are fold-change of the mean relative abundance within control and navy bean at 2 and 4 weeks compared to their baselines (p<0.05) and (q<0.2). Statistically-significant fold-changes are bold and shaded. Light shaded represent metabolites and pathways that showed trends towards significance (0.05 < p < 0.10).
Figure 2.
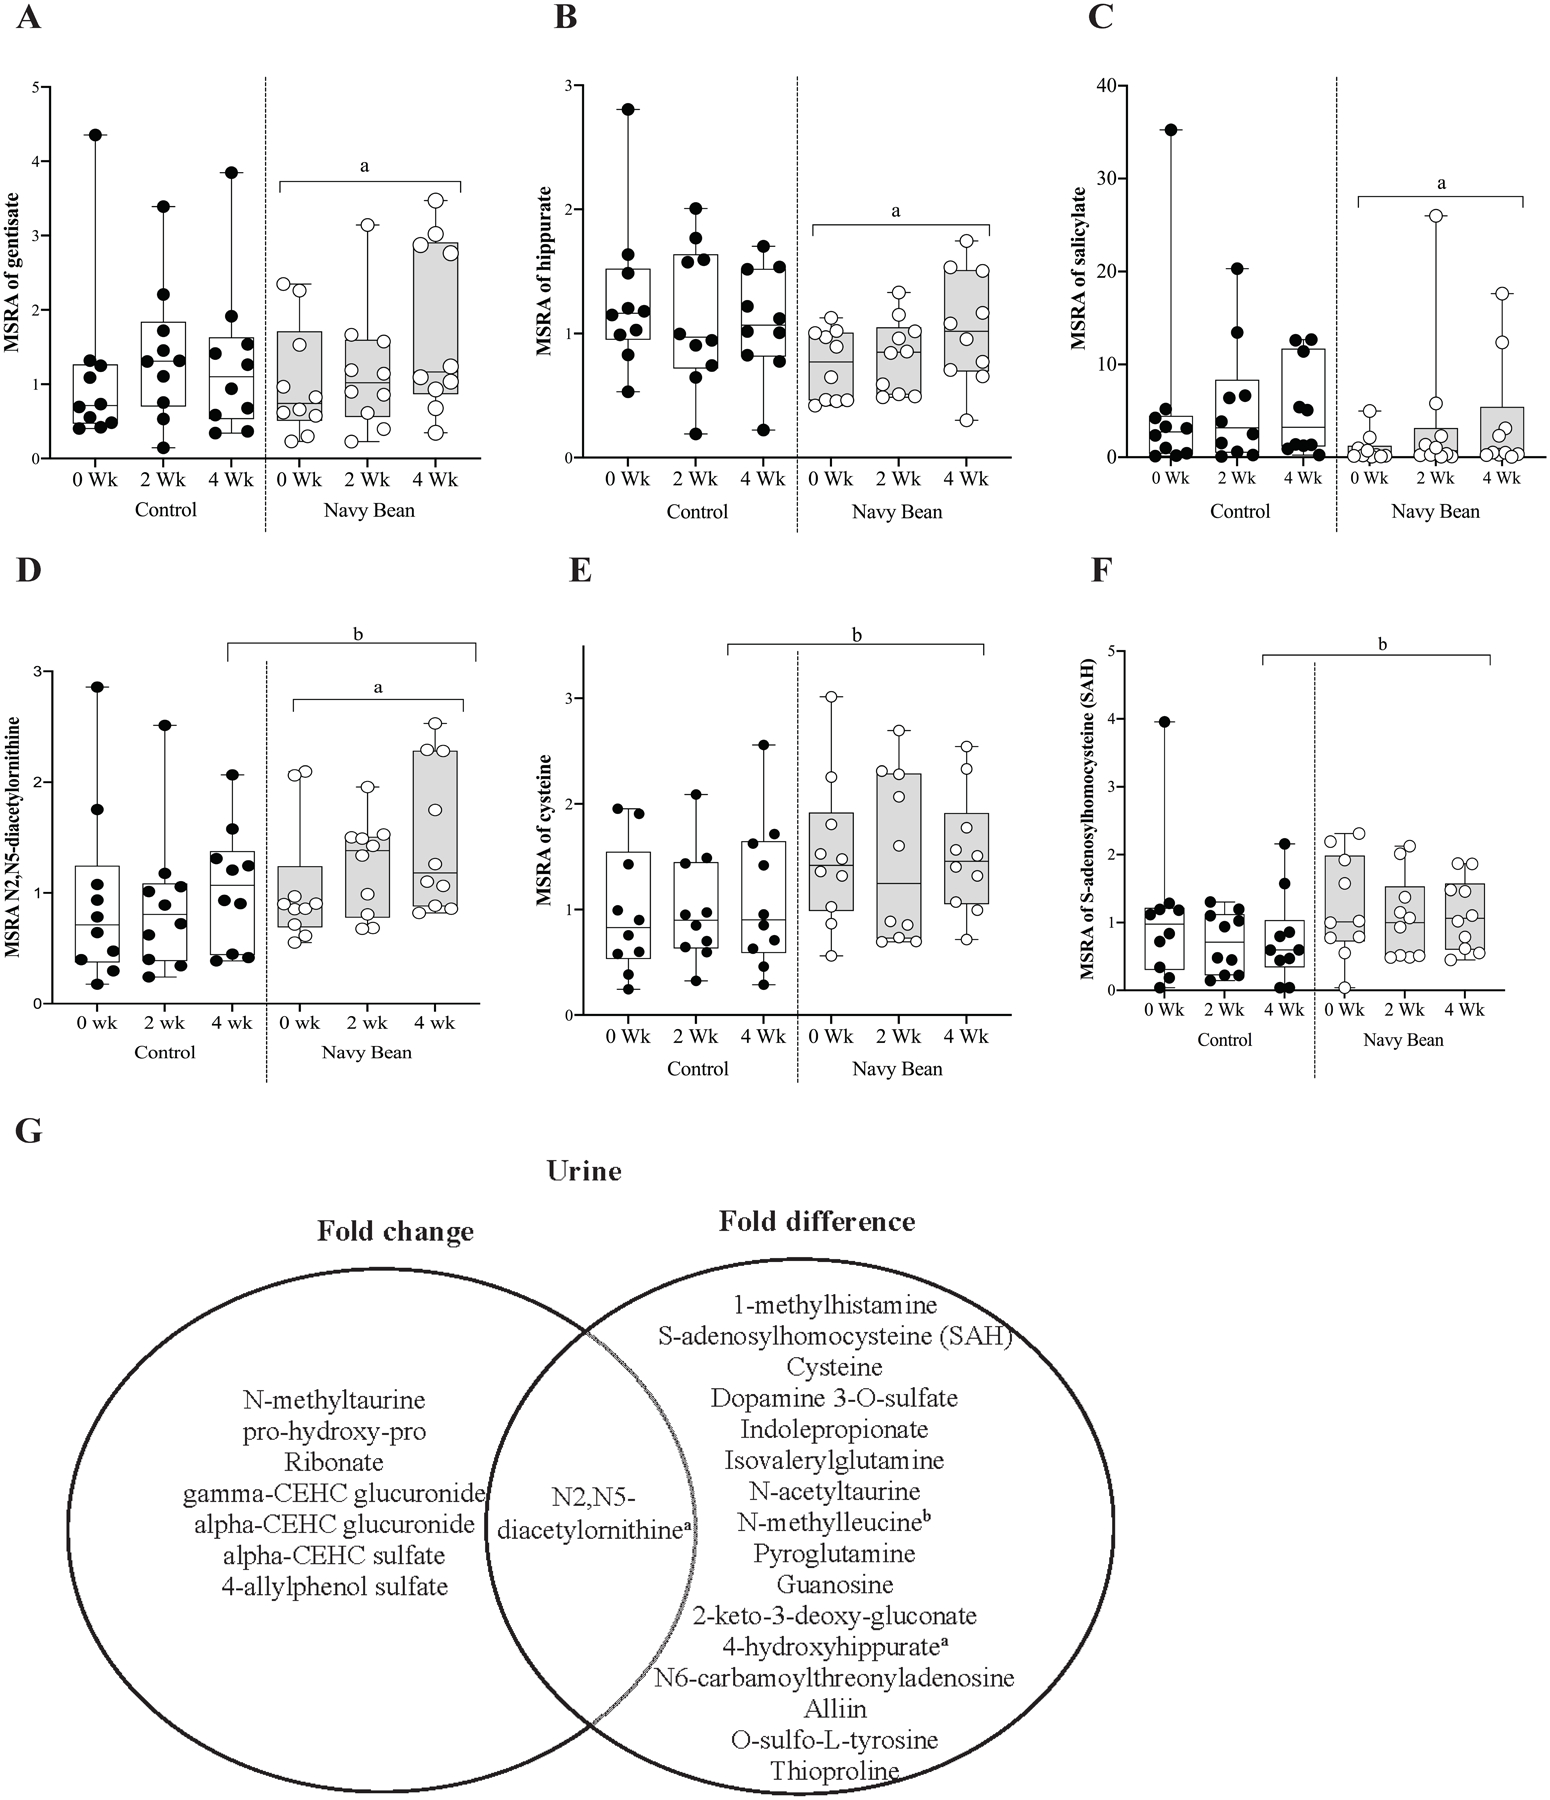
Median-scaled relative abundance (MSRA) of selected amino acids and phytochemicals for control or navy bean at 0, 2 and 4 weeks post dietary intervention in urine. A. gentisate, B. hippurate, C. salicylate, D. N2,N5-diacetlyornithine E. cysteine, F. S-adenosylhomocysteine
a= significant fold-change, b = significant fold-difference (p< 0.05). G. Venn diagram summarizes urine metabolites with statistical significance to navy bean intake. The left circle includes metabolites with fold changes at two or four weeks of navy bean intake compared to baseline, and the right circle shows metabolites with fold differences between the control and bean groups (4-week timepoint). Overlapping metabolites of statistical significance in each analysis are listed in the center.
Table 4 lists 16 urine metabolites with significant differences in the abundance between intervention and control for the 20 participants at 4 weeks (p < 0.05, q < 0.2. For all participants, data are presented as the mean fold-difference between intervention and control at 4 weeks. The 14 urine metabolites increased in abundance for the navy bean group were 1-methylhistamine (1.72-fold), cysteine (1.6-fold), N2,N5-diacetylornithine (1.55-fold), N-acetyltaurine (1.57-fold), pyroglutamine (1.74-fold), S-adenosylhomocysteine (SAH) (2.09-fold), N6-carbamoylthreonyladenosine (1.44-fold), guanosine (2.81-fold), 2-keto-3-deoxy-gluconate (2.18-fold), 4-hydroxyhippurate (1.92-fold), alliin (3.34-fold), O-sulfo-L-tyrosine (1.33-fold), and thioproline (2.66-fold). The three urine metabolites that decreased in abundance for the navy bean group were dopamine 3-O-sulfate (0.45-fold), indolepropionate (0.35-fold), and isovalerylglutamine (0.53-fold). Among these 17 urine metabolites, eight metabolites were identified in the navy beans, including cysteine, N2,N5-diacetylornithine, pyroglutamine, SAH, N6-carbamoylthreonyladenosine. guanosine, 4-hydroxyhippurate, and O-sulfo-L-tyrosin (see Table 4, footnote a) and five urine metabolites were identified in the study meals and snacks metabolome, including cysteine, pyroglutamine, SAH, guanosine and O-sulfo-L-tyrosine (see Table 4, footnote b). Navy bean derived metabolites were distinguished for presence and abundance in urine of the intervention group compared to control. Figure 2D–F illustrates the median-scaled relative abundance for amino acids with anti-inflammatory potential; N2, N5-diacetylornithine, cysteine, and SAH which were identified in the navy bean metabolome. The Venn diagram shown in Figure 2G highlights 23 urine metabolites (statistical significance by fold-change or fold-difference) in urine at 2 or 4 weeks after dietary bean intervention. N2,N5-diacetylornithine was the only urine metabolite with overlap in the analyses at 4 weeks in the intervention group.
Table 4.
Navy bean consumption revealed distinct urine metabolites after 4 weeks compared to a control intervention for 4 weeks
| Fold-difference* | |||
|---|---|---|---|
| Metabolite | HMDB | Navy Bean | p-value |
| Amino Acid | |||
| 1-methylhistamine | HMDB00898 | 1.72 | 0.034 |
| Cysteinea,b | HMDB00574 | 1.60 | 0.048 |
| Dopamine 3-O-sulfate | HMDB06275 | 0.45 | 0.025 |
| Indolepropionate | HMDB02302 | 0.35 | 0.038 |
| Isovalerylglutamine | - | 0.53 | 0.006 |
| N2,N5-diacetylornithine1 | - | 1.55 | 0.020 |
| N-acetyltaurine | - | 1.57 | 0.050 |
| N-methylleucineb | - | 19.60 | 0.000 |
| Pyroglutaminea,b | - | 1.74 | 0.006 |
| S-adenosylhomocysteine (SAH)a,b | HMDB00939 | 2.09 | 0.027 |
| Nucleotide | |||
| N6-carbamoylthreonyladenosinea | HMDB41623 | 1.44 | 0.037 |
| Guanosinea,b | HMDB00133 | 2.81 | 0.034 |
| Xenobiotics | |||
| 2-keto-3-deoxy-gluconate | HMDB01353 | 2.18 | 0.018 |
| 4-hydroxyhippuratea | HMDB13678 | 1.92 | 0.036 |
| Alliin | HMDB33592 | 3.34 | 0.034 |
| O-sulfo-L-tyrosinea,b | - | 1.33 | 0.026 |
| Thioproline | - | 2.66 | 0.009 |
HMDB, Human Metabolome Database
Metabolite also identified from the Navy Bean metabolome.
Metabolite also identified from the study food metabolome.
Values presented are fold-difference of the mean relative abundance between navy bean compared to control at 4 weeks (p<0.05). Statistically-significantly increased fold-differences are bold.
Discussion
This study established that increased navy bean consumption for 4 weeks produced metabolic shifts in plasma and urine profiles of overweight and obese CRC survivors at risk for recurrence. The plasma and urine metabolites that showed changes in abundance over time or differences between the two study groups were also compared to the phytochemical compounds that originate from navy beans (including the meals and snacks that contained navy beans). This integration of the navy bean-metabolites with the results from changes in plasma and urine have established novel relationships between bean exposure in the diet and cancer prevention biomarkers in adults. There are also a number of metabolites discussed below from distinct metabolic pathways that support novel associations for bean intake with anti-inflammatory, antioxidant and anti-cancer mechanisms that may reduce cancer risk. Thus, plasma and urine metabolites have potential to dually serve as biomarkers of dietary navy beans exposure and metabolic health to prevent and control colon cancer.
Six plasma metabolites modulated by navy bean consumption and that have cancer control and prevention relevance from this study are S-methylcysteine, pipecolate, 3-(4-hydroxyphenyl)propionate, N-delta-acetylornithine, S-allylcysteine, and 2,3-dihydroxy-2-methylbutyrate (Tables 1 and 2/Figures 2). S-methylcysteine, a water-soluble organosulfur compound, may be a biomarker of dietary exposure as it was previously identified from common bean (Phaseolus vulgaris) [39, 40]. Cysteine related components have also demonstrated suppression of chemical induced carcinogenesis [41]. S-methylcysteine was reported to inhibit the formation of glutathione S-transferase placental form-positive foci (GST-P-positive foci) which are markers for pre-neoplastic lesions [42] and was also found to inhibit ornithine decarboxylase (ODC), an enzyme which is upregulated in a wide variety of cancers [43]. ODC is essential in biosynthesis of polyamines [44], namely antioxidants important for stabilizing DNA structure [45]. Lack of ODC has been found to cause cell apoptosis in embryonic mice, induced by DNA damage [46]. S-allylcysteine was also increased in plasma (Table 2) and has antioxidant properties [47, 48], cholesterol-lowering [49] and anti-cancer effects on clusters of abnormal tube-like glands in the lining of the colon and rectum called aberrant crypt foci. A decreased level of urinary cysteine warranted discussion as cysteine is a unique thiol containing amino acid that can undergo oxidation/reduction (redox) reactions with antioxidant properties and may reduce inflammation [50, 51]. These metabolite changes collectively may reduce cell division to decrease risk for CRC recurrence.
Pipecolate represents another candidate dietary biomarker of bean consumption [39] that has functional relevance to this prospective cohort investigation because this phytochemical serves as a precursor to gut microbial metabolism and has anti-inflammatory, antitumor, and antibiotic properties [52–54]. 3-(4-hydroxyphenyl)propionate was also increased following navy bean intake and is a small phenolic acid produced from biotransformation of large polyphenols by human colonic microflora [55]. Phenolic acids exert effects on carcinogen bioactivation, cell-signaling, cell cycle regulation, angiogenesis, oxidative stress, and inflammation [56, 57]. 2,3-dihydroxy-2-methylbutyrate is a normal organic acid constituent of the gut and the increase measured herein for plasma of navy bean consumers suggested beneficial roles against inflammation and alterations to microbiota. Polyunsaturated fatty acids (PUFA), such as EPA (20:5n3) that is a navy bean metabolite, were shown to exert anticancer activities in various stages of cancer progression, such as cell proliferation, metastasis, inflammation, cell survival, and angiogenesis [58, 59].
This next group of metabolites have mechanistic links to diverse epigenetic modifications involved in cancer progression. Benzoic acid (navy bean metabolite) has naturally occurring derivatives with potential to suppress cancer cell growth by blocking histone deacetylase, a key enzyme involved in tumor regulatory gene expression [60]. The decreased urinary SAH following daily bean intake is important as an inhibitor of methyltransferases, the key enzymes for DNA methylation that may cause aberrant DNA methylation patterns in colon cancer [61]. Higher abundance of SAH could be important to block aberrant DNA methylation and dysregulation of histones and gene expression that stimulate carcinogenesis [62]. Both choline and betaine were decreased in plasma from this study, and the roles in CRC merit attention as they are essential to one-carbon metabolism [63–65]. The lack of choline was shown to promote fatty liver disease, DNA hypomethylation, and tumor development (in the absence of carcinogens) [66] and an epidemiological study showed that the risk of colorectal adenomas statistically increased with increasing choline intake [66]. Betaine is notably an oxidation product of choline, and a methyl donor that has nutrient contributions for the prevention of chronic diseases [67].
There were multiple metabolites identified in this study with associated mechanisms to CRC prevention that relate to metabolism by the gut microbiota. These may include, but were not limited to 3-(4-hydroxyphenyl)lactate, N2,N5-diacetylornithine, hippurate and salicylate. High urinary levels of 3-(4-hydroxyphenyl)lactate was found in individuals with tyrosine malabsorption and bacterial overgrowth [68, 69], and our data suggests improved tyrosine absorption and balanced gut microflora with navy bean intake. Dietary bean intake influences on metabolism by gut microbiota were also shown by changes to indole propionate, 4-hydroxyhippurate and 3-(4-hydroxyphenyl)propionate that have been reported previously in stool [3, 36].
The limitations of this study include the small cohort size. The acute (one-month) study duration of the diet intervention may also be considered a limitation, yet these metabolite changes detected early-on following dietary change may have long-term impacts. The study participants were free-living individuals and the study-provided meals and snacks contributed ~35% of daily intake. Follow up investigations will utilize a larger sample size and a longer duration of elevated navy bean exposure may be needed to observe colon tissue metabolic changes that will improve cancer control, treatment, and prevention outcomes.
Conclusion
This study supports that an elaborate array of interactions between food, host digestion and gut microbial metabolism occurs in overweight and obese CRC survivors. Plasma and urine metabolites that merit attention for validation after the daily consumption of navy beans in adults are 2,3-dihydroxy-2-methylbutyrate, pipecolate, and S-methylcysteine (in plasma), and N2,N5-diacetylornithine and 4-hydroxyhippurate (in urine). The metabolite results shown for blood and urine were integrated with the analysis of phytochemicals originating from the navy beans, and revealed the amino acid and lipid metabolism pathways as mechanistic targets to reduce CRC recurrence following dietary bean intervention. Assessing the bioactivity and bioavailability of navy bean-derived phytochemicals in human colon tissue is one future analytical approach to validate food-exposure biomarkers with primary and secondary CRC prevention outcomes.
Supplementary Material
Acknowledgements
Funding for this study was provided by National Institutes Health - National Cancer Institute (1R21CA161472), National Institute of Food and Agriculture (NIFA) (2016-67001-24538), the University of Colorado Cancer Center - Division of Cancer Prevention and Control pilot award program, and the Dry Bean Health Research Group. The authors appreciate the collaboration of University of Colorado Health-North Cancer Center and the Oncology Clinical Research team.
The authors wish to thank the study subjects for their participation.
Abbreviations
- CRC
colorectal cancer
- GC-MS
gas chromatography–mass spectrometry
- UHPLC-MS/MS
ultra-high-performance liquid chromatography-tandem mass spectrometry
- PUFA
polyunsaturated fatty acid
- DGLA
dihomo-linolenoylcarnitine (20:3n3 or 6)
- SAH
S-adenosylhomocysteine
- DHEA-S
dehydroisoandrosterone sulfate
- BCG
β-citrylglutamate
- ODC
ornithine decarboxylase
- GCP2
glutamate carboxypeptidase 2
- DHA
docosahexaenoate
- EPA
eicosapentaenoate
- SAM
S-adenosylmethionine
- GPC
glycerophosphocholine
- GPE
glycerophosphoethanolamine
- GPG
glycerophosphoglycerol
- GPI
glycerophosphoinositol
- HMDB
Human Metabolome Database
- GABA
γ-aminobutyric acid
- CEHC
carboxyethyl-hydroxychromans
- HODE
hydroxy-10(E),12(Z)-octadecadienoic acid
- HILIC
hydrophilic interaction chromatography
- RP
reverse phase chromatography
Footnotes
Clinical trial registry numbers: Beans/Bran Enriching Nutritional Eating For Intestinal health Trial (BENEFIT) (clinical trial # NCT01929122).
Prevention Relevance Statement: This clinical study suggests that increased consumption of navy beans would deliver bioactive metabolites to individuals at high-risk for colorectal cancer recurrence and produce metabolic shifts in plasma and urine profiles.
Disclosure of Potential Conflict of Interest
The authors declare that they have no potential conflicts of interest.
The datasets used and/or analyzed during the current study are available as supplementary material along with this article.
Ethics approval and consent to participate
All procedures performed in this study were in accordance with the ethical standards of the Colorado State University and University of Colorado Health-North Institutional Review Board, and with the 1964 Helsinki Declaration and its 2013 amendments. Informed consent was obtained from all individual participants before included in the study. This trial was registered at clinicaltrials.gov under NCT01929122.
References
- 1.Bennink MR, Consumption of Black Beans and Navy Beans (Phaseolus vulgaris) Reduced Azoxymethane-Induced Colon Cancer in Rats. Nutrition and Cancer, 2002. 44(1): p. 60–65. [DOI] [PubMed] [Google Scholar]
- 2.Moreno‐Jiménez MR, et al. , Mechanisms associated to apoptosis of cancer cells by phenolic extracts from two canned common beans varieties (Phaseolus vulgaris L.). 2018: p. e12680. [DOI] [PubMed] [Google Scholar]
- 3.Baxter BA, Oppel RC, and Ryan EP, Navy Beans Impact the Stool Metabolome and Metabolic Pathways for Colon Health in Cancer Survivors. Nutrients, 2018. 11(1): p. 28. [DOI] [PMC free article] [PubMed] [Google Scholar]
- 4.Tuyns A, et al. , Dietary Intake of Fiber and Decreased Risk of Cancers of the Colon and Rectum: Evidence From the Combined Analysis of 13 Case-Control Studies. JNCI: Journal of the National Cancer Institute, 1992. 84(24): p. 1887–1896. [DOI] [PubMed] [Google Scholar]
- 5.Cummings JH, et al. , Fecal weight, colon cancer risk, and dietary intake of nonstarch polysaccharides (dietary fiber). Gastroenterology, 1992. 103(6): p. 1783–1789. [DOI] [PubMed] [Google Scholar]
- 6.Zhang X, et al. , The BE GONE trial study protocol: a randomized crossover dietary intervention of dry beans targeting the gut microbiome of overweight and obese patients with a history of colorectal polyps or cancer. BMC cancer, 2019. 19(1): p. 1233–1233. [DOI] [PMC free article] [PubMed] [Google Scholar]
- 7.Zhu B, et al. , Dietary legume consumption reduces risk of colorectal cancer: evidence from a meta-analysis of cohort studies. Sci Rep, 2015. 5: p. 8797. [DOI] [PMC free article] [PubMed] [Google Scholar]
- 8.Slavin JL, Dietary fiber and body weight. Nutrition, 2005. 21(3): p. 411–418. [DOI] [PubMed] [Google Scholar]
- 9.Tjønneland A, et al. , Dietary fiber and subsequent changes in body weight and waist circumference in European men and women. The American Journal of Clinical Nutrition, 2009. 91(2): p. 329–336. [DOI] [PubMed] [Google Scholar]
- 10.Pereira MA and Ludwig DS, DIETARY FIBER AND BODY-WEIGHT REGULATION: Observations and Mechanisms. Pediatric Clinics of North America, 2001. 48(4): p. 969–980. [DOI] [PubMed] [Google Scholar]
- 11.Luhovyy BL, et al. , Canned Navy Bean Consumption Reduces Metabolic Risk Factors Associated with Obesity. Canadian Journal of Dietetic Practice and Research, 2015. 76(1): p. 33–37. [DOI] [PubMed] [Google Scholar]
- 12.Ferreira H, et al. , Benefits of pulse consumption on metabolism and health: A systematic review of randomized controlled trials. Crit Rev Food Sci Nutr, 2020: p. 1–12. [DOI] [PubMed] [Google Scholar]
- 13.McGinley JN, et al. , Pulse Crop Effects on Gut Microbial Populations, Intestinal Function, and Adiposity in a Mouse Model of Diet-Induced Obesity. Nutrients, 2020. 12(3): p. 593. [DOI] [PMC free article] [PubMed] [Google Scholar]
- 14.Ludwig DS, et al. , Dietary Fiber, Weight Gain, and Cardiovascular Disease Risk Factors in Young Adults. JAMA, 1999. 282(16): p. 1539–1546. [DOI] [PubMed] [Google Scholar]
- 15.King DE, Dietary fiber, inflammation, and cardiovascular disease. Molecular Nutrition & Food Research, 2005. 49(6): p. 594–600. [DOI] [PubMed] [Google Scholar]
- 16.Curran J, The nutritional value and health benefits of pulses in relation to obesity, diabetes, heart disease and cancer. British Journal of Nutrition, 2012. 108(S1): p. S1–S2. [DOI] [PubMed] [Google Scholar]
- 17.Hughes JS, Ganthavorn C, and Wilson-Sanders S, Dry beans inhibit azoxymethane-induced colon carcinogenesis in F344 rats. J Nutr, 1997. 127(12): p. 2328–33. [DOI] [PubMed] [Google Scholar]
- 18.Hangen L and Bennink MR, Consumption of black beans and navy beans (Phaseolus vulgaris) reduced azoxymethane-induced colon cancer in rats. Nutr Cancer, 2002. 44(1): p. 60–5. [DOI] [PubMed] [Google Scholar]
- 19.Mitchell DC, et al. , Consumption of Dry Beans, Peas, and Lentils Could Improve Diet Quality in the US Population. Journal of the American Dietetic Association, 2009. 109(5): p. 909–913. [DOI] [PubMed] [Google Scholar]
- 20.Bobe G, et al. , Dietary cooked navy beans and their fractions attenuate colon carcinogenesis in azoxymethane-induced ob/ob mice. Nutr Cancer, 2008. 60(3): p. 373–81. [DOI] [PMC free article] [PubMed] [Google Scholar]
- 21.Mentor-Marcel RA, et al. , Inflammation-associated serum and colon markers as indicators of dietary attenuation of colon carcinogenesis in ob/ob mice. Cancer Prev Res (Phila), 2009. 2(1): p. 60–9. [DOI] [PMC free article] [PubMed] [Google Scholar]
- 22.Armitage EG and Ciborowski M, Applications of Metabolomics in Cancer Studies. Adv Exp Med Biol, 2017. 965: p. 209–234. [DOI] [PubMed] [Google Scholar]
- 23.Spratlin JL, Serkova NJ, and Eckhardt SG, Clinical applications of metabolomics in oncology: a review. Clin Cancer Res, 2009. 15(2): p. 431–40. [DOI] [PMC free article] [PubMed] [Google Scholar]
- 24.O’Gorman A and Brennan L, The role of metabolomics in determination of new dietary biomarkers. Proc Nutr Soc, 2017. 76(3): p. 295–302. [DOI] [PubMed] [Google Scholar]
- 25.Gibbons H and Brennan L, Metabolomics as a tool in the identification of dietary biomarkers. Proc Nutr Soc, 2017. 76(1): p. 42–53. [DOI] [PubMed] [Google Scholar]
- 26.Thompson MD, et al. , Mechanisms Associated with Dose-Dependent Inhibition of Rat Mammary Carcinogenesis by Dry Bean (Phaseolus vulgaris, L.). The Journal of Nutrition, 2008. 138(11): p. 2091–2097. [DOI] [PubMed] [Google Scholar]
- 27.Campos-Vega R, et al. , Bean (Phaseolus vulgaris L.) polysaccharides modulate gene expression in human colon cancer cells (HT-29). Food Research International, 2010. 43(4): p. 1057–1064. [Google Scholar]
- 28.Moreno-Jiménez MR, et al. , Mechanisms associated to apoptosis of cancer cells by phenolic extracts from two canned common beans varieties (Phaseolus vulgaris L.). Journal of Food Biochemistry, 2019. 43(6): p. e12680. [DOI] [PubMed] [Google Scholar]
- 29.Rondini EA and Bennink MR, Microarray Analyses of Genes Differentially Expressed by Diet (Black Beans and Soy Flour) during Azoxymethane-Induced Colon Carcinogenesis in Rats. J Nutr Metab, 2012. 2012: p. 351796. [DOI] [PMC free article] [PubMed] [Google Scholar]
- 30.Daniell EL, et al. , Dietary dry bean effects on hepatic expression of stress and toxicity-related genes in rats. Br J Nutr, 2012. 108 Suppl 1: p. S37–45. [DOI] [PubMed] [Google Scholar]
- 31.Auslander N, et al. , A joint analysis of transcriptomic and metabolomic data uncovers enhanced enzyme-metabolite coupling in breast cancer. Scientific Reports, 2016. 6(1): p. 29662. [DOI] [PMC free article] [PubMed] [Google Scholar]
- 32.Seow WJ, et al. , Association of Untargeted Urinary Metabolomics and Lung Cancer Risk Among Never-Smoking Women in China. JAMA Network Open, 2019. 2(9): p. e1911970–e1911970. [DOI] [PMC free article] [PubMed] [Google Scholar]
- 33.Playdon MC, et al. , Comparing metabolite profiles of habitual diet in serum and urine. Am J Clin Nutr, 2016. 104(3): p. 776–89. [DOI] [PMC free article] [PubMed] [Google Scholar]
- 34.Zambrana LE, et al. , Rice bran supplementation modulates growth, microbiota and metabolome in weaning infants: a clinical trial in Nicaragua and Mali. Sci Rep, 2019. 9(1): p. 13919. [DOI] [PMC free article] [PubMed] [Google Scholar]
- 35.Borresen EC, et al. , A Randomized Controlled Trial to Increase Navy Bean or Rice Bran Consumption in Colorectal Cancer Survivors. Nutrition and Cancer, 2016. 68(8): p. 1269–1280. [DOI] [PMC free article] [PubMed] [Google Scholar]
- 36.Sheflin AM, et al. , Dietary supplementation with rice bran or navy bean alters gut bacterial metabolism in colorectal cancer survivors. Molecular nutrition & food research, 2017. 61(1): p. 10.1002/mnfr.201500905. [DOI] [PMC free article] [PubMed] [Google Scholar]
- 37.Borresen EC, et al. , Feasibility of Increased Navy Bean Powder Consumption for Primary and Secondary Colorectal Cancer Prevention. Current nutrition and food science, 2014. 10(2): p. 112–119. [DOI] [PMC free article] [PubMed] [Google Scholar]
- 38.Zarei I, et al. , Rice Bran Metabolome Contains Amino Acids, Vitamins & Cofactors, and Phytochemicals with Medicinal and Nutritional Properties. Rice (N Y), 2017. 10(1): p. 24. [DOI] [PMC free article] [PubMed] [Google Scholar]
- 39.Perera T, et al. , Identification and monitoring of metabolite markers of dry bean consumption in parallel human and mouse studies. Molecular nutrition & food research, 2015. 59(4): p. 795–806. [DOI] [PMC free article] [PubMed] [Google Scholar]
- 40.Thompson JF, Morris CJ, and Zacharius RM, Isolation of (−) S-Methyl-L-Cysteine from Beans (Phaseolus vulgaris). Nature, 1956. 178(4533): p. 593–593. [Google Scholar]
- 41.Fukushima S, et al. , Suppression of Chemical Carcinogenesis by Water-Soluble Organosulfur Compounds. The Journal of Nutrition, 2001. 131(3): p. 1049S–1053S. [DOI] [PubMed] [Google Scholar]
- 42.Takada N, et al. , S-methylcysteine and cysteine are inhibitors of induction of glutathione S-transferase placental form-positive foci during initiation and promotion phases of rat hepatocarcinogenesis. Japanese journal of cancer research : Gann, 1997. 88(5): p. 435–442. [DOI] [PMC free article] [PubMed] [Google Scholar]
- 43.Vijayaraghavan M, et al. , Inhibitory effects of S-methylcysteine and cysteine on the promoting potential of sodium phenobarbital on rat liver carcinogenesis. Japanese journal of cancer research : Gann, 2000. 91(8): p. 780–785. [DOI] [PMC free article] [PubMed] [Google Scholar]
- 44.Kern AD, et al. , Structure of mammalian ornithine decarboxylase at 1.6 Å resolution: stereochemical implications of PLP-dependent amino acid decarboxylases. Structure, 1999. 7(5): p. 567–581. [DOI] [PubMed] [Google Scholar]
- 45.Rato C, et al. , Translational recoding as a feedback controller: systems approaches reveal polyamine-specific effects on the antizyme ribosomal frameshift. Nucleic acids research, 2011. 39(11): p. 4587–4597. [DOI] [PMC free article] [PubMed] [Google Scholar]
- 46.Pendeville H, et al. , The ornithine decarboxylase gene is essential for cell survival during early murine development. Molecular and cellular biology, 2001. 21(19): p. 6549–6558. [DOI] [PMC free article] [PubMed] [Google Scholar]
- 47.Numagami Y and Ohnishi ST, S-Allylcysteine Inhibits Free Radical Production, Lipid Peroxidation and Neuronal Damage in Rat Brain Ischemia. The Journal of Nutrition, 2001. 131(3): p. 1100S–1105S. [DOI] [PubMed] [Google Scholar]
- 48.Colín-González AL, et al. , The Antioxidant Mechanisms Underlying the Aged Garlic Extract- and S-Allylcysteine-Induced Protection. Oxidative Medicine and Cellular Longevity, 2012. 2012: p. 16. [DOI] [PMC free article] [PubMed] [Google Scholar]
- 49.Liu L and Yeh Y-Y, Cholesterol-Lowering Effect of Garlic Extracts and Organosulfur Compounds: Human and Animal Studies. The Journal of Nutrition, 2001. 131(3): p. 989S–993S. [DOI] [PubMed] [Google Scholar]
- 50.Iyer SS, et al. , Cysteine redox potential determines pro-inflammatory IL-1beta levels. PloS one, 2009. 4(3): p. e5017–e5017. [DOI] [PMC free article] [PubMed] [Google Scholar]
- 51.Hatono S, Jimenez A, and Wargovich MJ, Chemopreventive effect of S-allylcysteine and its relationship to the detoxification enzyme glutathione S-transferase. Vol. 17. 1996. 1041–4. [DOI] [PubMed] [Google Scholar]
- 52.He M, Pipecolic acid in microbes: biosynthetic routes and enzymes. Journal of Industrial Microbiology and Biotechnology, 2006. 33(6): p. 401–407. [DOI] [PubMed] [Google Scholar]
- 53.Natarajan SK, et al. , Evidence for Pipecolate Oxidase in Mediating Protection Against Hydrogen Peroxide Stress. Journal of cellular biochemistry, 2017. 118(7): p. 1678–1688. [DOI] [PMC free article] [PubMed] [Google Scholar]
- 54.Broquist HP, Lysine-Pipecolic Acid Metabolic Relationships in Microbes and Mammals. Annual Review of Nutrition, 1991. 11(1): p. 435–448. [DOI] [PubMed] [Google Scholar]
- 55.Rios LY, et al. , Chocolate intake increases urinary excretion of polyphenol-derived phenolic acids in healthy human subjects. The American Journal of Clinical Nutrition, 2003. 77(4): p. 912–918. [DOI] [PubMed] [Google Scholar]
- 56.Ward NC, et al. , Supplementation with Grape Seed Polyphenols Results in Increased Urinary Excretion of 3-Hydroxyphenylpropionic Acid, an Important Metabolite of Proanthocyanidins in Humans. Journal of Agricultural and Food Chemistry, 2004. 52(17): p. 5545–5549. [DOI] [PubMed] [Google Scholar]
- 57.Le Marchand L, Cancer preventive effects of flavonoids—a review. Biomedicine & Pharmacotherapy, 2002. 56(6): p. 296–301. [DOI] [PubMed] [Google Scholar]
- 58.Volpato M and Hull MA, Omega-3 polyunsaturated fatty acids as adjuvant therapy of colorectal cancer. Cancer and Metastasis Reviews, 2018. 37(2): p. 545–555. [DOI] [PMC free article] [PubMed] [Google Scholar]
- 59.Park J-M, et al. , Omega-3 polyunsaturated Fatty acids as potential chemopreventive agent for gastrointestinal cancer. Journal of cancer prevention, 2013. 18(3): p. 201–208. [DOI] [PMC free article] [PubMed] [Google Scholar]
- 60.Anantharaju PG, et al. , Naturally occurring benzoic acid derivatives retard cancer cell growth by inhibiting histone deacetylases (HDAC). Cancer biology & therapy, 2017. 18(7): p. 492–504. [DOI] [PMC free article] [PubMed] [Google Scholar]
- 61.Lao VV and Grady WM, Epigenetics and colorectal cancer. Nature reviews. Gastroenterology & hepatology, 2011. 8(12): p. 686–700. [DOI] [PMC free article] [PubMed] [Google Scholar]
- 62.Shrubsole MJ, et al. , Associations between S-adenosylmethionine, S-adenosylhomocysteine, and colorectal adenoma risk are modified by sex. American journal of cancer research, 2014. 5(1): p. 458–465. [PMC free article] [PubMed] [Google Scholar]
- 63.Ziegler RG and Lim U, One-Carbon Metabolism, Colorectal Carcinogenesis, Chemoprevention—with Caution. JNCI: Journal of the National Cancer Institute, 2007. 99(16): p. 1214–1215. [DOI] [PubMed] [Google Scholar]
- 64.Zeisel SH and da Costa KA, Choline: an essential nutrient for public health. Nutr Rev, 2009. 67(11): p. 615–23. [DOI] [PMC free article] [PubMed] [Google Scholar]
- 65.Craig SA, Betaine in human nutrition. The American Journal of Clinical Nutrition, 2004. 80(3): p. 539–549. [DOI] [PubMed] [Google Scholar]
- 66.Cho E, et al. , Dietary choline and betaine and the risk of distal colorectal adenoma in women. Journal of the National Cancer Institute, 2007. 99(16): p. 1224–1231. [DOI] [PMC free article] [PubMed] [Google Scholar]
- 67.Ueland PM, Choline and betaine in health and disease. Journal of Inherited Metabolic Disease, 2011. 34(1): p. 3–15. [DOI] [PubMed] [Google Scholar]
- 68.Spaapen LJM, et al. , Urinary D-4-hydroxyphenyllactate, D-phenyllactate and D-2-hydroxyisocaproate, abnormalities of bacterial origin. Journal of Inherited Metabolic Disease, 1987. 10(4): p. 383–390. [DOI] [PubMed] [Google Scholar]
- 69.Beloborodova N, et al. , Effect of phenolic acids of microbial origin on production of reactive oxygen species in mitochondria and neutrophils. Journal of biomedical science, 2012. 19(1): p. 89–89. [DOI] [PMC free article] [PubMed] [Google Scholar]
Associated Data
This section collects any data citations, data availability statements, or supplementary materials included in this article.