

Abstract
INTRODUCTION:
Obstructive Sleep Apnea (OSA) is associated with Alzheimer’s disease (AD) biomarkers in cognitive normal (CN) and mild cognitive impaired (MCI) participants. However, independent and combined effects of OSA, Aβ and tau-accumulation on AD time-dependent-progression risk is unclear.
METHODS:
Study participants grouped by biomarker profile, as described by the A/T/N scheme, where “A” refers to aggregated Aβ, “T” aggregated tau and “N” to neurodegeneration, included 258 CN (OSA+ [A+TN+ n=10, A+/TN− n=6, A−/TN+ n=10, A−/TN− n=6 and OSA− [A+TN+ n=84, A+/TN− n=11, A−/TN+ n=96, A−/TN− n=36]) and 785 MCI (OSA+ [A+TN+ n=35, A+/TN− n=15, A−/TN+ n=25, A−/TN− n=16 and OSA− [A+TN+ n=388, A+/TN− n=28, A−/TN+ n=164, A−/TN− n=114]) older-adults from Alzheimer’s Disease Neuroimaging Initiative cohort. Cox proportional hazards regression models estimated the relative hazard of progression from CN-to-MCI and MCI-to-AD, among baseline OSA CN and MCI-patients respectively. Multi-level logistic mixed-effects models with random intercept and slope investigated the synergistic associations of self-reported OSA, Aβ and Tau burden with prospective cognitive decline.
RESULTS:
Independent of TN-status (CN and MCI), OSA+/Aβ+ participants were approximately two to four times more likely to progress to MCI/AD (p<.001) and progressed six to eighteen months earlier (p<.001), compared to other participants combined (i.e. OSA+/Aβ−, OSA−/Aβ+ and OSA−/Aβ−). Notably, OSA+/Aβ− vs. OSA−/Aβ− (CN and MCI) and OSA+/TN− vs. OSA−/TN− (CN) participants showed no difference in the risk and time-to-MCI/AD progression. Mixed effects models demonstrated OSA synergism with Aβ (CN and MCI [β=1.13, 95%CI, 0.74 to 1.52, and β = 1.18, 95%CI, 0.82 to 1.54]) respectively, and with tau ([MCI (β = 1.31, 95%CI, 0.87 to 1.47)], p< 0.001 for all.
DISCUSSION:
OSA acts in synergism with Aβ and with tau, and all three acting together result in synergistic neurodegenerative mechanisms especially as Aβ and tau-accumulation becomes increasingly-abnormal, thus leading to shorter progression time-to-MCI/Alzheimer’s disease (AD) in CN and MCI-OSA patients respectively.
Keywords: Obstructive sleep apnea; Alzheimer’s disease; Longitudinal study, CSF-biomarkers; Brain amyloid-PET; Aβ42; T-tau; P-tau
1. INTRODUCTION
Obstructive Sleep Apnea (OSA) increases Alzheimer’s disease (AD) risk1-6 and at cross-section, is associated with AD biomarkers, including the presence of significant brain Aβ and tau burden, measured either by cerebrospinal (CSF) Aβ42 or amyloid PET, and CSF levels of tau (i.e. total or hyperphosphorylated) or tau-PET, in both cognitive normal (CN) and mild cognitive impaired (MCI) participants..7-14 Recently, our group found that this cross-sectional association was not found in participants with PiB-negative scans,15 suggesting that the presence or absence of amyloid burden might act as a moderator in these relationships. A previous cross-sectional study suggested a similar phenomenon, with associations seen between increased amyloid deposition and higher apnea hypopnea index (AHI) indices in MCI patients but not among CN controls.11 More recently, we expanded the analysis of cross-sectional evaluations to 2-year follow-ups, first, in community-dwelling healthy CN elderly from New York City,15 and second, from purely CN older individuals to those across the spectrum of dementia, from CN to MCI and to full AD in a large population from the Alzheimer’s Disease Neuroimaging Initiative (ADNI) cohort.16 In the NYU sample, we examined the association between severity of OSA and longitudinal increase in amyloid burden and found that OSA severity was associated with greater CSF Aβ42 changes over a 2-year follow-up in CN older-adults.15 In the ADNI sample, we examined the effect of self-reported clinical diagnosis of OSA on longitudinal changes in brain amyloid-PET and CSF-biomarkers (Aβ42, T-tau and P-tau) in CN, MCI and AD older-adults and observed OSA effects on longitudinal increases in amyloid burden by both CSF and PET imaging measures, in the CN and MCI groups.16
Molecular markers of AD pathology (e.g. amyloid PET uptake and CSF Aβ42 levels), are known robust predictors of amyloid burden and of future development of AD,17,18 and evidence indicates that Aβ accumulation starts decades prior to the appearance of the first cognitive symptoms.19,20 In previous studies, the lack of longer clinical assessment prevented testing whether amyloid or tau deposition in OSA participants precedes subsequent cognitive decline to MCI or AD. In this study, we tried to overcome this limitation, and hypothesized that OSA’s effect on MCI/AD progression risk will be synergistic with Aβ and tau and this risk will significantly increase, as Aβ and tau accumulation becomes increasingly abnormal leading to shorter time-to-MCI/AD in CN and MCI participants respectively. Having previously demonstrated a contributory role of OSA on longitudinal increases in amyloid burden by both CSF and PET imaging measures, in CN and MCI patients, our objectives were to (i) to examine whether OSA has a direct neurotoxic and/or neurodegenerative effect that is independent of Aβ or tau, sufficient to induce a prospective clinical diagnosis of cognitive decline, and (ii) to examine whether OSA’s direct neurotoxicity independent of Aβ or tau, together with OSA’s indirect effect that promotes Aβ or tau accumulation, combine to act synergistically to significantly increase MCI/AD progression risk.
2. METHODS
Data used in the preparation of this article were obtained from the ADNI database (adni.loni.usc.edu). Launched in 2003 as a public-private partnership, and led by Principal Investigator Michael W. Weiner, MD, ADNI’s primary goal has been to measure the progression of MCI and early AD using a combination of serial magnetic resonance imaging (MRI), positron emission tomography (PET), other biological markers, and clinical and neuropsychological assessments. Currently, ADNI has recruited over 2,000 adults aged 55-90, consisting of CN, MCI, and early AD. PET and CSF sampling follow-up typically occurs every 1-2 years.
2.1. Study Participants
Participant selection (see supplementary figure) using ADNI data by our group has been previously described.2,21 Participants in the current study included 1043 subjects: 258 CN and 785 MCI with one or more clinical follow-up assessments. Subjects for this study must have undergone Florbetapir-PET imaging while carrying a clinical diagnosis of CN or MCI. The primary outcome was time-to-progression from a clinical diagnosis of CN to a clinical diagnosis of MCI for baseline CN patients and, from MCI to a clinical diagnosis of AD, for baseline MCI patients. Neuropsychometric assessments and serial PET-MRI scans were performed at baseline and periodically on participants. Details are available at http://www.adni-info.org. Participants were classified as CN or MCI at the time of their baseline visit and remained as CN or MCI up to and including their 12-month visit. Patient diagnosis was recorded at 6 to 12 monthly intervals up until the download date (12/06/2018). CN and MCI subjects were classified as converters if they converted to MCI and AD between 12 months and the download date, respectively.
2.2. Standard protocol approvals, registrations, and patient consent
Written informed consent was obtained from all patients participating in ADNI, as approved by the Institutional Review Board, at each of the ADNI participating centers. ADNI inclusion and exclusion criteria are detailed elsewhere (http://adni.loni.ucla.edu/wp-content/uploads/2010/09/ADNI_GeneralProceduresManual.pdf).
2.3. OSA Diagnosis
As previously described, 2,16 presence or absence of OSA was based on medical history of a self-reported clinical diagnosis of OSA during the clinical interview. Briefly, participants labeled OSA−positive (OSA+) reported a medical diagnosis of “sleep apnea” “sleep disordered breathing” “OSA” or “SDB” and the remaining participants were considered OSA-negative (OSA-). We ensured proper group allocation from reviewed medical history clinical notes from the ADNI download.
2.4. CN, MCI and AD Diagnosis
ADNI criteria for subject classification are described elsewhere.22 Briefly, CN and MCI subjects scored between 24-30 on the Mini-Mental State Examination (MMSE) while AD subjects scored between 20-26. MCI and AD participants had global Clinical Dementia Rating (CDR) scores of 0.5 and 1, respectively. The diagnosis of AD was made using established clinical criteria.23
2.5. Florbetapir-PET Imaging Acquisition and Interpretation
Information on florbetapir-pet imaging acquisition and interpretation is available at https://adni.loni.usc.edu/wp-content/uploads/2010/05/ADNI2_PET_Tech_Manual_0142011.pdf, http://adni.loni.usc.edu/updated-florbetapir-av-45-pet-analysis-results/. As described previously,21 the University of California at Berkeley (UC Berkeley) uploaded ADNI florbetapir summary data to the Laboratory of Neuroimaging (LONI).24,25 Calculation of florbetapir standardized uptake value ratios (SUVRs) were done by obtaining means across 4 cortical regions (frontal, anterior/posterior cingulate, lateral parietal, lateral temporal) and dividing this cortical summary region of interest (ROI) by one of the five reference regions (cerebellar grey matter, whole cerebellum, brainstem/pons, eroded subcortical white matter, and a composite reference region). The UC Berkeley team using procedures that involved receiver-operating-characteristic analysis,24,25 defined thresholds for Aβ-positive and -negative status as florbetapir cutoff of >1.11 and <1.11, respectively using the whole cerebellum reference region only.
2.6. Cerebrospinal Fluid Methods (CSF)
CSF bio-specimen data collection details can be found at http://adni.loni.usc.edu/data-samples/biospecimen-data/ and as previously described21. A standardized protocol was implemented to quantify biomarker concentrations in each of the CSF baseline aliquots using a multiplex xMAP Luminex platform (Luminex Corp, Austin,TX) with Innogenetics (INNO-BIA AlzBio3, Ghent, Belgium; for research use only reagents) immunoassay kit-based reagents, validated in Vanderstichele et al.26 and Shaw et al.27 Further details can be found at (http://www.adni-info.org/index.php). Using the recently published 2018 NIA-AA “research framework” for the diagnosis of AD,28 ADNI participant were grouped by biomarker profile, as described by the A/T/N scheme,29 where “A” refers to aggregated Aβ, “T” aggregated tau and “N” to neurodegeneration. Each biomarker group is dichotomized as negative (−) or positive (+) based on specified biomarkers levels. In the present study, as noted above, florbetapir-PET cutoff of >1.11 and <1.11 defined thresholds for Aβ-positive and -negative status, respectively because the correlation between ADNI CSF abeta and Florbetapir biomarkers is limited to a middle range of values, is modified by the APOE genotype, and is absent for longitudinal changes.30 Following recent studies that used ADNI data,31,32 “T+” individuals had CSF P-tau181 > 21.8 pg/ml and “N+”individuals had T-tau > 245 pg/ml. We merged the aggregated tau (T) and neurodegeneration (N) groups in order to decrease the number of groups to be compared.31,32 TN negative (TN−) was defined as having both the aggregated tau (T) and neurodegeneration (N) biomarkers in the normal range (T− and N−, that is P-tau181 ≤ 21.8 pg/ml and T-tau ≤ 245 pg/ml). Participants were classified as TN positive (TN+) if either aggregated tau (T) or neurodegeneration (N) were abnormal (T+ or N+, that is P-tau181P > 21.8 pg/ml or T-tau > 245 pg/ml). None of the individuals of the total differed between the T and N biomarkers groups.
2.7. Data analyses
All analyses were conducted separately for each clinical group (i.e. CN, and MCI) in phases. First, survival and cumulative hazard function estimates and their 95% Hall-Wellner bands were populated for both the CN and MCI groups, comparing OSA+ vs. OSA−,Aβ+ vs. Aβ−, and TN+ vs. TN−patients, respectively. Second, similar survival and cumulative hazard function estimates were populated comparing OSA+ vs. OSA− within dichotomized Aβ and TN groups (i.e. Aβ+/OSA+ vs. Aβ+/OSA−, Aβ−/OSA+ vs. Aβ−/OSA−, TN+/OSA+ vs. TN+/OSA− and TN−/OSA+ vs. TN−/OSA−). The above analyses were also performed comparing Aβ+ vs. Aβ− and TN+ vs. TN− stratifying by OSA status (i.e. OSA+/ Aβ+ vs. OSA+/ Aβ−,OSA−/ Aβ+ vs. OSA−/Aβ−, OSA+/ TN+ vs. OSA+/ TN− and OSA−/ TN+ vs. OSA−/TN−), for both the CN and MCI groups. The analysis comparing CN and MCI OSA+ vs. OSA− among only Aβ+ or TN+ participants examined the combined effects of OSA and Aβ42 or OSA, tau accumulation and neurodegeneration on progression risk, respectively. The analysis comparing CN and MCI OSA+ vs. OSA− among only Aβ− or TN− participants examined whether OSA, independent of Aβ or tau accumulation and neurodegeneration, was sufficient to induce a prospective clinical diagnosis of cognitive decline respectively. The analysis comparing CN and MCI Aβ+ vs. Aβ− or TN+ vs. TN−, among only OSA+ participants examined the combined effects of OSA and Aβ42 or OSA, tau accumulation and neurodegeneration on progression risk beyond that of OSA. The analysis comparing CN and MCI Aβ+ vs. Aβ− or TN+ vs. TN− among only OSA− participants examined the individual effect of Aβ or of tau accumulation and neurodegeneration on AD progression risk among OSA− subjects. Mean and Median time-to-event for all the groups were estimated. Cox proportional hazards regression models estimated the individual and combined effects of OSA and Aβ load, and OSA and TN burden on the relative hazard of progression from CN to MCI and MCI to AD, among baseline CN and MCI patients respectively. To investigate the additive or synergistic associations of self-reported OSA, Aβ and Tau burden with prospective cognitive decline, multi-level logistic mixed-effects models with random intercept and slope were used. We examined interactions of self-reported OSA with time, Aβ burden with time, and Tau burden with time in a single model (e.g. model 1: CN to MCI: OSA × time + Aβ × time + Tau × time + covariates × time). Next, we added an interaction term between the OSA, Aβ burden, and time, and OSA, Tau burden and time, to examine whether these 2 factors increase the likelihood of prospective cognitive decline beyond their separate effects (i.e., synergistic effect; model 2: CN to MCI: OSA × Aβ × time + OSA × Tau × time + covariates × time). Lastly, we added an interaction term between the OSA, Aβ burden, Tau and time, to examine whether these 3 factors increase the likelihood of prospective cognitive decline beyond their combined effects in model 2 (i.e., synergistic effect; model 3: CN to MCI: OSA × Aβ × Tau × time + covariates × time). We operationalized time as years from baseline for each participant. For all analyses, final models adjusted for age, sex, BMI, education, CPAP-use, baseline biomarker data, hypertension, diabetes, history of cardiovascular disease (e.g. including ischemic heart disease, heart failure, and stroke/TIA), alcohol use, and history of traumatic brain injury. We also performed sensitivity analyses removing CPAP-users from OSA+ participants. Statistical analyses were performed using SAS (version 9.4; SAS Institute Inc., Cary, NC).
3. RESULTS
3.1. Demographic and Clinical Characteristics
Tables 1 and 2 show the demographic and clinical characteristics of study participants at baseline according to their OSA and Aβ status, and OSA and A/T/N status respectively. Overall, of the 1043 participants, 506 (49%) were women. The overall mean (SD) age was 74.7 (5.0) years and the overall mean (SD) follow-up time was 5.5 (1.7) years (Range: 2.7 - 10.9 years). The mean (SD) follow-up time was 5.3 (1.4) and 5.7 (1.9) for CN and MCI groups, respectively. The mean ages of OSA+ and OSA− (CN and MCI combined) were 72.3±7.1 and 73.9±7.3 years, respectively. In the CN group, 31 participants (12% [6% Aβ+ {4% TN+}] and [6% Aβ− {4% TN+}]) were OSA+, and 91 participants (11% [6% Aβ+ {4% TN+}] and [5% Aβ− {3% TN+}]) were OSA+ in the MCI group. In both the CN and MCI groups, and in both OSA and non-OSA participants, marked differences existed in AD pathology markers comparing Aβ+ to Aβ−, with the former having significantly lower CSF-Aβ42, and higher levels of CSF T-tau and CSF P-Tau (Table 1). A+/TN+ subjects in both NL and MCI groups were more likely to be APOE4 carriers (Table 2). Participants who were OSA+/Aβ+ had significantly higher BMI in the CN group but not in the MCI group, compared to other participants with varying OSA and Aβ status. In both CN and MCI, OSA+/Aβ+/TN+ participants had higher vascular burden (i.e. higher rates of hypertension, diabetes and cardiovascular disease) compared to OSA−/Aβ+ participants (e.g. 7/10 [70%] vs. 30/84 [36%] for hypertension in CN participants) (Table 2). CN/OSA+/Aβ+ participants had significantly lower educational level (Table 1).
Table 1:
Baseline Descriptive Characteristics of Participants by Obstructive Sleep Apnea and Aβ load Status
| Table 1a: Characteristics of Cognitively Normal Participants by Obstructive Sleep Apnea Status and by Aβ load Status; and Converters from Cognitive Normal to Mild Cognitive Impairment | |||||||
|---|---|---|---|---|---|---|---|
| Characteristics | All | Without OSA | With OSA | Stable | Converters | ||
| Aβ + | Aβ − | Aβ + | Aβ − | ||||
| Number of participants (%) | 258 (100) | 95 (37) | 132 (51) | 16 (6) | 15 (6) | 187 (72) | 71 (28) |
| Follow-up time, mean (SD), years | 5.3 (1.4) | 5.7 (1.1) | 5.2 (1.5) | 4.9 (1.7) | 5.4 (1.4) | 5.6 (1.1) | 5.1 (1.9) |
| Female gender, number (%) | 121 (47) | 52 (43) | 58 (48) | 2 (1) | 9 (8) | 92 (76) | 29 (24) |
| Age, years, median (interquartile range) | 74 (71, 78) | 75 (71, 79) | 71 (68, 76) | 70 (70, 86) | 71 (68, 75) | 71 (68, 76) | 74 (70, 79) |
| APOE positive, number (%)* | 80 (31) | 37 (46) | 32 (41) | 10 (12) | 1 (1) | 38 (48) | 42 (52) |
| Education, years, median (interquartile range) | 16 (14, 18) | 16 (14, 18) | 17 (16, 19) | 12 (12, 12) | 16 (16, 18) | 17 (16, 19) | 16 (12, 16) |
| BMI (kg/m2)* | 27.2 ± 4.8 | 27.1 ± 4.8 | 27.7 ± 5.2 | 36.5 ± 10.5 | 29.7 ± 4.5 | 28.7 ± 7.2 | 31.5 ± 7.8 |
| Hypertension, number (%)* | 124 (48) | 38 (31) | 68 (55) | 9 (7) | 9 (7) | 84 (68) | 40 (32) |
| Diabetes, number (%)* | 28 (11) | 8 (29) | 13 (46) | 5 (18) | 2 (7) | 18 (64) | 10 (36) |
| Thyroid Disease, number (%) | 59 (23) | 25 (43) | 28 (47) | 5 (9) | 1 (1) | 41 (69) | 18 (31) |
| Respiratory Disease, number (%) | 57 (22) | 16 (28) | 23 (40) | 5 (9) | 13 (23) | 38 (67) | 19 (33) |
| Cardiovascular Disease, number (%)* | 173 (67) | 82 (47) | 75 (44) | 9 (5) | 7 (4) | 114 (66) | 59 (33) |
| TBI, number (%) | 10 (4) | 6 (58) | 4 (42) | 5 (50) | 5 (50) | ||
| Alcohol use, number (%) | 18 (7) | 7 (39) | 8 (44) | 1 (6) | 2 (11) | 12 (67) | 6 (33) |
| CPAP use, number (%) | 8 (3) | 6 (70) | 2 (30) | 6 (70) | 2 (30) | ||
| MMSE median (interquartile range) | 29 (28, 29) | 29 (28, 30) | 29 (28, 29) | 29 (27, 30) | 29 (28, 29) | 29 (28, 29) | 29 (28, 30) |
| CDR median (interquartile range) | 0 (0, 0) | 0 (0, 0) | 0 (0, 0) | 0 (0, 0) | 0 (0, 0) | 0 (0, 0) | 0 (0, 0) |
| CSF-ABETA pg/ml median (interquartile range)* | 210 (155, 241) | 149 (132, 173) | 221 (200, 245) | 112 (93, 123) | 229 (213, 268) | 198 (188, 245) | 132 (120, 164) |
| TAU pg/ml median (interquartile range)* | 59 (45, 84) | 71 (49, 105) | 53 (43, 69) | 141 (126, 156) | 56 (42, 63) | 61 (42, 89) | 109 (86, 140) |
| PTAU pg/ml median (interquartile range)* | 27 (20, 40) | 41 (30, 55) | 27 (21, 38) | 91 (46, 137) | 27 (21, 29) | 31 (21, 48) | 65 (33, 117) |
| Aβ, median (interquartile range)* | 1.1 (1.0, 1.2) | 1.3 (1.2, 1.4) | 1.0 (1.0, 1.1) | 1.2 (1.2, 1.3) | 1.0 (1.0, 1.0) | 1.0 (1.0, 1.2) | 1.3 (1.2, 1.4) |
| Table 1b: Characteristics of Mild Cognitive Impairment Participants by Obstructive Sleep Apnea Status and by Aβ load Status; and Converters from Mild Cognitive Impairment to Alzheimer's disease | |||||||
| Characteristics | All | Without OSA | With OSA | Stable | Converters | ||
| Aβ + | Aβ − | Aβ + | Aβ − | ||||
| Number of participants (%) | 785 (100) | 416 (53) | 278 (35) | 50 (6) | 41 (5) | 487 (62) | 298 (38) |
| Follow-up time, mean (SD), years | 5.7 (1.9) | 5.6 (1.4) | 6.1 (1.1) | 5.5 (1.6) | 5.6 (1.5) | 5.9 (1.7) | 5.5 (1.7) |
| Female gender, number (%) | 385 (49) | 236 (61) | 102 (27) | 27 (7) | 20 (5) | 250 (65) | 135 (35) |
| Age, years, median (interquartile range) | 74 (68, 79) | 74 (69, 78) | 71 (65, 76) | 72 (69, 77) | 72 (68, 75) | 71 (68, 75) | 74 (68, 79) |
| APOE positive, number (%)* | 395 (50) | 288 (73) | 55 (14) | 32 (8) | 20 (5) | 125 (58) | 89 (42) |
| Education, years, median (interquartile range)* | 16 (14, 18) | 16 (14, 18) | 16 (14, 18) | 16 (12, 19) | 17 (15, 19) | 16 (14, 18) | 16 (14, 18) |
| BMI (kg/m2)* | 26.9 ± 4.6 | 26.8 ± 4.8 | 27.8 ± 4.6 | 30.5 ± 6.1 | 29.6 ± 5.6 | 28.7 ± 4.8 | 30.4 ± 5.8 |
| Hypertension, number (%)* | 369 (47) | 192 (52) | 118 (32) | 30 (8) | 29 (8) | 196 (53) | 173 (47) |
| Diabetes, number (%)* | 79 (10) | 30 (38) | 21 (27) | 16 (20) | 12 (15) | 54 (68) | 25 (32) |
| Thyroid Disease, number (%) | 165 (21) | 81 (49) | 56 (34) | 17 (10) | 11 (7) | 125 (76) | 40 (24) |
| Respiratory Disease, number (%) | 188 (24) | 83 (44) | 42 (22) | 24 (13) | 39 (21) | 137 (73) | 51 (27) |
| Cardiovascular Disease, number (%)* | 502 (64) | 226 (45) | 201 (40) | 45 (9) | 30 (6) | 377 (75) | 125 (25) |
| TBI, number (%) | 31 (4) | 10 (33) | 14 (44) | 5 (17) | 2 (6) | 14 (44) | 17 (56) |
| Alcohol use, number (%) | 63 (8) | 23 (37) | 32 (51) | 2 (3) | 6 (9) | 42 (66) | 21 (34) |
| CPAP use, number (%) | 31 (4) | 10 (31) | 21 (69) | 23 (75) | 8 (25) | ||
| MMSE median (interquartile range) | 27 (24, 28) | 26 (25, 28) | 28 (25, 29) | 26 (24, 28) | 27 (24, 29) | 28 (25, 29) | 26 (24, 28) |
| CDR median (interquartile range) | 0.5 (0.5, 0.5) | 0.5 (0.5, 0.5) | 0.5 (0.5, 0.5) | 0.5 (0.5, 0.5) | 0.5 (0.5, 0.5) | 0.5 (0.5, 0.5) | 0.5 (0.5, 0.5) |
| CSF-ABETA pg/ml median (interquartile range)* | 153 (130, 209) | 134 (120, 154) | 219 (199, 243) | 147 (134, 167) | 212 (190, 240) | 179 (159, 243) | 134 (120, 154) |
| TAU pg/ml median (interquartile range)* | 80 (54, 116) | 97 (70, 140) | 52 (36, 72) | 93 (66, 114) | 55 (42, 78) | 62 (46, 82) | 97 (66, 140) |
| PTAU pg/ml median (interquartile range)* | 36 (23, 51) | 50 (36, 67) | 23 (17, 32) | 40 (32, 59) | 27 (19, 38) | 25 (20, 38) | 50 (33, 67) |
| Aβ, median (interquartile range)s | 1.2 (1.0, 1.4) | 1.4 (1.3, 1.5) | 1.0 (1.0, 1.1) | 1.3 (1.2, 1.4) | 1.0 (1.0, 1.0) | 1.1 (1.0, 1.2) | 1.3 (1.2, 1.4) |
Abbreviation: OSA: Obstructive Sleep Apnea, Aβ: amyloid beta, MCI: Mild Cognitive Impairment, ApoE4: Apolipoprotein epsilon4, BMI: body mass index, CDR: Clinical Dementia Rating; CPAP: continuous pulmonary airway pressure; CSF: cerebrospinal fluid, MMSE: Mini Mental State Exam; TAU: tau protein, PTAU: phosphorylated tau, TBI: traumatic brain injury. All columns show column percent where indicated. OSA and Aβ columns show row percent where indicated.
Superscript *: indicates significant differences between groups. Aβ + participants had significantly lower CSF-Aβ42, and higher levels of CSF T-tau and CSF P-Tau. Amyloid positive subjects in both NL and MCI groups were more likely to be APOE4 carriers. Participants who were OSA+/Aβ+ had significantly higher BMI in the NL group but not in the MCI group, compared to other participants with varying OSA and Aβ status. In both NL and MCI, OSA+/Aβ+ participants had higher vascular burden (i.e. higher rates of hypertension, diabetes and cardiovascular disease) compared to OSA−/Aβ+ participants (e.g. 9/15 [60%] vs. 38/95 [40%] for hypertension in NL participants). NL/OSA+/Aβ+ participants had significantly lower educational level. Significance level p ≤ .05.
Table 2:
Baseline Descriptive Characteristics of Participants by Obstructive Sleep Apnea and A/T/N Status
| Table 2a: Characteristics of Cognitively Normal Participants by Obstructive Sleep Apnea Status and by A/T/N Status from Cognitive Normal to Mild Cognitive Impairment | ||||||||||
|---|---|---|---|---|---|---|---|---|---|---|
| Characteristics | All | Without OSA | With OSA | |||||||
| A+(TN) + | A+(TN) − | A−(TN) + | A−(TN) − | A+(TN) + | A+(TN) − | A−(TN) + | A−(TN) − | |||
| Number of participants (%) | 258 (100) | 84 (33) | 11(4) | 96 (37) | 36 (14) | 10 (4) | 6 (2) | 10 (4) | 5 (2) | |
| Follow-up time, mean (SD), years | 5.3 (1.4) | 5.9 (1.3) | 5.4 (1.9) | 5.6 (1.5) | 5.4 (1.5) | 4.7 (1.8) | 5.2 (1.6) | 5.4 (1.4) | 5.3 (1.7) | |
| Female gender, number (%) | 121 (47) | 35 (28) | 17 (14) | 36 (30) | 22 (18) | 1 (1) | 1 (1) | 4 (4) | 5 (4) | |
| Age, years, median (interquartile range) | 74 (71, 78) | 75 (71, 79) | 75 (70, 79) | 73 (68, 77) | 72 (68, 75) | 78 (70, 86) | 70 (70, 70) | 72 (66, 75) | 72 (71, 78) | |
| APOE positive, number (%)* | 80 (31) | 28 (35) | 9 (11) | 24 (30) | 8 (11) | 8 (11) | 2 (1) | 1 (1) | ||
| Education, years, median (interquartile range)* | 16 (14, 18) | 16 (14, 18) | 16 (14, 20) | 17 (16, 19) | 17 (16, 18) | 12 (12, 12) | 12 (12, 12) | 16 (14, 18) | 17 (16, 19) | |
| BMI (kg/m2)* | 27.2 ± 4.8 | 26.7 ± 4.5 | 28.5 ± 6.1 | 27.7 ± 5.4 | 27.5 ± 4.8 | 32.4 ± 11.2 | 34.5 ± 4.8 | 30.0 ± 5.5 | 29.2 ± 2.7 | |
| Hypertension, number (%)* | 124 (48) | 30 (24) | 8 (7) | 47 (38) | 21 (17) | 7 (6) | 2 (1) | 6 (5) | 3 (2) | |
| Diabetes, number (%) | 28 (11) | 6 (21) | 2 (7) | 7 (25) | 6 (21) | 4 (14) | 1 (4) | 1 (4) | 1 (4) | |
| Thyroid Disease, number (%) | 59 (23) | 19 (32) | 6 (11) | 18 (30) | 10 (17) | 1 (2) | 4 (7) | 1 (1) | ||
| Respiratory Disease, number (%) | 57 (22) | 12 (21) | 4 (7) | 13 (23) | 10 (17) | 4 (7) | 1 (2) | 7 (12) | 6 (11) | |
| Cardiovascular Disease, number (%)* | 173 (67) | 65 (38) | 17 (10) | 52 (30) | 23 (14) | 7 (4) | 2 (1) | 5 (3) | 2 (1) | |
| TBI, number (%) | 10 (4) | 6 (58) | 4 (42) | |||||||
| Alcohol use, number (%) | 18 (7) | 5 (28) | 2 (11) | 7 (38) | 1 (6) | 1 (6) | 2 (11) | |||
| CPAP use, number (%) | 8 (3) | 5 (70) | 1 | 1 | 1 (30) | |||||
| MMSE median (interquartile range) | 29 (28, 29) | 28 (27, 30) | 29 (28, 30) | 29 (28, 29) | 29 (28, 30) | 27 (27, 29) | 29 (28, 29) | 29 (28, 29) | 29 (28, 29) | |
| CDR median (interquartile range) | 0 (0, 0) | 0 (0, 0) | 0 (0, 0) | 0 (0, 0) | 0 (0, 0) | 0 (0, 0) | 0 (0, 0) | 0 (0, 0) | 0 (0, 0) | |
| CSF-ABETA pg/ml median (interquartile range)* | 210 (155, 241) | 151 (132, 166) | 179 (161, 184) | 224 (203, 248) | 210 (188, 232) | 112 (93, 132) | 159 (131, 172) | 246 (226, 269) | 224 (201, 225) | |
| TAU pg/ml median (interquartile range)* | 59 (45, 84) | 86 (60, 106) | 36 (27, 46) | 65 (47, 81) | 42 (35, 49) | 141 (126, 156) | 46 (37, 53) | 61 (54, 69) | 44 (35, 48) | |
| PTAU pg/ml median (interquartile range)* | 27 (20, 40) | 48 (34, 57) | 16 (12, 19) | 35 (26, 43) | 17 (15, 20) | 91 (46, 137) | 17 (17, 19) | 29 (27, 32) | 19 (16, 21) | |
| Aβ, median (interquartile range)* | 1.1 (1.0, 1.2) | 1.1 (1.1, 1.2) | 1.1 (1.1, 1.1) | 1.0 (1.0, 1.0) | 1.0 (1.0, 1.0) | 1.2 (1.2, 1.3) | 1.2 (1.1, 1.3) | 1.0 (1.0, 1.0) | 1.0 (1.0, 1.0) | |
| Table 2b: Characteristics of Mild Cognitive Impairment Participants by Obstructive Sleep Apnea Status and by A/T/N Status from Mild Cognitive Impairment to Alzheimer's disease | ||||||||||
| Characteristics | All | Without OSA | With OSA | |||||||
| A+(TN) + | A+(TN) − | A−(TN) + | A−(TN) − | A+(TN) + | A+(TN) − | A−(TN) + | A−(TN) − | |||
| Number of participants (%) | 785 (100) | 388 (49) | 28 (4) | 164 (20) | 114 (15) | 35 (4) | 15 (2) | 25 (3) | 16 (2) | |
| Follow-up time, mean (SD), years | 5.7 (1.9) | 5.8 (1.5) | 5.6 (1.3) | 6.0 (1.3) | 5.9 (1.1) | 5.5 (1.7) | 5.7 (1.3) | 5.6 (1.5) | 5.7 (1.2) | |
| Female gender, number (%) | 385 (49) | 210 (55) | 26 (7) | 63 (16) | 39 (10) | 20 (5) | 7 (2) | 11 (3) | 9 (2) | |
| Age, years, median (interquartile range) | 74 (68, 79) | 73 (68, 78) | 76 (71, 80) | 71 (66, 76) | 70 (65, 76) | 71 (68, 77) | 76 (71, 82) | 72 (68, 76) | 70 (63, 75) | |
| APOE positive, number (%)* | 395 (50) | 254 (64) | 34 (9) | 32 (8) | 23 (6) | 30 (6) | 2 (1) | 10 (3) | 10 (3) | |
| Education, years, median (interquartile range)* | 16 (14, 18) | 16 (14, 18) | 16 (14, 20) | 16 (14, 18) | 16 (14, 18) | 16 (12, 19) | 13 (11, 17) | 17 (14, 19) | 17 (16, 19) | |
| BMI (kg/m2) | 26.9 ± 4.6 | 26.6 ± 4.7 | 26.6 ± 4.7 | 28.0 ± 5.3 | 27.5 ± 4.5 | 30.9 ± 6.4 | 28.0 ± 2.4 | 30.0 ± 5.9 | 29.0 ± 5.2 | |
| Hypertension, number (%) | 369 (47) | 164 (44) | 28 (8) | 61 (17) | 57 (15) | 26 (7) | 4 (1) | 18 (5) | 11 (3) | |
| Diabetes, number (%) | 79 (10) | 24 (30) | 6 (8) | 11 (14) | 10 (13) | 12 (15) | 4 (5) | 6 (8) | 6 (7) | |
| Thyroid Disease, number (%) | 165 (21) | 73 (44) | 8 (5) | 39 (24) | 17 (10) | 12 (7) | 5 (3) | 9 (6) | 2 (1) | |
| Respiratory Disease, number (%) | 188 (24) | 75 (40) | 8 (4) | 19 (10) | 23 (12) | 22 (12) | 2 (1) | 25 (14) | 14 (7) | |
| Cardiovascular Disease, number (%) | 502 (64) | 193 (38) | 33 (7) | 140 (28) | 61 (12) | 39 (8) | 5 (1) | 21 (4) | 9 (2) | |
| TBI, number (%) | 31 (4) | 10 (32) | 14 (45) | 4 (14) | 1 (3) | 2 (6) | ||||
| Alcohol use, number (%) | 63 (8) | 18 (29) | 5 (8) | 24 (38) | 8 (13) | 2 (3) | 6 (9) | |||
| CPAP use, number (%) | 31 (4) | 8 (26) | 2 (5) | 18 (58) | 3 (11) | |||||
| MMSE median (interquartile range) | 27 (24, 28) | 26 (24, 28) | 26 (25, 28) | 27 (25, 29) | 28 (25, 29) | 26 (24, 28) | 26 (24, 28) | 28 (25, 28) | 27 (24, 29) | |
| CDR median (interquartile range) | 0.5 (0.5, 0.5) | 0.5 (0.5, 0.5) | 0.5 (0.5, 0.5) | 0.5 (0.5, 0.5) | 0.5 (0.5, 0.5) | 0.5 (0.5, 0.5) | 0.5 (0.5, 0.5) | 0.5 (0.5, 0.5) | 0.5 (0.5, 0.5) | |
| CSF-ABETA pg/ml median (interquartile range)* | 153 (130, 209) | 156 (136, 169) | 178 (131, 214) | 221 (202, 249) | 219 (202, 239) | 139 (120, 156) | 145 (138, 151) | 227 (214, 245) | 206 (189, 229) | |
| TAU pg/ml median (interquartile range)* | 80 (54, 116) | 115 (77, 143) | 47 (36, 57) | 66 (50, 79) | 40 (30, 47) | 103 (66, 114) | 46 (37, 55) | 71 (46, 83) | 44 (29, 51) | |
| PTAU pg/ml median (interquartile range)* | 36 (23, 51) | 55 (37, 68) | 19 (15, 20) | 32 (25, 38) | 16 (13, 19) | 51 (32, 58) | 20 (19, 21) | 41 (31, 44) | 18 (15, 20) | |
| Aβ, median (interquartile range)* | 1.2 (1.0, 1.4) | 1.4 (1.3, 1.5) | 1.3 (1.1, 1.3) | 1.0 (1.0, 1.0) | 1.0 (1.0, 1.1) | 1.4 (1.2, 1.4) | 1.3 (1.1, 1.4) | 1.0 (1.0, 1.1) | 1.0 (1.0, 1.0) | |
Abbreviation: OSA: Obstructive Sleep Apnea, Aβ: amyloid beta, MCI: Mild Cognitive Impairment, ApoE4: Apolipoprotein epsilon4, BMI: body mass index, CDR: Clinical Dementia Rating; CPAP: continuous pulmonary airway pressure; CSF: cerebrospinal fluid, MMSE: Mini Mental State Exam; TAU: tau protein, PTAU: phosphorylated tau, TBI: traumatic brain injury. All columns show column percent where indicated. OSA and Aβ columns show row percent where indicated.
Superscript *: indicates significant differences between groups. Aβ + participants had significantly lower CSF-Aβ42, and higher levels of CSF T-tau and CSF P-Tau. Amyloid positive subjects in both NL and MCI groups were more likely to be APOE4 carriers. Participants who were OSA+/Aβ+ had significantly higher BMI in the NL group but not in the MCI group, compared to other participants with varying OSA and Aβ status. In both NL and MCI, OSA+/Aβ+ participants had higher vascular burden (i.e. higher rates of hypertension, diabetes and cardiovascular disease) compared to OSA−/Aβ+ participants (e.g. 9/15 [60%] vs. 38/95 [40%] for hypertension in NL participants). NL/OSA+/Aβ+ participants had significantly lower educational level. Significance level p ≤ .05.
3.2. Time dependent progression risk and cumulative hazard function estimates in CN group
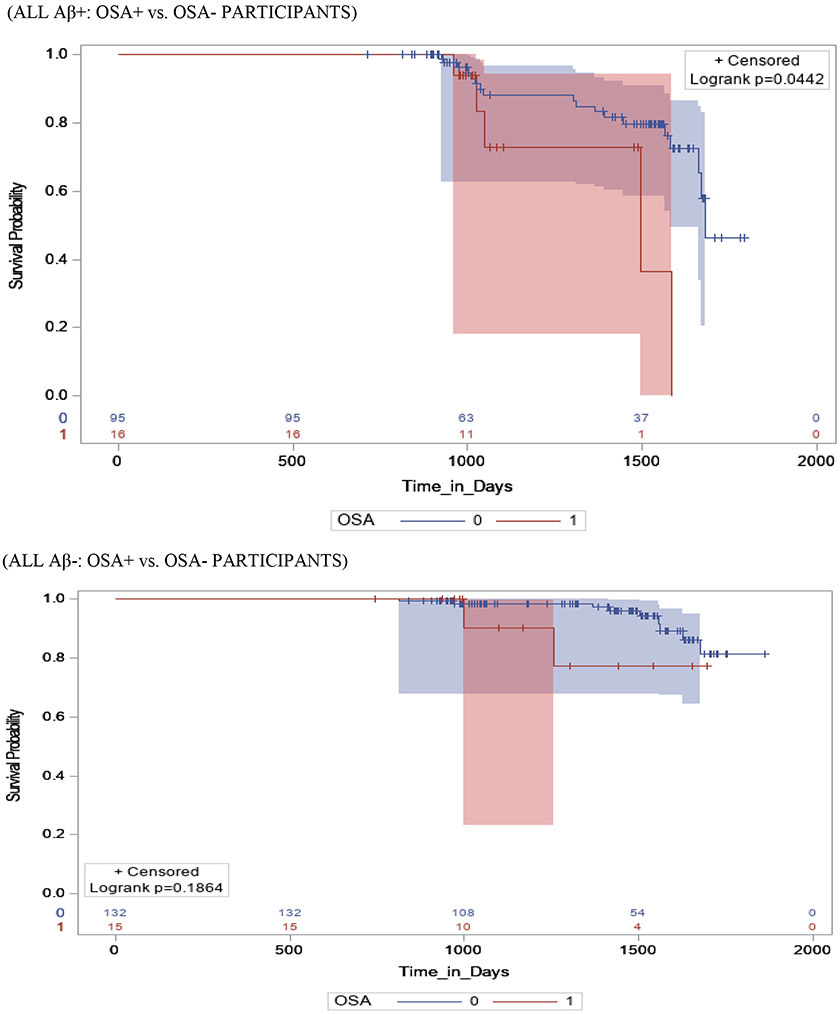
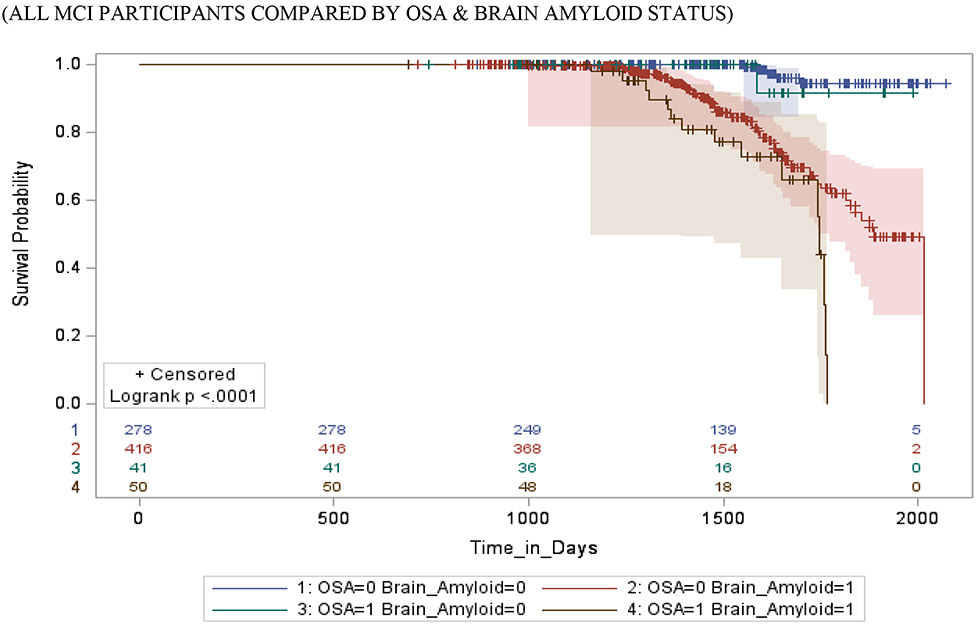
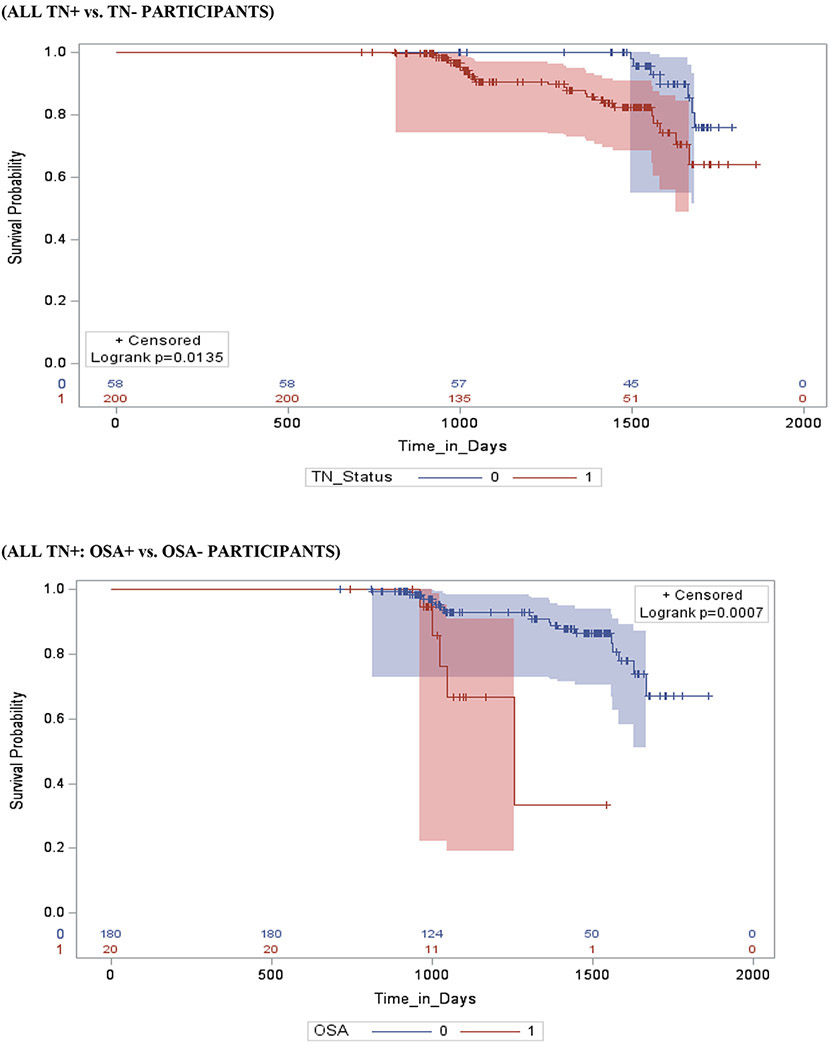
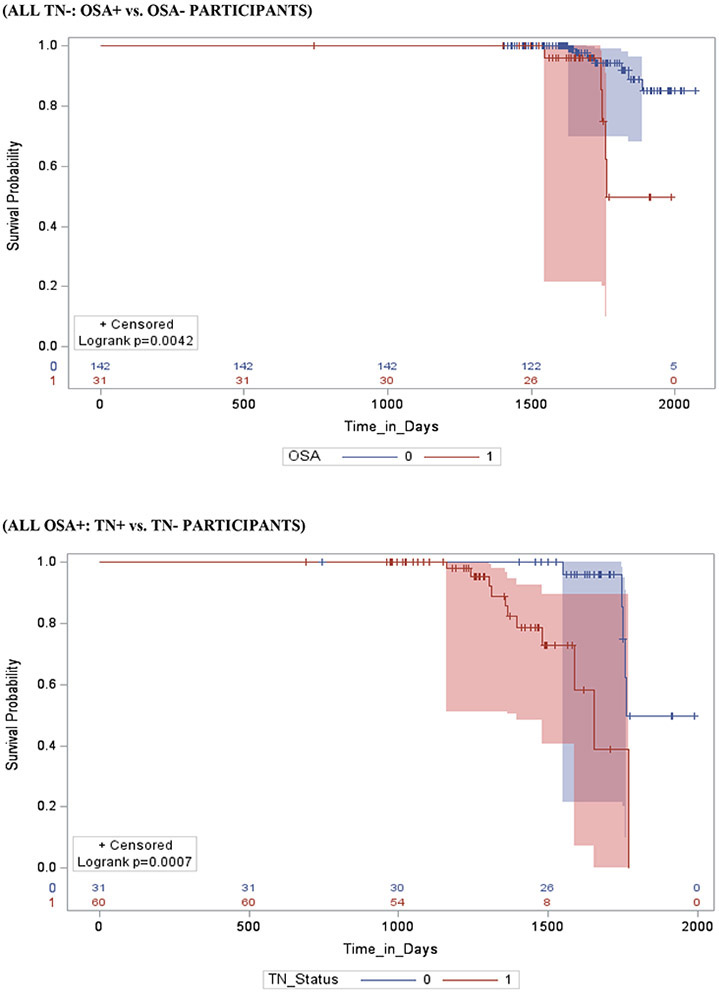
Figure 1 shows survival and cumulative hazard function estimates and their 95% Hall-Wellner bands populated for the CN group. Compared to OSA− participants, OSA+ participants had a significantly shorter time-to-progression to MCI (mean ± SD [median] 4.5 ± 0.3 [4.0] years vs. 5.0 ± 0.3 [4.8] years, p = 0.03), and had a 32% increased hazard risk of developing MCI (adjusted hazard ratio [aHR]:1.32, 95% confidence interval [CI]:1.11–1.65, p <.01). Compared to Aβ− participants, Aβ+ participants had a significantly shorter time-to-progression to MCI (mean ± SD [median] 3.6 ± 0.5 [2.6] years vs. 4.2 ± 0.5 [3.0] years, p <0.001), and a significantly higher risk of developing MCI (aHR: 2.44, 95% CI: 1.99 - 2.89, p <0.001). Compared to TN− participants, TN+ participants had a significantly shorter time-to-progression to MCI (mean ± SD [median] 3.4 ± 0.4 [2.5] years vs. 4.7 ± 0.6 [4.3] years, p <0.001), and a significantly higher risk of developing MCI (aHR: 3.52, 95% CI: 1.89 - 5.17, p =0.01). See Table 3.
Figure 1a: Kaplan–Meier Product Limit Survival Estimates and time-to-progression from NL to MCI.


Product-Limit Survival Estimates with number at risk and 95% Hall-Wellner bands
Table 3:
Cox proportional hazard models' estimates of the effect of Obstructive Sleep Apnea and Aβ load on Alzheimer's Disease time-dependent progression risk in older CN and MCI elderly participants from ADNI
| Characteristics N | Mild
Cognitive Impairment n (%) |
Mean time-to-MCI | Median time-to-MCI | Model I | P-value | Model 2 | P-value |
|---|---|---|---|---|---|---|---|
| Days ± SD (Years) | Days (Years) | HR 95% CI | HR 95% CI | ||||
| Cox proportional relative hazard of progression from Cognitive Normal to Mild Cognitive Impairment. | |||||||
| OSA+ vs. OSA− Participants | |||||||
| OSA+ (N=31) | 11 (35) | 1638 ± 105 (4.5) | 1462 (4.0) | 1.78 (1.58, 1.98) | 0.007 | 1.32 (1.11, 1.65) | <0.01 |
| OSA− (N=227) | 60 (26) | 1833 ± 181 (5.0) | 1745 (4.8) | REF | REF | ||
| Aβ+ vs. Aβ− Participants | |||||||
| Aβ+ (N=111) | 47 (42) | 1325 ± 183 (3.6) | 956 (2.6) | 2.96 (2.71, 3.22) | <.001 | 2.44 (1.99, 2.89) | <.001 |
| Aβ− (N=147) | 24 (16) | 1543 ± 170 (4.2) | 1084 (3.0) | REF | REF | ||
| Amyloid Positive (Aβ+) Participants by OSA status | |||||||
| OSA+ (N=16) | 8 (49) | 1288 ± 151 (3.5) | 928 (2.5) | 3.61 (3.24, 3.97) | <.001 | 2.93 (2.17, 3.69) | <.001 |
| OSA− (N=95) | 39 (41) | 1402 ± 125 (3.8) | 1275 (3.5) | REF | REF | ||
| Amyloid Negative (Aβ−) Participants by OSA status | |||||||
| OSA+ (N=15) | 3 (17) | 1421 ± 207 (3.9) | 1206 (3.3) | 1.05 (0.31, 1.79) | 0.11 | 1.01 (0.76, 1.26) | 0.11 |
| OSA− (N=132) | 21 (16) | 1497 ± 167 (4.1) | 1475 (4.0) | REF | REF | ||
| OSA Positive (OSA+) Participants by Aβ load | |||||||
| Aβ+ (N=16) | 8 (49) | 1288 ± 151 (3.5) | 928 (2.5) | 2.55 (0.98, 4.12) | 0.12 | 2.16 (0.87, 3.45) | 0.12 |
| Aβ− (N=15) | 3 (17) | 1421 ± 207 (3.9) | 1206 (3.3) | REF | REF | ||
| OSA Negative (OSA−) Participants Aβ load | |||||||
| Aβ+ (N=95) | 39 (41) | 1402 ± 125 (3.8) | 1275 (3.5) | 2.98 (2.66, 3.30) | <.001 | 2.47 (2.06, 2.88) | <.001 |
| Aβ− (N=132) | 21 (16) | 1497 ± 167 (4.1) | 1475 (4.0) | REF | REF | ||
| Cox proportional relative hazard of progression from Mild Cognitive Impairment to Alzheimer's Disease. | |||||||
| Characteristics N | Alzheimer's disease n (%) |
Mean time-to-MCI | Median time-to-MCI | Model I | P-value | Model 2 | P-value |
| Days ± SD (Years) | Days (Years) | HR 95% CI | HR 95% CI | ||||
| OSA+ vs. OSA− Participants | |||||||
| OSA+ (N=91) | 39 (43) | 1678 ± 117 (4.6) | 1521 (4.2) | 2.78 (2.25, 3.31) | 0.01 | 2.47 (1.79, 3.15) | 0.01 |
| OSA− (N=694) | 259 (37) | 2196 ± 109 (6.0) | 1937 (5.3) | REF | REF | ||
| Aβ+ vs. Aβ− Participants | |||||||
| Aβ+ (N=466) | 210 (43) | 1381 ± 171 (3.8) | 1096 (3.0) | 3.03 (2.61, 3.46) | <.001 | 2.62 (2.17, 3.07) | <.001 |
| Aβ− (N=319) | 88 (28) | 1526 ± 169 (4.2) | 1268 (3.5) | REF | REF | ||
| Amyloid Positive (Aβ+) Participants by OSA status | |||||||
| OSA+ (N=50) | 27 (54) | 1323 ± 141 (3.6) | 1008 (2.8) | 3.53 (3.12, 3.94) | 0.001 | 2.78 (2.22, 3.34) | <.01 |
| OSA− (N=416) | 183 (44) | 1720 ± 136 (4.7) | 1316 (3.6) | REF | REF | ||
| Amyloid Negative (Aβ−) Participants by OSA status | |||||||
| OSA+ (N=41) | 12 (29) | 1637 ± 102 (4.5) | 1416 (3.9) | 1.25 (0.67, 1.83) | 0.07 | 1.17 (0.86, 1.48) | 0.07 |
| OSA− (N=278) | 76 (27) | 1872 ± 117 (5.1) | 1468 (4.0) | REF | REF | ||
| OSA Positive (OSA+) Participants by Aβ load | |||||||
| Aβ+ (N=50) | 27 (54) | 1323 ± 141 (3.6) | 1008 (2.8) | 2.21 (2.06, 2.36) | <.001 | 2.16 (2.04, 2.32) | <.001 |
| Aβ− (N=41) | 12 (29) | 1637 ± 102 (4.5) | 1416 (3.9) | REF | REF | ||
| OSA Negative (OSA−) Participants by Aβ load | |||||||
| Aβ+ (N=416) | 183 (44) | 1720 ± 136 (4.7) | 1316 (3.6) | 3.05 (2.64, 3.46) | <.0001 | 2.55 (2.13, 2.98) | <.001 |
| Aβ− (N=278) | 76 (27) | 1872 ± 117 (5.1) | 1468 (4.0) | REF | REF | ||
Model I: Adjusted for age, sex, education, body mass index, baseline biomarker data and ApoE4 status
Model II: Adjusted for age, sex, BMI, education, CPAP-use, ApoE4 status, alcohol use, baseline biomarker data, hypertension, diabetes, history of cardiovascular disease (e.g. including ischemic heart disease, heart failure, and stroke/TIA), and history of traumatic brain injury. Significance level p ≤ .05.
Stratifying by brain Aβ or TN burden, Aβ+/OSA+ and TN+/OSA+ participants had a significantly shorter time-to-progression to MCI (mean ± SD [median] 3.5 ± 0.4 [2.9] years vs. 3.8 ± 0.3 [3.5] years, p = 0.04 and 3.3 ± 0.3 [2.8] years vs. 3.8 ± 0.3 [3.0] years, p <0.001)and a significantly higher risk of developing MCI (aHR: 2.93, 95% CI: 2.17 – 3.69, and aHR: 2.04, 95% CI: 1.11 – 2.97, p <0.001 for both) compared to Aβ+/OSA− and TN+/OSA+ participants, respectively. Compared to Aβ−/OSA− and TN−/OSA− participants, Aβ−/OSA+ and TN−/OSA+ participants showed no significant difference in time-to-progression to MCI (mean ± SD [median] 3.9 ± 0.6 [3.3] years vs. 4.1 ± 0.5 [4.0] years, and aHR: 1.01, 95% CI: 0.76 – 1.26, p =0.11 and mean ± SD [median] 4.5 ± 0.4 [4.0] years vs. 5.3 ± 0.6 [4.5] years, and aHR: 1.01, 95% CI: 0.76 – 1.26, p =0.06, respectively). See Table 3.
Stratifying by OSA status, OSA+/Aβ+ participants showed no significant difference in time-to-progression to MCI (mean ± SD [median] 3.5 ± 0.4 [3.5] years vs. 3.9 ± 0.6 [3.3] years, p = 0.49 and aHR: 2.16, 95% CI: 0.87 – 3.45, p = .12), relative to OSA+/Aβ− participants. However, OSA+/TN+ participants demonstrated significant difference in time-to-progression to MCI (mean ± SD [median] 3.3 ± 0.3 [2.8] years vs. 4.5 ± 0.4 [4.0] years, and aHR: 3.31, 95% CI: 1.36 – 5.27, p = .03), relative to OSA+/TN− participants. Relative to OSA−/Aβ− and OSA−/TN− participants, OSA−/ Aβ+ and OSA−/TN+ participants had a significantly shorter time-to-progression to MCI (mean ± SD [median] 3.8 ± 0.3 [2.9] years vs. 4.1 ± 0.5 [4.0] years, p = 0.05 and mean ± SD [median] 3.8 ± 0.3 [3.0] years vs. 5.3 ± 0.6 [4.5] years, p = 0.03, respectively), and a significantly higher risk of developing MCI (aHR: 2.47, 95% CI: 2.06 - 2.88, p <0.001 and aHR: 3.46, 95% CI: 1.78 – 5.14, p =0.02, respectively).
Stratifying by TN status OSA+/Aβ+/TN+ participants had a significantly shorter time-to-progression to MCI (mean ± SD [median] 2.8 ± 0.4 [2.5] years vs. a combined 3.9 ± 0.4 [3.2] years, p < 0.01) and a significantly higher risk of developing MCI (aHR: 3.17, 95% CI: 1.19 – 5.15, p <0.01) when compared to other TN+ participants combined (i.e. OSA+/Aβ−/TN+, OSA−/Aβ+/TN+ and OSA−/Aβ−/TN+). Furthermore, OSA+/Aβ+/TN− participants had a significantly shorter time-to-progression to MCI (mean ± SD [median] 4.1 ± 0.4 [4.0] years vs. a combined 5.0 ± 0.5 [4.5] years, p < 0.01) and a significantly higher risk of developing MCI (aHR: 1.49, 95% CI: 1.06 – 2.84, p <0.01) when compared to other TN− participants combined (i.e. OSA+/Aβ−/TN−, OSA−/Aβ+/TN− and OSA−/Aβ−/TN−).
3.3. Time dependent progression risk and cumulative hazard function estimates in MCI group
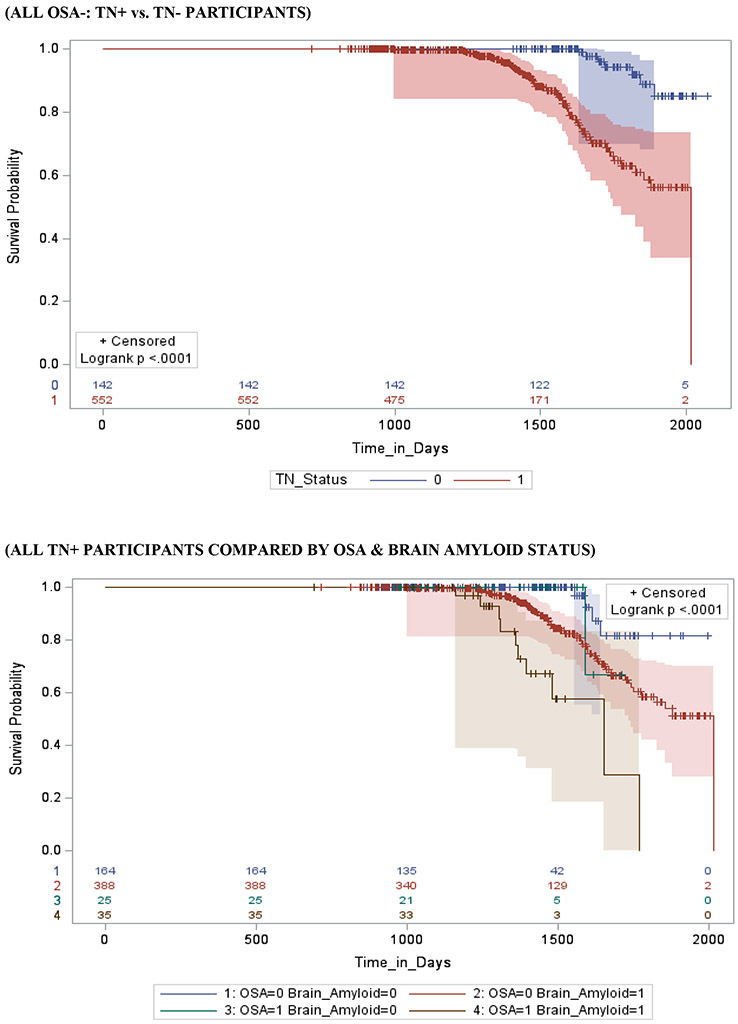
Figure 2 shows survival and cumulative hazard function estimates and their 95% Hall-Wellner bands populated for the MCI group. Compared to OSA− participants, OSA+ participants had a significantly shorter time-to-progression to AD (mean ± SD [median] 4.6 ± 0.3 [4.2] years vs. 6.0 ± 0.3 [5.3] years, p =0.01), and a significantly higher risk of developing AD (aHR: 2.47, 95% CI: 1.79 – 3.15, p =.01). Compared to Aβ− participants, Aβ+ participants had a significantly shorter time-to-progression to AD (mean ± SD [median] 3.8 ± 0.5 [2.8] years vs. 4.2 ± 0.5 [3.6] years, p < 0.001), and a significantly higher risk of developing AD (aHR: 2.62, 95% CI: 2.17 – 3.07, p <0.001). Compared to TN− participants, TN+ participants had a significantly shorter time-to-progression to MCI (mean ± SD [median] 4.0 ± 0.3 [3.8] years vs. 4.9 ± 0.4 [4.6] years, p <0.001), and a significantly higher risk of developing MCI (aHR: 3.34, 95% CI: 1.79 – 4.89, p < 0.001). See Table 4.
Figure 2a: Kaplan–Meier Product Limit Survival Estimates and time-to-progression from MCI to AD.


Product-Limit Survival Estimates with number at risk and 95% Hall-Wellner bands
Table 4:
Cox proportional hazard models' estimates of the effect of Obstructive Sleep Apnea, Tau and Neurodegeneration load on Alzheimer's Disease time-dependent progression risk in older NL and MCI elderly participants from the ADNI cohort
| Characteristics N | Mild
Cognitive Impairment n (%) |
Mean
time-to- MCI |
Median
time-to- MCI |
Model I | P-value | Model 2 | P-value |
|---|---|---|---|---|---|---|---|
| Days ±
SD (Years) |
Days (Years) | HR 95% CI | HR 95% CI | ||||
| Cox proportional relative hazard of progression from Cognitive Normal to Mild Cognitive Impairment. | |||||||
| TN+ vs. TN− Participants | |||||||
| TN+ (N=200) | 64 (32) | 1254 ± 128 (3.4) | 914 (2.5) | 3.75 (2.12, 5.35) | 0.001 | 3.52 (1.89, 5.17) | 0.013 |
| TN− (N=58) | 7 (12) | 1754 ± 201 (4.7) | 1554 (4.3) | REF | REF | ||
| TN+ Participants by OSA status | |||||||
| OSA+ (N=20) | 9 (45) | 1194 ± 107 (3.3) | 1019 (2.8) | 2.36 (1.15, 3.58) | <.001 | 2.04 (1.11, 2.97) | <.001 |
| OSA− (N=180) | 55 (31) | 1382 ± 121 (3.8) | 1084 (3.0) | REF | REF | ||
| TN− Participants by OSA status | |||||||
| OSA+ (N=11) | 2 (18) | 1652 ± 152 (4.5) | 1460 (4.0) | 2.61 (1.00, 4.71) | 0.05 | 2.33 (0.57, 4.09) | 0.06 |
| OSA− (N=47) | 5 (11) | 1917 ± 208 (5.3) | 1625 (4.5) | REF | REF | ||
| OSA Positive (OSA+) Participants by TN status | |||||||
| TN+ (N=20) | 9 (45) | 1194 ± 107 (3.3) | 1019 (2.8) | 3.55 (1.71, 5.39) | 0.02 | 3.31 (1.36, 5.27) | 0.03 |
| TN− (N=11) | 2 (18) | 1652 ± 152 (4.5) | 1460 (4.0) | REF | REF | ||
| OSA Negative (OSA−) Participants by TN status | |||||||
| TN+ (N=180) | 55 (31) | 1382 ± 121 (3.8) | 1084 (3.0) | 3.54 (1.98, 5.15) | 0.02 | 3.46 (1.78, 5.14) | 0.02 |
| TN− (N=47) | 5 (11) | 1917 ± 208 (5.3) | 1625 (4.5) | REF | REF | ||
| All TN+ Participants OSA & Aβ load | |||||||
| OSA+/Aβ+ (N=10) | 5 (50) | 1019 ± 151 (2.8) | 904 (2.5) | 3.22 (1.36, 5.08) | <.001 | 3.17 (1.19, 5.15) | <.001 |
| OSA+/Aβ− (N=10) | 4 (40) | 1312 ± 102 (3.6) | 1051 (2.9) | REF | |||
| OSA−/Aβ+ (N=84) | 32 (38) | 1367 ± 142 (3.7) | 1013 (2.8) | ||||
| OSA−/Aβ− (N=96) | 23 (24) | 1597 ± 147 (4.4) | 1455 (4.0) | REF | |||
| All TN− Participants OSA & Aβ load | |||||||
| OSA+/Aβ+ (N=6) | 2 (33) | 1496 ± 152(4.1) | 1471 (4.0) | 1.58 (1.04, 3.12) | <.001 | 1.49 (1.06, 2.84) | <.001 |
| OSA+/Aβ− (N=5) | 0 (0) | REF | |||||
| OSA−/Aβ+ (N=11) | 2 (18) | 1752 ± 172(4.8) | 1675 (4.6) | ||||
| OSA−/Aβ− (N=36) | 3 (8) | 1847 ± 167 (5.1) | 1725 (4.7) | REF | |||
| Cox proportional relative hazard of progression from Mild Cognitive Impairment to Alzheimer's Disease. | |||||||
| Characteristics N | Alzheimer's disease n (%) |
Mean
time-to- MCI |
Median
time-to- MCI |
Model I | P-value | Model 2 | P-value |
| Days ±
SD (Years) |
Days (Years) | HR 95% CI | HR 95% CI | ||||
| TN+ vs. TN− Participants | |||||||
| TN+ (N=612) | 269 (44) | 1478 ± 127 (4.0) | 1376 (3.8) | 3.57 (2.03, 5.11) | <.001 | 3.34 (1.79, 4.89) | <.001 |
| TN− (N=173) | 29 (17) | 1795 ± 129 (4.9) | 1697 (4.6) | REF | REF | ||
| TN+ Participants by OSA status | |||||||
| OSA+ (N=60) | 32 (53) | 1377 ± 211 (3.8) | 1356 (3.7) | 2.93 (1.11, 4.76) | 0.001 | 2.72 (1.17, 4.27) | 0.001 |
| OSA− (N=552) | 237 (43) | 1776 ± 109 (4.9) | 1652 (4.5) | REF | REF | ||
| TN− Participants by OSA status | |||||||
| OSA+ (N=31) | 7 (23) | 1753 ± 181 (4.8) | 1648 (4.5) | 1.78 (1.14, 3.42) | 0.001 | 1.48 (1.09, 2.87) | 0.004 |
| OSA− (N=142) | 22 (15) | 1879 ± 206 (5.1) | 1789 (4.9) | REF | REF | ||
| OSA Positive (OSA+) Participants by OSA status | |||||||
| TN+ (N=60) | 32 (53) | 1377 ± 211 (3.8) | 1356 (3.7) | 3.55 (1.67, 5.43) | <.001 | 3.37 (1.86, 4.88) | <.001 |
| TN− (N=31) | 7 (23) | 1753 ± 181 (4.8) | 1648 (4.5) | REF | REF | ||
| OSA Negative (OSA−) Participants by Aβ load | |||||||
| TN+ (N=552) | 237 (43) | 1776 ± 109 (4.9) | 1652 (4.5) | 2.81 (1.05, 4.57) | <.001 | 2.76 (1.11, 4.41) | <.001 |
| TN− (N=142) | 22 (15) | 1879 ± 206 (5.1) | 1789 (4.9) | REF | REF | ||
| All TN+ Participants by OSA & Aβ load | |||||||
| OSA+/Aβ+ (N=35) | 26 (74) | 1262 ± 122 (3.5) | 1197 (3.3) | 3.98 (2.26, 5.70) | <.001 | 3.47 (1.96, 4.98) | <.001 |
| OSA+/Aβ− (N=25) | 6 (24) | 1656 ± 167 (4.5) | 1596 (4.4 | REF | |||
| OSA−/Aβ+ (N=388) | 174 (45) | 1581 ± 206 (4.3) | 1524 (4.2) | ||||
| OSA−/Aβ− (N=164) | 63 (38) | 1697 ± 154 (4.7) | 1583 (4.3) | REF | |||
| All TN− Participants by OSA & Aβ load | |||||||
| OSA+/Aβ+ (N=15) | 7 (47) | 1596 ± 155 (4.4) | 1483 (4.1) | 1.56 (1.07, 3.05) | <.001 | 1.23 (1.03, 2.43) | <.001 |
| OSA+/Aβ− (N=16) | 0 (0) | REF | |||||
| OSA−/Aβ+ (N=28) | 13 (46) | 1801 ± 156 (4.9) | 1717 (4.7) | ||||
| OSA−/Aβ− (N=114) | 9(8) | 2190 ± 115 (6.0) | 1979 (5.4) | REF | |||
Model I: Adjusted for age, sex, education, body mass index and ApoE4 status
Model II: Adjusted for age, sex, BMI, education, CPAP-use, ApoE4 status, alcohol use, baseline biomarker data, hypertension, diabetes, history of cardiovascular disease (e.g. including ischemic heart disease, heart failure, and stroke/TIA), and history of traumatic brain injury
Stratifying by brain Aβ or TN burden, Aβ+/OSA+ and TN+/OSA+ participants had a significantly shorter time-to-progression to AD (mean ± SD [median] 3.6 ± 0.4 [2.8] years vs. 4.7 ± 0.3 [3.6] years, p = 0.01 and mean ± SD [median] 3.8 ± 0.3 [3.7] years vs. 4.9 ± 0.6 [4.5] years, p < 0.01) and a significantly higher risk of developing AD (aHR: 2.78, 95% CI: 2.22 – 3.34, and aHR: 2.72, 95% CI: 1.17 – 4.27, p <0.001 for both) compared to Aβ+/OSA− and TN+/OSA+ participants, respectively. Compared to Aβ−/OSA− participants, Aβ−/OSA+ participants showed no significant difference in time-to-progression to AD (mean ± SD [median] 4.5 ± 0.3 [3.9] years vs. 5.1 ± 0.3 [4.0] years, p = 0.61 and aHR: 1.17, 95% CI: 0.86 – 1.48, p = 0.07). However, compared to TN−/OSA− participants, TN−/0SA+ participants had significantly shorter time-to-progression to AD and a significantly higher risk of developing AD (mean ± SD [median] 4.8 ± 0.5 [4.5] years vs. 5.1 ± 0.6 [4.9] years, and aHR: 2.78, 95% CI: 2.22 – 3.34, p <0.01 for both).
Stratifying by OSA status, OSA+/ Aβ+ and OSA+/TN+ participants had a significantly shorter time-to-progression to AD (mean ± SD [median] 3.6 ± 0.4 [2.8] years vs. 4.5 ± 0.3 [3.9] years, and median] 3.8 ± 0.6 [3.7] years vs. 4.8 ± 0.5 [4.5] years p < 0.001 for both) and a significantly higher risk of developing AD (aHR: 2.16, 95% CI: 2.04 – 2.32, and aHR: 3.37, 95% CI: 1.86 – 4.88, p <0.001 for both), relative to OSA+/ Aβ− and OSA+/TN− participants, respectively. In addition, compared to OSA−/Aβ− and OSA−/TN− participants, OSA−/ Aβ+ and OSA−/TN+ participants had a significantly shorter time-to-progression to AD (mean ± SD [median] 4.7 ± 0.3 [3.6] years vs. 5.1 ± 0.3 [4.0] years, and mean ± SD [median] 4.9 ± 0.3 [4.5] years vs. 5.1 ± 0.6 [4.9] years p < 0.001 for both), and a significantly higher risk of developing AD (aHR: 2.55, 95% CI: 2.13 - 2.98, and aHR: 2.76, 95% CI: 1.11 – 4.41, p <0.001 for both), respectively.
Stratifying by TN status, OSA+/Aβ+/TN+ participants had a significantly shorter time-to-progression to AD (mean ± SD [median] 3.5 ± 0.3 [3.3] years vs. a combined 4.5 ± 0.5 [4.3] years, p < 0.01) and a significantly higher risk of developing MCI (aHR: 3.47, 95% CI: 1.96 – 4.98, p <0.01) when compared to other TN+ participants combined (i.e. OSA+/Aβ−/TN+, OSA−/Aβ+/TN+ and OSA−/Aβ−/TN+). Furthermore, OSA+/Aβ+/TN− participants had a significantly shorter time-to-progression to MCI (mean ± SD [median] 4.4 ± 0.4 [4.1] years vs. a combined 5.5 ± 0.4 [5.1] years, p < 0.01) and a significantly higher risk of developing MCI (aHR: 1.23, 95% CI: 1.03 – 2.43, p <0.001) when compared to other TN− participants combined (i.e. OSA+/Aβ−/TN−, OSA−/Aβ+/TN− and OSA−/Aβ−/TN−).
3.4. Interactive Associations of OSA, Aβ and Tau burden with risk of conversion in CN and MCI
In CN participants, conversion risk from CN to MCI was associated with self-reported OSA (β = 0.42; 95%CI, 0.13 to 0.70; p < 0.01), higher Aβ burden (β = 0.55; 95%CI, 0.22 to 0.89; p <0 .001), and higher Tau burden (β = 1.2; 95%CI, 0.63 to 1.77; P < .001). The interactions of self-reported OSA and Aβ burden, and self-reported OSA, Aβ and Tau burden with time were significant (β = 1.13, 95%CI, 0.74 to 1.52; p < 0.001 and β = 1.38, 95%CI, 0.99 to 1.76; p < 0.001, respectively), suggesting a synergistic effect. However, the interaction of self-reported OSA and Tau burden with time was not significant (β = 0.82, 95%CI, −0.11 to 1.32; p =0 .07) suggesting that the presence of OSA did not modify the relationship between tau and cognitive decline in CN participants. See supplemental table.
In MCI participants, conversion risk from MCI to AD was associated with self-reported OSA (β = 0.84; 95%CI, 0.49 to 1.18; p < 0.01), higher Aβ burden (β = 1.01; 95%CI, 0.58 to 1.45; p <0 .001), and higher Tau burden (β = 1.23; 95%CI, 0.57 to 1.68; P < .001). The interactions of self-reported OSA and Aβ burden, self-reported OSA and Tau burden and self-reported OSA, Aβ and Tau burden with time were significant (β = 1.18, 95%CI, 0.82 to 1.54; p < 0.001, β = 1.31, 95%CI, 0.87 to 1.47; p < 0.001 and β = 1.39, 95%CI, 0.95 to 1.75; p < 0.001, respectively), suggesting a synergistic effect. See supplemental table.
3.4. Sensitivity analysis removing CPAP-users
Sensitivity analysis removing CPAP-users (CN: n=8 [Aβ+ = 6, Aβ− = 2]; MCI: n=31 [Aβ+ = 10, Aβ− = 21]) from OSA+ participants had negligible impact on the estimates (e.g. CN OSA+/ Aβ+ vs. OSA+/ Aβ− aHR: 2.16, 95% CI: 0.87 – 3.45, p= 0.12 changed to aHR: 2.21, 95% CI: 0.92 – 3.51, p = 0.09 and MCI Aβ+/OSA+ vs. Aβ+/ OSA− aHR: 2.78, 95% CI: 2.22 – 3.34, p <0.001 changed to aHR: 2.82, 95% CI: 2.31 – 3.33, p <0.001). We attribute this negligible impact on the findings to data showing low CPAP compliance rates (<50%) with majority of CPAP dropouts occurring early in treatment, and relatively fewer patients discontinuing use as time with CPAP increases.33,34 Moreover, the extremely small sample size of history of CPAP users prevented stratified analyses examining the beneficial effects of CPAP especially in the CN group. Subgroup analyses as was conducted in this study precluded testing the effects of CPAP on cognitive deterioration in this ADNI group as some groups had zero participant.
4. DISCUSSION
The major objective of this study was to evaluate the effect of OSA on AD time-dependent progression risk in older CN and MCI elderly participants from the ADNI cohort and to quantify its effect on the risk of progression as Aβ and Tau accumulation become increasingly abnormal. Our major findings were the following: (i) Both CN and MCI OSA+ participants had a significantly increased risk and shorter time-to-progression to MCI and AD respectively compared to OSA− participants. (ii) Both CN and MCI Aβ+ and TN+ participants respectively, had a significantly increased risk and shorter time-to-progression to MCI and AD compared to Aβ− and TN− participants. (iii) Among only Aβ+ and TN+ participants respectively, both CN and MCI OSA+ participants had a significantly increased risk and shorter time-to-progression to MCI and AD compared to OSA− participants. (v) Among only Aβ− and TN− participants respectively, there was no difference in the risk and time-to-progression to MCI between CN OSA+ vs. OSA− participants. This association varied in MCI OSA+ vs. OSA− participants, with significantly increased risk and shorter time-to-progression to AD seen only in TN− participants. (vi) Among only OSA+ participants, only MCI Aβ+ participants had a significantly increased risk and shorter time-to-progression to AD respectively compared to Aβ− participants. Both CN and MCI TN+ participants had a significantly increased risk and shorter time-to-progression to AD respectively compared to TN− participants. (vii) Among only OSA− participants, both CN and MCI Aβ+ and TN+ participants had a significantly increased risk and shorter time-to-progression to MCI and AD respectively compared to Aβ− and TN− participants, respectively. (viii) In both CN and MCI participants, the interactions of self-reported OSA and Aβ burden, and self-reported OSA, Aβ and Tau burden with time were significant, suggesting a synergistic effect. However, in CN participants, the interaction of self-reported OSA and Tau burden with time was not significant.
This is the first study showing a shorter progression time-to-MCI/AD in both CN and MCI OSA+ participants respectively. This finding is consistent with our previous study showing that OSA patients had an earlier onset age to MCI or AD.2 In this study, both CN and MCI OSA+ participants progressed to MCI and AD respectively, six to eight months earlier than OSA− participants did. In addition, our recent study showed both CN and MCI OSA+ subjects experiencing faster annual increase in florbetapir uptake and decrease in CSF Aβ42 levels, as well as increases in CSF T-tau and P-tau compared with OSA− participants.16 Thereby suggesting that OSA appears to accelerate increases in amyloid deposition, CSF T-tau and P-tau levels over time, both in CN and MCI individuals. Thus possibly significantly reducing the time to MCI or AD progression.2 Our results on OSA increasing AD progression risk are consistent with previous prospective studies indicating that individuals with OSA have an elevated risk of developing MCI or AD.1,3,4,35,36
Our results showing Aβ load increasing MCI or AD progression risk in both CN and MCI participants are consistent with well-established findings from previous studies showing that CN and MCI elderly participants with positive PIB-PET and low CSF Aβ42 show associations with cognitive decline,37,38 and have an elevated risk of AD progression respectively.39 Our results showing Aβ load predicting a shorter progression time-to-MCI/AD in both CN and MCI participants are consistent with well-established findings from previous studies showing Aβ+ CN and MCI subjects more likely to progress to MCI40,41 and AD,42-44 in short-term follow-up than Aβ− CN and MCI individuals respectively. Our tau findings showing tau accumulation and neurodegeneration increasing MCI or AD progression risk and predicting a shorter progression time-to-MCI/AD are in line with established evidence of strong associations between cortical neurofibrillary tangle load and cognitive impairment.45
In both Aβ+ CN and MCI participants (i.e. with evidence of AD pathologic change), the risk of progression to MCI and AD was approximately two and three times that of Aβ− participants, respectively. In both TN+ CN and MCI participants (i.e. evidence of tau accumulation and neurodegeneration), the risk of progression to MCI and AD was approximately three and four times that of TN− participants, respectively (regardless of OSA status in TN+ CN participants). The combined risk of progressing to MCI and AD in the CN and MCI OSA+/Aβ+ and MCI OSA+/TN+ participants was approximately thrice that of CN and MCI OSA−/Aβ+ participants, and four to five times that of MCI OSA−/TN+ participants, respectively. In addition, the combined risk of progression to MCI and AD amongst CN and MCI OSA+/Aβ+ and OSA+/TN+ participants was approximately three and four times that of OSA−/Aβ− and OSA−/TN− participants, respectively (p<.01). The interactions of self-reported OSA and Aβ burden and self-reported OSA and TN burden with time were significant. Thereby suggesting that OSA’s effect on MCI/AD progression risk is: (i) independently synergistic with Aβ and Tau, and (ii) significantly increases as Aβ and Tau accumulation becomes increasingly abnormal. The literature suggests that intermittent hypoxia46,47 and sleep fragmentation48,49 that are causes for excessive daytime sleepiness (EDS), are two main processes by which OSA may induce neurodegenerative changes and promote the accumulation of Aβ42. However, we also know that chronic intermittent hypoxia, hypercapnia and hypertension in OSA can also induce neuronal damage, including axons,50 white matter,51 and reduced diffusion tensor imaging (DTI) based mean diffusivity in multiple brain regions.52 This suggests that OSA could promote neurotoxicity that is independent of hypoxia-induced Aβ42 accumulation, thereby resulting in possible synergistic neurodegenerative mechanisms with Aβ42 accumulation on AD progression risk. Notably, the synergistic effect of being OSA+/TN+ was absent in CN group. However the effect of being either OSA+/Aβ+ or OSA+/TN+ was more marked in the MCI group (e.g. median time-to-AD progression of 3 years in Aβ+ vs. 2.8 years in MCI OSA+/Aβ+ and median time-to-MCI progression of 2.6 years in Aβ+ vs. 2.5 years in OSA+/Aβ+ in the CN group, p<.01 for all). Thereby lending credence to our hypothesis that OSA’s effect on MCI/AD progression risk significantly increases as Aβ and Tau accumulation becomes increasingly abnormal.
We did not detect significant differences in progression risk when we compared CN and MCI OSA+ vs. OSA− among only Aβ− participants and CN OSA+ vs. OSA− among only TN− participants. These analyses examined whether established effects of OSA’s neurodegenerative effect that is independent of hypoxia-induced Aβ42 accumulation was sufficient to induce cognitive decline. We favor a model of AD that implies that one of the contributory role of OSA is the potential for neuronal injury independent of Aβ in which chronic intermittent hypoxia, and hypercapnia, may induce axonal, glial or white matter damage, in multiple brain regions. 50,51,53 Plausible explanations for these findings are discussed below. First, this analysis employed the use of self-report for clinical diagnosis of OSA. Possible misclassification of OSA status occurring more frequently in one of the Aβ or TN groups could lead to fewer OSA patients considered to have progressed to MCI/AD therefore biasing the risk towards the null. Second, our inability to determine OSA severity could also be another reason. In our previous study,15 it was OSA severity that was associated with increases in brain amyloid burden. Third, our previous study using ADNI data21 showed largely in CN and MCI (early stage subjects) groups that self-reported OSA+ subjects experienced faster annual increase in florbetapir uptake and decrease in CSF-Aβ42 levels as well as increases in CSF T-tau and P-tau compared to self-reported OSA− participants. Thereby suggesting that OSA+ subjects are more likely to covert to Aβ+ and TN+ statuses. Therefore, OSA effects may not be specific to the presence of Aβ or tau; rather it may affect different risk profiles based on the disease stage examined. As such it is not that Aβ− subjects are protected from progression to MCI or AD, but rather that there is a stepwise progression whereby first, OSA increases risk for transition from Aβ− to Aβ+, and, once Aβ+, increases risk for developing cognitive decline.. Fourth, independent of Aβ and tau pathology, progression to MCI/AD maybe dependent on additional factors such as co-morbid hypertension and microvascular changes,54,55 all of which were adjusted for in our analyses. Fifth, it could be that OSA’s effect on MCI/AD progression risk is only apparent at certain Aβ or TN threshold levels or that longer follow-up time are needed. As such, CN Aβ− and TN− participants each, maybe too early in the process and power may have been an issue for this time scale and sample size. Lastly, MCI Aβ negative participants may represent a less pure population of subjects on an AD trajectory and are generally less likely to progress to clinical AD diagnosis. Since pathological definition of AD requires substantial presence of Aβ, histopathological examination may actually reveal these individuals may have other diagnoses (e.g. depression) or might be at risk for other forms of dementia, such as a diagnosis of primary age related tauopathy (PART).
Our result showing increased risk and a shorter time-to-progression to AD in MCI Aβ+ participants compared to Aβ− participants among only OSA+ participants is consistent with well-established findings of MCI Aβ+ elderly participants having elevated risk of AD39,56 and in short-term follow-up, being more likely to progress to AD than MCI Aβ− participants.42-44 The median time to AD was 2.8 years in OSA+/Aβ+ participants compared to 3.9 years in OSA+/Aβ− participants. This clearly suggests the effects of OSA on AD progression risk significantly increases as Aβ accumulation becomes increasingly abnormal. However, these results should be interpreted with caution as Aβ− MCI ADNI patients have shown a variety of clinical and biomarker features that differ from their Aβ+ counterparts, suggesting that one or more non-AD etiologies (which may include vascular disease and depression) account for their AD-like phenotype.57 There was no significant difference in the risk and time-to-progression to MCI in CN Aβ+ participants compared to Aβ− participants mainly due to lack of statistical power in the subgroup analyses.
The OSA− subset analysis, comparing Aβ+ vs. Aβ− participants’ risk and shorter time-to-progression to MCI and AD respectively in CN and MCI participants revealed findings that are consistent with the OSA+ subset analysis comparing Aβ+ vs. Aβ− participants. Both eliminate OSA’s effect. Our findings from examining Aβ’s effect independent of OSA positivity (i.e. OSA−/Aβ+ vs. OSA−/Aβ−), and comparing that effect to Aβ’s effect contingent on OSA positivity (i.e. OSA+/Aβ+ vs. OSA+/Aβ−), helped to further highlight OSA’s synergism with amyloid burden with respect to MCI/AD progression risk. For example, the median time-to-MCI/AD progression in MCI OSA−/Aβ+ participants was 3.6 years vs. 4 years in MCI OSA−/Aβ− participants, while progression time in MCI OSA+/Aβ+ participants was 2.8 years vs. 3.9 years in MCI OSA+/Aβ− participants.
The analysis showing statistical comparison of progression times of each category (OSA+/Aβ+, OSA+/Aβ−, OSA−/Aβ+, OSA−/Aβ−) within the two sub-populations (NL and MCI), as well as the respective TN+ and TN− subset analyses, each comparing OSA+/Aβ+ participants to other TN+ and TN− participants combined (i.e. OSA+/Aβ−, OSA−/Aβ+ and OSA−/Aβ−) further helped to highlight OSA and Aβ synergism. The latter analysis eliminated the effects of tau. OSA+/Aβ+ participants were approximately two to four times more likely to progress to MCI or AD and had significantly shorter time-to-progression to MCI and AD in CN and MCI participants, respectively depending on whether they were TN+ or TN−. In addition, results from the mixed effects models examining the interactive associations of OSA, Aβ and Tau burden with risk of conversion to MCI/AD demonstrated that OSA had a synergistic effect with Aβ in both CN and MCI participants, and with tau only in MCI participants. Thereby suggesting that OSA and tau’s synergistic effect is seen and pronounced with an increased susceptibility to tau accumulation.
Strengths of our study include a well-characterized cohort, longitudinal design, relatively long follow-up, objective assessment of amyloid and tau burden and robust statistical analytic methods and large enough sample that allowed subgroup examinations for the most part. As we previously described,2,16 measurement of OSA by self-report is an important limitation. Self-reported sleep measures can be impacted by diminished cognition58 and in certain situations might not be correlated with objective methods.59 The significantly lower than expected prevalence of reported OSA in this elderly cohort, is possibly due to under-diagnosis, as epidemiological and sleep laboratory studies document much higher OSA prevalence in elderly populations. The prevalence of OSA (with or without symptoms) is estimated at 30-50% in older subjects,60 therefore, misclassification of some OSA+ subjects into the OSA− group could have occurred; however, this would have driven our findings towards the null, with lower estimates than the true ones, therefore attenuating OSA’s true effect. OSA classification by self-report suggests that those with self-reported OSA were more likely to be symptomatic (i.e. with excessive daytime sleepiness [EDS]), prompting these subjects to seek diagnosis. Therefore, further research differentiating the risk of OSA for AD with and without associated daytime symptoms is necessary. Notably, a recent study demonstrated that all-cause EDS defined by Epworth sleepiness scores ≥10 was associated with longitudinal brain beta amyloid accumulation in in elderly subjects.61
CONCLUSION
Our findings in a cohort of self-reported OSA patients support the hypothesis of an overarching model of late-onset AD with brain amyloid deposition and tau aggregates proceeding at different rates,62 influenced by a combination of protective/risk factors of which OSA is part. This model of AD implies a contributory role of OSA, first with the direct potential for neuronal injury independent of Aβ by inducing intermittent hypoxia, sleep fragmentation, arousal-induced hypertensive surges, systemic inflammation, and impaired glucose handling63 irrespective of MCI/AD progression risk. Second, an indirect contributory role of OSA in which both acute and intermittent hypoxia, sleep fragmentation and EDS may accelerate Aβ accumulation in the presence of Aβ plaques via a feedback loop8,47,61 and tau accumulation possibly influenced by impaired clearance through the glymphatic pathway.64,65 This role of OSA significantly increases MCI/AD progression risk as suggested by our findings. Third, a contributory role of OSA in which the direct neurotoxicity effect that is independent of Aβ accumulation together with OSA’s indirect effect that promotes Aβ accumulation, combine to act synergistically to significantly increase MCI/AD progression risk, and possibly affecting and/or accelerating AD biomarker change and leading to shorter time-to-MCI/AD in OSA CN and MCI participants respectively. This OSA-Aβ synergism related to cognitive decline can be independent of tau as well as synergistic with tau deposition. Future research using objective measures of OSA is needed to replicate these findings and examine OSA’s effects on slow wave and rapid eye movement sleep and their mediating role in increasing Aβ and tau accumulation.
Supplementary Material
Supplementary Table: Logistic Mixed Effect Model Estimates of the Interactive Associations of Obstructive Sleep Apnea, β-amyloid burden and CSF-Tau burden with risk of conversion in Cognitive Normal and Mild Cognitive Impairment elderly from the ADNI database
Supplementary Figure: Stepwise exclusion process for Cognitive Normal, and Mild Cognitive Impairment participants used in the study.
Figure 1b: Kaplan–Meier Product Limit Survival Estimates and time-to-progression from CN to MCI.


Product-Limit Survival Estimates with number at risk and 95% Hall-Wellner bands
Figure 2b: Kaplan–Meier Product Limit Survival Estimates and time-to-progression from MCI to AD.

Product-Limit Survival Estimates with number at risk and 95% Hall-Wellner bands
ACKNOWLEDGMENTS
The authors would like to gratefully acknowledge the dedication, time, and commitment of the participants and staff of the Alzheimer’s Disease Neuroimaging Initiative. The National Institute on Health funded this study: NIA: L30-AG064670 (Bubu), Columbia Center for Interdisciplinary Research on Alzheimer’s disease Disparities (CIRAD) P30AG059303 Pilot (Bubu), R21AG049348 (Osorio), R21AG055002 (Osorio), R01AG056031(Osorio), R21AG059179 (Varga), R01AG056682 (Varga), R01AG056531(Osorio, Jean-Louis), NHLBI: T32HL129953 (Jean-Louis, Ogedegbe), K07AG05268503 (Jean-Louis), R01HL118624 (Osorio), K23HL125939 (Williams)
Funding: NIH/NIA/NHLBI (L30-AG064670, CIRAD P30AG059303 Pilot, T32HL129953, R01HL118624, R21AG049348, R21AG055002, R01AG056031, R01AG022374, R21AG059179, R01AG056682, R01AG056531, K07AG05268503, K23HL125939)
*.
Data used in preparation of this article were obtained from the Alzheimer’s Disease Neuroimaging Initiative (ADNI) database (adni.loni.usc.edu). The investigators within the ADNI contributed to the design and implementation of ADNI projects and provided data, but did not participate in the design, analysis or writing of this report. A complete listing of ADNI investigators can be found at: http://adni.loni.usc.edu/wpcontent/uploads/how_to_apply/ADNI_Acknowledgement_List.pdf
Footnotes
Declarations of interest: none
REFERENCES
- 1.Chang WP, Liu ME, Chang WC, et al. Sleep apnea and the risk of dementia: a population-based 5-year follow-up study in taiwan. PLoS One. 2013;8(10):e78655. [DOI] [PMC free article] [PubMed] [Google Scholar]
- 2.Osorio RS, Gumb T, Pirraglia E, et al. Sleep-disordered breathing advances cognitive decline in the elderly. Neurology. 2015;84(19):1964–1971. [DOI] [PMC free article] [PubMed] [Google Scholar]
- 3.Yaffe K, Laffan AM, Harrison SL, et al. Sleep-disordered breathing, hypoxia, and risk of mild cognitive impairment and dementia in older women. Jama. 2011;306(6):613–619. [DOI] [PMC free article] [PubMed] [Google Scholar]
- 4.Yaffe K, Nettiksimmons J, Yesavage J, Byers A. Sleep Quality and Risk of Dementia Among Older Male Veterans. The American journal of geriatric psychiatry : official journal of the American Association for Geriatric Psychiatry. 2015;23(6):651–654. [DOI] [PubMed] [Google Scholar]
- 5.Bubu OM, Brannick M, Mortimer J, et al. Sleep, Cognitive impairment, and Alzheimer's disease: A Systematic Review and Meta-Analysis. Sleep. 2017;40(1). [DOI] [PubMed] [Google Scholar]
- 6.Shi L, Chen SJ, Ma MY, et al. Sleep disturbances increase the risk of dementia: A systematic review and meta-analysis. Sleep medicine reviews. 2018;40:4–16. [DOI] [PubMed] [Google Scholar]
- 7.Elias A, Cummins T, Tyrrell R, et al. Risk of Alzheimer's Disease in Obstructive Sleep Apnea Syndrome: Amyloid-beta and Tau Imaging. Journal of Alzheimer's disease : JAD. 2018;66(2):733–741. [DOI] [PubMed] [Google Scholar]
- 8.Ju YE, Finn MB, Sutphen CL, et al. Obstructive sleep apnea decreases central nervous system-derived proteins in the cerebrospinal fluid. Annals of neurology. 2016;80(1):154–159. [DOI] [PMC free article] [PubMed] [Google Scholar]
- 9.Liguori C, Mercuri NB, Izzi F, et al. Obstructive Sleep Apnea is Associated With Early but Possibly Modifiable Alzheimer's Disease Biomarkers Changes. Sleep. 2017;40(5). [DOI] [PubMed] [Google Scholar]
- 10.Osorio RS, Ayappa I, Mantua J, et al. The interaction between sleep-disordered breathing and apolipoprotein E genotype on cerebrospinal fluid biomarkers for Alzheimer's disease in cognitively normal elderly individuals. Neurobiology of aging. 2014;35(6):1318–1324. [DOI] [PMC free article] [PubMed] [Google Scholar]
- 11.Spira AP, Yager C, Brandt J, et al. Objectively Measured Sleep and beta-amyloid Burden in Older Adults: A Pilot Study. SAGE Open Med. 2014;2. [DOI] [PMC free article] [PubMed] [Google Scholar]
- 12.Yun CH, Lee HY, Lee SK, et al. Amyloid Burden in Obstructive Sleep Apnea. Journal of Alzheimer's disease : JAD. 2017;59(1):21–29. [DOI] [PubMed] [Google Scholar]
- 13.André C, Rehel S, Kuhn E, et al. Association of Sleep-Disordered Breathing With Alzheimer Disease Biomarkers in Community-Dwelling Older Adults: A Secondary Analysis of a Randomized Clinical Trial. JAMA neurology. 2020;77(6):1–10. [DOI] [PMC free article] [PubMed] [Google Scholar]
- 14.Carvalho DZ, St Louis EK, Schwarz CG, et al. Witnessed apneas are associated with elevated tau-PET levels in cognitively unimpaired elderly. Neurology. 2020;94(17):e1793–e1802. [DOI] [PMC free article] [PubMed] [Google Scholar]
- 15.Sharma RA, Varga AW, Bubu OM, et al. Obstructive Sleep Apnea Severity Affects Amyloid Burden in Cognitively Normal Elderly. A Longitudinal Study. American journal of respiratory and critical care medicine. 2018;197(7):933–943. [DOI] [PMC free article] [PubMed] [Google Scholar]
- 16.Bubu OM, Pirraglia E, Andrade AG, et al. Obstructive sleep apnea and longitudinal Alzheimer's disease biomarker changes. Sleep. 2019;42(6). [DOI] [PMC free article] [PubMed] [Google Scholar]
- 17.Brys M, Pirraglia E, Rich K, et al. Prediction and longitudinal study of CSF biomarkers in mild cognitive impairment. Neurobiology of aging. 2009;30(5):682–690. [DOI] [PMC free article] [PubMed] [Google Scholar]
- 18.Mattsson N, Zetterberg H, Hansson O, et al. CSF biomarkers and incipient Alzheimer disease in patients with mild cognitive impairment. Jama. 2009;302(4):385–393. [DOI] [PubMed] [Google Scholar]
- 19.Aizenstein HJ, Nebes RD, Saxton JA, et al. Frequent amyloid deposition without significant cognitive impairment among the elderly. Archives of neurology. 2008;65(11):1509–1517. [DOI] [PMC free article] [PubMed] [Google Scholar]
- 20.Sperling RA, Laviolette PS, O'Keefe K, et al. Amyloid deposition is associated with impaired default network function in older persons without dementia. Neuron. 2009;63(2):178–188. [DOI] [PMC free article] [PubMed] [Google Scholar]
- 21.Bubu OM, Pirraglia E, Andrade AG, et al. Obstructive Sleep Apnea and Longitudinal Alzheimer's disease biomarker changes. Sleep. 2019. [DOI] [PMC free article] [PubMed] [Google Scholar]
- 22.Petersen RC, Aisen PS, Beckett LA, et al. Alzheimer's Disease Neuroimaging Initiative (ADNI): clinical characterization. Neurology. 2010;74(3):201–209. [DOI] [PMC free article] [PubMed] [Google Scholar]
- 23.McKhann G, Drachman D, Folstein M, Katzman R, Price D, Stadlan EM. Clinical diagnosis of Alzheimer's disease: report of the NINCDS-ADRDA Work Group under the auspices of Department of Health and Human Services Task Force on Alzheimer's Disease. Neurology. 1984;34(7):939–944. [DOI] [PubMed] [Google Scholar]
- 24.Landau SM, Breault C, Joshi AD, et al. Amyloid-beta imaging with Pittsburgh compound B and florbetapir: comparing radiotracers and quantification methods. Journal of nuclear medicine : official publication, Society of Nuclear Medicine. 2013;54(1):70–77. [DOI] [PMC free article] [PubMed] [Google Scholar]
- 25.Landau SM, Lu M, Joshi AD, et al. Comparing positron emission tomography imaging and cerebrospinal fluid measurements of beta-amyloid. Annals of neurology. 2013;74(6):826–836. [DOI] [PMC free article] [PubMed] [Google Scholar]
- 26.Vanderstichele H DMG SF, et al. . Biomarkers for early diagnosis of Alzheimer’s disease. Hauppauge, NY. Nova Science Publishers. 2008. [Google Scholar]
- 27.Shaw LM, Vanderstichele H, Knapik-Czajka M, et al. Cerebrospinal fluid biomarker signature in Alzheimer's disease neuroimaging initiative subjects. Annals of neurology. 2009;65(4):403–413. [DOI] [PMC free article] [PubMed] [Google Scholar]
- 28.Jack CR Jr., Bennett DA, Blennow K, et al. NIA-AA Research Framework: Toward a biological definition of Alzheimer's disease. Alzheimer's & dementia : the journal of the Alzheimer's Association. 2018;14(4):535–562. [DOI] [PMC free article] [PubMed] [Google Scholar]
- 29.Jack CR Jr., Bennett DA, Blennow K, et al. A/T/N: An unbiased descriptive classification scheme for Alzheimer disease biomarkers. Neurology. 2016;87(5):539–547. [DOI] [PMC free article] [PubMed] [Google Scholar]
- 30.Toledo JB, Bjerke M, Da X, et al. Nonlinear Association Between Cerebrospinal Fluid and Florbetapir F-18 β-Amyloid Measures Across the Spectrum of Alzheimer Disease. JAMA neurology. 2015;72(5):571–581. [DOI] [PMC free article] [PubMed] [Google Scholar]
- 31.Suárez-Calvet M, Morenas-Rodríguez E, Kleinberger G, et al. Early increase of CSF sTREM2 in Alzheimer's disease is associated with tau related-neurodegeneration but not with amyloid-β pathology. Molecular neurodegeneration. 2019;14(1):1. [DOI] [PMC free article] [PubMed] [Google Scholar]
- 32.Tan MS, Ji X, Li JQ, et al. Longitudinal trajectories of Alzheimer's ATN biomarkers in elderly persons without dementia. Alzheimer's research & therapy. 2020;12(1):55. [DOI] [PMC free article] [PubMed] [Google Scholar]
- 33.Collard P, Pieters T, Aubert G, Delguste P, Rodenstein DO. Compliance with nasal CPAP in obstructive sleep apnea patients. Sleep medicine reviews. 1997;1(1):33–44. [DOI] [PubMed] [Google Scholar]
- 34.Loube DI, Gay PC, Strohl KP, Pack AI, White DP, Collop NA. Indications for positive airway pressure treatment of adult obstructive sleep apnea patients: a consensus statement. Chest. 1999;115(3):863–866. [DOI] [PubMed] [Google Scholar]
- 35.Lee JE, Yang SW, Ju YJ, Ki SK, Chun KH. Sleep-disordered breathing and Alzheimer's disease: A nationwide cohort study. Psychiatry Res. 2019;273:624–630. [DOI] [PubMed] [Google Scholar]
- 36.Tsai MS, Li HY, Huang CG, et al. Risk of alzheimer's disease in obstructive sleep apnea patients with or without treatment: Real-world evidence. The Laryngoscope. 2020. [DOI] [PubMed] [Google Scholar]
- 37.Fagan AM, Head D, Shah AR, et al. Decreased cerebrospinal fluid Abeta(42) correlates with brain atrophy in cognitively normal elderly. Annals of neurology. 2009;65(2):176–183. [DOI] [PMC free article] [PubMed] [Google Scholar]
- 38.Morris JC, Roe CM, Grant EA, et al. Pittsburgh compound B imaging and prediction of progression from cognitive normality to symptomatic Alzheimer disease. Archives of neurology. 2009;66(12):1469–1475. [DOI] [PMC free article] [PubMed] [Google Scholar]
- 39.Hansson O, Zetterberg H, Buchhave P, Londos E, Blennow K, Minthon L. Association between CSF biomarkers and incipient Alzheimer's disease in patients with mild cognitive impairment: a follow-up study. The Lancet Neurology. 2006;5(3):228–234. [DOI] [PubMed] [Google Scholar]
- 40.Fagan AM, Roe CM, Xiong C, Mintun MA, Morris JC, Holtzman DM. Cerebrospinal fluid tau/beta-amyloid(42) ratio as a prediction of cognitive decline in nondemented older adults. Archives of neurology. 2007;64(3):343–349. [DOI] [PubMed] [Google Scholar]
- 41.Gustafson DR, Skoog I, Rosengren L, Zetterberg H, Blennow K. Cerebrospinal fluid beta-amyloid 1-42 concentration may predict cognitive decline in older women. Journal of neurology, neurosurgery, and psychiatry. 2007;78(5):461–464. [DOI] [PMC free article] [PubMed] [Google Scholar]
- 42.Forsberg A, Engler H, Almkvist O, et al. PET imaging of amyloid deposition in patients with mild cognitive impairment. Neurobiology of aging. 2008;29(10):1456–1465. [DOI] [PubMed] [Google Scholar]
- 43.Okello A, Koivunen J, Edison P, et al. Conversion of amyloid positive and negative MCI to AD over 3 years: an 11C-PIB PET study. Neurology. 2009;73(10):754–760. [DOI] [PMC free article] [PubMed] [Google Scholar]
- 44.Wolk DA, Price JC, Saxton JA, et al. Amyloid imaging in mild cognitive impairment subtypes. Annals of neurology. 2009;65(5):557–568. [DOI] [PMC free article] [PubMed] [Google Scholar]
- 45.Nelson PT, Alafuzoff I, Bigio EH, et al. Correlation of Alzheimer disease neuropathologic changes with cognitive status: a review of the literature. Journal of neuropathology and experimental neurology. 2012;71(5):362–381. [DOI] [PMC free article] [PubMed] [Google Scholar]
- 46.Shiota S, Takekawa H, Matsumoto SE, et al. Chronic intermittent hypoxia/reoxygenation facilitate amyloid-beta generation in mice. Journal of Alzheimer's disease : JAD. 2013;37(2):325–333. [DOI] [PubMed] [Google Scholar]
- 47.Zhang X, Zhou K, Wang R, et al. Hypoxia-inducible factor 1alpha (HIF-1alpha)-mediated hypoxia increases BACE1 expression and beta-amyloid generation. J Biol Chem. 2007;282(15):10873–10880. [DOI] [PubMed] [Google Scholar]
- 48.Lim AS, Kowgier M, Yu L, Buchman AS, Bennett DA. Sleep Fragmentation and the Risk of Incident Alzheimer's Disease and Cognitive Decline in Older Persons. Sleep. 2013;36(7):1027–1032. [DOI] [PMC free article] [PubMed] [Google Scholar]
- 49.Schlosser Covell GE, Dhawan PS, Lee Iannotti JK, et al. Disrupted daytime activity and altered sleep-wake patterns may predict transition to mild cognitive impairment or dementia: a critically appraised topic. Neurologist. 2012;18(6):426–429. [DOI] [PubMed] [Google Scholar]
- 50.Ludemann P, Dziewas R, Soros P, Happe S, Frese A. Axonal polyneuropathy in obstructive sleep apnoea. Journal of neurology, neurosurgery, and psychiatry. 2001;70(5):685–687. [DOI] [PMC free article] [PubMed] [Google Scholar]
- 51.Kiernan TE, Capampangan DJ, Hickey MG, Pearce LA, Aguilar MI. Sleep apnea and white matter disease in hypertensive patients: a case series. Neurologist. 2011;17(5):289–291. [DOI] [PubMed] [Google Scholar]
- 52.Kumar R, Chavez AS, Macey PM, Woo MA, Yan-Go FL, Harper RM. Altered global and regional brain mean diffusivity in patients with obstructive sleep apnea. J Neurosci Res. 2012;90(10):2043–2052. [DOI] [PMC free article] [PubMed] [Google Scholar]
- 53.Macey PM, Kumar R, Woo MA, Valladares EM, Yan-Go FL, Harper RM. Brain structural changes in obstructive sleep apnea. Sleep. 2008;31(7):967–977. [PMC free article] [PubMed] [Google Scholar]
- 54.Esiri MM, Nagy Z, Smith MZ, Barnetson L, Smith AD. Cerebrovascular disease and threshold for dementia in the early stages of Alzheimer's disease. Lancet. 1999;354(9182):919–920. [DOI] [PubMed] [Google Scholar]
- 55.Snowdon DA, Greiner LH, Mortimer JA, Riley KP, Greiner PA, Markesbery WR. Brain infarction and the clinical expression of Alzheimer disease. The Nun Study. Jama. 1997;277(10):813–817. [PubMed] [Google Scholar]
- 56.Jack CR Jr., Wiste HJ, Vemuri P, et al. Brain beta-amyloid measures and magnetic resonance imaging atrophy both predict time-to-progression from mild cognitive impairment to Alzheimer's disease. Brain : a journal of neurology. 2010;133(11):3336–3348. [DOI] [PMC free article] [PubMed] [Google Scholar]
- 57.Landau SM, Horng A, Fero A, Jagust WJ. Amyloid negativity in patients with clinically diagnosed Alzheimer disease and MCI. Neurology. 2016;86(15):1377–1385. [DOI] [PMC free article] [PubMed] [Google Scholar]
- 58.Van Den Berg JF, Van Rooij FJ, Vos H, et al. Disagreement between subjective and actigraphic measures of sleep duration in a population-based study of elderly persons. Journal of sleep research. 2008;17(3):295–302. [DOI] [PubMed] [Google Scholar]
- 59.Unruh ML, Redline S, An MW, et al. Subjective and objective sleep quality and aging in the sleep heart health study. J Am Geriatr Soc. 2008;56(7):1218–1227. [DOI] [PubMed] [Google Scholar]
- 60.Heinzer R, Marti-Soler H, Haba-Rubio J. Prevalence of sleep apnoea syndrome in the middle to old age general population. Lancet Respir Med. 2016;4(2):e5–6. [DOI] [PubMed] [Google Scholar]
- 61.Carvalho DZ, St Louis EK, Knopman DS, et al. Association of Excessive Daytime Sleepiness With Longitudinal beta-Amyloid Accumulation in Elderly Persons Without Dementia. JAMA neurology. 2018. [DOI] [PMC free article] [PubMed] [Google Scholar]
- 62.Jack CR Jr., Lowe VJ, Weigand SD, et al. Serial PIB and MRI in normal, mild cognitive impairment and Alzheimer's disease: implications for sequence of pathological events in Alzheimer's disease. Brain : a journal of neurology. 2009;132(Pt 5):1355–1365. [DOI] [PMC free article] [PubMed] [Google Scholar]
- 63.Lim DC, Veasey SC. Neural injury in sleep apnea. Curr Neurol Neurosci Rep. 2010;10(1):47–52. [DOI] [PubMed] [Google Scholar]
- 64.Iliff JJ, Chen MJ, Plog BA, et al. Impairment of glymphatic pathway function promotes tau pathology after traumatic brain injury. The Journal of neuroscience : the official journal of the Society for Neuroscience. 2014;34(49):16180–16193. [DOI] [PMC free article] [PubMed] [Google Scholar]
- 65.Xie L, Kang H, Xu Q, et al. Sleep drives metabolite clearance from the adult brain. Science (New York, NY). 2013;342(6156):373–377. [DOI] [PMC free article] [PubMed] [Google Scholar]
Associated Data
This section collects any data citations, data availability statements, or supplementary materials included in this article.
Supplementary Materials
Supplementary Table: Logistic Mixed Effect Model Estimates of the Interactive Associations of Obstructive Sleep Apnea, β-amyloid burden and CSF-Tau burden with risk of conversion in Cognitive Normal and Mild Cognitive Impairment elderly from the ADNI database
Supplementary Figure: Stepwise exclusion process for Cognitive Normal, and Mild Cognitive Impairment participants used in the study.