Abstract
To understand the properties of polyaniline (PANI), aim gas, and the interaction between them in PANI-based gas sensors and help us to design sensors with better properties, direct calculations with molecular dynamics (MD) simulations were done in this work. Polyamide 6/polyaniline (PA6/PANI) nanofiber ammonia gas sensors were studied as an example here, and the structural, morphological, and ammonia sensing properties (to 50–250 ppm ammonia) of PA6/PANI nanofibers were tested and evaluated by scanning electron microscopy, Fourier transform infrared spectroscopy, and a homemade test system. The PA6/PANI nanofibers were prepared by in situ polymerization of aniline with electrospun PA6 nanofibers as templates and hydrochloric acid (HCl) as a doping agent for PANI, and the sensors show rapid response, ideal selectivity, and acceptable repeatability. Then, complementary molecular dynamics simulations were performed to understand how ammonia molecules interact with HCl-doped PANI chains, thus providing insights into the molecular-level details of the ammonia sensing performances of this system. Results of the radial distribution functions and mean square displacement analysis of the MD simulations were consistent with the dedoping mechanism of the PANI chains.
Introduction
Conducting polymers have been explored for the applications in sensors recently due to their advantages in easily tunable chemical structures and morphologies compared to inorganic materials. For gas sensors, one of the widely studied aim gases is ammonia gas, a common volatile compound present in the atmosphere and one of the causes for environmental pollutants.1 It is also a kind of important chemical resource being employed in the cooling systems, production of fertilizer, and the reduction of NOx gases in diesel vehicles.2−4 However, it is also a toxic and flammable gas and a kind of signal of some disease, so it is essential to monitor the concentration level of ammonia in the places where one may release it. Thus, a variety of ammonia sensors based on organic materials have been developed because some general ammonia detectors or sensors always require high work temperature (such as γ-Fe2O3 and γ-Fe2O3–TiO2,5 WO3,6 SnO2,7 etc.8−11) or are time-consuming by nature (for example, Fourier transform infrared spectroscopy detectors12). Among these organic materials, polyaniline (PANI), a classical conducting polymer13−15 with low work temperature, good environmental stability,16 low cost, and high thermal stability, has been demonstrated to be a promising candidate in gas sensors.17−23 However, PANI is infusible,24 almost insoluble and non-processable,25 and its physical and mechanical properties are not satisfactory for some applications. In comparison with other structures, nanostructures, for example, nanofibers, can provide a high specific surface area deriving from their porous nature, which results in them being highly competitive for making novel gas sensors.26 We reported previously27,28 PANI-based nanofiber ammonia sensors prepared via coating PANI onto the surface of electrospun nanofibers that act as templates. The obtained PANI-based nanofiber sensors presented ideal ammonia sensing behaviors, working at room temperature and excellent flexibility, attributing to the structure of nanofibers and the sensing properties of PANI in the sensors.
By now, lots of efforts have been done to understand the mechanism and sensing process29−32 about PANI-based sensors; however, there are rare direct calculations with molecular dynamics simulations about the mechanism and sensing process. Further understanding of the properties of PANI, aim gas, and the interaction between them is essential because it can help us to design sensors with better properties. Computational methods including molecular dynamics (MD) used in materials simulations have made tremendous strides in the last two decades.33 MD can provide a microscopic insight into the polymers, small molecules, and the interactions between them. Wang et al.34 investigated the adsorption behaviors of H2O, CO2, CH4, and N2 gases on the calcite surface under reservoir conditions by studying the binding energy, Helmholtz free energy, and radial distribution function (RDF) of the system. The results show that the preferential adsorption order is H2O > CO2 > CH4 > N2. Fatemi and Foroutan35 studied the freezing behaviors of pure water and a 14% water–salt mixture by MD via the coarse-grained model. The simulation results show that, in the lower temperature than the obtained freezing point, the sodium and chloride ions tend to form network and reject solution, leading to the reduction of water molecule accumulation.
In this work, MD simulations were performed to make a microscopic insight into PANI-based ammonia sensors, and the polyamide 6/polyaniline (PA6/PANI) nanofiber ammonia sensor was taken as a case study. The PA6/PANI nanofiber ammonia sensor was prepared via electrospinning and in situ polymerization methods. The sensor’s structural, morphological, and ammonia sensing properties (to 50–250 ppm ammonia) were investigated and analyzed. Since the sensing material was HCl-doped PANI in the PA6/PANI ammonia sensors and PA6 nanofibers just offered a nanofibrous structure, only HCl-doped PANI and ammonia gas were introduced into the simulation system in this work. Microscopic structures of simulated HCl-PANI such as porosity and volume were determined, and the mean square displacement (MSD) of ammonia molecules, the RDF of the gas sensing system, and the interaction energy between ammonia molecules and HCl-PANI chains were investigated in MD simulations. The results show that MD simulations provide fairly good compatibility with the experimental data.
Results and Discussion
Surface and Structural Properties of Nanofiber Sensors
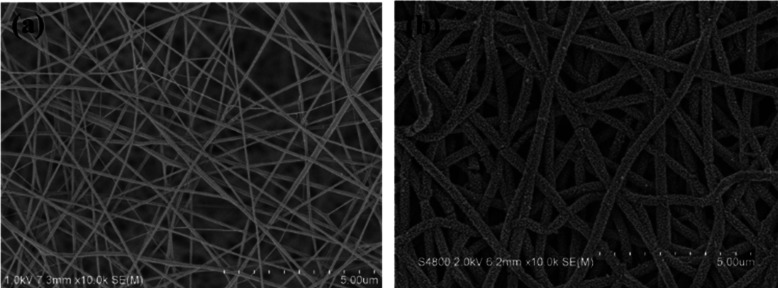
As given in Figure 1, the scanning electron microscopy (SEM) results of PA6 and PA6/PANI nanofibers indicated that the surface of PA6/PANI nanofibers is not as smooth as that of pure PA6 nanofibers, suggesting that the roughness comes from the existence of PANI, which was in situ polymerized on the surface of the PA6 nanofibers. In addition, the diameter of PA6/PANI nanofibers is larger than that of PA6 nanofibers and the PA6/PANI nanofibers maintained an appropriate fiber structure. The large specific surface area of the PA6/PANI fibers would facilitate the exposure to and the diffusion of ammonia vapor.
Figure 1.
SEM images of (a) PA6 and (b) PA6/PANI nanofibers.
Figure 2 presents the FTIR spectra of pure PA6 and PA6/PANI nanofibers. The FTIR spectrum of PA6/PANI consists of characteristic bands detected at 1577, 1400, and 1117 cm–1 due to the quinoid ring C=C stretching, benzenoid C–C stretching, and C–N+ stretching vibration modes.36 The C=O stretching vibration peak of amide is observed at 1637 cm–1 for PA6 and at 1636 cm–1 for PA6/PANI. The peak of the C=O stretching vibration that shifted from 1637 to 1636 cm–1 may be caused by the hydrogen bond and van der Waals forces between PANI and PA6 nanofibers.
Figure 2.
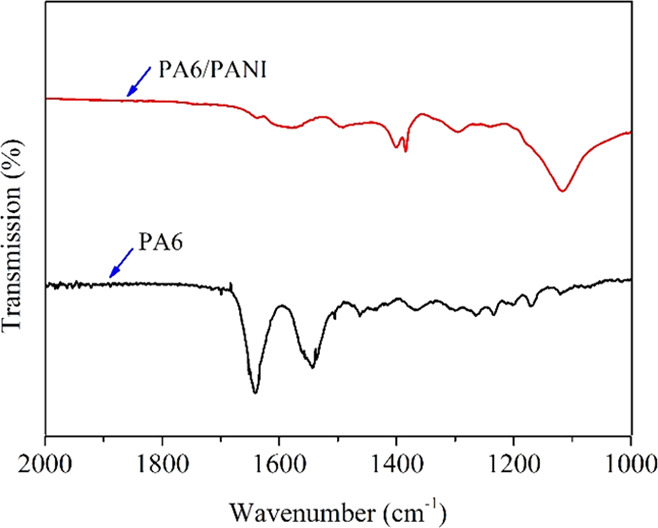
FTIR spectra of pure PA6 and PA6/PANI nanofibers.
Surface and Structural Properties of the Nanofiber Models
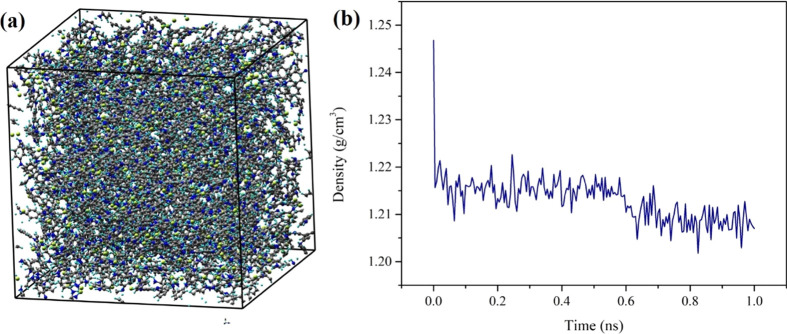
The model of the HCl-PANI system is given in Figure 3a, which represents the final trajectory from the MD simulations, and the final box dimensions are 56.4 × 56.4 × 56.4 Å3. The density of HCl-PANI in the final MD simulation run (NPT at room temperature and standard pressure) is given in Figure 3b, and it indicates that the final density is 1.2 ± 0.002 g/cm3, which is close to the experimental value of about 1.3 g/cm3.37 In addition to the density, the volume, surface, and pore diameters of the HCl-PANI nanofiber system were calculated in MAPS as well. The free volume is 63,116.7 Å3, or 35.2%, and the free surface is 116,248 Å2. For pore diameters, the largest pore diameter-included sphere is 5.8 Å, the largest free sphere is 1.8 Å, and the largest included sphere along the sphere path is 4.1 Å.
Figure 3.
For the HCl-PANI model, (a) the snapshot of the equilibrated HCl-PANI structure (colors: carbon, gray; hydrogen, baby blue; nitrogen, blue; chlorine, yellow) and (b) the density in the final NPT simulations at room temperature and standard pressure.
Gas Sensing Performances of the Sensors
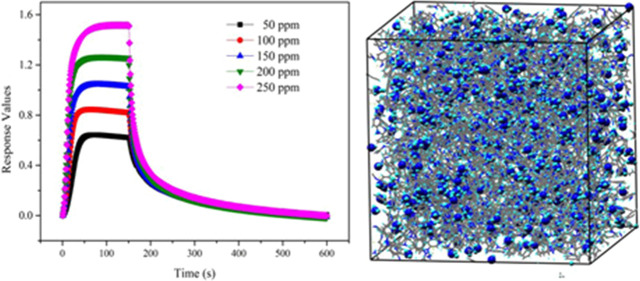
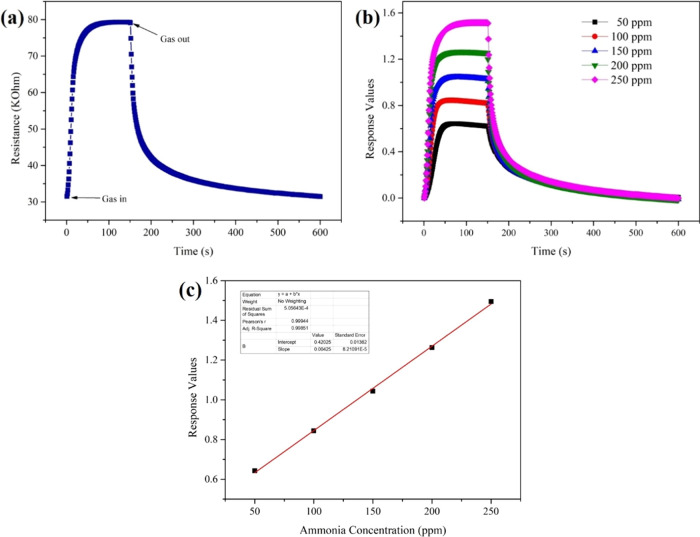
Figure 4a presents how the resistance of the sensors changed during one ammonia sensing test. When the ammonia gas was in, the resistance of the sensors increased immediately, and after a moment, it reached a stable value gradually. When the aim gas was out, ammonia gas in the test chamber would be released from the surface of the nanofiber sensors, resulting in the resistance value gradually reaching the initial value. The dynamic response curves in Figure 4b are similar to those of the changes in resistance, and with the increase in ammonia concentration, from 50, 100, 150, 200 to 250 ppm, the stable response values obtained with the aim gas grew higher. In Figure 4c, the response values are graphed versus the ammonia concentration, and since the trend has high linearity, we infer that the sensors have ideal stability in the range of 50–250 ppm ammonia. Additionally, the sensors can give fast response to aim gas. The response time (Tres) and comparison results with reported articles are summarized in Table S1.
Figure 4.
(a) Change in the resistance during one test, (b) dynamic responses with ammonia concentration varied from 50 to 250 ppm, and (c) response values with the fitting line of the nanofiber sensors.
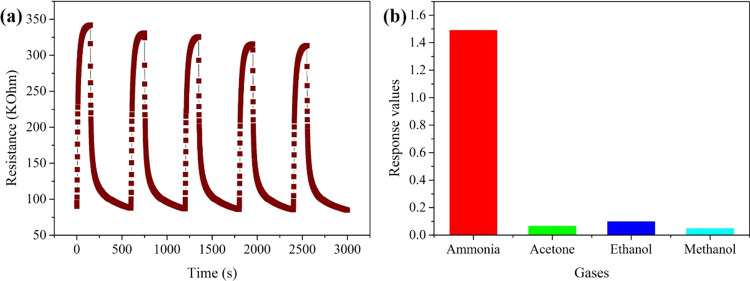
Selectivity and repeatability are important parameters to gas sensors. To investigate the sensor’s repeatability in this work, the obtained nanofiber sensors were exposed to 500 ppm ammonia five times. As indicated in Figure 5a, the final resistances can almost reach the initial ones, thus suggesting that the sensors possess reliable repeatability. In Figure 5b, it shows the response values to different gases with 250 ppm, and it is obvious that the response to ammonia is much higher than those to acetone, ethanol, and methanol, which can be concluded that the sensors have good selectivity among these gases.
Figure 5.
(a) Repeatability and (b) selectivity of PA6/PANI nanofiber sensors.
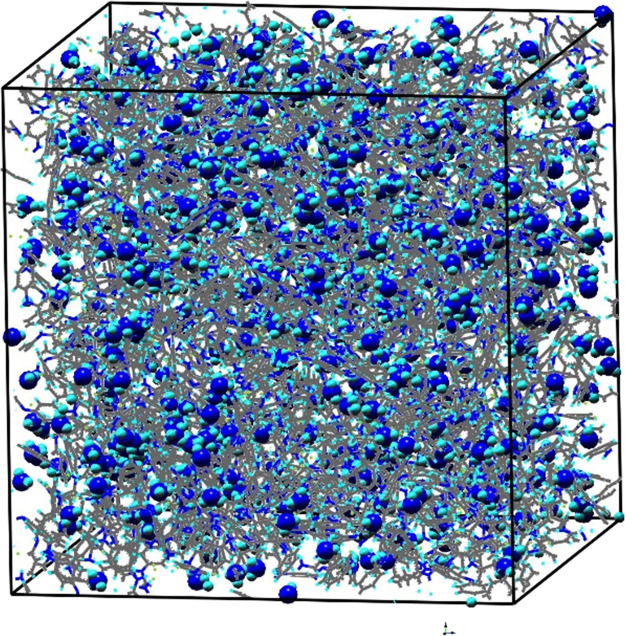
Figure 6 provides a snapshot of the equilibrated NH3 and HCl-PANI system at room temperature and standard pressure. This figure illustrates the distribution of NH3 molecules relative to HCl and PANI.
Figure 6.
Snapshot of the equilibrated NH3 and HCl-PANI system (the bigger ones are NH3 molecules, colors: carbon, gray; hydrogen, baby blue; nitrogen, blue; chlorine, yellow).
The interaction between ammonia molecules and HCl-PANI chains has a significant effect on the sensing behaviors, so the RDF in each ammonia sensing system was calculated, as illustrated in Figure 7. The graphs indicate that the structure in the ammonia sensing system displays the long-range disorder. The analysis of the RDF of N atoms in NH3 molecules and Cl, H+, and N+ atoms in the HCl-PANI chains reveals that the preferential adsorption order for the selected atoms is Cl > H+ > N+. Furthermore, the distance order between N atoms in NH3 molecules and the other selected atoms is N–Cl < N–H+ < N–N+, with distances of about 3.1, 4.1, and 5.0 Å, respectively.
Figure 7.
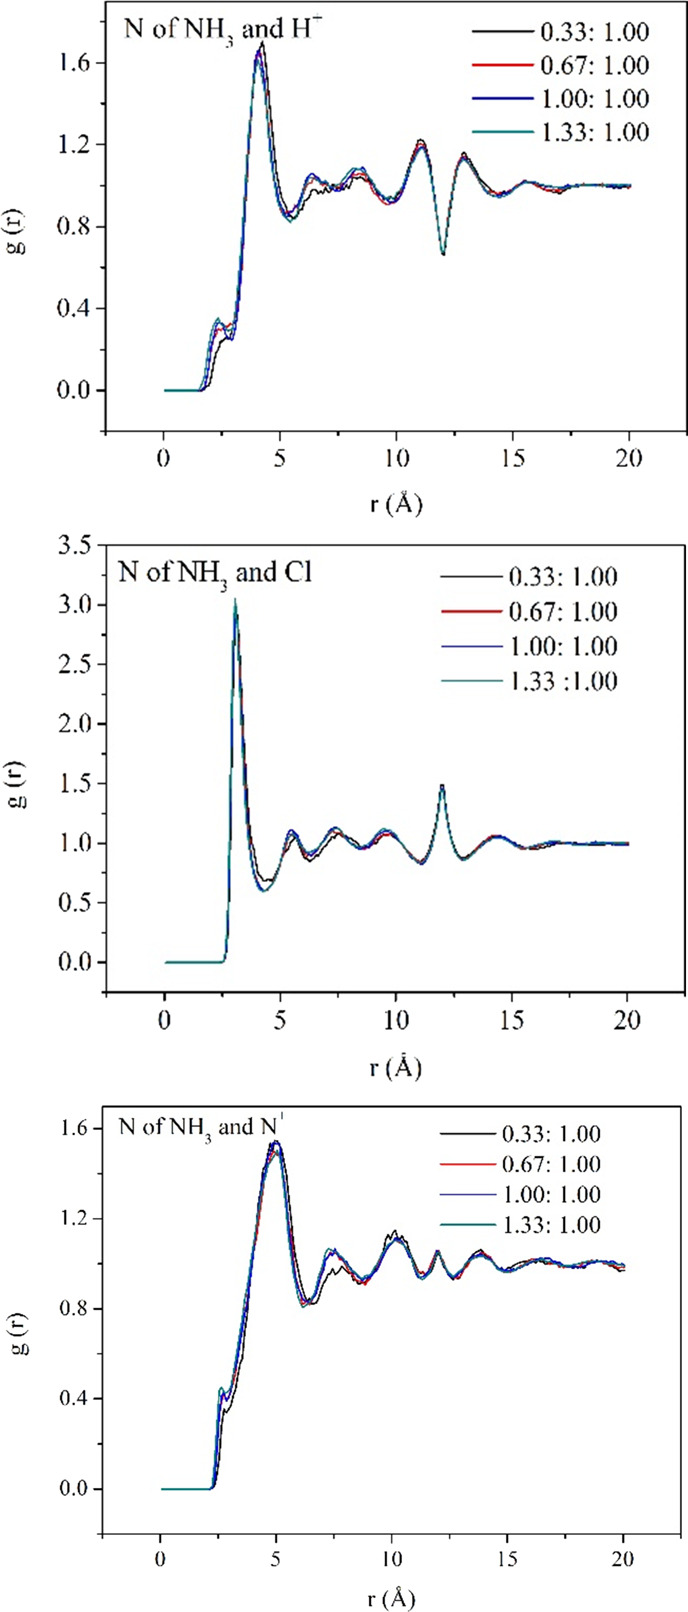
Calculated radical distribution functions (RDFs) of the ammonia sensing system.
Because of the interactions between ammonia and HCl-PANI chains, the ammonia mobility in these systems is expected to be anisotropic. For a system at equilibrium, the particles will move in accordance with the equations of motion that define the system and, in general, will tend to diffuse away from their original location.38 As observed in Figure 8, the slope values of the lines tend to be smaller with the ratio of ammonia to Cl increased, and the specific D values are given in Table 1.
Figure 8.
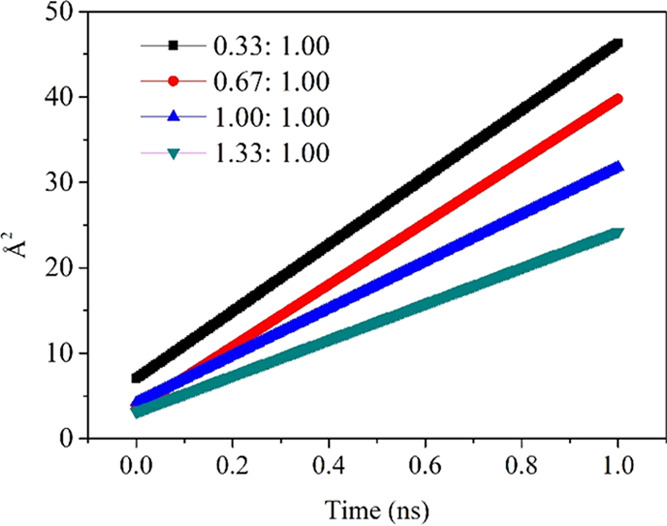
Mean square displacement of each HCl-PANI system.
Table 1. Diffusion Coefficient (D) and Interaction Energy ± Standard Deviations between NH3 and HCl-PANI (kcal/mol) of each HCl-PANI System.
| systems with different ratios of NH3 and Cl | D values (cm2/s) | interaction energy between NH3 and HCl-PANI (kcal/mol) |
|---|---|---|
| 0.33:1.00 | 6.54905 × e–0.7 | –1032 ± 135 |
| 0.67:1.00 | 6.04372 × e–0.7 | –1831 ± 442 |
| 1.00:1.00 | 4.59450 × e–0.7 | –2307 ± 370 |
| 1.33:1.00 | 3.51649 × e–0.7 | –3417 ± 436 |
The interaction energy represents the nonbonded potential energies (van der Waals and electrostatics) between two entities. The interaction energies between ammonia and HCl-PANI chains in different systems at the end of the MD simulations are also given in Table 1. With the percentage of ammonia in the system increased, the interaction energy grows significantly. The amount of HCl-PANI is constant, so as more ammonia molecules are added into the system, the interaction increases due to the increase in the amount of ammonia present.
Conclusions
The PA6/PANI nanofiber sensor fabricated by electrospinning and the in situ polymerization method showed ideal sensing properties to 50–250 ppm ammonia at room temperature with smooth dynamic responses, good selectivity, and acceptable repeatability. The mechanism of ammonia sensing is based on the dedoping mechanism of PANI chains by the NH3 analytes, which was monitored by the increase in the resistance and decreased conductivity. Complementary MD simulation results based on PANI-based ammonia sensors indicated that the density (1.3 g/cm3) of simulated HCl-PANI chains is close to the experimental value, and ammonia molecules in the system preferred to be adsorbed by Cl rather than H+ and N+ in the HCl-PANI chains. The sensing mechanism is consistent with the RDF and MSD analysis of the MD simulations that show a strong interaction between the Cl– dopant and NH3 molecules. This information can be used to direct the design of new sensors with excellent gas sensing properties.
Experimental Section
Preparation of Nanofibers
PA6 (Mw = 2.1 × 10⁴ g/mol, Zig Zheng Industrial Co. Ltd. of Taiwan, China) nanofibers were prepared via electrospinning 20 wt % PA6 in a mixture solution of formic acid. The feed rate, high-voltage power supply, and the distance between the metal needle tip and the ground stainless drum, which acted as the collector, were 0.3 mL/h, 20 kV, and 16 cm, respectively. Obtained PA6 nanofibrous membranes were immersed into 230 mL of 1.2 M HCl solution containing a certain amount of aniline for about half an hour to make sure that the aniline molecules can be adsorbed onto the surface of PA6 nanofibers. Secondly, in situ polymerization of aniline was carried out in an ice/water bath at 0–5 °C, beginning by adding 20 mL of 1.2 M HCl solution containing APS slowly. Successive polymerization lasted for 5 h. Furthermore, after that, the prepared PA6/PANI nanofibers were taken out and washed with deionized water and 1.2 M HCl solution five times. At last, the samples were dried at 50 °C for 24 h. All materials used in this study except PA6 were bought from Sinopharm Chemical Reagent Co. Ltd. of Beijing, China.
Ammonia Sensing Tests
Before gas sensing tests, the obtained PA6/PANI nanofibers were pasted onto electrodes and their sensing behaviors were tested with a homemade test system at room temperature, as shown in Figure S1, with a relative humidity of 65 ± 1%. Furthermore, the tested aim gas was ammonia with the concentration varied from 50 to 250 ppm. All gas sensing measurements were conducted under static conditions. The response values were defined as the ratio of (Ri – R0)/R0, in which Ri and R0 are the resistances of sensors in testing gas and air, respectively.39,40 The response time (Tres) was recorded by the time of 90% of maximum response values.9,41−44
Computational Details
All modeling works were conducted with the MAPS software, version 4.0, from Scienomics,45,46 and the MD simulations were done with a large-scale atomic/molecular massively parallel simulator (LAMMPS) program. The polymer-consistent force field (PCFF) was used.47 The models were built on a Dell computer with an Intel Core-i7 processor at 2.79 GHz with an 8 GB RAM.
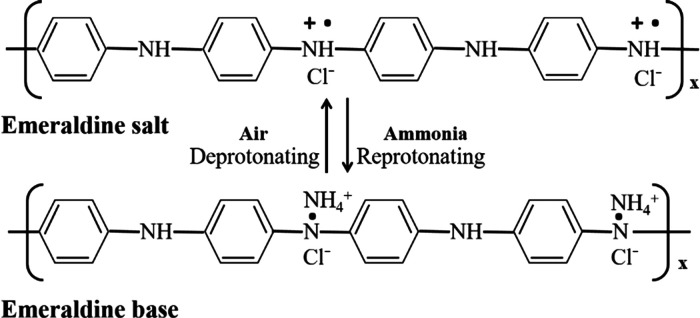
The reason why the PANI-based gas sensor has good selectivity of ammonia is that, when PANI-based materials were exposed to ammonia, their conductivity would be changed due to the reversible reaction PANI–H+ + NH3 ⇋ PANI + NH4+. The system was built using a polymer builder and amorphous cell modules in MAPS. We simulated the doping process with the following steps. First, a repeat unit of HCl-PANI, as illustrated in Figure 9, was constructed. Then, the double bonds between nitrogen and carbon atoms in the diamine units were broken. After that, this repeat unit was saved as a repeat unit template in the system. Using this template, one HCl-PANI chain was built with 30 repeat units. Finally, the bonds between Cl and N were broken, and the charges for the Cl atoms and the corresponding H atoms were manually set to be −1 and +1, respectively.
Figure 9.
Chemical structure of the emeraldine base polyaniline and HCl-doped emeraldine salt.
The model of HCl-PANI was generated using the approach of Ostwal and co-authors.37 A total of 10 polymer chains were used, and the density of HCl-PANI was set to be 0.15 g/cm3 to avoid ring spearings and catenations. The total energy was then minimized with the conjugate gradient method. The density was increased by compressing the simulation box with a high pressure of 0.7 GPa, and MD simulations were carried out using the NPT ensemble (constant number of atoms, pressure, and temperature) for 1 ns. MD simulations were then carried out in the NVT ensemble (constant number of atoms, volume, and temperature) at 1000 K, and after that, the system was cooled down with steps of 50–325 K. At last, the HCl-PANI system was carried out in the NPT ensemble with 1 atm at 300 K for 1 ns.
Ammonia molecules were added into the HCl-PANI system with HCl-PANI molecules frozen, and then, MD simulations were carried out at 1 atm and 300 K to obtain equilibrium of the ammonia molecules. HCl-PANI chains were then released, and MD simulations were carried out with 1 atm and 300 K for 1 ns. The amount of ammonia added into the system depended on the ratios of NH3 and Cl, which were 0.33:1.00, 0.67:1.00, 1.00:1.00, and 1.33:1.00, respectively.
The MSD of the ammonia molecules with respect to their original position was obtained as the second moment of their distribution at t > 0. The MSD and the diffusion coefficient (D) were calculated by the following equation
The MSD was fitted to a line ⟨|r(t) – r(0)|2⟩ = 6Dt + B, where N is the total number of particles, t is the time, and ri(t) and ri(0) are the positions of particles at t and t0, respectively.
Acknowledgments
This research was financially supported by the National Natural Science Foundation of China (no. 51803076), the Natural Science Foundation of Jiangsu Province of China (no. BK20180629), and the Fundamental Research Funds for the Central Universities (no. JUSRP121026). In addition, the first author also thanks the financial support from the China Scholarship Council for her PhD study at North Carolina State University.
Supporting Information Available
The Supporting Information is available free of charge at https://pubs.acs.org/doi/10.1021/acsomega.0c06272.
Schematic illustration of the homemade gas sensing test system (Figure S1) and response time to ammonia in this work and those reported in the literatures (Table S1) (PDF)
The authors declare no competing financial interest.
Supplementary Material
References
- Li Z.; Lin Z.; Wang N.; Wang J.; Liu W.; Sun K.; Fu Y. Q.; Wang Z. High precision NH3 sensing using network nano-sheet Co3O4 arrays based sensor at room temperature. Sens. Actuators, B 2016, 235, 222–231. 10.1016/j.snb.2016.05.063. [DOI] [Google Scholar]
- Schüth F.; Palkovits R.; Schlögl R.; Su D. S. Ammonia as a possible element in an energy infrastructure: catalysts for ammonia decomposition. Energy Environ. Sci. 2012, 5, 6278–6289. 10.1039/C2EE02865D. [DOI] [Google Scholar]
- Lan R.; Irvine J. T.; Tao S. W. Ammonia and related chemicals as potential indirect hydrogen storage materials. Int. J. Hydrogen Energy 2012, 37, 1482–1494. 10.1016/j.ijhydene.2011.10.004. [DOI] [Google Scholar]
- Xiao B.; Li Y. C.; Yu X. F.; Cheng J. B. MXenes: reusable materials for NH3 sensor or capturer by controlling the charge injection. Sens. Actuators, B 2016, 235, 103–109. 10.1016/j.snb.2016.05.062. [DOI] [Google Scholar]
- Rezlescu E.; Doroftei C.; Rezlescu N.; Popa P. D. Preparation, structure and gas-sensing properties of gamma-Fe2O3 and gamma-Fe2O3-TiO2 thick films. Phys. Status Solidi A 2008, 205, 1790–1793. 10.1002/pssa.200723617. [DOI] [Google Scholar]
- Martini-Laithier V.; Graur I.; Bernardini S.; Aguir K.; Perrier P.; Bendahan M. Ammonia detection by a novel Pyrex microsystem based on thermal creep phenomenon. Sens. Actuators, B 2014, 192, 714–719. 10.1016/j.snb.2013.10.120. [DOI] [Google Scholar]
- Shahabuddin M.; Sharma A.; Kumar J.; Tomar M.; Umar A.; Gupta V. Metal clusters activated SnO2 thin film for low level detection of NH3 gas. Sens. Actuators, B 2014, 194, 410–418. 10.1016/j.snb.2013.12.097. [DOI] [Google Scholar]
- Zheng Y.; Li M.; Wen X.; Ho H.-P.; Lu H. Nanostructured ZnO/Ag film prepared by magnetron sputtering method for fast response of ammonia gas detection. Molecules 2020, 25, 1899. 10.3390/molecules25081899. [DOI] [PMC free article] [PubMed] [Google Scholar]
- Liu I. P.; Chang C. H.; Ke B. Y.; Lin K. W. Ammonia sensing performance of a GaN-based schottky diode incorporating a platinum thin film and a GaOx dielectric. IEEE Sens. J. 2019, 19, 10207–10213. 10.1109/JSEN.2019.2930635. [DOI] [Google Scholar]
- Kumar A.; Sanger A.; Kumar A.; Chandra R. Fast response ammonia sensors based on TiO2 and NiO nanostructured bilayer thin films. RSC Adv. 2016, 6, 77636–77643. 10.1039/C6RA14342C. [DOI] [Google Scholar]
- Kwak D.; Wang M.; Koski K. J.; Zhang L.; Sokol H.; Maric R.; Lei Y. Molybdenum trioxide (alpha-MoO3) nanoribbons for ultrasensitive ammonia (NH3) gas detection: integrated experimental and density functional theory simulation studies. ACS Appl. Mater. Interfaces 2019, 11, 10697–10706. 10.1021/acsami.8b20502. [DOI] [PubMed] [Google Scholar]
- Peng W. Y.; Sur R.; Strand C. L.; Spearrin R. M.; Jeffries J. B.; Hanson R. K. High-sensitivity in situ QCLAS-based ammonia concentration sensor for high-temperature applications. Appl. Phys. B: Lasers Opt. 2016, 122, 188. 10.1007/s00340-016-6464-2. [DOI] [Google Scholar]
- Saini P.; Choudhary V.; Singh B. P.; Mathur R. B.; Dhawan S. K. Enhanced microwave absorption behavior of polyaniline-CNT/polystyrene blend in 12.4–18.0 GHz range. Synth. Met. 2011, 161, 1522–1526. 10.1016/j.synthmet.2011.04.033. [DOI] [Google Scholar]
- Saini P.; Arora M.; Gupta G.; Gupta B. K.; Singh V. N.; Choudhary V. High permittivity polyaniline–barium titanate nanocomposites with excellent electromagnetic interference shielding response. Nanoscale 2013, 5, 4330–4336. 10.1039/c3nr00634d. [DOI] [PubMed] [Google Scholar]
- Saini P.Fundamentals of conjugated polymer-based blends, copolymers, and composites: synthesis, properties, and applications. in fundamentals of conjugated polymer blends, copolymers and composites; John Wiley & Sons, Inc.2015, 1–118. ISBN: 978–1–118-54949-0. [Google Scholar]
- Saini P.; Choudhary V.; Singh B. P.; Mathur R. B.; Dhawan S. K. Polyaniline–MWCNT nanocomposites for microwave absorption and EMI shielding. Mater. Chem. Phys. 2009, 113, 919–926. 10.1016/j.matchemphys.2008.08.065. [DOI] [Google Scholar]
- Pang Z.; Yang Z.; Chen Y.; Zhang J.; Wang Q.; Huang F.; Wei Q. A room temperature ammonia gas sensor based on cellulose/TiO2/PANI composite nanofibers. Colloids Surf., A 2016, 494, 248–255. 10.1016/j.colsurfa.2016.01.024. [DOI] [Google Scholar]
- Tanguy N. R.; Thompson M.; Yan N. A review on advances in application of polyaniline for ammonia detection. Sens. Actuators, B 2018, 257, 1044–1064. 10.1016/j.snb.2017.11.008. [DOI] [Google Scholar]
- Chen S.; Sun G. High sensitivity ammonia sensor using a hierarchical polyaniline/poly(ethylene-co-glycidyl methacrylate) nanofibrous composite membrane. ACS Appl. Mater. Interfaces 2013, 5, 6473–6477. 10.1021/am402217s. [DOI] [PubMed] [Google Scholar]
- Bai H.; Shi G. Gas sensors based on conducting polymers. Sensors-Basel 2007, 7, 267–307. 10.3390/s7030267. [DOI] [Google Scholar]
- Kumar J.; Shahabuddin M.; Singh A.; Singh S. P.; Saini P.; Dhawan S. K.; Gupta V. Highly sensitive chemo-resistive ammonia sensor based on dodecyl benzene sulfonic acid doped polyaniline thin film. Sci. Adv. Mater. 2015, 7, 518–525. 10.1166/sam.2015.2000. [DOI] [Google Scholar]
- Saini P.; Kuila T.; Saha S.; Murmu N. C.. Chapter 15: Graphene and its nanocomposites for gas sensing applications. Book: Advanced sensor and detection materials in advanced sensor and detection materials. John Wiley & Sons, Inc.2014, 467–500. [Google Scholar]
- Yadav A.; Kumar J.; Shahabuddin M.; Agarwal A.; Saini P. Improved ammonia sensing by solution processed dodecyl benzene sulfonic acid doped polyaniline nanorod networks. IEEE Access 2019, 7, 139571–139579. 10.1109/ACCESS.2019.2942361. [DOI] [Google Scholar]
- Saini P.; Jalan R.; Dhawan S. K. Synthesis and characterization of processable polyaniline doped with novel dopant NaSIPA. J. Appl. Polym. Sci. 2008, 108, 1437–1446. 10.1002/app.27827. [DOI] [Google Scholar]
- Pan W.; Yang S. L.; Li G.; Jiang J. M. Electrical and structural analysis of conductive polyaniline/polyacrylonitrile composites. Eur. Polym. J. 2005, 41, 2127–2133. 10.1016/j.eurpolymj.2005.04.003. [DOI] [Google Scholar]
- Ma S.; Jia J.; Tian Y.; Cao L.; Shi S.; Li X.; Wang X. Improved H2S sensing properties of Ag/TiO2 nanofibers. Ceram. Int. 2016, 42, 2041–2044. 10.1016/j.ceramint.2015.09.034. [DOI] [Google Scholar]
- Wang Q.; Dong X.; Pang Z.; Du Y.; Xia X.; Wei Q.; Huang F. Ammonia sensing behaviors of TiO2-PANI/PA6 composite nanofibers. Sensors 2012, 12, 17046–17057. 10.3390/s121217046. [DOI] [PMC free article] [PubMed] [Google Scholar]
- Pang Z.; Fu J.; Luo L.; Huang F.; Wei Q. Fabrication of PA6/TiO2/PANI composite nanofibers by electrospinning-electrospraying for ammonia sensor. Colloids Surf., A 2014, 461, 113–118. 10.1016/j.colsurfa.2014.07.038. [DOI] [Google Scholar]
- Huang Y.; Jiao W.; Chu Z.; Ding G.; Yan M.; Zhong X.; Wang R. Ultrasensitive room temperature ppb-level NO2 gas sensors based on SnS2/rGO nanohybrids with P-N transition and optoelectronic visible light enhancement performance. J. Mater. Chem. C 2019, 7, 8616–8625. 10.1039/C9TC02436K. [DOI] [Google Scholar]
- Chen H.; Chen Y.; Zhang H.; Zhang D. W.; Zhou P.; Huang J. Suspended SnS2 layers by light assistance for ultrasensitive ammonia detection at room temperature. Adv. Funct. Mater. 2018, 28, 1801035. 10.1002/adfm.201801035. [DOI] [Google Scholar]
- Akande A. A.; Mosuang T.; Ouma C. N.; Benecha E. M.; Tesfamicheal T.; Roro K.; Machatine A. G. J.; Mwakikunga B. W. Ammonia gas sensing characteristics of V2O5 nanostructures: a combined experimental and ab initio density functional theory approach. J. Alloys Compd. 2020, 821, 153565. 10.1016/j.jallcom.2019.153565. [DOI] [Google Scholar]
- Sharma N.; Sharma N.; Srinivasan P.; Kumar S.; Rayappan J. B. B.; Kailasam K. Heptazine based organic framework as a chemiresistive sensor for ammonia detection at room temperature. J. Mater. Chem. A 2018, 6, 18389–18395. 10.1039/C8TA06937A. [DOI] [Google Scholar]
- Chen X.; Yuan C. A.; Wong C. K.; Ye H.; Leung S. Y.; Zhang G. Molecular modeling of protonic acid doping of emeraldine base polyaniline for chemical sensors. Sens. Actuators, B 2012, 174, 210–216. 10.1016/j.snb.2012.08.042. [DOI] [Google Scholar]
- Wang S.; Zhou G.; Ma Y.; Gao L.; Song R.; Jiang G.; Lu G. Molecular dynamics investigation on the adsorption behaviors of H2O, CO2, CH4 and N2 gases on calcite (1 (1)over-bar 0) surface. Appl. Surf. Sci. 2016, 385, 616–621. 10.1016/j.apsusc.2016.05.026. [DOI] [Google Scholar]
- Fatemi S. M.; Foroutan M. Molecular dynamics simulations of freezing behavior of pure water and 14% water-NaCl mixture using the coarse-grained model. Iran. J. Chem. Chem. Eng. 2016, 35, 1–10. [Google Scholar]
- Gizdavic-Nikolaidis M.; Vella J.; Bowmaker G. A.; Zujovic Z. D. Rapid microwave synthesis of polyaniline-C-60 nanocomposites. Synth. Met. 2016, 217, 14–18. 10.1016/j.synthmet.2016.03.009. [DOI] [Google Scholar]
- Ostwal M. M.; Sahimi M.; Tsotsis T. T. Water harvesting using a conducting polymer: A study by molecular dynamics simulation. PHYS. REV. E. 2009, 79, 061801 10.1103/PhysRevE.79.061801. [DOI] [PubMed] [Google Scholar]
- Kubečka J.; Uhlík F.; Košovan P. Mean squared displacement from fluorescence correlation spectroscopy. Soft Matter 2016, 12, 3760–3769. 10.1039/C6SM00296J. [DOI] [PubMed] [Google Scholar]
- Zhihua L.; Xucheng Z.; Jiyong S.; Xiaobo Z.; Xiaowei H.; Tahir H. E.; Holmes M. Fast response ammonia sensor based on porous thin film of polyaniline/sulfonated nickel phthalocyanine composites. Sens. Actuators, B 2016, 226, 553–562. 10.1016/j.snb.2015.10.062. [DOI] [Google Scholar]
- Pang Z.; Fu J.; Lv P.; Huang F.; Wei Q. Effect of CSA concentration on the ammonia sensing properties of CSA-doped PA6/PANI composite nanofibers. Sensors 2014, 14, 21453–21465. 10.3390/s141121453. [DOI] [PMC free article] [PubMed] [Google Scholar]
- Kumar L.; Rawal I.; Kaur A.; Annapoorni S. Flexible room temperature ammonia sensor based on polyaniline. Sens. Actuators, B 2017, 240, 408–416. 10.1016/j.snb.2016.08.173. [DOI] [Google Scholar]
- Eising M.; Cava C. E.; Salvatierra R. V.; Zarbin A. J. G.; Roman L. S. Doping effect on self-assembled films of polyaniline and carbon nanotube applied as ammonia gas sensor. Sens. Actuators, B 2017, 245, 25–33. 10.1016/j.snb.2017.01.132. [DOI] [Google Scholar]
- Feng Q.; Li X.; Wang J. Percolation effect of reduced graphene oxide (rGO) on ammonia sensing of rGO-SnO2 composite based sensor. Sens. Actuators, B 2017, 243, 1115–1126. 10.1016/j.snb.2016.12.075. [DOI] [Google Scholar]
- Cho B.; Yoon J.; Lim S. K.; Kim A. R.; Kim D. H.; Park S. G.; Kwon J. D.; Lee Y. J.; Lee K. H.; Lee B. H.; Ko H. C.; Hahm M. G. Chemical sensing of 2D graphene/MoS2 heterostructure device. ACS Appl. Mater. Interfaces 2015, 7, 16775–16780. 10.1021/acsami.5b04541. [DOI] [PubMed] [Google Scholar]
- Chaudret R.; Bick A.; Krokidis X. Theoretical modeling of thermal decomposition of methylnaphthalene derivatives: influence of substituents. Energy Fuels 2016, 30, 6817–6821. 10.1021/acs.energyfuels.6b01062. [DOI] [Google Scholar]
- Zubeir L. F.; Spyriouni T.; Roest D.; Hill J. R.; Kroon M. C. Effect of oxygenation on carbon dioxide absorption and thermophysical properties of ionic liquids: experiments and modeling using electrolyte PC-SAFT. Ind. Eng. Chem. Res. 2016, 55, 8869–8882. 10.1021/acs.iecr.6b01984. [DOI] [Google Scholar]
- Kimura M.; Sakai R.; Sato S.; Fukawa T.; Ikehara T.; Maeda R.; Mihara T. Sensing of vaporous organic compounds by TiO2 porous films covered with polythiophene layers. Adv. Funct. Mater. 2012, 22, 469–476. 10.1002/adfm.201101953. [DOI] [Google Scholar]
Associated Data
This section collects any data citations, data availability statements, or supplementary materials included in this article.


