

Abstract
Medulloblastoma is the most frequent malignant central nervous system tumor in children. MicroRNAs (miRs) are small, non‐coding RNAs that target protein‐coding and non‐coding RNAs, and play roles in a variety of cellular processes through regulation of multiple targets. In the present study, we analyzed miR‐22 expression and its effect in cell proliferation and apoptosis in medulloblastomas. Quantitative reverse transcription PCR (RT‐PCR) revealed significantly lower expression of miR‐22 in 19 out of 27 (70%) medulloblastomas, D341, DAOY, ONS‐76 medulloblastoma cell lines, compared with normal cerebellum. Forced expression of miR‐22 by lentiviral vector transfection reduced cell proliferation and induced apoptosis, while knockdown of miR‐22 increased proliferative activity in DAOY and ONS‐76 cells. DAOY cells with miR‐22 overexpression in nude mice yielded tumors smaller than those originated from control DAOY cells. Microarray analysis in DAOY cells with forced miR‐22 expression showed significant changes in expression profiles, PAPST 1 being the most significantly (10 folds) downregulated gene. Quantitative RT‐PCR revealed PAPST1 mRNA upregulation in 18 out of 27 (67%) medulloblastomas. In addition, a luciferase reporter assay in ONS‐76 and DAOY cells suggested that miR‐22 directly targets the PAPST 1 gene, and lentivirus‐mediated knockdown of PAPST 1 suppressed proliferation of DAOY and ONS‐76 medulloblastoma cells. These results suggest that frequently downregulated miR‐22 expression is associated with cell proliferation in medulloblastomas, and this may be at least in part via PAPST 1, which is a novel target of miR‐22.
Keywords: apoptosis, cell proliferation, medulloblastoma, miR‐22, PAPST1
Introduction
Medulloblastoma [World Health Organization (WHO) grade IV] is the most common malignant intracranial tumor in children 12, which arises primarily from external granular layer precursor cells 50. Patients with medulloblastoma have been stratified into “standard‐risk” and “high‐risk” groups based on the clinical parameters (age, metastatic stage at diagnosis, extent of surgical resection) and histologic features 34. The 5‐year disease‐free survival rates have been improved by multimodality treatment (surgery, radiotherapy and chemotherapy) at 70%–80% in the standard‐risk group, and 55% to >60% in the high‐risk group 7, 13. However, the majority of survivors suffer from the adverse effects, for example, life‐long cognitive defects and neuro‐endocrine late effects 24, and there is an urgent need for development of novel targeted therapy. Several recent large‐scale genomic and expression studies have shown genetic heterogeneity in medulloblastomas, and defined several subtypes with unique molecular profiles and clinical behavior 18.
MicroRNAs (miRs) are short non‐coding RNAs that have critical regulatory functions in a variety of biological processes, that is, cell proliferation, apoptosis, differentiation, development and tumorigenesis, by affecting expression of multiple target genes, including oncogenes and tumor suppressor genes 3, 11. Several studies have suggested important roles of miRs in pathogenesis of medulloblastomas. It has been reported that miR‐183 cluster regulates multiple biological programs which support the maintenance and metastatic potential of medulloblastomas 44. Bai et al 2 showed that miR‐182 promotes leptomeningeal metastatic dissemination of non‐sonic hedgehog medulloblastoma. The miR‐124 was downregulated in medulloblastoma (MB) and involves in the cell cycle regulation by targeting CDK6, a well‐known adverse prognostic marker in MB 31. The miR‐214 was increased in Sonic Hedgehog (SHH) group of medulloblastomas, its oncogenic role was based on the regulation of human suppressor of fused gene, a SHH pathway inhibitor 8. Therefore, miRNAs are important players in MB tumorigenesis and their therapeutic exploitation can constitute an alternative approach to this devastating disease 42.
MiR‐22 gene is located at 17p13.3, where loss of heterozygosity (LOH) are frequent in human neoplasms 6, including breast cancer (28%) 35, ovarian cancer (79%) 30, 32, lung cancer (57%) 17, hepatocellular carcinomas (68%) 53 and medulloblastomas (38%–44%) 25, 37. MiR‐22 expression is reduced in a variety of human neoplasms, including breast cancer 47, hepatocellular carcinomas 52 and acute lymphoblastic leukemia 20. Level of miR‐22 expression was significantly lower in colorectal cancer tissues than normal adjacent mucosa and was associated with liver metastasis and shorter overall survival 51. In patients with non‐small cell lung cancer, there was a correlation between high miR‐22 expression in blood and the lack of response to pemetrexed‐based chemotherapy, suggesting that miR‐22 represent a novel predictive biomarker 10.
Berenguer et al 4 showed that miR‐22 regulates cell cycle length in cerebellar granular neuron precursors. A microarray analysis by Ferretti et al 9 revealed lower expression of miR‐22 in medulloblastomas compared with adult and fetal normal cerebellum. Little is known about the role of miR‐22 in the pathogenesis of medulloblastomas. In the present study, we assessed miR‐22 expression in medulloblastoma tissues and medulloblastoma cells. The observation of very frequent miR‐22 downregulation in medulloblastomas prompted us to further carry out in vitro studies to obtain underlying mechanisms and to identify the target of the miR‐22.
Materials and Methods
Tumor samples
A cohort of 27 primary medulloblastomas without history of radiotherapy or chemotherapy was obtained from Xinqiao Hospital, Third Military Medical University, Chongqing and Xiangya Hospital, Central South University, Changsha. Twenty‐two patients were children (median age, 8 years; range 2–13 years) and five were adults (median, 39 years; range, 19–63 years). The male/female ratio was 2:1. Tumor tissues were immediately frozen at the time of surgery and kept in liquid nitrogen until use. Tumors were diagnosed according to the 2007 WHO Classification of Tumours of the Central Nervous System 22. Histologically, 20 cases were diagnosed as classic medulloblastomas, four were large cell/anaplastic medulloblastomas and three were desmoplastic/nodular medulloblastomas. Histological examination confirmed that >80% of cells in samples were neoplastic cells. Written informed consent was obtained from parents or legal guardians of all patients. A normal cerebellum was obtained from a 20‐year‐old male at autopsy, and was used as a negative control for immunohistochemistry. This study was approved by the Ethical Committee of the Xinqiao Hospital, Third Military Medical University, Chongqing and Xiangya Hospital, Central South University, Changsha.
Medulloblastoma cell lines
Human medulloblastoma cell lines D341 and DAOY were generous gifts from Dr. Jesse Chung‐Sean Pang, Department of Anatomical and Cellular Pathology, The Chinese University of Hong Kong. ONS‐76 medulloblastoma cells were kindly provided by Professor Xiuwu Bian, Institute of Pathology and Southwest Cancer Center, Southwest Hospital, Third Military Medical University, China. D341 and DAOY cells were cultured in α‐minimum essential medium (α‐MEM; HyClone, Logan City, UT, USA) and ONS‐76 was cultured in RPMI‐1640 culture medium (HyClone). All culture media were supplemented with 10% fetal bovine serum and 1% penicillin‐streptomycin at 37°C in a humidified 5% CO2 incubator.
Vector construction, lentiviral production and infection
Sequences of pri‐miR‐22, miR‐22‐inhibitor and PAPST1‐shRNA are shown in Table 1. The pLKD.CMV.GFP.U6.shRNA vector (Supporting Information Figure S1A) was purchased from NeuronBiotech (Shanghai, China), and was inserted into the AgeI‐EcoRI site downstream of the U6 promoter. A negative control vector containing a non‐targeting sequence was also obtained from NeuronBiotech.
Table 1.
DNA oligos sequence of shRNA and microRNA
| Name | DNA oligos sequence (5'→3') | Sizes (bp) | |
|---|---|---|---|
| Pri‐miR‐22 | Sense | ACCGGTAGTGGGTCAGCGTTGCAGCAACATGCCCTGCTCAGATCTTTCCCATTTTCCCTCCCTTTCCCTTAGGAGCCTGTTCCTCTCACGCCCTCACCTGGCTGAGCCGCAGTAGTTCTTCAGTGGCAAGCTTTATGTCCTGACCCAGCTAAAGCTGCCAGTTGAAGAACTGTTGCCCTCTGCCCCTGGCTTCGAGGAGGAGGAGGAGCTGCTTTCCCCATCATCTGGAAGGTGACAGAAATGGGCTGGGAAGGTCCGAACAGCAGGGTGGATGATACGTTTTTTGAATTC | 291 |
| Antisense | GAATTCAAAAAACGTATCATCCACCCTGCTGTTCGGACCTTCCCAGCCCATTTCTGTCACCTTCCAGATGATGGGGAAAGCAGCTCCTCCTCCTCCTCGAAGCCAGGGGCAGAGGGCAACAGTTCTTCAACTGGCAGCTTTAGCTGGGTCAGGACATAAAGCTTGCCACTGAAGAACTACTGCGGCTCAGCCAGGTGAGGGCGTGAGAGGAACAGGCTCCTAAGGGAAAGGGAGGGAAAATGGGAAAGATCTGAGCAGGGCATGTTGCTGCAACGCTGACCCACTACCGGT | 291 | |
| miR‐22‐inhibitor | Sense | CCGGTAAAGCTTGCCACTGAAGAACTTTTTTTG | 33 |
| Antisense | AATTCAAAAAAAGTTCTTCAGTGGCAAGCTTTA | 33 | |
| PAPST1‐shRNA | Sense | CCGGGGTCAAGAGAGCATAGGTAGGCTCGAGCCTACCTATGCTCTCTTGACCTTTTTTG | 59 |
| Antisense | AATTCAAAAAAGGTCAAGAGAGCATAGGTAGGCTCGAGCCTACCTATGCTCTCTTGACC | 59 |
For the lentivirus production, vectors were cotransfected with pHelper 1.0 and pHelper 2.0 helper plasmids using Lipofectamine 2000 (Invitrogen, Carlsbad, CA, USA) into HEK293T cells when they reached 80% confluency. After culture for 3 days, supernatant was harvested and purified by centrifugation, and was filtered through a 0.45 μm cellulose acetate filter. The titer of virus was measured by quantitative polymerase chain reaction (PCR).
The lentivirus was transfected to the DAOY and ONS‐76 cells according to the manufacturer's instructions, in the presence of virus at a multiplicity of infection (MOI) of 30 for the pri‐miR‐22 and empty control, and an MOI of 10 for miR‐22‐inhibitor, PAPST1‐shRNA and their corresponding negative control vectors. Transfection efficiencies were determined by the proportion of green fluorescence protein (GFP)‐positive cells. Five days after transfection, GFP‐expressing cells were used for subsequent analyses.
Quantitative reverse transcription PCR (qRT‐PCR)
Total RNA was isolated from tumor tissues or cells using TRizol (Invitrogen) according to the manufacturer's instructions. To assess miR‐22 expression, pooled total RNA (1 μg) was reverse‐transcribed in the presence of a Poly‐A polymerase with an oligo‐dT adaptor using All‐in‐One™ miRNA First‐strand cDNA synthesis kit (GeneCopoeia, Inc., Rockville, MD, USA). Quantitative RT‐PCR was performed in a CFX96™ RT‐PCR Detection System (Bio‐Rad, Laboratories, Hercules, CA, USA) with SYBR green detection and the universal adaptor reverse primer, with 1 μL of cDNA, following the protocol of All‐in‐One™ miRNA qPCR Kit (GeneCopoeia, Inc.). The threshold cycle numbers (Ct) were normalized against an endogenous control (RNU6B RNA) and related to a pooled total RNA from the normal cerebellum (24 male/female Caucasians; age, 16–70 years old; Clontech, Mountain View, CA, USA) 2, 23.
cDNA was synthesized from 1 μg of total RNA using PrimeScript™ RT reagent Kit with gDNA Eraser (TaKaRa, Kyoto, Japan). Quantitative PCR was carried out in the CFX96™ RT‐PCR Detection System (Bio‐Rad, Laboratories) with 1 μL of the cDNA product, according to the instruction of SYBR® Premix Ex Taq™ II (TaKaRa).
Primers for miR‐22 (HmiRQP0332) and RNU6B (HmiRQP9001) were purchased from the GeneCopoeia, Inc. Forward and reverse primers for PAPST1 were 5'‐CTA TGG TTC TTC CCA TTT GTG G‐3' and 5'‐ACC GGT CTC CAG GTA GTT CTT C‐3' 27, and those for β‐actin were 5'‐GCA CCA CAC CTT CTA CAA TGA GC‐3' and 5'‐TAG CAC AGC CTG GAT AGC AAC G‐3'. The level of PAPST1 mRNA expression, normalized to the reference control β‐actin, was related to the normal cerebellum total RNA as described above. Supporting Information Figure S2 shows the standard curves of quantitative RT‐PCR for miR‐22, U6, PAPST1 and β–actin. The efficiency of the amplifications was similar and sufficiently high for the target and internal control genes. Data from quantitative RT‐PCR were analyzed by relative quantification using the 2[‐ΔΔC(T)] method 21. Each sample was analyzed in triplicate.
Fluoresence in situ hybridization (FISH)
Dual color FISH was performed on formalin‐fixed paraffin‐embedded medulloblastoma specimens. We used Vysis LSI dual color probe set, which consisted of locus‐specific 17p13.3 (orange spectrum) and locus‐specific 17q21/RARA (green spectrum) probes (Abbott molecular, Chicago, IL, USA). FISH analysis was carried out according to the standard protocol described 29, using the criteria for assessing FISH results previously described 28.
Cell counting kit‐8 (CCK‐8) assay
Five days after transfection, cell viability was evaluated by CCK‐8 assay (Dojindo, Kumamoto, Japan). Briefly, medulloblastoma cells (DAOY, ONS‐76) transfected with lentivirus carrying pri‐miR‐22, miR‐22‐inhibitor or PAPST1‐shRNA, as well as their respective control cells transfected with control vectors, were trypsinized and plated (103 cells/well) in 96‐well plates with a final volume of 100 μL/well. After incubation for 0 h, 24 h, 48 h, 72 h, 96 h or 120 h, 10 μL of CCK‐8 solution was added to each well and plates were incubated at 37°C for an additional 1 h. The optical density (OD) value of each well at 450 nm was recorded on a Microplate Reader (Thermo Fisher Scientific, Waltham, MA, USA).
Flow cytometric analysis
To assess apoptosis, AnnexinV‐PE/7‐amino‐actinomycin (7‐AAD) flow cytometric assay was performed using the AnnexinV‐PE/7‐AAD Apoptosis Detection Kit (KeyGen Biotech, Nanjing, China). Medulloblastomas cells (DAOY, ONS‐76) transfected with miR‐22 and their respective control cells transfected with empty vectors, were washed with phosphate buffered saline (PBS) at room temperature and trypsinized without Ethylenediaminetetraacetic acid, then were washed twice with cold PBS. Approximately 3 × 10⁵ cells were resuspended in 200 μL binding buffer. After incubated with phycoerythrin‐conjugated (PE‐conjugated) annexin V (5 μL) for 15 min and then with D 7‐AAD (5 μL) for 15 min, cells were analyzed by Fluorescence Activated Cell Sorter (FACS) using a FACSCanto II flow cytometer equipped with FACSDiva software (BD Biosciences, Heidelberg, Germany). Percentages of AnnexinV + /7‐AAD‐ (early stage apoptotic cells), AnnexinV + /7‐AAD + (late stage apoptotic cells) and AnnexinV‐/7‐AAD‐ (non‐apoptotic cells) were calculated based on the distribution in the set quadrants 5.
Western blot
Medulloblastoma cells (DAOY, ONS‐76) transfected with lentivirus carrying pri‐miR‐22, PAPST1‐shRNA or their respective control cells, were cultured for 5 days. Protein was extracted from these cells, as well as from tumor tissue in nude mice using Total Protein Extraction Kit (BestBio Biotechnologies, Shanghai, China). Protein concentrations were determined with bicinchoninic acid assay (Beyotime Biotechnology, Haimen, China). The lysates were heated in SDS‐PAGE protein loading buffer (Beyotime Biotechnology) at 100°C for 5 min. Equal amounts of protein (40 μg/cell line) were separated using 12% (w/v) SDS‐PAGE (Beyotime Biotechnology) and transferred onto polyvinylidene difluoride (PVDF) membranes (Bio‐Rad, Laboratories). Non‐specific binding was blocked with 10 mmol/L tris buffered saline, containing 0.1% Tween 20 and 5% non‐fat milk. Membranes were then incubated overnight at 4°C with the respective primary antibodies (diluted 1:1000) for caspase‐3 (Cell Signaling Technology, Danvers, MA, USA), GAPDH (Cell Signaling Technology) or PAPST1 (Abcam, Cambridge, MA, USA). Membranes were washed and incubated with Horseradish Peroxidase‐conjugated goat anti‐rabbit IgG (H + L) (Zhongshan Golden Bridge, Beijing, China) at a dilution of 1:2000. Signals were visualized by enhanced chemiluminescence, using BeyoECL Plus kit (Beyotime Biotechnology) and detected with Gel Doc™ 2000 Gel Documentation System (Bio‐Rad, Laboratories). Relative band intensities were determined using Quantity One analysis software (Bio‐Rad, Laboratories).
In vivo assay
BABL/C nude mice were bred at the Laboratory Animal Center, Third Military Medical University, Chongqing, China. All animal experimental procedures were performed with the protocols approved by the Institutional Animal Care and Ethics Committee. Five nude mice were subcutaneously injected with DAOY cells transfected with empty vector (106 cells/mouse), and five mice were with DAOY cells transfected with miR‐22 (106 cells/mouse). Eight weeks after inoculation of cells, volumes of tumors were calculated by the formula A × A × B/2 (A, short diameter; B, long diameter perpendicular to A). All parameters were measured with digital calipers. Measurement by fluorescence imaging (NIR) using the Kodak In‐Vivo Imaging System FX Pro was also carried out (Kodak, USA) 38, 39.
Transmission electron microscopy
Transmission electron microscopy was carried out to examine the ultrastructure of the tumor samples in nude mice. Tumor tissues (approximately 1 mm3 in diameter) were fixed in 2.5% glutaraldehyde for 1 day. After the post‐fixation with 1% osmium tetroxide for 2 h, specimens were dehydrated with graded series of ethanol, and were embedded in epoxy resin 618. Ultrathin sections were cut on a Leica EM UC7 ultramicrotome (Leica Microsystems, Bannockburn, IL, USA), and were stained with double lead. The sections were examined and photographed using a FEI Tecnai10 electron microscope (FEI Company, Acht, Eindhoven, The Netherlands).
Microarray analysis in DAOY cells with and without forced miR‐22 expression
Microarray analysis was performed using human oligo Chip 35k V2.0 (CapitalBio Corporation, Beijing, China), which contain 35 035 oligonucleotide 70‐mer probes. The cDNA was synthesized by Eberwine's linear RNA amplification method, followed by subsequent Klenow enzymatic reaction, which introduced the Cy5/Cy3‐dCTP into the cDNA. The labeled cDNAs were dissolved in 80 μL of hybridization solution [3 × 0.15M NaCI, 0.015M sodium citrate pH7.0 (SSC), 0.2% SDS, 5 × Denhardt's solution, and 25% formamide], followed by hybridization overnight at 42°C. Chips were then washed with washing buffer (0.2% SDS, 2 × SSC) at 42°C for 5 min, and then with 0.2 × SSC for 5 min at room temperature. Microarray slides were scanned with a LuxScan 10 K/A scanner (CapitalBio), and the spot intensities were measured by LuxScan 3.0 image analysis software (CapitalBio). Based on a LOWESS program, a space and intensity‐dependent normalization was employed. The intensity value of >1500 was defined as the standard for gene expression. Differentially expressed genes were selected by significant analysis of microarray (SAM) (multiclass, 3.0). Relative expression of ≥2.0 or ≤0.5 was considered as upregulation or downregulation, respectively. Gene ontology (GO) and pathway analysis were performed using Molecular Annotation System 3.0 (MAS, 3.0, CapitalBio).
PAPST1 immunohistochemistry
After deparaffinization and rehydration, sections were incubated in 0.3% H2O2, to quench the endogenous peroxidase activity. Antigen retrieval was carried out in citric acid buffer (pH 6.0) at 121°C/0.12 MPa for 20 min. Sections were then incubated with a polyclonal rabbit PAPST1 antibody (1:90; Abgent, San Diego, CA, USA) overnight at 4°C. After washing thrice with PBS (0.01 mol/L; pH 7.3), the sections were incubated with biotin‐labeled goat anti‐rabbit IgG for 1 h at 37°C. Sections were then washed three times, incubated with streptavidin‐biotin‐horseradish peroxidase complex at 37°C for 1 h, according to the instruction of the strept avidin‐biotin complex (rabbit IgG)‐peroxidase kit (Boster Biotechnology, Wuhan, China). The peroxidase activity was visualized by 3, 3′‐diaminobenzidine (DAB, ZhongShan Golden Bridge), and sections were counterstained with hematoxylin.
Construction of plasmids and luciferase assay
The full length of 3' Untranslated Regions (UTR) of human PAPST1 mRNA sequence (NM_178148.2) was amplified by PCR using genomic DNA extracted from HeLa cells. The primers including restriction sites XhoI and NotI for the cloning purpose were used. PCR product was cloned into pmiR‐RB‐REPORT™ Vector (Ruibo, Guangzhou, China, Supporting Information Figure S1B), located the downstream of Renilla luciferase gene, the resultant plasmid was termed pmiR‐RB‐REPORT™‐h‐PAPST1 wild type (WT). By using PCR mutagenesis, a conservative point mutation was introduced into the two putative miR‐22 binding sites at the same time (Figure 10B). PCR products were cloned into pmiR‐RB‐REPORT™ Vector (Ruibo) as described above, generating the plasmid containing mutations (pmiR‐RB‐REPORT™‐h‐PAPST1 MUT). Primer sequences are listed in the Table 2. Sequences in constructs were further confirmed by direct sequencing.
Figure 10.
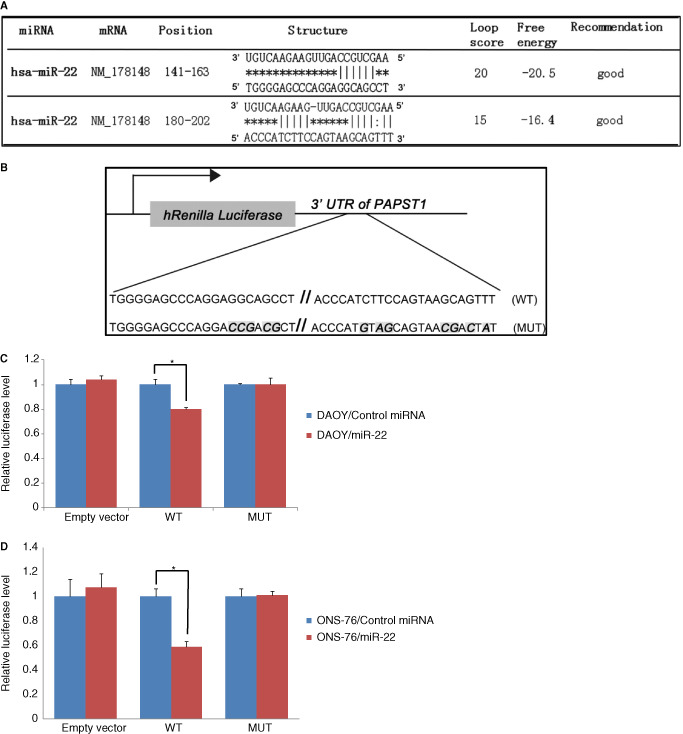
Summary of miR‐22 putative target binding sites in 3' Untranslated Regions (UTR) of PAPST 1, predicted by FindTar3 Online Prediction (A). Construction of the luciferase reporter containing the full‐length wild‐type (WT) 3' UTR or 3' UTR sequence with mutations at the two putative binding sites (MUT) of the PAPST 1 gene (B). Luciferase reporter assay confirmed that PAPST 1 is negatively regulated by the interaction between miR‐22 and complementary sequences in the 3'UTR of PAPST 1 in DAOY and ONS‐76 medulloblastoma cells (C,D).
Table 2.
PAPST1 primer sequences for luciferase report assay Abbreviations: WT = vector containing wild‐type 3' Untranslated Regions (UTR) of PAPST1(SLC35B2) mRNA; MUT = vector containing two mutant binding sites in 3'UTR of the PAPST1 mRNA
| Vector | Primer | Primer sequence (5'→3') | Sizes (bp) |
|---|---|---|---|
| WT | h‐ PAPST1‐F | CCGCTCGAGTGTGCCTGTTGAGTCTCCTGTGC | 32 |
| WT | h‐ PAPST1‐R | AGTTTAGCGGCCGCCAGTCAACCAAAACACAGGACCAAG | 39 |
| MUT | h‐ PAPST1‐Mut1‐F | GAGCCCAGGACCGACGCTTCCCTTTTG | 27 |
| MUT | h‐ PAPST1‐Mut1‐R | CAAAAGGGAAGCGTCGGTCCTGGGCTC | 27 |
| MUT | h‐ PAPST1‐Mut2‐F | AAGTCACCCATGTAGCAGTAACGACTATATTCTGAGCC | 38 |
| MUT | h‐ PAPST1‐Mut2‐R | GGCTCAGAATATAGTCGTTACTGCTACATGGGTGACTT | 38 |
ONS‐76 and DAOY cells were seeded in 96‐well plates with 2 × 10⁴/well, and cultured to 70% confluence one day after the plating. Cells were transiently cotransfected with hsa‐miR‐22‐3p mimic (Ruibo) and the plasmids constructed above, using Lipofectamine 2000 (Invitrogen) according to the manufacturer's instructions. Transfection efficiencies were determined by GFP reporter plasmid. The constructed luciferase reporter plasmids were cotransfected with miR‐22 mimic or control miRNA into ONS‐76 and DAOY cells. Luciferase activity was measured at 36 h after the transfection using the Dual‐Glo Luciferase assay system (Promega, Madison, WI, USA). Firefly and Renilla luciferase luminescence signals were both quantified by luminometer (Glomax, Promega). Changes in expression of Renilla luciferase (target) were calculated relative to firefly luciferase (internal control).
Statistical analysis
Significance of differences between the compared groups was determined by two‐tailed t‐tests using Excel (Microsoft Excel, Microsoft Corp, Washington, DC, USA). With a P‐value of less than 0.05 considered to be statistically significant.
Results
MiR‐22 expression is downregulated in medulloblastomas
Quantitative RT‐PCR revealed downregulation of miR‐22 expression (ie, <20% compared with normal human cerebellum) in 19 out of 27 (70%) medulloblastomas, all three medulloblastoma cell lines (Figure 1A,B).
Figure 1.
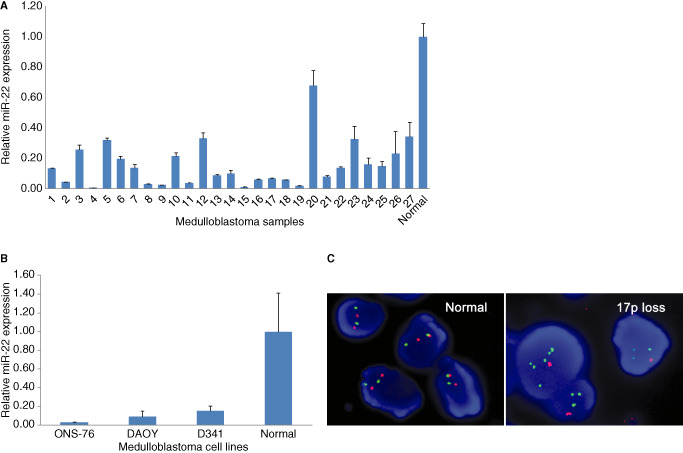
Relative miR‐22 expression in medulloblastomas (A) and D341, DAOY, ONS‐76 medulloblastoma cells (B) determined by quantitative RT‐PCR. Values represent the fold of miR‐22 mRNA relative to normal cerebellum set at 1 (n = 3, ± SD). Note that most (19 out of 27; 70%) medulloblastomas, all medulloblastoma cell lines analyzed show lower miR‐22 expression (<20%) compared with normal cerebellum (P < 0.05). Representative fluorescent in situ hybridization (C). The left panel shows normal cells displaying a balanced 17p (orange) and RARA (green) signal. The right panel shows the loss of 17p signal in a medulloblastomas (C). Normal, normal cerebellum.
LOH at 17p13.3
FISH analysis revealed 17p13.3 loss in five out of 27 (19%) medulloblastomas analyzed (Figure 1C).
Role of miR‐22 expression in cell proliferation of medulloblastoma cells
Transfection efficiencies, estimated by the fraction of GFP‐positive cells at 72 h after transfection, were >80% (Figure 2A). MiR‐22 forced expression and miR‐22 knockdown in DAOY and ONS‐76 medulloblastoma cells by lentivirus vector led to stable miR‐22 upregulation or downregulation, respectively. Quantitative RT‐PCR revealed miR‐22 upregulation in DAOY/miR‐22 (3.5‐fold) and ONS‐76/miR‐22 cells (40‐fold), and downregulation in DAOY/miR‐22‐inhibitor cells (67%) and ONS‐76/miR‐22‐inhibitor cells (37%), compared with the respective negative controls. Empty vectors had no influence on the miR‐22 expression compared with untreated cells (Figure 2B,C).
Figure 2.
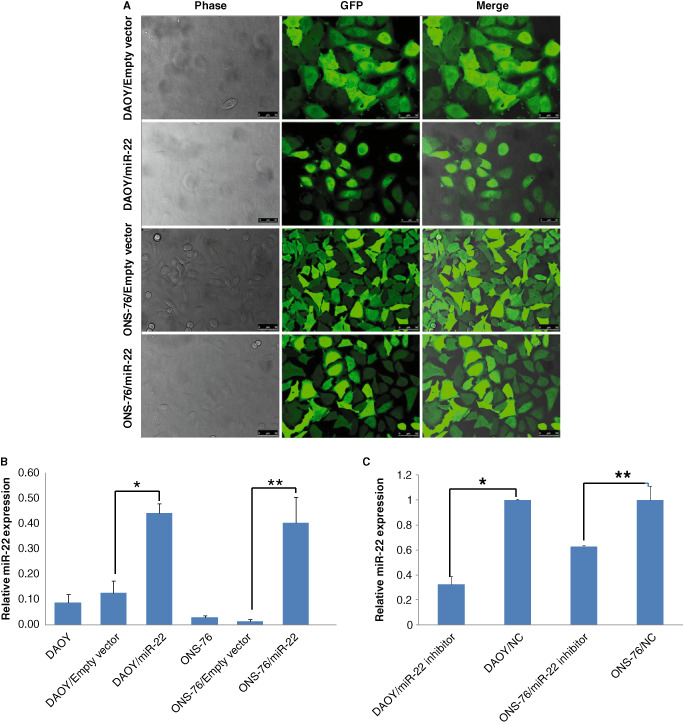
Laser scanning confocal microscope analysis 3 days after miR‐22 transfection with lentivirus, indicating high efficiencies and stable miR‐22 expression in DAOY and ONS‐76 medulloblastoma cells (A). The forced expression (B) and knockdown (C) of miR‐22 were confirmed by quantitative RT‐PCR (n = 3, ± SD, *P < 0.05, **P < 0.01). NC, negative control.
In the CCK‐8 assay, stable miR‐22 overexpression led to a reduction in viable DAOY and ONS‐76 cells, compared with the respective control cells transfected with empty vector, at 24 h, 48 h, 72 h, 96 h or 120 h time points. Cell proliferation was most significantly inhibited in DAOY/miR‐22 cells at 72 h (45%) (Figure 3A), and in ONS‐76/miR‐22 cells at 48 h (30%) after the transfection (Figure 3B). In contrast, knockdown of miR‐22 increased proliferation in both DAOY (7% at 48 h) and ONS‐76 (11% at 48 h) medulloblastoma cells (Figure 3C,D).
Figure 3.
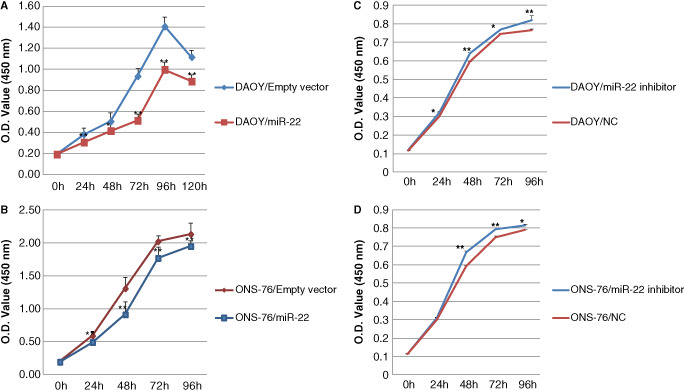
CCK‐8 assay showing that miR‐22 expression inhibits proliferation of DAOY cells (A), the effects was maximum at 72 h (n = 6, ± SD, *P < 0.05, **P < 0.01) and ONS‐76 cells (B), the effects was maximum at 48 h (n = 6, ± SD; **P < 0.01) compared with controls transfected with empty vector. The knockdown expression increased the proliferation of DAOY cells (C, n = 3, ± SD, *P < 0.05, **P < 0.01) and ONS‐76 cells (D, n = 3, ± SD, *P < 0.05, **P < 0.01).
MiR‐22 overexpression induces apoptosis in medulloblastoma cells
Flow cytometry was carried out in DAOY and ONS‐76 cells transfected with miR‐22 and their respective controls. MiR‐22 overexpression significantly increased apoptosis in DAOY cells by 120% (35.9 ± 3.3% vs. 16.3 ± 2.2%; P < 0.0001; Figure 4A,B) and in ONS‐76 cells by 12% (31.4 ± 1.8% vs. 28.0 ± 1.9%; P < 0.02; Figure 4A,C), compared with their respective empty vector groups. Western blot analysis revealed that miR‐22 significantly upregulated cleaved caspase‐3 (17/19 KDa‐active forms) in DAOY cells (57% increase) and in ONS‐76 cells (37% increase) (Figure 5).
Figure 4.
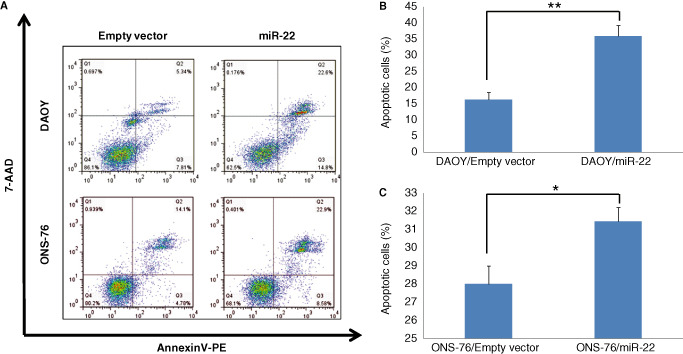
Flow cytometric assay stained with AnnexinV‐PE/7‐AAD, showing increased fractions of apoptosis in DAOY and ONS‐76 cells transfected with miR‐22 (A). Mean fractions of apoptosis in DAOY (B) and ONS‐76 (C) cells. The values represent apoptotic cells (n = 5, ± SD, **P < 0.0001 for DAOY cells; *P < 0.02 for ONS‐76 cells).
Figure 5.
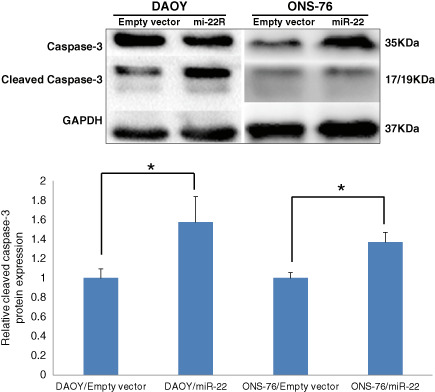
Western blot shows induction of expression of cleaved caspase‐3 in DAOY and ONS‐76 cells transfected with miR‐22 (upper panel). Quantification of Western blot data (n = 4, ± SD), showing that significantly higher cleaved caspase‐3 expression in DAOY and ONS‐76 cells transfected with miR‐22 (*P < 0.05) (lower panel).
MiR‐22 overexpression inhibits tumor growth and induces apoptosis i n vivo
Mean size of tumors originating from DAOY/miR‐22 cells was 14.4% of those from DAOY/empty vector control cells, 8 weeks after the inoculation of respective tumor cells to nude mice (P < 0.04; Figure 6A,B).
Figure 6.
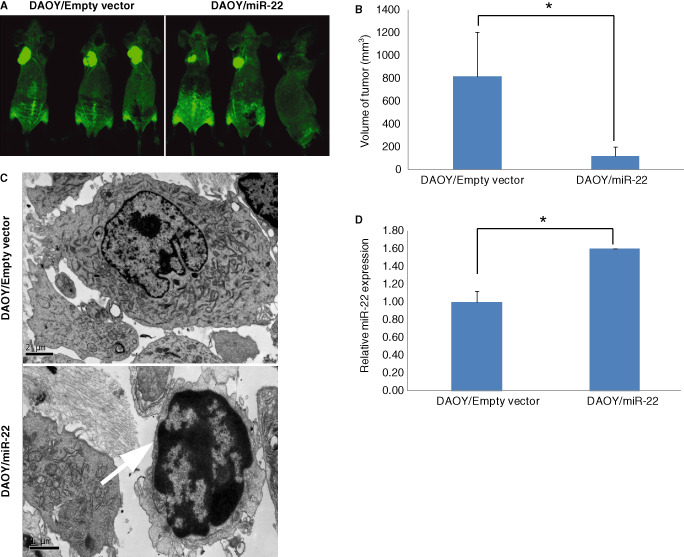
Representative images of nude mice 8 weeks after inoculation of DAOY cells transfected with miR‐22, showing that miR‐22‐expressed tumors grow more slowly than those with empty vectors (A). Quantification of volume of tumors in nude mice by caliper measurements, indicating that tumors from DAOY cells transfected with miR‐22 are significantly smaller than those transfected with empty vector. The bar represent the average volume of the tumor in each group (n = 5, ± SD; *P < 0.04) (B). Transmission electron microscopy reveals apoptotic DAOY cells (indicated by arrow) transfected with miR‐22. The condensed chromatin block is located in the middle of the nucleus and abutted on the nucleus membrane. The cell membrane and mitochondria are intact (C). Quantitative RT‐PCR showing that tumors originating from miR‐22‐expressing DAOY medulloblastoma cells in nude mice have significantly higher miR‐22 expression (n = 3, ± SD; *P < 0.04) (D).
Under transmission electron microscopy, typical apoptotic cells were observed in DAOY/miR‐22 tumors in nude mice. These apoptotic cells showed condensed chromatin block located in the middle of the nucleus and abutted on the nucleus membrane. The cell membrane and mitochondria were intact. In contrast, apoptosis was rarely detectable in tumors originated from control DAOY cells transfected with the empty vector (Figure 6C). Quantitative RT‐PCR confirmed that miR‐22 was overexpressed (1.57‐folds) in DAOY/miR‐22 tumors in nude mice (Figure 6D).
PAPST1 expression in medulloblastomas
Microarray analysis showed upregulation and downregulation of RNA expression in many genes in DAOY and ONS‐76 cells transfected with miR‐22, compared with their respective controls. For further detailed analyses, we selected 3'‐phosphoadenosine 5'‐phosphosulfate transporters 1 (PAPST1, also called SLC35B2), which showed the most significant (10‐folds) downregulation in DAOY cells by miR‐22 overexpression.
Quantitative RT‐PCR revealed >2‐folds upregulation in 18 out of 27 (67%) medulloblastomas tissues (Figure 7A) and in DAOY, ONS‐76 medulloblastoma cells (Figure 7B), compared with normal human cerebellum.
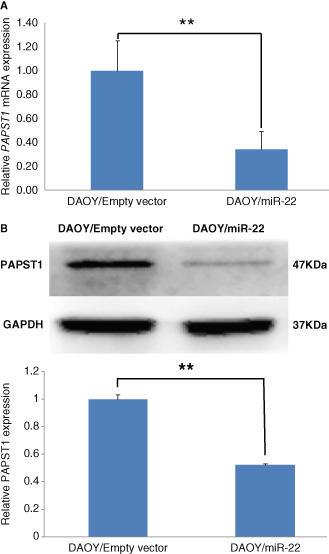
Figure 7.
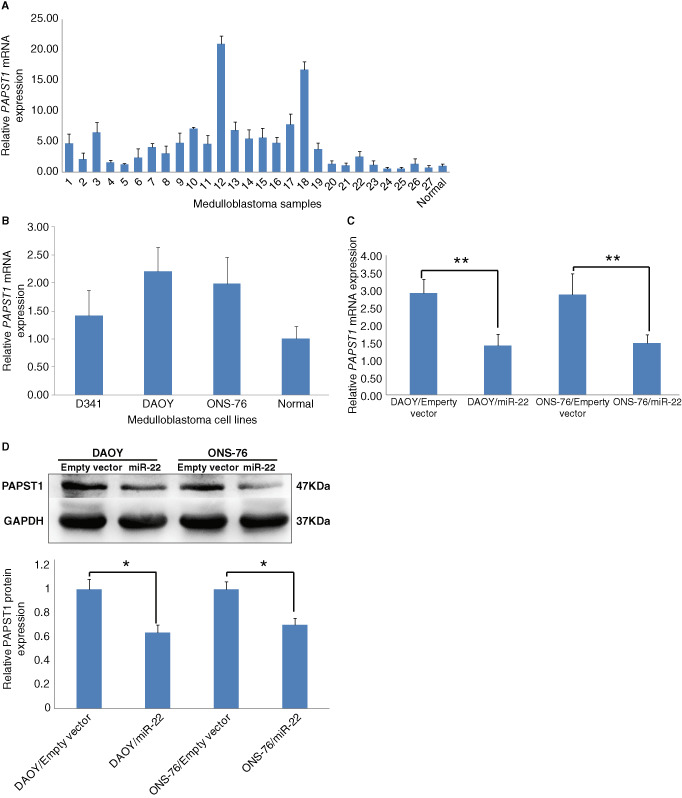
Quantitative RT‐PCR, showing PAPST1 overexpression in medulloblastomas (A) and D341, DAOY, ONS‐76 medulloblastoma cells (B). Forced expression of miR‐22 significantly reduces PAPST1 mRNA expression in DAOY and ONS‐76 medulloblastoma cells (n = 3, ± SD; **P < 0.01) (C). Western blot showing PAPST1 downregulation in DAOY and ONS‐76 medulloblastoma cells (n = 3, ± SD; *P < 0.05) (D).
Forced miR‐22 expression significantly reduced PAPST1 expression in DAOY and ONS‐76 medulloblastoma cells (Figure 7C). Western blot showed that PAPST1 protein was downregulated in DAOY and ONS‐76 cells with miR‐22 overexpression (Figure 7D).
Tumors originated from miR‐22 overexpressing DAOY cells in nude mice showed significantly higher miR‐22 expression (Figure 6D) and significantly lower PAPST1 mRNA expression (Figure 8A) than tumors derived from control DAOY cells. Western blot analysis confirmed the downregulation of PAPST1 protein expression (Figure 8B).
Figure 8.
Quantitative RT‐PCR showing that tumors originating from miR‐22‐expressing DAOY medulloblastoma cells in nude mice show significantly lower PAPST1 mRNA expression (n = 3, ± SD; **P < 0.01) (A) than those originating from control DAOY cells. Western blot analysis showed similar observations at the protein level (n = 3, ± SD; **P < 0.01) (B).
PAPST1 immunohistochemistry
Immunohistochemistry showed cytoplasmic PAPST1 expression in neoplastic cells in six medulloblastomas analyzed. No immunoreactivity was detected in a normal cerebellum analyzed and negative controls without primary antibody (Figure 9).
Figure 9.
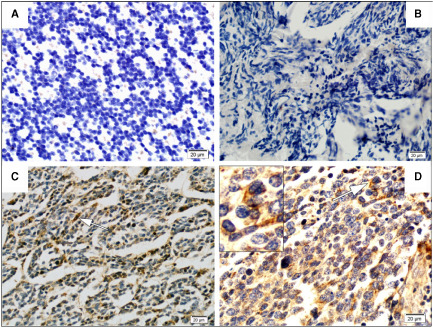
PAPST 1 immunohistochemistry. No immunoreactivity was observed in normal cerebellum (A) or in IgG negative control in medulloblastomas (B). Cytoplasmic PAPST1 expression in medullobalstoma cells (C,D).
PAPST1 is a novel target of miR‐22
To determine whether PAPST1 is a target of miR‐22, we analyzed sequences using FindTar3 Online Prediction (http://bio.sz.tsinghua.edu.cn/), and identified two potential binding sites (Figure 10A). Luciferase reporter assay using the constructed plasmid confirmed that PAPST1 was negatively regulated by interaction between miR‐22 and complementary sequences in the 3'UTR of PAPST1 mRNA in DAOY and ONS‐76 medulloblastoma cells (Figure 10B–D).
Knockdown of PAPST1 inhibits proliferation of medulloblastoma cells
Transfection of PAPST1‐shRNA lentivirus resulted in downregulation of PAPST1 mRNA in DAOY (46%) and ONS‐76 (46%) medulloblastoma cells (Figure 11A), and downregulation of PAPST1 protein in DAOY (71%) and ONS‐76 (30%) (Figure 11B).
Figure 11.
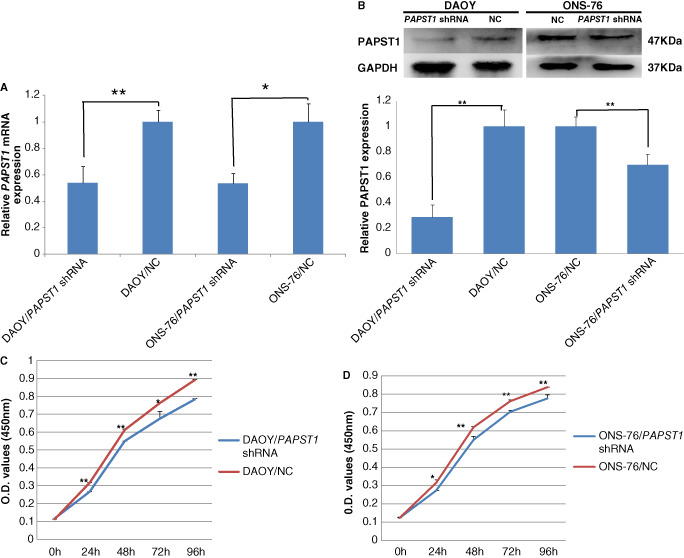
Lentivirus shRNA‐mediated knockdown of PAPST 1. The knockdown expression by miR‐22 was determined by quantitative RT‐PCR in DAOY and ONS‐76 medulloblastoma cells (A) (n = 3, ± SD, *P < 0.05, **P < 0.01). Reduced expression was also detected at the protein level by Western blot (B) (n = 3, ± SD; **P < 0.01). In the CCK‐8 assay, lowered expression of PAPST1 led to decreased cell proliferation in DAOY (C) and ONS‐76 (D) medulloblastoma cells (n = 3, ± SD, *P < 0.05, **P < 0.01). NC, negative control shRNA.
CCK‐8 assay showed that PAPST1 knockdown significantly inhibited proliferation of DAOY and ONS‐76 cells compared with the respective negative control cells. Cell proliferation was most significantly inhibited in both DAOY/PAPST1‐shRNA cells (16%) (Figure 11C) and ONS‐76/PAPST1‐shRNA cells (13%) (Figure 11D), at 24 h after the transfection.
Discussion
MiR‐22 reduced proliferation of breast cancer cells by targeting ESR1 47, reduced angiogenesis in colon cancer by downregulating HIF‐1α and vascular endothelial growth factor expression 49, and induced pRb pathway through targeting of CDK6 and SIRT1 in breast cancer cells 48. MiR‐22 induced p53‐dependent apoptosis by repressing of p21 in colon cancer cells 41. Upregulated miR‐22 suppressed expression of its target SP1 transcription factor and estrogen receptor 1 in pancreatic cancer cells 40. These findings suggest that miR‐22 play important roles in carcinogenesis 19, 46, 48.
We here provide evidence that miR‐22 is frequently downregulated in medulloblastomas, and that forced miR‐22 expression reduced cell proliferation and increased apoptosis in DAOY and ONS‐76 medulloblastoma cells. Conversely, knockdown of miR‐22 increased proliferation of medulloblastomas cells. Reduced miR‐22 expression may confer a proliferative advantage to tumor cells, which may contribute to the pathogenesis of medulloblastomas. Molecular mechanisms of miR‐22 reduced expression in medulloblastomas remains to be elucidated. This may be in part due to loss of one allele, as miR‐22 is located at 17p13.3 where LOH is frequent in medulloblastomas 25, 37. In the present study, we showed that a fraction of medulloblastomas (five out of 27; 19%) demonstrated loss of 17p13.3. Alternatively, epigenetic regulation may affect miR‐22 expression. MiR‐199b‐5p was shown to be downregulated in several medulloblastoma cell lines and in tumors by epigenetic methylation of a CpG island upstream of the miR‐199b‐5p promoter 1. In acute lymphoblastic leukemia, the transcriptional start point of the miR‐22 histone modification independent of CpG island promoter DNA methylation may be a novel epigenetic mechanism for miR‐22 silencing 20. Our results also indicated that there was no significant changes of miR‐22 after treating the DAOY and ONS‐76 cells with the 5‐Azacytidine (data not shown).
Target genes of miR‐22 so far reported include HDAC4, ERα, CDK6, SIRT1, SP1 P21, HIF‐1α, MYCBP, MAX, PTEN, PPARA, BMP7, BDNF, HTR2C, MAOA and RGS2 46. To further identify miR‐22 target genes, we carried out microarray analysis in medulloblastoma cells with and without miR‐22 overexpression. Forced expression of miR‐22 significantly changed expression profiles, with the PAPST1 located at 6p12.1‐p11.2 (also known as SLC35B2) being the most significantly (10‐folds) downregulated gene in DAOY cells. We showed that PAPST1 was indeed frequently upregulated in the majority (18 out of 27; 67%) of medulloblastoma samples and in two of three medulloblastoma cells. We also demonstrated that medulloblastoma cells with forced expression of miR‐22 led to PAPST1 downregulation at mRNA and protein levels, which were also detected in tumors from the nude mice which contained the overexpressed miR‐22. Immunohistochemistry also confirmed cytoplasmic PAPST1 expression in medulloblastomas cells, but not in normal cells in the cerebellum. Furthermore, luciferase report assay demonstrated that PAPST1 is a novel direct target of miR‐22 in medulloblastoma cells. In medulloblastoma tissues, no one‐to‐one correlation between miR‐22 levels and PAPST1 expression was found, which maybe the result of the complex regulation of gene expression in vivo. Gene expression is regulated by various miRNAs and transcription factors, there is also a regulatory relationship between miRNAs and transcription factors 14, 45.
Proteoglycans with highly sulfated glycosaminoglycan (GAG) chains involve in multiple oncogenic pathways in tumor cells as well as regulate tumor–microenvironment interactions 43. The universal sulfate donor 3‐phospho‐adenosine‐5‐phosphosulfate (PAPS) is essential for the synthesis and the sulfation of proteoglycans in the Golgi 33, PAPST1 is expressed in Golgi membrane, and transfers PAPS from the cytoplasm into the Golgi 16. It has been reported that PAPST1 and PAPST2 contribute to the maintenance and differentiation of mouse embryonic stem cells 36. Overexpression of PAPST1 reduced radiation‐induced apoptosis in Burkitt's lymphoma cells, and promoted the phosphorylation of p38 MAPK and Akt in irradiated Namalwa cells 26. PAPST1 was overexpressed in DLD‐1 colorectal carcinoma cells, and silencing PAPST1 led to downregulation of fibroblast growth factor signaling and decreased cell proliferation 15. Above all, PAPST1 is a very important molecule which involved in the carcinogenesis of solid tumors. In the present study, knockdown of PAPST1 led to inhibited cell proliferation in DAOY and ONS‐76 medullobalstoma cells, suggesting that PAPST1 plays a role in the pathogenesis of medulloblastomas, and PAPST1 is negatively regulated in vitro and in vivo by miR‐22.
In summary, downregulation of miR‐22 is frequent in medulloblastomas. The expression level of miR‐22 in medulloblastoma cells has a negative correlation with the cell proliferation in vitro, the forced expression of miR‐22 increases apoptosis and decreases tumor growth in vitro and in vivo. PAPST1 is a novel target of miR‐22, and is frequently overexpressed in medulloblastomas, the knockdown expression of PAPST1 decreases the cell proliferation in medulloblastoma cell lines. Our data provides evidence that miR‐22 plays a tumor suppressive role in medulloblastomas, and sheds a light on the importance of PAPST1 in the pathogenesis of medulloblastomas.
Supporting information
Figure S1. The structure of the pLKD.CMV.GFP.U6.shRNA vector (A), the synthesized DNA oligo sequences of pri‐miR‐22, miR‐22‐inhibitor, PAPST1‐shRNA were inserted into the AgeI‐EcoRI site downstream of U6 promoter. The structure of the pmiR‐RB‐REPORT TM Vector (B), the PCR product was cloned into the downstream of Renilla luciferase gene.
Figure S2. The amplification standard curve for qPCR, (miR‐22, RNAU6B, upper panel; PAPST1, β‐actin, lower panel) both the target and the internal control genes have highly similar efficiencies.
Acknowledgments
We thank Prof. Jingping LIU, Xiangya Hospital, Central South University, Changsha for providing some tumor samples and Professor Jian‐Ping XU, Mrs. Ya‐Li Wang and Miss Zhen‐le ZANG for technical assistance. This work was supported by the National Natural Science Foundation of China (NSFC, 30973075, 81272783), Postdoctoral Return Grant (CRA No. FEL/10/01) for Dr. LV from the International Agency for Research on Cancer (IARC), Lyon, France and the Grant from Third Military Medical University (2011XHG06).
References
- 1. Andolfo I, Liguori L, De Antonellis P, Cusanelli E, Marinaro F, Pistollato F et al (2012) The micro‐RNA 199b‐5p regulatory circuit involves Hes1, CD15, and epigenetic modifications in medulloblastoma. Neuro Oncol 14:596–612. [DOI] [PMC free article] [PubMed] [Google Scholar]
- 2. Bai AH, Milde T, Remke M, Rolli CG, Hielscher T, Cho YJ et al (2012) MicroRNA‐182 promotes leptomeningeal spread of non‐sonic hedgehog‐medulloblastoma. Acta Neuropathol 123:529–538. [DOI] [PubMed] [Google Scholar]
- 3. Bartel DP (2009) MicroRNAs: target recognition and regulatory functions. Cell 136:215–233. [DOI] [PMC free article] [PubMed] [Google Scholar]
- 4. Berenguer J, Herrera A, Vuolo L, Torroba B, Llorens F, Sumoy L, Pons S (2013) MicroRNA 22 regulates cell cycle length in cerebellar granular neuron precursors. Mol Cell Biol 33:2706–2717. [DOI] [PMC free article] [PubMed] [Google Scholar]
- 5. Bonzon C, Fan H (1999) Moloney murine leukemia virus‐induced preleukemic thymic atrophy and enhanced thymocyte apoptosis correlate with disease pathogenicity. J Virol 73:2434–2441. [DOI] [PMC free article] [PubMed] [Google Scholar]
- 6. Calin GA, Sevignani C, Dumitru CD, Hyslop T, Noch E, Yendamuri S et al (2004) Human microRNA genes are frequently located at fragile sites and genomic regions involved in cancers. Proc Natl Acad Sci USA 101:2999–3004. [DOI] [PMC free article] [PubMed] [Google Scholar]
- 7. de Bont JM, Packer RJ, Michiels EM, den Boer ML, Pieters R (2008) Biological background of pediatric medulloblastoma and ependymoma: a review from a translational research perspective. Neuro Oncol 10:1040–1060. [DOI] [PMC free article] [PubMed] [Google Scholar]
- 8. Ferretti E, De Smaele E, Miele E, Laneve P, Po A, Pelloni M et al (2008) Concerted microRNA control of Hedgehog signalling in cerebellar neuronal progenitor and tumour cells. EMBO J 27:2616–2627. [DOI] [PMC free article] [PubMed] [Google Scholar]
- 9. Ferretti E, De Smaele E, Po A, Di Marcotullio L, Tosi E, Espinola MS et al (2009) MicroRNA profiling in human medulloblastoma. Int J Cancer 124:568–577. [DOI] [PubMed] [Google Scholar]
- 10. Franchina T, Amodeo V, Bronte G, Savio G, Ricciardi GR, Picciotto M et al (2014) Circulating miR‐22, miR‐24 and miR‐34a as novel predictive biomarkers to pemetrexed‐based chemotherapy in advanced non‐small cell lung cancer. J Cell Physiol 229:97–99. [DOI] [PubMed] [Google Scholar]
- 11. Garzon R, Fabbri M, Cimmino A, Calin GA, Croce CM (2006) MicroRNA expression and function in cancer. Trends Mol Med 12:580–587. [DOI] [PubMed] [Google Scholar]
- 12. Gibson P, Tong Y, Robinson G, Thompson MC, Currle DS, Eden C et al (2010) Subtypes of medulloblastoma have distinct developmental origins. Nature 468:1095–1099. [DOI] [PMC free article] [PubMed] [Google Scholar]
- 13. Gilbertson RJ (2004) Medulloblastoma: signalling a change in treatment. Lancet Oncol 5:209–218. [DOI] [PubMed] [Google Scholar]
- 14. Hobert O (2008) Gene regulation by transcription factors and microRNAs. Science 319:1785–1786. [DOI] [PubMed] [Google Scholar]
- 15. Kamiyama S, Ichimiya T, Ikehara Y, Takase T, Fujimoto I, Suda T et al (2011) Expression and the role of 3'‐phosphoadenosine 5'‐phosphosulfate transporters in human colorectal carcinoma. Glycobiology 21:235–246. [DOI] [PubMed] [Google Scholar]
- 16. Kamiyama S, Suda T, Ueda R, Suzuki M, Okubo R, Kikuchi N et al (2003) Molecular cloning and identification of 3'‐phosphoadenosine 5'‐phosphosulfate transporter. J Biol Chem 278:25958–25963. [DOI] [PubMed] [Google Scholar]
- 17. Konishi H, Sugiyama M, Mizuno K, Saito H, Yatabe Y, Takahashi T, Osada H (2003) Detailed characterization of a homozygously deleted region corresponding to a candidate tumor suppressor locus at distal 17p13.3 in human lung cancer. Oncogene 22:1892–1905. [DOI] [PubMed] [Google Scholar]
- 18. Kool M, Korshunov A, Remke M, Jones DT, Schlanstein M, Northcott PA et al (2012) Molecular subgroups of medulloblastoma: an international meta‐analysis of transcriptome, genetic aberrations, and clinical data of WNT, SHH, group 3, and group 4 medulloblastomas. Acta Neuropathol 123:473–484. [DOI] [PMC free article] [PubMed] [Google Scholar]
- 19. Li J, Liang S, Yu H, Zhang J, Ma D, Lu X (2010) An inhibitory effect of miR‐22 on cell migration and invasion in ovarian cancer. Gynecol Oncol 119:543–548. [DOI] [PubMed] [Google Scholar]
- 20. Li X, Liu J, Zhou R, Huang S, Chen XM (2010) Gene silencing of MIR22 in acute lymphoblastic leukaemia involves histone modifications independent of promoter DNA methylation. Br J Haematol 148:69–79. [DOI] [PubMed] [Google Scholar]
- 21. Livak KJ, Schmittgen TD (2001) Analysis of relative gene expression data using real‐time quantitative PCR and the 2(‐Delta Delta C(T)) method. Methods 25:402–408. [DOI] [PubMed] [Google Scholar]
- 22. Louis DN, Ohgaki H, Wiestler OD, Cavenee WK (2007) WHO classification of tumours of the central nervous system. In: World Health Organization classification of tumours, 4th edn. Giangaspero F, Eberhart CG, Haapasalo H, Pietsch T, Wiestler OD, Ellison DW (eds), pp. 132–140. International Agency for Research on Cancer: Lyon. [Google Scholar]
- 23. Lv SQ, Kim YH, Giulio F, Shalaby T, Nobusawa S, Yang H et al (2012) Genetic alterations in microRNAs in medulloblastomas. Brain Pathol 22:230–239. [DOI] [PMC free article] [PubMed] [Google Scholar]
- 24. Massimino M, Giangaspero F, Garrè ML, Gandola L, Poggi G, Biassoni V et al (2011) Childhood medulloblastoma. Crit Rev Oncol Hematol 79:65–83. [DOI] [PubMed] [Google Scholar]
- 25. McDonald JD, Daneshvar L, Willert JR, Matsumura K, Waldman F, Cogen PH (1994) Physical mapping of chromosome 17p13.3 in the region of a putative tumor suppressor gene important in medulloblastoma. Genomics 23:229–232. [DOI] [PubMed] [Google Scholar]
- 26. Nakayama F, Umeda S, Ichimiya T, Kamiyama S, Hazawa M, Yasuda T et al (2013) Sulfation of keratan sulfate proteoglycan reduces radiation‐induced apoptosis in human Burkitt's lymphoma cell lines. FEBS Lett 587:231–237. [DOI] [PubMed] [Google Scholar]
- 27. Nishimura M, Suzuki S, Satoh T, Naito S (2009) Tissue‐specific mRNA expression profiles of human solute carrier 35 transporters. Drug Metab Pharmacokinet 24:91–99. [DOI] [PubMed] [Google Scholar]
- 28. Pfister S, Remke M, Benner A, Mendrzyk F, Toedt G, Felsberg J et al (2009) Outcome prediction in pediatric medulloblastoma based on DNA copy‐number aberrations of chromosomes 6q and 17q and the MYC and MYCN loci. J Clin Oncol 27:1627–1636. [DOI] [PubMed] [Google Scholar]
- 29. Pfister S, Remke M, Toedt G, Werft W, Benner A, Mendrzyk F et al (2007) Supratentorial primitive neuroectodermal tumors of the central nervous system frequently harbor deletions of the CDKN2A locus and other genomic aberrations distinct from medulloblastomas. Genes Chromosomes Cancer 46:839–851. [DOI] [PubMed] [Google Scholar]
- 30. Phillips NJ, Zeigler MR, Deaven LL (1996) A cDNA from the ovarian cancer critical region of deletion on chromosome 17p13.3. Cancer Lett 102:85–90. [DOI] [PubMed] [Google Scholar]
- 31. Pierson J, Hostager B, Fan R, Vibhakar R (2008) Regulation of cyclin dependent kinase 6 by microRNA 124 in medulloblastoma. J Neurooncol 90:1–7. [DOI] [PubMed] [Google Scholar]
- 32. Plisiecka‐Hałasa J, Dansonka‐Mieszkowska A, Kraszewska E, Dańska‐Bidzińska A, Kupryjańczyk J (2008) Loss of heterozygosity, microsatellite instability and TP53 gene status in ovarian carcinomas. Anticancer Res 28:989–996. [PubMed] [Google Scholar]
- 33. Prydz K, Dalen KT (2000) Synthesis and sorting of proteoglycans. J Cell Sci 113(Pt 2):193–205. [DOI] [PubMed] [Google Scholar]
- 34. Ray A, Ho M, Ma J, Parkes RK, Mainprize TG, Ueda S et al (2004) A clinicobiological model predicting survival in medulloblastoma. Clin Cancer Res 10:7613–7620. [DOI] [PubMed] [Google Scholar]
- 35. Roncuzzi L, Brognara I, Baiocchi D, Amadori D, Gasperi‐Campani A (2005) Loss of heterozygosity at 17p13.3‐ter, distal to TP53, correlates with negative hormonal phenotype in sporadic breast cancer. Oncol Rep 14:471–474. [PubMed] [Google Scholar]
- 36. Sasaki N, Hirano T, Ichimiya T, Wakao M, Hirano K, Kinoshita‐Toyoda A et al (2009) The 3'‐phosphoadenosine 5'‐phosphosulfate transporters, PAPST1 and 2, contribute to the maintenance and differentiation of mouse embryonic stem cells. PLoS One 4:e8262. [DOI] [PMC free article] [PubMed] [Google Scholar]
- 37. Scheurlen WG, Krauss J, Kühl J (1995) No preferential loss of one parental allele of chromosome 17p13.3 in childhood medulloblastoma. Int J Cancer 63:372–374. [DOI] [PubMed] [Google Scholar]
- 38. Spiller SE, Logsdon NJ, Deckard LA, Sontheimer H (2011) Inhibition of nuclear factor kappa‐B signaling reduces growth in medulloblastoma in vivo. BMC Cancer 11:136. [DOI] [PMC free article] [PubMed] [Google Scholar]
- 39. Spina R, Filocamo G, Iaccino E, Scicchitano S, Lupia M, Chiarella E et al (2013) Critical role of zinc finger protein 521 in the control of growth, clonogenicity and tumorigenic potential of medulloblastoma cells. Oncotarget 4:1280–1292. [DOI] [PMC free article] [PubMed] [Google Scholar]
- 40. Sun M, Estrov Z, Ji Y, Coombes KR, Harris DH, Kurzrock R (2008) Curcumin (diferuloylmethane) alters the expression profiles of microRNAs in human pancreatic cancer cells. Mol Cancer Ther 7:464–473. [DOI] [PubMed] [Google Scholar]
- 41. Tsuchiya N, Izumiya M, Ogata‐Kawata H, Okamoto K, Fujiwara Y, Nakai M et al (2011) Tumor suppressor miR‐22 determines p53‐dependent cellular fate through post‐transcriptional regulation of p21. Cancer Res 71:4628–4639. [DOI] [PMC free article] [PubMed] [Google Scholar]
- 42. Vidal DO, Marques MM, Lopes LF, Reis RM (2013) The role of microRNAs in medulloblastoma. Pediatr Hematol Oncol 30:367–378. [DOI] [PubMed] [Google Scholar]
- 43. Wade A, Robinson AE, Engler JR, Petritsch C, James CD, Phillips JJ (2013) Proteoglycans and their roles in brain cancer. FEBS J 280:2399–2417. [DOI] [PMC free article] [PubMed] [Google Scholar]
- 44. Weeraratne SD, Amani V, Teider N, Pierre‐Francois J, Winter D, Kye MJ et al (2012) Pleiotropic effects of miR‐183 ∼ 96 ∼ 182 converge to regulate cell survival, proliferation and migration in medulloblastoma. Acta Neuropathol 123:539–552. [DOI] [PMC free article] [PubMed] [Google Scholar]
- 45. Woods K, Thomson JM, Hammond SM (2007) Direct regulation of an oncogenic micro‐RNA cluster by E2F transcription factors. J Biol Chem 282:2130–2134. [DOI] [PubMed] [Google Scholar]
- 46. Xiong J (2012) Emerging roles of microRNA‐22 in human disease and normal physiology. Curr Mol Med 12:247–258. [DOI] [PubMed] [Google Scholar]
- 47. Xiong J, Yu D, Wei N, Fu H, Cai T, Huang Y et al (2010) An estrogen receptor alpha suppressor, microRNA‐22, is downregulated in estrogen receptor alpha‐positive human breast cancer cell lines and clinical samples. FEBS J 277:1684–1694. [DOI] [PubMed] [Google Scholar]
- 48. Xu D, Takeshita F, Hino Y, Fukunaga S, Kudo Y, Tamaki A et al (2011) miR‐22 represses cancer progression by inducing cellular senescence. J Cell Biol 193:409–424. [DOI] [PMC free article] [PubMed] [Google Scholar]
- 49. Yamakuchi M, Yagi S, Ito T, Lowenstein CJ (2011) MicroRNA‐22 regulates hypoxia signaling in colon cancer cells. PLoS One 6:e20291. [DOI] [PMC free article] [PubMed] [Google Scholar]
- 50. Yokota N, Aruga J, Takai S, Yamada K, Hamazaki M, Iwase T et al (1996) Predominant expression of human zic in cerebellar granule cell lineage and medulloblastoma. Cancer Res 56:377–383. [PubMed] [Google Scholar]
- 51. Zhang G, Xia S, Tian H, Liu Z, Zhou T (2012) Clinical significance of miR‐22 expression in patients with colorectal cancer. Med Oncol 29:3108–3112. [DOI] [PubMed] [Google Scholar]
- 52. Zhang J, Yang Y, Yang T, Liu Y, Li A, Fu S et al (2010) microRNA‐22, downregulated in hepatocellular carcinoma and correlated with prognosis, suppresses cell proliferation and tumourigenicity. Br J Cancer 103:1215–1220. [DOI] [PMC free article] [PubMed] [Google Scholar]
- 53. Zhao X, He M, Wan D, Ye Y, He Y, Han L et al (2003) The minimum LOH region defined on chromosome 17p13.3 in human hepatocellular carcinoma with gene content analysis. Cancer Lett 190:221–232. [DOI] [PubMed] [Google Scholar]
Associated Data
This section collects any data citations, data availability statements, or supplementary materials included in this article.
Supplementary Materials
Figure S1. The structure of the pLKD.CMV.GFP.U6.shRNA vector (A), the synthesized DNA oligo sequences of pri‐miR‐22, miR‐22‐inhibitor, PAPST1‐shRNA were inserted into the AgeI‐EcoRI site downstream of U6 promoter. The structure of the pmiR‐RB‐REPORT TM Vector (B), the PCR product was cloned into the downstream of Renilla luciferase gene.
Figure S2. The amplification standard curve for qPCR, (miR‐22, RNAU6B, upper panel; PAPST1, β‐actin, lower panel) both the target and the internal control genes have highly similar efficiencies.