

Abstract
Mixed neuronal‐glial tumors are rare and challenging to subclassify. One recently recognized variant, papillary glioneuronal tumor (PGNT), is characterized by prominent pseudopapillary structures and glioneuronal elements. We identified a novel translocation, t(9;17)(q31;q24), as the sole karyotypic anomaly in two PGNTs. A fluorescence in situ hybridization (FISH)‐based positional cloning strategy revealed SLC44A1, a member of the choline transporter‐like protein family, and PRKCA, a protein kinase C family member of serine/threonine‐specific protein kinases, as the 9q31 and 17q24 breakpoint candidate genes, respectively. Reverse transcription‐polymerase chain reaction (RT‐PCR) analysis using a forward primer from SLC44A1 exon 5 and a reverse primer from PRKCA exon 10 confirmed the presence of a SLC44A1‐PRKCA fusion product in both tumors. Sequencing of each chimeric transcript uncovered an identical fusion cDNA junction occurring between SLC44A1 exon 15 and PRKCA exon 9. A dual‐color breakpoint‐spanning probe set custom‐designed for interphase cell recognition of the translocation event identified the fusion in a third PGNT. These results suggest that the t(9;17)(q31;q24) with the resultant novel fusion oncogene SLC44A1‐PRKCA is the defining molecular feature of PGNT that may be responsible for its pathogenesis. The FISH and RT‐PCR assays developed in this study can serve as valuable diagnostic adjuncts for this rare disease entity.
Keywords: cytogenetic, fusion gene, papillary glioneuronal tumor, PRKCA, SLC44A1
Introduction
Mixed glioneuronal tumors are uncommon lesions of the central nervous system and comprise a heterogeneous group of generally low‐grade tumors including papillary glioneuronal tumor (PGNT) 16, 23. PGNT, reported first by Kim and Suh in 1997, is characterized by pseudopapillary gliovascular structures associated with intervening neuronal cells ranging from neurocytes to ganglion cells 12. Histologically, the glial portion of PGNT represented primarily by astrocytes and oligodendrocyte‐like cells forms layers around hyalinized vessels and is immunoreactive for both glial fibrillary acidic protein (GFAP) and S100 protein, whereas the neuronal component of PGNT composed of neurocytes, ganglioid cells or ganglion cells is localized in the interpseudopapillary spaces and stains positively for synaptophysin, neuron‐specific enolase and Class III β‐tubulin 4, 27.
Historically, chromosomal translocations with corresponding fusion genes have been most widely recognized in hematopoietic and mesenchymal neoplasms. Recently, fusion genes involving BRAF and RAF1 have been demonstrated in pilocytic astrocytoma 5, 10, 11, 25. Identification of these translocations and the underlying gene fusions have contributed greatly to our understanding of the pathogenesis of these entities in addition to serving as valuable if not essential diagnostic aids and, in some instances, prognostic markers or therapeutic targets. In the current study, an identical chromosomal translocation, t(9;17)(q31;q24), was the sole karyotypic abnormality detected in two cases of PGNT by conventional cytogenetic analysis. Subsequently, a fluorescence in situ hybridization (FISH) approach intended to further narrow the involved breakpoint regions revealed SLC44A1 (solute carrier family 44, member 1) localized to 9q31 and PRKCA (protein kinase C alpha) to 17q24 as potential candidate genes. The presence of a SLC44A1‐PRKCA fusion oncogene as the molecular consequence of the observed 9;17 translocation was confirmed by sequence analysis of reverse transcription‐polymerase chain reaction (RT‐PCR) generated transcripts in two PGNTs and by FISH in a third PGNT. We propose that this primary translocation and associated fusion gene are of central pathogenic importance in PGNT.
Materials and Methods
Case histories
Case 1
A 14‐year‐old female presented with a 2‐month history of frontal headaches and 2 days of nausea, vomiting, back pain and blurry vision. Examination revealed decreased visual acuity, papilledema and faint superior left homonymous hemianopia. Magnetic resonance imaging (MRI) showed a cystic rim‐enhancing mass measuring 6.5 × 3.0 × 3.5 cm in the right temporal lobe. Image‐guided surgical resection of the neoplasm was accomplished. MRI evaluation 18 months post‐resection demonstrated no evidence of recurrent tumor.
Case 2
A previously healthy 7‐year‐old male presented with a 3‐month history of intermittent headaches, and recent onset of blurry vision, nausea and vomiting. Examination revealed decreased visual acuity and papilledema. MRI of the brain demonstrated a circumscribed, solid and cystic mass centered in the left parietal lobe with an irregularly enhancing nodule (3.2 × 3.3 × 3.7 cm) associated with a large cyst (7.1 × 4.8 × 5.7 cm). Gross total resection of the tumor was accomplished under image guidance. The patient did not receive radiation or chemotherapy. An MRI obtained 48 months post‐resection showed no evidence of recurrence.
Case 3
A 31‐year‐old male with headaches of increasing severity over a 4‐month period and an acute episode of nausea and vomiting was found on MRI to have a well‐circumscribed and partially cystic mass with contrast‐enhancing, solid nodular components in the left frontal lobe. A gross total resection was performed. A postoperative MRI at 3 months showed only surgical changes.
Cytogenetic analysis
Cytogenetic analysis was performed using standard culture and harvesting procedures. Briefly, fresh tissue was disaggregated mechanically and enzymatically and cultured in RPMI 1640 with 20% FBS for 5 to 8 days. Cells were exposed to colcemid (0.02 μg/mL) overnight followed by hypotonic treatment and fixation with methanol‐glacial acetic acid (3:1). Metaphase cells were banded with Giemsa trypsin, and the karyotypes were described according to the International System for Human Cytogenetic Nomenclature 2009 (ISCN, 2009) 24.
FISH
FISH studies were performed for fine‐mapping of the breakpoints using a series of bacterial artificial chromosome (BAC) clones covering the 9q31 and 17q24 regions. BAC clones were identified utilizing the NCBI Map Viewer (http://www.ncbi.nlm.nih.gov/mapview) and purchased from Invitrogen (Invitrogen, Carlsbad, CA, USA). Probes were directly labeled by nick translation with either Spectrum Green or Spectrum Orange‐deoxyuridine triphosphate (dUTP) utilizing the manufacturer's protocol (Abbott Molecular Inc., Des Plaines, IL, USA). Two‐color FISH studies were performed on cytologic touch preparations and formalin‐fixed, paraffin‐embedded (FFPE) tissue sections as previously described 21. Briefly, cytologic touch preparations and FFPE slides were first subjected to pretreatment and protease solution (Abbott Molecular, Inc.), followed by codenaturation of the cells and probes at 80°C for 5 minutes and incubation at 37°C overnight using the HYBrite™ denaturation/hybridization system. Post‐hybridization, the slides were washed in 0.4x saline‐sodium citrate (SSC)/0.3% nonyl phenoxypolyethoxylethanol (NP)‐40 at 72°C for 2 minutes, followed by 2x SSC/0.1% NP‐40 at room temperature for 2 minutes and then air‐dried in the dark and counterstained with 4;6‐diamidino‐2‐phenylindole (DAPI) II (Abbott Molecular, Inc.).
Hybridization signals were assessed in 200 interphase nuclei with strong and well‐delineated signals by two different individuals. An interphase cell specimen was interpreted as abnormal if the probe signal spanning the SLC44A1 gene locus was juxtaposed to the probe signal spanning the PRKCA gene locus, or if a split of the probe signals flanking each of these loci was detected in more than 20% of the cells evaluated (more than two standard deviations above the average false‐positive rate). Negative controls included normal peripheral blood lymphocytes. Images were acquired by use of the CytoVision Image Analysis System (Applied Imaging, Santa Clara, CA, USA).
RT‐PCR for SLC44A1‐PRKCA
Nested RT‐PCR was performed to detect the presence of an SLC44A1‐PRKCA transcript. Total RNA was extracted from a frozen portion of tumor tissue from each case using a standard protocol with TRIzol Reagent (Invitrogen). Reverse transcription was performed using Superscript II Reverse Transcriptase (Invitrogen). Furthermore, 2.5 μL of 1:5 diluted cDNA was added in a 25 μl of PCR reaction and amplified with Advantage HF‐2 PCR Kit (Clontech, Mountain View, CA, USA). For primary PCR, a forward primer from SLC44A1 exon 4 (5′‐CTGTGTGTAGCAGCGTGTCC‐3′) and a reverse primer from PRKCA exon 10 (5′‐CACTCCACGTCATCATCCTG‐3′) were utilized. A touchdown PCR program was conducted as follows: 94°C for 2 minutes, 14 cycles at 94°C for 30 s, 67°C for 1 minute, −0.5°C each cycle, 68°C for 30 s, followed by 20 cycles at 94°C for 30 s, 60°C for 1 minute, 68°C for 1 minute, and final extension at 68°C for 3 minutes. For nested PCR, forward primer from SLC44A1 exon 5 (5′‐CTGTTCTCTGCCCCAAACTAC‐3′) and reverse primer from PRKCA exon 10 (5′‐TCTTCTGTGCCCTTCCTGTC‐3′) were used. The PCR consisted of 35 cycles at 94°C for 30 s, 60°C for 30 s, 72°C for 30 s, and final extension at 72°C for 5 minutes. A 983bp GAPDH fragment was amplified as an internal RNA quality control by using Human G3PDH Amplimers (Clontech). The PCR conditions for GAPDH are 30 cycles at 94°C for 45 s, 58°C for 45 s, and 72°C for 2 minutes. The PCR products were analyzed on 2% agarose gels and visualized by ethidium bromide staining.
DNA sequencing and analysis
For confirmation and characterization of the SLC44A1‐PRKCA fusion transcript, PCR products were purified using the ExoSAP‐IT® Kit (USB Inc, Cleveland, OH, USA) and sequenced with both forward and reverse nested PCR primers. The sequencing results were compared to the SLC44A1 and PRKCA mRNA sequences deposited in the GenBank utilizing the online BLAST program (http://blast.ncbi.nlm.nih.gov/Blast.cgi).
Results
Histology
All three tumors were composed of synaptophysin immunoreactive neuronal (neurocytic, ganglioid, and ganglion cell‐like) populations as well as GFAP immunoreactive glial elements. In case 1, the astrocytic component was dominant and the tumor architecture comprised solid, microcystic and papillary areas. In cases 2 and 3, neuronal and astrocytic elements were both prominent. The architecture was solid and pseudopapillary with hyalinized blood vessels ensheathed by a layer of GFAP‐positive tumor cells (Figure 1). The neurocytic and ganglioid cells formed solid sheets and occupied the interpapillary areas. GFAP‐positive tumor cells were also present in the interpapillary areas. Mitoses were not identified and the Ki67 immunolabeling indices were low.
Figure 1.
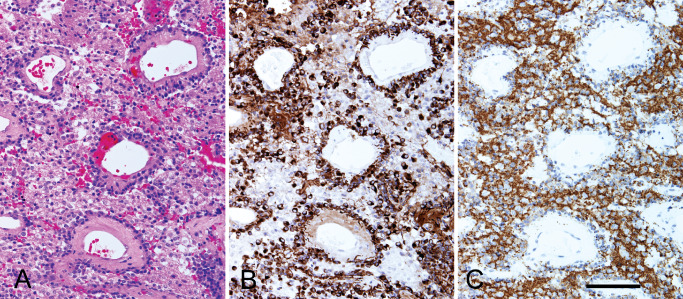
Serial sections from case 2 show a pseudopapillary architecture (A) with hyalinized blood vessels surrounded by a layer of GFAP‐immunoreactive glial cells (B). The interpapillary areas are occupied by sheets of synaptophysin‐immunoreactive neurocytic and ganglioid cells mixed with GFAP‐positive glial cells. (A) H&E, (B) GFAP immunostain, (C) synaptophysin immunostain. Bar = 100 microns.
Cytogenetic and FISH data
Cytogenetic analysis conducted on cases 1 and 2 revealed a balanced translocation t(9;17)(q31;q24) as the sole cytogenetic aberration in 11 of 20 metaphase cells analyzed from case 1 (46,XX,t(9;17)(q31;q24)[11]/46,XX[9]) and 15 of 20 metaphase cells analyzed from case 2 (46,XY,t(9;17)(q31;q24)[15]/46,XY[5]) (Figure 2A). Pursuant to these findings, a FISH‐based positional cloning strategy utilizing a series of BAC probe cocktails was employed in an effort to more precisely define the involved breakpoints 9q31 and 17q24. Bicolor interphase FISH studies performed on cytologic touch imprint preparations of case 2 revealed a split of the probe signals between BAC clone probes RP11‐95O7 and RP11‐1107O17 within chromosomal region 9q31 (Figure 2B), and a split of the probe signals between BAC clone probes RP11‐51D14 and RP11‐1036I14 within chromosomal region 17q24 (Figure 2C), indicating the localization of the 9q31 and 17q24 breakpoints within the intervals between these probes. Subsequent analysis on representative FFPE tissue sections of all cases 1, 2, 3 using breakpoint spanning probe sets composed of the BAC clones above showed dual fusion signals in 92, 95, and 68%, respectively, of the cells analyzed (Figure 2D), confirming the presence of the aberrations. Identification of the genes mapping to the breakpoint regions was performed by searching UCSC Genome Browser (http://genome.ucsc.edu/). When aligning the sequences of BAC clone RP11‐51D14 and RP11‐1036I14 with the human genome assembly, it revealed PRKCA, a member of the protein kinase C (PKC) family of serine and threonine‐specific protein kinases, as the sole candidate localized to the 17q24 breakpoint region. Alignment of RP11‐95O7 and RP11‐1107O17 sequences revealed the presence of two genes, SLC44A1 and FSD1L, within the 9q31 breakpoint region. However, the FSD1L gene was determined to be an unlikely candidate because it is localized near the telomeric end of only one clone (RP11‐95O7) and the FISH studies demonstrated what appeared to be an even split of the signals between RP11‐95O7 and RP11‐1107O17.
Figure 2.

(A) Schematic and partial G‐banded karyotype illustrating the 9;17 translocation. (B and C) The chromosome 9 and 17 break‐apart probe sets respectively illustrating splits of the orange and green signals within the neoplastic interphase nuclei of case 2 is indicative of rearrangements of these loci (conducted on cytologic touch imprints). (D). The dual‐color, dual‐fusion 9;17 probe set demonstrating juxtaposed orange‐green signals is indicative of the translocation event (arrows) in neoplastic interphase nuclei of case 1 (conducted on a representative FFPE tissue section).
RT‐PCR and sequencing analysis of SLC44A1‐PRKCA transcripts
To further verify the FISH findings, nested RT‐PCR studies were performed on cases 1 and 2 to confirm the presence of a SLC44A1‐PRKCA fusion transcript. Primers designed for the PRKCA gene were focused on the 3′ portion downstream of exon 9 as this region encodes the functional catalytic kinase domain of the protein. Primers designed for the SLC44A1 gene were placed upstream of exon 6 based on the position suggested by the BAC clone FISH findings. Case 1 demonstrated a unique, robust 1655 bp amplification product when a forward primer from SLC44A1 exon 5 and a reverse primer from PRKCA exon 10 were utilized for nested RT‐PCR. Sequencing analysis of this RT‐PCR‐generated transcript revealed a fusion of the first 15 exons of SLC44A1 to the last 9 exons of PRKCA. In contrast, RT‐PCR analysis of the tumor specimen from case 2 revealed an amplification product much smaller in size (495 bp) than the product of case 1 (Figure 3A). Subsequent sequencing analysis of this smaller product, however, demonstrated an identical SLC44A1‐PRKCA fusion cDNA junction (fusion of SLC44A1 exon 15 with PRKCA exon 9) (Figure 3B). The smaller product size is explained by the presence of an internal in‐frame deletion arising within exon 6 and extending to within exon 14 of SLC44A1 (mRNA nt.875‐nt.2034; NCBI Refseq NM_080546) (Figure 4A). The predicted SLC44A1‐PRKCA fusion protein of 1016 aa residues in case 1 consists of nearly the entire SCLC44A1 protein (except the last seven aa residues of the protein) at the N‐terminal fused to an intact serine/threonine kinase catalytic domain of PRKCA. The shorter version, identified in case 2, lacks the choline transporter domain of SLC44A1 (Figure 4B).
Figure 3.
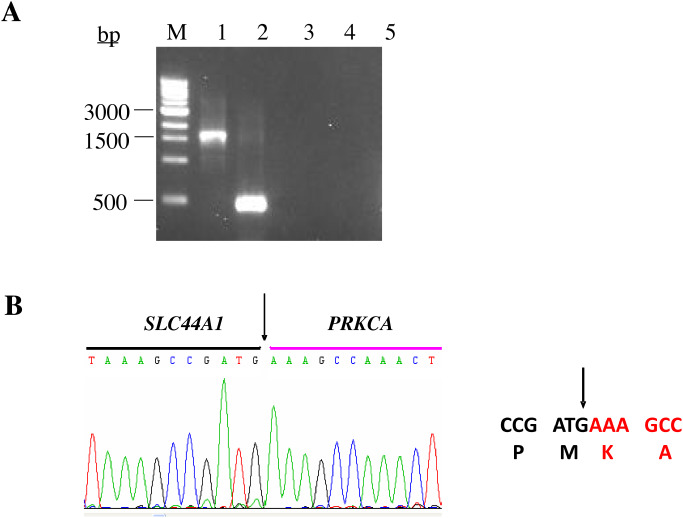
Ethidium‐bromide agarose gel electrophoresis of the reverse‐transcription polymerase chain reaction (RT–PCR) products. (A) Lane M represents the 1.0‐kb DNA molecular weight marker ladder. Lanes 1 and 2 demonstrate the SLC44A1‐PRKCA fusion transcripts as detected in cases 1 (1655 bp) and 2 (495 bp), respectively. Lanes 3, 4 and 5 represent negative controls; clear cell sarcoma cell line SU‐CCS‐1, no reverse transcriptase, and no template, respectively. (B) Sequence alignment of the SLC44A1‐PRKCA breakpoint region. Arrows depict the fusion point. Single letter amino acid code is displayed beneath the nucleotide sequence.
Figure 4.
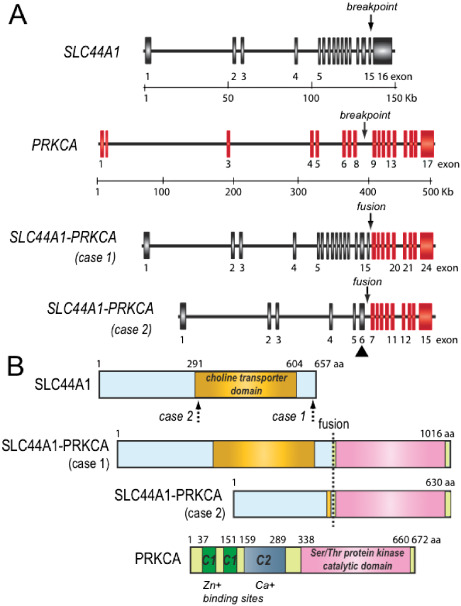
Schematic diagrams of SLC44A1, PRKCA, and cases 1 and 2 SLC44A1‐PRKCA fusion genes (A) and predicted fusion proteins (B), respectively. The solid triangle indicates the in‐frame deletion and fusion between exons 6 and 14 of SLC44A1 for case 2. The dotted arrows show the two different breakpoints in SLC44A1 protein.
Discussion
PGNT is a rare, recently WHO classified cerebral neoplasm distinguished by a prominent pseudopapillary architecture in which hyalinized blood vessels are surrounded by small cuboidal GFAP‐positive glial cells and interpapillary spaces are occupied by synaptophysin‐positive neurocytes and ganglion cells 20. MR and CT imaging demonstrate that PGNT is frequently a cystic lesion with a mural nodular pattern or a solid to cystic mass with ring‐like contrast enhancement 23, 28. PGNT is generally considered a low‐grade neoplasm because of its indolent clinical course. Correspondingly, MIB‐1 labeling indices are typically low and features of anaplasia such as endothelial proliferation and necrosis are uncommon 13, 20. Nevertheless, rare cases exhibiting more aggressive behavior to include dissemination and local spread of disease have been reported 9, 18. Interestingly, a high proliferative index at the time of tumor recurrence was also observed in these individual cases.
The underlying histogenesis of PGNT is uncertain, although a common progenitor cell origin (capable of glial and neuronal differentiation) from the subependymal matrix for subventricular zone PGNTs and from the secondary germinal layer for PGNTs arising more superficially has been postulated 8, 13, 20. Genetic studies which have often proven useful in further characterizing the nature of a neoplasm and providing valuable histopathogenetic insight have been few for PGNT 7, 18, 26. FISH studies conducted for assessment of the 1p locus in a subset of PGNTs exhibiting minigemistocytic cells and Olig2 immunoreactive cells failed to demonstrate any deletion 26. Standard cytogenetic and comparative genomic hybridization (CGH) studies of a temporal subcortical PGNT arising in a 9‐year‐old female revealed structural alterations of chromosomal band 7p22 and gain of chromosome 7 material including high‐level amplification of 7p14∼q12. Corresponding FISH studies, however, failed to reveal amplification of the EGFR (7p12) locus 7. Similarly, a third study employing FISH and array‐based CGH approaches showed lack of EGFR gene amplification and 1p/19q deletions in four cases of PGNT 18. Conversely, genomic imbalances were numerous in two of four cases studied with loss of 1q, 6p, 8p, 9p, 9q and 16q, and gain of 2q, 3p, 5q, 6p, 7q, 10q, 16q, 19p and 22q 18. In addition, two of these cases showed phosphatase and tensin homolog (PTEN) loss immunohistochemically and three were positive for 0‐6‐methylguanine‐DNA methyltransferase (MGMT) methylation.
In the current study, the identification of a novel chromosomal translocation and associated fusion gene is described in three cases of PGNT. The t(9;17)(q31;q24), detected as the sole anomaly in both cases subjected to conventional karyotyping, juxtaposes the SLC44A1 gene to the PRKCA gene. The alpha isoform of protein kinase C encoded for by the PRKCA gene is a family member of calcium and phospholipid‐dependent serine/threonine kinases which can be activated by diacylglycerol and phorbol esters and are involved in tumor formation and progression 15. Interestingly, the BRAF and RAF1 genes, which are also serine‐/threonine‐specific protein kinases similar to PRKCA, have recently been identified as recurrent fusion gene partners in pilocytic astrocytoma 5, 10, 11, 25. PRKCA is ubiquitously expressed and has been associated with cell proliferation, transformation, apoptosis and increased cell motility when activated 19. In glioma cells, PRKCA mediates an essential pro‐mitogenic and pro‐survival signal rendering it a potential therapeutic target 3, 14.
SLC44A1 encodes choline transporter‐like protein 1 (CTL1, currently referred to as SLC44A1), a protein that functions as a Na+‐independent, HC‐3 (choline analogue hemicholinium‐3)‐sensitive mediator of choline transport across both plasma and mitochondrial membranes 17, 22. Transport of choline across the plasma membrane is crucial for cell survival; however, because choline is a charged molecule, free passage is precluded and transporter proteins such as SLC44A1 are required for choline entrance into cells. Importantly, neural cells depend on a continuous choline supply for the synthesis of the neurotransmitter acetylcholine in cholinergic neurons and SLC44A1 is expressed in brain tissue at a high level 1.
PRKCA and SLC44A1 have not been previously reported as genes participating in a fusion oncogene. We propose that the structural and functional outcome of the SLC44A1‐PRKCA transcripts in PGNT is defined by the replacement of the amino‐terminal portion of PRKCA by SLC44A1 sequences with retention of the serine/threonine protein kinase catalytic domain of PRKCA and consequent generation of a constitutively expressed serine/threonine kinase fusion protein. Observation of loss of the choline transport domain in case 2 indicates that this domain is not essential for transformation. The variation in the size of the SLC44A1 coding region suggests that either the high level of SLC44A1 promoter activity or the deregulation of PRKCA protein (the loss of the calcium and the second messenger diacylglycerol sensitive N‐terminal region) or both are important in papillary glioneuronal tumorigenesis. Interestingly, some authors have reported that PRKCA and other PKC isoforms appear to be vital for neurite differentiation; differentiation requires downregulated PRKCA expression. Therefore, high constitutive level of PRKCA expression or deregulated PRKCA likely inhibits differentiation and keeps cells in a continuous replication state 6. The SLC44A1‐PRKCA protein could directly result in deregulation of kinase signaling pathways analogous to pathogenetic fusion genes in other neoplastic entities such as pilocytic astrocytoma, inflammatory myofibroblastic tumor and infantile fibrosarcoma, among others 2, 5, 10, 11, 25.
In conclusion, we have identified a novel translocation in three cases of PGNT resulting in an in‐frame fusion of SLC44A1and PRKCA. Chromosomal translocations and associated fusion genes are common in hematopoietic and mesenchymal neoplasia and more recently have been demonstrated in a number of epithelial neoplasms; however, reports in primary central nervous system tumors are few 5, 10, 11, 25. PGNT is a rare entity that has only been recently introduced and its full histopathologic spectrum may not yet be recognized. Identification of this translocation could prove to be a defining feature that may be useful in its distinction from other mixed neuronal‐glial tumors. Correspondingly, the FISH and RT‐PCR assays developed in this study should serve as valuable diagnostic adjuncts for this rare disease entity.
Conflict of interest
The authors declare that they have no conflict of interest.
Acknowledgments
The authors would like to thank Drs. Deborah Perry, Syed A. Jaffar Kazmi and Jiri Bedrnicek for their valuable histopathologic contributions and Yuanyuan Zhang, Dali Huang and Patty Cattano for their technical assistance. This study was supported in part by U‐10‐CA98543‐091, Nebraska State LB595 funding and UNMC Eppley Pediatric Research Cancer Award (J.B.).
References
- 1. Blusztajn JK, Wurtman RJ (1983) Choline and cholinergic neurons. Science 221:614–620. [DOI] [PubMed] [Google Scholar]
- 2. Bridge JA, Cushman‐Vokoun AM (2011) Molecular diagnostics of soft tissue tumors. Arch Pathol Lab Med 135:588–601. [DOI] [PubMed] [Google Scholar]
- 3. Cameron A, Procyk KJ, Leitges M, Parker PJ (2008) PKC alpha protein but not kinase activity is critical for glioma cell proliferation and survival. Int J Cancer 123:769–779. [DOI] [PubMed] [Google Scholar]
- 4. Celli P, Caroli E, Giangaspero F, Ferrante L (2006) Papillary glioneuronal tumor. Case report and literature review. J Neurooncol 80:185–189. [DOI] [PubMed] [Google Scholar]
- 5. Cin H, Meyer C, Herr R, Janzarik WG, Lambert S, Jones DT et al (2011) Oncogenic FAM131B‐BRAF fusion resulting from 7q34 deletion comprises an alternative mechanism of MAPK pathway activation in pilocytic astrocytoma. Acta Neuropathol 121:763–774. [DOI] [PubMed] [Google Scholar]
- 6. Fagerström S, Påhlman S, Gestblom C, Nånberg E (1996) Protein kinase C‐epsilon is implicated in neurite outgrowth in differentiating human neuroblastoma cells. Cell Growth Differ 7:775–785. [PubMed] [Google Scholar]
- 7. Faria C, Miguéns J, Antunes JL, Barroso C, Pimentel J, Martins Mdo C et al (2008) Genetic alterations in a papillary glioneuronal tumor. J Neurosurg Pediatr 1:99–102. [DOI] [PubMed] [Google Scholar]
- 8. Gelpi E, Preusser M, Czech T, Slavc I, Prayer D, Budka H (2007) Papillary glioneuronal tumor. Neuropathology 27:468–473. [DOI] [PubMed] [Google Scholar]
- 9. Javahery RJ, Davidson L, Fangusaro J, Finlay JL, Gonzalez‐Gomez I, McComb JG (2009) Aggressive variant of a papillary glioneuronal tumor. Report of 2 cases. J Neurosurg Pediatr 3:46–52. [DOI] [PubMed] [Google Scholar]
- 10. Jones DT, Kocialkowski S, Liu L, Pearson DM, Bäcklund LM, Ichimura K, Collins VP (2008) Tandem duplication producing a novel oncogenic BRAF fusion gene defines the majority of pilocytic astrocytomas. Cancer Res 68:8673–8677. [DOI] [PMC free article] [PubMed] [Google Scholar]
- 11. Jones DT, Kocialkowski S, Liu L, Pearson DM, Ichimura K, Collins VP (2009) Oncogenic RAF1 rearrangement and a novel BRAF mutation as alternatives to KIAA1549:BRAF fusion in activating the MAPK pathway in pilocytic astrocytoma. Oncogene 28:2119–2123. [DOI] [PMC free article] [PubMed] [Google Scholar]
- 12. Kim D, Suh Y (1997) Pseudopapillary neurocytoma of temporal lobe with glial differentiation. Acta Neuropathol 94:187–191. [DOI] [PubMed] [Google Scholar]
- 13. Komori T, Scheithauer BW, Anthony DC, Rosenblum MK, McLendon RE, Scott RM et al (1998) Papillary glioneuronal tumor: a new variant of mixed neuronal‐glial neoplasm. Am J Surg Pathol 22:1171–1183. [DOI] [PubMed] [Google Scholar]
- 14. Lin TH, Kuo HC, Chou FP, Lu FJ (2008) Berberine enhances inhibition of glioma tumor cell migration and invasiveness mediated by arsenic trioxide. BMC Cancer 8:58–63. [DOI] [PMC free article] [PubMed] [Google Scholar]
- 15. Martiny‐Baron G, Fabbro D (2007) Classical PKC isoforms in cancer. Pharmacol Res 55:477–486. [DOI] [PubMed] [Google Scholar]
- 16. McLendon RE, Provenzale J (2002) Glioneuronal tumors of the central nervous system. Brain Tumor Pathol 19:51–58. [DOI] [PubMed] [Google Scholar]
- 17. Michel V, Bakovic M (2009) The solute carrier 44A1 is a mitochondrial protein and mediates choline transport. FASEB J 23:2749–2758. [DOI] [PubMed] [Google Scholar]
- 18. Myung JK, Byeon SJ, Kim B, Suh J, Kim SK, Park CK et al (2011) Papillary glioneuronal tumors: a review of clinicopathologic and molecular genetic studies. Am J Surg Pathol 35:1794–1805. [DOI] [PubMed] [Google Scholar]
- 19. Nakashima S (2002) Protein kinase C alpha (PKC alpha): regulation and biological function. J Biochem 132:669–675. [DOI] [PubMed] [Google Scholar]
- 20. Nakazato Y, Figarella‐Branger D, Becker AJ, Scheithauer BW, Rosenblum MK (2007) Papillary glioneuronal tumor. In: WHO Classification of Tumours of the Central Nervous System, Louis DN, Ohgaki H, Wiestler OD, Cavenee WK (eds), pp. 113–114. IARC: Lyon. [Google Scholar]
- 21. Nishio J, Althof PA, Bailey JM, Zhou M, Neff JR, Barr FG et al (2006) Use of a novel FISH assay on paraffin‐embedded tissues as an adjunct to diagnosis of alveolar rhabdomyosarcoma. Lab Invest 86:547–556. [DOI] [PubMed] [Google Scholar]
- 22. O'Regan S, Traiffort E, Ruat M, Cha N, Compaore D, Meunier F‐M (2000) An electric lobe suppressor for a yeast choline transport mutation belongs to a new family of transporter‐like proteins. Proc Natl Acad Sci U S A 97:1835–1840. [DOI] [PMC free article] [PubMed] [Google Scholar]
- 23. Rosenblum MK (2007) The 2007 WHO Classification of Nervous System Tumors: newly recognized members of the mixed glioneuronal group. Brain Pathol 17:308–313. [DOI] [PMC free article] [PubMed] [Google Scholar]
- 24. Shaffer LG, Slovak ML, Campbell LJ (2009) An International System for Human Cytogenetic Nomenclature. Karger, ISCN: Basel. [Google Scholar]
- 25. Sievert AJ, Jackson EM, Gai X, Hakonarson H, Judkins AR, Resnick AC et al (2009) Duplication of 7q34 in pediatric low‐grade astrocytomas detected by high‐density single‐nucleotide polymorphism‐based genotype arrays results in a novel BRAF fusion gene. Brain Pathol 19:449–458. [DOI] [PMC free article] [PubMed] [Google Scholar]
- 26. Tanaka Y, Yokoo H, Komori T, Makita Y, Ishizawa T, Hirose T et al (2005) A distinct pattern of Olig2‐positive cellular distribution in papillary glioneuronal tumors: a manifestation of the oligodendroglial phenotype? Acta Neuropathol 110:39–47. [DOI] [PubMed] [Google Scholar]
- 27. Vajtai I, Kappeler A, Lukes A, Arnold M, Lüthy AR, Leibundgut K (2006) Papillary glioneuronal tumor. Pathol Res Pract 202: 107–112. [DOI] [PubMed] [Google Scholar]
- 28. Xiao H, Ma L, Lou X, Gui Q (2011) Papillary glioneuronal tumor: radiological evidence of a newly established tumor entity. J Neuroimaging 21:297–302. [DOI] [PubMed] [Google Scholar]