Abstract
Background:
Role of TC2N in carcinogenesis has been largely unfathomed until recently when it was identified as a novel oncogene in lung cancer. Subsequently, a tumour suppressor role of TC2N was reported in breast cancer. It is therefore highly relevant to investigate TC2N molecular partners/mechanisms on a larger scale including a wider range of tumour types.
Methods:
We investigated TC2N mRNA expression, its promoter methylation levels, effects of TC2N transcription on overall patient survival, somatic mutations in TC2N gene and correlation between TC2N mRNA expression and other cancer genes in pan-cancer by using data available from the Cancer Genome Atlas (TCGA) and the Genotype Tissue Expression (GTEx) databases.
Results:
TC2N mRNA expression was differentially regulated in 9/33 TCGA tumour types. Of these 9 tumours, 5 tumour types (cholangiocarcinoma, ovarian-serous-cystadenocarcinoma, rectal-adenocarcinoma, stomach-adenocarcinoma and thymoma) had significantly higher TC2N mRNA expression while 4 (pheochromocytoma-and-paraganglioma, skin-cutaneous-melanoma, thyroid-carcinoma and uterine-carcinosarcoma) had significantly lower TC2N mRNA expression compared to matched and normal controls. TC2N promoter was hypermethylated in most cancers while hypomethylated in head-and-neck-squamous-cell-carcinoma and kidney-renal-clear-cell carcinoma. TC2N transcription was positively correlated with transcription of several other cancer genes including genes from Myc, cell-cycle, Nrf2, Wnt, PI3K, Hippo, Notch, TGFβ and RAS/RTK pathways. Poor prognosis was associated with higher TC2N mRNA levels in pancreatic-adenocarcinoma and brain-lower-grade-glioma and lower TC2N mRNA levels in kidney-renal-clear-cell-carcinoma, mesothelioma, sarcoma and skin-cutaneous melanoma. Functional protein partners of TC2N were identified as STX2, SMEK1, SMEK2, STXBP5, SCARA5, MMRN1, CATSPER2, CATSPERB, CLEC4M and STAB2. Many of these proteins are key players in carcinogenesis of various cancers. Highest pathogenic somatic mutation rates in TC2N were found in skin-cutaneous-melanoma, uterine-corpus-endometrial-carcinoma, colon-endocervical-adenocarcinoma, bladder-urothelial-carcinoma and breast-invasive-carcinoma.
Conclusion:
Our findings unravel several un-explored avenues related to the role of TC2N in tumourigenesis of several cancers, suggesting TC2N as an important player and a potential candidate for tumour-therapy.
Key Words: TC2N, Tac2-N, TCGA, GTEx, cancer
Introduction
Tac2-N (TC2N) gene is located on chromosome 14a32.12 and encodes a C2 domain containing protein that belongs to the carboxyl terminal type (C-type) tandem C2 family of proteins. The protein contains two C-terminal C2 domains, C2A and C2B (Fukada and Mikoshiba, 2001). Initially, the C2 domains were identified as protein structural domains for calcium-dependent protein kinase C (Duncan et al., 2000; Corbalan-Garcia et al., 2014). However, further data delineated other roles of C2 domains including cellular signal transduction and other protein-protein interactions (Farah and Sossin, 2012). Interestingly, various proteins containing the C2 domain have been linked to regulation of carcinogenesis. For example, DOC2B is believed to play a tumour suppressive role in cervical cancer by inhibition of cellular proliferation, migration and invasion of malignant cells (Kabekkodu et al., 2014). Another C2 domain containing protein, Myoferlin, promotes tumour metastasis in patients with triple negative breast cancer (Blommme et al., 2017).
Role of TC2N in tumourigenesis had not been investigated until recently when it was identified as a novel oncogene that promotes/accelerates tumourigenesis by suppression of p53 signaling in lung cancer (Hao et al., 2019). Subsequently, the same group reported TC2N as a potent suppressor of PI3K-AKT signaling in breast cancer, suggesting its tumour suppressor activity in breast cancer (Hao et al., 2019). While these recent (and only) studies have highlighted TC2N as a potential player in lung and breast cancers, its role in other tumour types remains un-addressed. It is therefore highly relevant to investigate TC2N molecular profile and associated circuitry to better understand its role in various cancers.
In this study, we undertook multiomics approach to investigate TC2N molecular profile in pan-cancer using tumour data sets available at the The Cancer Genome Atlas (TCGA). In this study, we investigated TC2N mRNA expression, its promoter methylation status, effect of TC2N transcription on patients’ prognosis, correlation between TC2N mRNA expression and other cancer genes, TC2N functional protein partners and somatic mutations in TC2N gene in pan-cancer. This, to the best of our knowledge, is the first report detailing pan-cancer analysis of TC2N molecular profile. Our results provide novel insights with reference to TC2N molecular interactions and its potential role in carcinogenic mechanisms. These findings could therefore be exploited not only to better understand underlying cancer mechanisms but also to identify novel biological targets for cancer treatment.
Materials and Methods
Methods
TC2N transcript expression analyses using GEPIA and UALCAN
TC2N transcript expression analysis in 33 tumour types available in the TCGA database was carried out using the Gene Expression Profiling Interactive Analysis (GEPIA), which is an open-source web platform to analyze RNA sequencing data (http://gepia.cancer-pku.cn/) (Tang et al., 2017). The GEPIA analyses are based on data extraction from the TCGA (tumour data sets) and GTEx (normal controls) databases providing an additional benefit of including normal tissues in the expression analyses (from the GTEx database). Bar graphs for TC2N gene expression were plotted for pan-cancer (33 tumour types) and matched as well as normal controls from the GTEx database. Subsequently, box plots were generated for tumours with differential TC2N expression using a Log2 (TPM+1) scale, p-value cut-off of 0.01, a LogFc cutoff of 1. For the 9 tumour types exhibiting differential expression patterns at the GEPIA platform, further in-depth transcript expression analyses (with reference to tumour subtypes, different stages, different grade, nodal metastasis and other available clinical details) were performed using the UALCAN (http://ualcan.path.uab.edu/), which is an open-access web server that provides detailed analyses of TCGA datasets (including normal control tissues from the GTEx database) (Chandrashekar et al., 2017). It is important to note that all clinical/sample details were not available for all tumour types and therefore analyses of available parameters were performed. Therefore, of the 9 tumour types that showed differential TC2N transcript expression, 5 (READ, OV, THYM, SKC and UCS) were excluded from the UALCAN analyses because of one (or more) of the following reasons; n<3 in any of the sample type, non-availability of the GTEx data for comparison, or unavailability of relevant parameter for comparison. For these reasons, tumour stage-specific anlyses could only be performed for CHOL, STAD and THCA while analyses with other clinicopathological parameters was performed for CHOL, STAD, THCA, OV and PCPG.
TC2N promoter methylation in pan-cancer
TC2N promoter methylation levels were investigated in pan-cancer using an open-source web-based human pan-cancer methylation database (MethHC) [http://methhc.mbc.nctu.edu.tw/php/index.php] (Huang et al., 2015). MethHC provides an interactive platform for analyses of DNA methylation, microRNA methylation, and correlation of expression and methylation data across 18/33 TCGA tumour types. At the time of analyses, DNA methylation profiles available at the MethHC were based on integration of data from over 6000 samples, 6,548 microarray and >12,000 RNA-seq data from 18/33 TCGA tumour types. Box plots for TC2N promoter methylation were generated TC2N transcript (Accession #: NM_001128596) data from the TCGA database.
Investigating prognostic significance of TC2N transcription on patients’ survival
Based on TC2N expression, overall patient survival analyses were performed using Log Rank test (Mantel-Cox test). In order to stratify tumour cohorts into patients with high and low TC2N expression, TC2N expression threshold of 50% (median value) was used as a cut-off. All 33 cancers were investigated for effects of TC2N transcription patterns on patients’ survival/prognosis. Only those curves are presented herein which showed significant differences in overall survival (p<0.05) of patients with high cut-off values compared to those with low cut-off values.
Correlation analyses of TC2N transcript with other cancer genes
Pair-wise transcript expression analyses were performed on TCGA and GTEx data sets using Pearson’s correlation coefficient. Initially, we investigated very strong, strong, moderate and week correlations of TC2N expression with other genes in all 33 cancers at the TCGA database. Genes exhibiting very strong TC2N correlation (R>0.8) and strong negative correlations are shown herein. We also investigated correlation of TC2N expression with various tumour suppression genes including BUB1B, CYLD, ATR, ATM, BRCA1, BRCA2, TP53. Next, we investigated TC2N transcript correlation with various genes of 10 cancer signaling pathways, i.e, Myc pathway, cell cycle pathway, p53 pathway, Nrf2 pathway, Wnt pathway, Hippo pathway, TGFβ pathway, Notch pathway, PI3K pathway, RTK/RAS pathway. Following brackets (based on R-value) were used to interpret the +ve correlation data: R-value”; R>0.8 as very strong correlation; R=0.6-0.79 as strong correlation, R=0.4-0.59 as moderate correlation, R=0.2-0.39 as week correlation and R<0.2 as very week correlation.
Protein-Protein-Interaction analyses using STRING
In order to identify functional protein partners of TC2N, the Search Tool for the Retrieval of Interacting Genes/proteins (STRING) was used, which is an open-access web based tool that provides critical analyses of protein-protein interaction including direct (physical) as well as indirect (function) protein associations (https://string-db.org/) (Szklarcyzk et al., 2019). At the time of analyses presented herein, the STRING database contained data from a total of 5,090 organisms, 24,584,628 proteins and 3,123,056,667 protein-protein interactions. The TC2N protein network was constructed using neighborhood, gene fusion, co-expression, experiments, text-mining approaches.
TC2N mutation profiling using the GDC Data Portal
Mutation profiling of TC2N gene was performed using the National Cancer Institute’s GDC Data Portal, which is a partially open-access platform for online analyses and interactive visualization of cancer data-sets (https://portal.gdc.cancer.gov/) (Liu et al., 2018). It contains various types of mutation data including copy number variants, types of mutation and limited anonymized clinical data. At the time of investigation, data from 52 cancer projects, 34,893 cases, 22,872 genes and 3,142,246 mutations were available at the GDC data portal for analyses. For mutation, it provides mutation ID, details of genetic change, protein change, type of mutation and its VEP impact across all available TCGA tumour data sets. It also provides external links to dbSNP and Catalogue of Somatic Mutations in Cancer (COSMIC) database. Clinical impact of the SNVs was identified using Functional Analysis through Hidden Markov Models (FATHMM) with a score of >0.8 annotated as “pathogenic” (Shihab et al., 2015).
Results
TC2N mRNA expression is differentially regulated in 9/33 TCGA tumour types
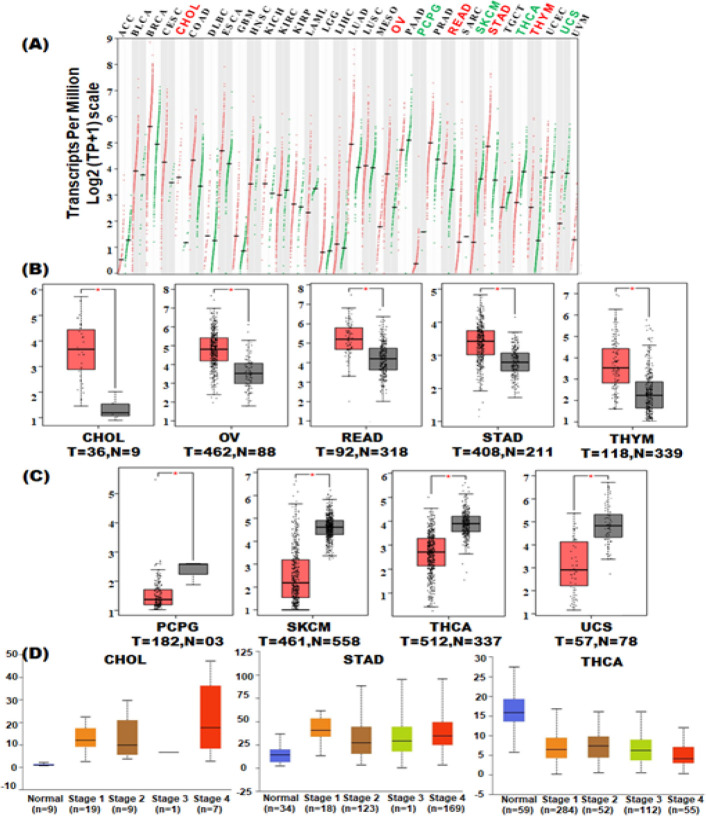
In order to investigate TC2N mRNA expression patterns, data from TCGA database were analyzed across 33 cancer types compared to matched normal tissues from the TCGA database as well normal controls available at the GTEx database. TC2N transcription was significantly higher in cholangiocarcinoma (CHOL), ovarian serous cystadenocarcinoma (OV), rectal adenocarcinoma (READ), stomach adenocarcinoma (STAD) and thymoma (THYM) (Figure 1A, Figure 1B). TC2N transcription was significantly lower in pheochromocytoma and paraganglioma (PCPG), skin cutaneous melanoma (SKCM), thyroid carcinoma (THCA) and uterine carcinosarcoma (UCS) (Figure 1A, Figure 1C). Boxplots presented in Figure 1B and Figure 1C were generated only for those TCGA tumours which exhibited significantly differential expression as compared to controls.
Figure 1.
TC2N Gene Expression in Pan-Cancer. TCGA RNA-seq data were normalized (Transcripts per million, TPM), and differential expression was assessed using an unpaired t-test by comparing the tumour samples with normal controls (TCGA normal and GTEx databases respectively). (A) Expression of TC2N in pan-cancer. (B) Tumour types exhibiting significant overexpression of TC2N. (C) Tumour types exhibiting significant downregulation of TC2N expression. (D) Stage-specific expression analysis
We further investigated TC2N expression patterns with respect to tumor stages, tumour grades, histological subtypes, nodal metastasis and other clinical parameters only in those 9 tumours which showed significant differential expression of TC2N (i.e, CHOL, OV, READ, STAD, THYM, PCPG, SKCM, THCA and UCS). Amongst hepatobilliary tumours, CHOL showed significantly increased TC2N expression in all tumour stages compared to the controls (Figure 1D, Table 1). Moreover, TC2N expression was also significantly higher in CHOL cases with nodal metastasis as compared to the controls (Table 1). Amongst the gastrointestinal tract tumours, STAD showed significantly increased TC2N expression in all stages, tumour grades and histological subtypes compared to the normal controls (Table 1). Moreover, TC2N expression in STAD was significantly higher in patients with nodal metastasis and those without H.pylori infection (Table 1). Amongst the tumours with low overall TC2N expression, THCA showed significant downregulation of TC2N in all histologic subtypes compared to controls while in PCPG only Paraganglioma;extra adrenal pheochromocytoma subtype showed significant downregulation of TC2N compared to the controls (Table 1).
Table 1.
TC2N Expression Patterns with Reference to Tumour Grade, Nodal Metastasis, Histological Subtype and Other Clinical Parameters
| Tumour | Tumor grade | Nodal metastasis | Histological subtype | Other clinical |
|---|---|---|---|---|
| CHOL | N-vs-G: p=N/A N-vs-G2: p=0.06 N-vs-G3: p=0.07 N-vs-G4: p=1 |
N-vs-N0: p<10-7 N-vs-N1: p=0.03 |
||
| STAD | N-vs-G1: p=0.0008 N-vs-G2: p<10-12 N-vs-G3: p<10-16 |
N-vs-N0: p<10-12 N-vs-N1: p<10-12 N-vs-N2: p<10-10 N-vs-N3: p<10-11 |
N-vs-Adenocarcinoma (NOS): p<10-13 N-vs-Adenocarcinoma (Diffuse): p=<10-06 N-vs-Adenocarcinoma (Sigent Ring): p=0.007 N-vs-Intestinal Adenocarcinoma (NOS): p<10-12 N-vs-Intestinal Adenocarcinoma (Tubular): p<10-11 N-vs-Intestinal Adenocarcinoma (Mucinous): p=0.001 N-vs-Intestinal Adenocarcinoma (Papillary): p=0.01 |
T with H.pylori (↓ expression) -vs- T without H.pylori (↑ expression): p=0.0003 |
| THCA | N-vs-N0: p<10-11 N-vs-N1: p<10-12 |
N-vs-Papillary carcinoma (classical): p<10-10 N-vs-Papillary carcinoma (tall): p<10-12 N-vs-Papillary carcinoma (follicular): p<10-12 N-vs-Others: p<10-5 |
||
| PCPG | N-vs-Paraganglioma: p=0.08 N-vs-Pheochromocytoma: p=0.4 N-vs-Paraganglioma;extra adrenal pheochromocytoma: p=0.004 |
N, normal; p, p-value; G, grade; N/A, not applicable
Taken together, these data exhibit first ever pan-cancer expression analyses for TC2N expression and therefore delineate possible role of TC2N in these cancers.
Variation of promoter methylation levels of TC2N in Pan-Cancer
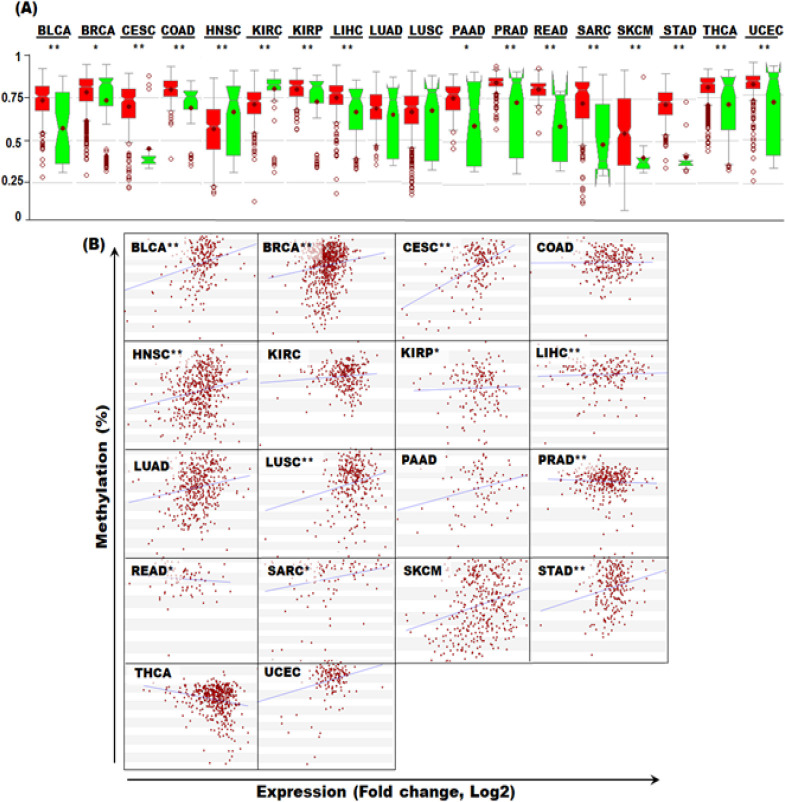
In order to investigate methylation of TC2N promoter in pan-cancer, MethHC database was used. Compared to the controls, TC2N promoter was significantly hypermethylated in BLCA, BRCA, COAD, KIRP, LIHC, PAAD, PRAD, READ, SARC, SKCM, STAD, THCA and UCEC and significantly hypomethylated in HNSC and KIRC (Figure 2A). We further investigated correlation between TC2N mRNA expression and its promoter methylation levels in pan-cancer. Significant +ve correlation was observed in BLCA, BRCA, CESC, HNSC, KIRP, LIHC, LUSC, SARC and STAD while significant –ve correlation was observed in PRAD and READ (Figure 2B).
Figure 2.
Promoter Methylation of TC2N Gene in Pan-Cancer. (A) Promoter methylation levels of TC2N gene in pan-cancer. (B) Correlation between TC2N mRNA expression and DNA methylation in Pan-Cancer
Role of TC2N mRNA levels in prognosis/patient survival
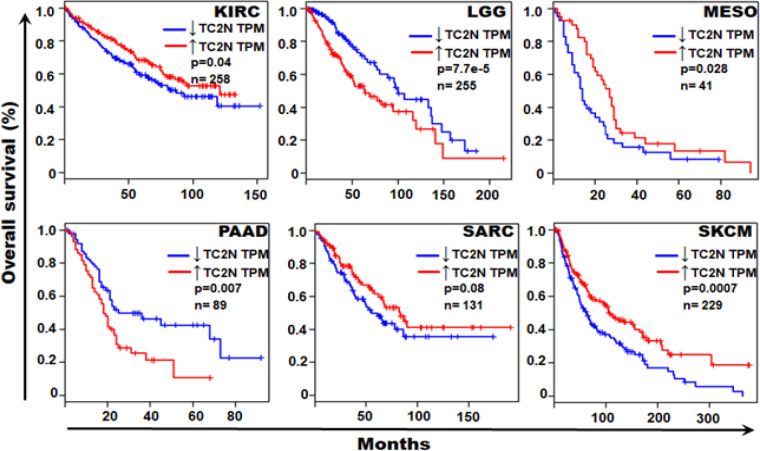
In order to investigate potential role of TC2N mRNA levels in tumour prognosis and patient survival, Kaplan-Mayer curves were generated for pan-cancer using tumour data sets from the TCGA database. Of all the 33 tumour types, 6 tumours exhibited significant role of TC2N mRNA levels in tumour prognosis. Patients with higher TC2N mRNA levels showed a shorter overall survival (and thus poor prognosis) in LGG and PAAD tumour types (Figure 3). Patients with lower TC2N expression showed a shorter overall survival (and thus poor prognosis) in KIRC, MESO, SARC and SKCM tumour types (Figure 3).
Figure 3.
TC2N Expression as a Prognostic Factor in Various Tumours. Patients with survival data in the TCGA datasets were segregated into those with high TC2N and low TC2N expression levels (using TPM as the unit of gene expression). Overall survival was compared between TC2N high-expression levels and low-expression level patients. Red line represents tumours expressing high levels of TC2N transcripts while the blue lines represents tumours with low level TC2N transcript expression. Of the 33 TCGA tumours that were investigated for survival analyses, only 6 (shown in the figure) exhibited significant impact of TC2N expression levels on patients’ survival. TPM, transcript per million
TC2N mRNA expression is positively correlated with genes of various cancer pathways
We investigated TC2N expression correlation with other cancer genes in all 33 cancers enlisted in the TCGA database. Of these 33 cancers, 32 tumours expressed genes showing +ve correlation and 28 tumours expressed genes exhibiting –ve correlation with TC2N expression. Of the 32 cancers showing +ve correlation with TC2N expression, 8 tumour showed very strong +ve correlation (Table 2). Of the 28 tumour expressing genes with –ve correlation with TC2N expression, 5 tumour types showed strong –ve correlation.
Table 2.
Expression Correlation between TC2N and Various Genes in Pan-Cancer
| Genes with very strong +ve correlation with TC2N expression | DLBC: BCL11B, CD28, CD3G, KIAA1671, TRAT1, GPRIN3, ITK, ABCA2, FYB, MAF, GIMAP7, GIMAP6, MBNL1, GIMAP2, PRKCQ, FYCO1, SLC46A3, ZNF75D , PLEKHM3, SH2D1A, INPP4B, OLFM2, GATA3, NTNG2, TNRC6C, FYN, NPHP3, GVIN1, PTPRC, ATM, EVI2B, STAT5B, ARL4C, ZNF831, MLL, SIRPG, LBH, WIPF1, SATB1. KICH: TMEM135, LIMA1, CDS1, OSBP, WDR20, PDP2, LONP2, KIAA0528, CLCN3, USP28, FCF1, TRIM2, LNX1, RALGAPA2, SETD3, ZYG11B, CDH1, SYNJ2BP, KIF16B. LIHC: STS, DSG2. MESO: LRRK2, ADRB2, RND1, SLC34A2, AGER, KIAA0040, FAM107A, AHCYL2, TACSTD2, SCGB3A1, AQP3, TMEM163, CCL20, SERPINA1, SOCS2, LAMP3, FCN3, LONRF3, HYAL1, GPIHBP1, FPR2, MPZL2, PRX, HOPX, CLDN7, CD101, PIGA, FMO5, LPL, CLDN4, SYTL3, CACNA2D2, EMP2, GK, ALPL, GLDN, CCL17, ABCA3, GPX3, AREG, SOX7, ICAM4, CYP4B1, FAM135A, LOC100302650, CH25H,EDN1, GRRP1, SFN, TACC2. PCPG: MUC1, TMEM30B, LLGL2, ERO1LB, MEIS2, SPINT1, NXT2, C2CD4C, SLC45A3, VAV1, ID4, ITPR3, CXADR, TMC4, C6orf192, ATP6V1B1, CHN2, DENND1C, PAX6, GLIS3, ZNF595, SLC25A15, GINS2, CNTD2, EPHB3, HOPX, MAGED4B, MEX3B, CDCA8, OTUB2, NCKAP1L. PRAD: CPSF2. THYM: BIRC3, FAM3B, CSF2RB, RAB11FIP4. UCS: GRHL2. |
| Genes with strong –ve correlation with TC2N expression | CHOL: ILVBL DLBC: RPS9 PRAD: ZNF358 THYM: ACD, FAM96B UVM: C19orf22, C19orf24, RAVER1 |
| +ve correlation b/w TC2N and various tumour suppressor genes in cancers |
BUB1B: mod=PCPG; week=HNSC, READ, PRAD. CYLD: strong=DLBC, KICH; mod=PRAD, UCEC, READ, TGCT, UVM, LAML, THCA; week=LIHC, THYM, KIRC, KIRP, SKCM. ATR: strong=UVM, DLBC; mod=UCEV, KICH, LIHC, THCA, PAAD; week=BLCA, THYM, PRAD, KIRP. ATM: strong=DLBC; moderate=UVM CHK2; week=LAML, THYM, THCA, KIRP,PRAD,TGCT, HNSC, KIRC, LIHC, CESC,ESCA, BRCA1: week=CESC BRCA2 mod=CESC; week=HNSC, READ, DLBC, TP53: mod=HNSC. |
We further investigated TC2N expression correlation with several tumour suppressor genes including BUB1 mitotic checkpoint serine-threonine kinase B (BUB1B), checkpoint kinase 2 (CHK2), BRCA1, BRCA2ATM serine-threonine kinase (ATM), ATR, tumour protein p53 (TP53), CYLD and TSPYL2. BUB1B showed +ve correlation with TC2N gene expression in PCPG, HNSC, READ and PRAD. CYLD showed +ve correlation with the following cancers: DLBC, KICH, PRAD, UCEC, READ, TGCT, UVM, LAML, THCA, LIHC, THYM, KIRC, KIRP and SKCM. With reference to BRCA 1 and BRCA1, the earlier showed +ve correlation with only CECS while the later showed +ve correlation in the following cancers: CESC, HNSC, READ and DLBC. None of the investigated tumour suppressor genes showed -ve correlation with TC2N expression other than TP53 which showed –ve correlation only in UVM (Table 2).
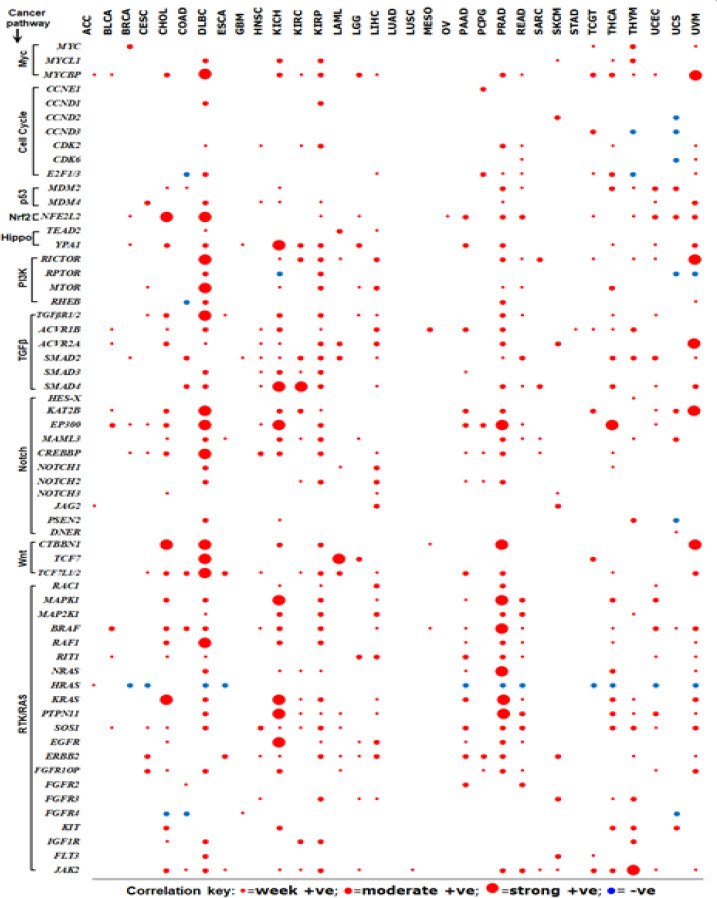
In order to further understand the molecular circuitry involved in TC2N molecular loops, we investigated correlation between TC2N expression and selected genes in 10 cancer pathways namely, Myc pathway, cell cycle pathway, p53 pathway, Nrf2 pathway, Wnt pathway, Hippo pathway, TGFβ pathway, Notch pathway, PI3K pathway and RTK/RAS pathway. It is interesting to note that several genes involved in the aforementioned cancer pathways show +ve correlation with TC2N expression (Figure 4), suggesting a potential role of TC2N in carcinogenesis of many cancers.
Figure 4.
Correlation between TC2N Expression and Other Genes in Various Cancer Pathways. Correlation between TC2N mRNA expression and other genes in 10 common cancer pathways was investigated using Pearson’s correlation coefficient. Positive correlation brackets were identified as week (R=0.2-0.39), moderate (R=0.4-0.6) and strong (R>0.6) correlation. In this figure, strong and very strong positive correlation were drawn cumulatively and represented as strong positive correlation
TC2N protein network
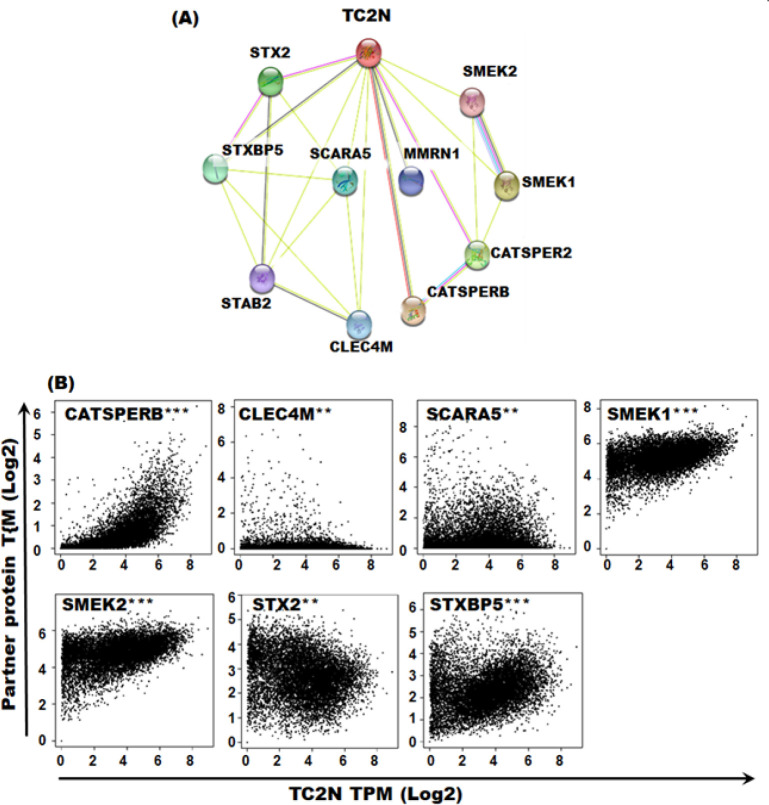
In order to investigate potential functional partners of TC2N protein, we investigated STRING database. Proteins with strongest TC2N interaction scores included STX2, SMEK2, SMEK1, STXBP5, SCARA5, MMRN1, CATSPER2, CATSPERB, CLEC4M and STAB2. All these proteins were also identified in the list of genes showing +ve correlation with TC2N expression in at least one of the TCGA tumour types, further suggesting their potential role in carcinogenesis. Of the 10 proteins identified as functional TC2N partner, significant +ve correlation was observed between TC2N mRNA expression of CATSPERB, CELEC4M, SCARA5, SMEK1, SMEK2, STX2 and STXBP5 in pan-cancer (cumulative correlation), further suggesting that these proteins partner with TC2N in it’s signaling pathways (Figure 5).
Figure 5.
TC2N Protein Network. (A) TC2N functional protein partners were identified using STRING database by considering neighbourhood, gene fusion, co-expression, experiments and text mining approaches in the algorithm. Proteins with strongest interaction scores and direct interaction prediction are included in the figure. (B) Correlation between TC2N mRNA expression and mRNA expression levels of identified partner proteins was investigated in pan-cancer (cumulative correlation). ***p<0.0001, **p<0.01
TC2N mutation profile in pan-cancer
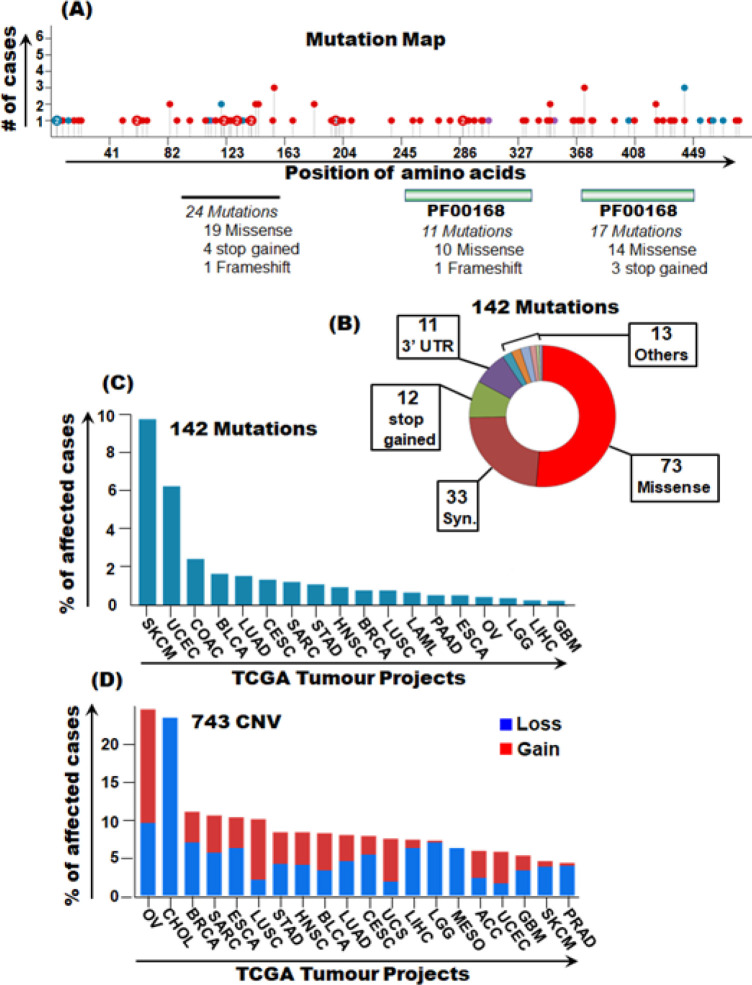
Our analyses show several frequent somatic mutations in TC2N gene in various cancers. A total of 142 mutations were identified across 145 cases in a total of 18 TCGA tumour types. All 142 mutations were investigated for the type of mutation, and their potential of pathogenicity (FATHMM score>0.8). Of the 142 mutations, 73 were missense, 33 were synonymous, 12 were stop gained, 11 were in the 3’UTR and 13 were other types of mutations (Figure 6). Highest pathogenic mutation rates of TC2N were present in SKCM, UCEC, COAD, BLCA and BRCA (Table 3). In terms of copy number variants, burden of CNV gains was higher than CNV losses. Highest CNV gains were observed in OV, BRCA, LUSC, HNSC, UCEC, BLCA, LUAD and STAD while highest CNV losses were observed in SARC, BLCA and ESCA (Figure 6).
Figure 6.
TC2N Somatic Mutations in Pan-Cancer. Mutation profiling of TC2N gene was undertaken using the GDC data portal. (A) Mutation map showing over all mutation burden of the TC2N gene in pan-cancer. (B) Pie chart describing types of 142 TC2N mutation in pan-cancer. (c) Percentage distribution of 142 TCN2 mutations in pan-cancer. (D) Percentage distribution of 743 CNVs in pan-cancer
Table 3.
Pathogenic Somatic Mutations in TC2N Gene in Pan-Cancer
| TCGA PROJECT | Genomic Position | Genetic Change | Type of Mutation | Protein Change | dbSNP ID/COSMIC ID |
|---|---|---|---|---|---|
| SKCM | 91802368 | G>A | Stop Gained | Q119* | rs766880081/COSM3498932 |
| 91802395 | G>A | Stop Gained | R110* | rs537836079,COSM2251654 | |
| 91785255 | C>T | Misssense | M4231I | -/COSM5722247 | |
| 91800291 | C>T | Missense | R184Q | rs753392127/COSM3498924 | |
| 91798325 | C>T | Misssense | E238K | -/COSM3498924 | |
| 91812422 | G>A | Misssense | S64F | -/COSM5540172 | |
| 91813715 | C>T | Misssense | E19K | -/COSM4896986 | |
| 91799039 | G>A | Misssense | P196L | -/COSM3498922 | |
| 91812464 | G>A | Misssense | S50F | -/COSM4894496 | |
| 91785227 | C>T | Misssense | E433K | -/COSM3498902 | |
| 91792368 | G>A | Misssense | S349F | -/COSM958780 | |
| 91802311 | G>A | Misssense | P138S | -/COSM3498930 | |
| 91797868 | C>T | Misssense | D258N | -/COSM3498912 | |
| 91812435 | C>T | Misssense | D60N | -/COSM3498936 | |
| 91799015 | T>C | Misssense | N204S | -/COSM3498918 | |
| 91812324 | C>T | Misssense | E97K | -/COSM3886531 | |
| 91802259 | C>T | Misssense | G155E | -/COSM3498926 | |
| UCEC | 91785197 | G>A | Stop Gained | R443* | -/COSM958774 |
| 91787558 | G>T | Misssense | L373I | -/COSM958776 | |
| 91783191 | C>T | Missense | S461N | -/COSM958772 | |
| 91802256 | G>A | Missense | S156L | rs377688531/COSM198287 | |
| 91813760 | C>A | Stop Gained | E4* | -/COSM958787 | |
| 91792368 | G>A | Missense | S349F | -/COSM958780 | |
| 91812414 | G>A | Missense | P67S | -/COSM958785 | |
| COAD | 91785218 | A>C | Missense | F436V | -/COSM277624 |
| 91802256 | G>A | Missense | S156L | rs37768531/COSM198287 | |
| 91785196 | C>T | Missense | R433Q | rs117153533/COSM3690239 | |
| 91792369 | A>G | Missense | S349P | -/COM270307 | |
| 91787582 | T>G | Missense | N365H | -/COSM285615 | |
| BLCA | 91787570 | G>C | Missense | Q369E | -/COSM3793949 |
| 91787540 | G>T | Missense | P379T | -/COSM3793947 | |
| 91812366 | A>G | Missense | S83P | -/COSM433482 | |
| BRCA | 91802333 | G>C | Missense | F130L | -/COSM1477845 |
| 91799030 | G>C | Missense | S199C | -/COSM3815523 | |
| 91812366 | A>G | Missense | S83P | -/COSM433482 | |
| CESC | 91792373 | T>G | Missense | K347N | -/COSM4840762 |
| LUAD | 91792510 | G>C | Missense | L302V | -/COSM3956286 |
| STAD | 91797805 | A>C | Missense | S279A | -/COSM4052997 |
| OV | 91787543 | G>A | Missense | L378F | -/COSM1323335 |
| LGG | 91802401 | C>T | Missense | G108R | -/COSM3968969 |
| LIHC | 91798996 | T>G | Missense | R210S | -/COSM4914987 |
| GBM | 91802256 | G>A | Missense | S156L | -/COSM198287 |
Discussion
Role of TC2N in cancers had been largely unaddressed until recently when it was identified as a novel oncogene in lung cancer where it works by inhibiting p53 signaling (Hao et al., 2019). Subsequently, the same group reported tumour suppressor role of TC2N in breast cancer (Hao et al., 2019). Nevertheless, role of TC2N in other caners remains unclear. In the study presented herein, we investigated molecular circuits of TC2N using the TCGA tumour data sets.
We found that TC2N mRNA expression was upregulated in CHOL, OV, READ, STAD and THYM. It has been recently reported that increased TC2N transcript expression promotes cell proliferation and inhibits tumour cell apoptosis in lung cancer (Hao et al., 2019). It is therefore possible that TC2N perform similar pro-tumour functions in 5 tumour types identified herein with high TC2N mRNA levels. We also report increased mRNA expression in all stages, nodal metastasis and various histological types for CHOL and STAD suggesting a role of TC2N in the degree of malignancy for these tumours. It is therefore highly relevant to further investigate these findings using appropriately designed in-vivo and/or in-vitro assays.
Levels of TC2N promoters were significantly higher in several cancers including the cancers for which we found downregulation of TC2N mRNA levels. Promoter hypermethylation is a key feature for transcriptional silencing of several genes in cancer (Park, 2010). In particular, tumour suppressor genes are silenced via hypermethylation in several caners (Nag and Yu, 2015). We also found TC2N promoter hypomethylation in HNSC and KIRC. There are evidence that hypomethylation may lead to increased genomic stability that may contribute towards carcinogenesis (Pfeifer, 2018). Moreover, DNA hypomethylation also leads to overexpression of proinvasive, antiapoptotic and angiogenic factors in prostate cancer (Vestergaar et al., 2010). In summary, TC2N promoter hyper and hypo-methylation are important findings of this study demanding further exploration.
Genes which with similar functions and correlation almost always perform coordinated functions (Lee et al., 2014). In this study, we investigated correlation between TC2N mRNA expression and various cancer genes. Interestingly, many of the tumour types showed strong +ve and +ve correlation between TC2N genes and genes in common cancer pathways including Myc pathway, cell cycle pathway, p53 pathway, Nrf2 pathway, Wnt pathway, Hippo pathway, TGFβ pathway, Notch pathway, PI3K pathway and RTK/RAS pathways. Some of the tumour types (such as DLBC and PRAD) showed +ve/strong +ve correlation of cancer causing genes with TC2N in almost all the cancer pathways investigated, strongly suggesting a potential role of TC2N in carcinogenesis of those tumours.
Functional protein partners of TC2N were identified as STX2, SMEK2, SMEK1, STXBP5, SCARA5, MMRN1, CATSPER2, CATSPERB, CLEC4M and STAB2. Amongst these, there are some that warrants further investigation to delineate their partnership with TC2N in tumour microenvironment. For example, CLEC4M expression is downregulated in hepatocellular carcinoma and this downregulation is believed to promote inflammation and metastasis of HCC (Jovel et al., 2018). We also report downregulation of TC2N transcription in PCPG, SKCM, THCA and UCS. Another TC2N partner protein, CATSPERB has been linked with lung cancer. In a recent study that recruited 28 highly-aggregated-extended-highrisk-familial-lung-cancer (HRFLC) families, highest cluster of genetic variants associated with lung cancer were identified within CATSPERB gene (14q32) (Musolf et al., 2019). SCARA5 plays an important role in tumourigenesis and metastasis of breast carcinoma by inhibiting ERK1/2, STAT3 and AKT pathways (You et al., 2017). Taken together, several TC2N functional protein partners are involved in carcinogenesis, suggesting similar function (s) of TC2N in tumourigenesis. These findings therefore demand further functional studies in order to investigate/validate tumourigenic role of TC2N in various cancers.
We identified a range of genetic alterations in the TC2N gene in several cancers. The highest pathogenic non-synonymous mutation rates were observed in SKCM, UCEC, COAD, BLCA and BRCA. Whether these genetic mutations are causative or a sequel of cancer processes needs to be investigated. It is important to note that cancer cells are susceptible to accumulate several mutations for multiple reasons such as increased cellular turnover, inflammatory tumour microenvironment, altered metabolic wiring, increased reactive oxygen species, increased susceptibility to DNA damage and decreased capacity of DNA damage repair amongst others (Loeb and Loeb, 2000; Hanahan and Weinberg, 2011; Fouad and Anani, 2017). Whether or not the mutations identified herein are passenger or driver mutations, needs to be explored further.
Taken together, data presented in this study highlight several novel avenues with respect to TC2N role in carcinogenesis. Off course, more clinical and basic studies are required to further validate the findings presented herein.
In conclusion, we present novel findings with respect to TC2N molecular circuitry in pan-cancer. Our analyses highlight potential role of TC2N in carcinogenesis of various cancers. Moreover, our findings also suggest TC2N interaction with many cancer genes in well-known cancer pathways. Taken together, we propose that TC2N may serve as an important player in carcinogenesis, prognosis and therapeutics of several cancers. It is therefore highly relevant to perform further clinical, in-vitro and/or in-vivo functional assays in order to validate these findings.
List of Abbreviations
ACC=adrenocortical carcinoma
BLCA=bladder urothelial carcinoma
BRCA=breast invasive carcinoma
CESC=cervical squamous cell carcinoma and endocervical adenocarcinoma
CHOL=cholangiocarcinoma
COAD=colon adenocarcinoma
DLBC=lymphoid neoplasm diffuse large B-cell lymphoma
ESCA=esophageal carcinoma
GBM=glioblastoma multiforme
HNSC=head and neck squamous cell carcinoma
KICH=kidney chromophobe
KIRC=kidney renal celar cell carcinoma
KIRP=kidney renal papillary cell carcinoma
LAML=acute myeloid leukemia
LGG=brain lower grade glioma
LIHC=liver hepatocellular
LUAD=lung adenocarcinoma
LUSC=lung squamous cell carcinoma
MESO=meshothelioma
OV=ovarian serious cystadenocarcinoma
PAAD=pancreatic adenocarcinoma
PCPG=pheochromocytoma and paraganlioma
PRAD=prostate adenocarcinoma
READ=rectum adenocarcinoma
SARC=sarcoma; SKCM=skin cutaneous melanoma
STAD=stomach adenocarcinoma
TGCT=testicular germ cell tumours
THCA=thyroid carcinoma
THYM=thymoma
UCEC=uterine corpus endometrial carcinoma
UCS=uterine carcinosarcoma
UVM=uveal melanoma
Acknowledgements
Not applicable.
Ethics approval and consent
Not applicable. We performed secondary analyses on the data from The Cancer Genome Atlas (TCGA) that is publically available at an open resource web platform, the Genomic Data Commons Data Portal” (https://portal.gdc.cancer.gov/).
Consent for publication
Not applicable.
Availability of data and materials
The datasets analyzed during the current study are available at the “Genomic Data Commons Data Portal” (https://portal.gdc.cancer.gov/).
Authors’ contribution
MAQ: inception of idea, data retrieval, data analyses, preparation of manuscript, implementation and supervision of the project and correspondence with the journal. SK: data retrieval, supervision of the project and manuscript drafting. ST: data analyses, preparation of figures. SAS: data retrieval, manuscript drafting. IDU: critical proof reading of the manuscript and data analyses. AL: generation of tables and analyses of expression data. SS: manuscript drafting and proof reading. All authors proof read and agreed to the final content of the manuscript.
Competing interests
The authors declare that they have no competing interests.
References
- Blomme A, Costanza B, de Tullio P, et al. Myoferlin regulates cellular lipid metabolism and promotes metastases in triple negative breast cancer. Oncogene. 2017;36:2116–30. doi: 10.1038/onc.2016.369. [DOI] [PubMed] [Google Scholar]
- Chandrashekar DS, BAshel B, Balasubramanya SAH, et al. A portal for facilitating tumour subgroup gene expression and survival analyses. Neoplasia. 2017;19:649–58. doi: 10.1016/j.neo.2017.05.002. [DOI] [PMC free article] [PubMed] [Google Scholar]
- Corbalan-Garcia S, Gomez Ferndandez JC. Signalling through C2 domains: more than one lipid target. Biochim Biophys Acta. 2014;1838:1536–47. doi: 10.1016/j.bbamem.2014.01.008. [DOI] [PubMed] [Google Scholar]
- Duncan RR, Shipston MJ, Chow RH. Double C2 protein. A Review. Biochimie. 2000;82:421–6. doi: 10.1016/s0300-9084(00)00214-5. [DOI] [PubMed] [Google Scholar]
- Farah CA, Sossin Ws. The role of C2domains in PKC signaling. Adv Exp Med Biol. 2012;740:663–83. doi: 10.1007/978-94-007-2888-2_29. [DOI] [PubMed] [Google Scholar]
- Fouad YA, Anani C. Revisiting the hallmarks of cancer. Am J Can Res. 2017;7:1016–36. [PMC free article] [PubMed] [Google Scholar]
- Fukuda M, Mikoshiba K. Tac2-N, an atypical C-type tandem C2 protein localized in nucleus. FEBS Lett. 2001;503:217–8. doi: 10.1016/s0014-5793(01)02738-7. [DOI] [PubMed] [Google Scholar]
- Hanahan D, Weinberg RA. Hallmarks of cancer: the next generation. Cell. 2011;144:646–74. doi: 10.1016/j.cell.2011.02.013. [DOI] [PubMed] [Google Scholar]
- Hao XL, Han F, Zhang N, et al. TC2N, a novel oncogene, accelerates tumour progression by suppressing p53 signalling pathway in lung cancer. Cell Death Differentiation. 2019;26:1235–50. doi: 10.1038/s41418-018-0202-8. [DOI] [PMC free article] [PubMed] [Google Scholar]
- Hao X, Gao L, Deng X, et al. Identification of TC2N as a novel promising suppressor of PI3K-AKT signaling in breast cancer. Cell Death Dis. 2019;10:424. doi: 10.1038/s41419-019-1663-5. [DOI] [PMC free article] [PubMed] [Google Scholar]
- Huang WY, Hsu SD, Huang HY, et al. MethHC: a database of DNA methylation and gene expression in human cancer. Nucleic Acid Res. 2015;43:D856–861. doi: 10.1093/nar/gku1151. [DOI] [PMC free article] [PubMed] [Google Scholar]
- Jovel J, Lin Z, O’keefe S, et al. A survey of molecular heterogeneity in hepatocellular carcinoma. AASL. 2018 doi: 10.1002/hep4.1197. Doi: 10.1002/hep4.1197. [DOI] [PMC free article] [PubMed] [Google Scholar]
- Kabekkodu SP, Bhat S, Radhakrishnan R, et al. DNA promoter methylation dependent transcription of the double C2 like domain beta (DOC2B) gene regulates tumour growth in human cervical cancer. J Biol Chem. 2014;289:10637–49. doi: 10.1074/jbc.M113.491506. [DOI] [PMC free article] [PubMed] [Google Scholar]
- Lee HK, Hsu AK, Sajdak J, Qin J, Pavlidis P. Coexpression analysis of human genes across many microarray data sets. Genome Res. 2014;14:1085–94. doi: 10.1101/gr.1910904. [DOI] [PMC free article] [PubMed] [Google Scholar]
- Liu J, Lichtenberg T, Hoadley KA, et al. An integrated TCGA Pan-Cancer clinical data resource to drive high quality survival outcome analytics. Cell. 2018;173:400–16. doi: 10.1016/j.cell.2018.02.052. [DOI] [PMC free article] [PubMed] [Google Scholar]
- Loeb KR, Loeb LA. Significance of multiple mutations in cancer. Carcinogenesis. 2000;21:379–85. doi: 10.1093/carcin/21.3.379. [DOI] [PubMed] [Google Scholar]
- Musolf A, Sun H, Moiz B, Claudio P. Familial lung cancer exhibits multiple novel linked haplotypes within pedigrees. AACR Annual Meeting (conference paper) 2019;2019 Doi:10.1158/1538-7445.AM2019-4176. [Google Scholar]
- Ng JM, Yu J. promoter hypermethylation of tumour suppressor genes as potential biomarkers in colorectal cancer. Int J Mol Sci. 2015;16:2472–96. doi: 10.3390/ijms16022472. [DOI] [PMC free article] [PubMed] [Google Scholar]
- Park JY. Promoter hypermethylation in prostate cancer. Cancer Control. 2010;17:245–55. doi: 10.1177/107327481001700405. [DOI] [PMC free article] [PubMed] [Google Scholar]
- Pfeifer GP. Defining driver methylation changes in human cancer. Int J Mol Sci. 2018;19:1166. doi: 10.3390/ijms19041166. [DOI] [PMC free article] [PubMed] [Google Scholar]
- Shihab HA, Rogers MF, Gough J, et al. An interactive approach to predicting the functional consequences of non-coding and coding sequence variation. Bioinformatics. 2015;31:1536–43. doi: 10.1093/bioinformatics/btv009. [DOI] [PMC free article] [PubMed] [Google Scholar]
- Szklarcyzk D, Gable AL, LyonD , et al. STRING v11:protein-protein association networks with increased coverage, supporting functional discovery in genome-wide experimental datasets. Nucleic Acid Res. 2019;47:607–13. doi: 10.1093/nar/gky1131. [DOI] [PMC free article] [PubMed] [Google Scholar]
- Tang ZF, Li CW, Kang BX, et al. A web server for cancer and normal gene expression profiling and interactive analyses. Nucleic Acid Re. 2017;45:98–102. doi: 10.1093/nar/gkx247. [DOI] [PMC free article] [PubMed] [Google Scholar]
- Vestergaard EM, Nexo E, Torring N, et al. Promoter hypomethylation and upregulation of trefoil factors in prostate cancer. Int J Cancer. 2010;127:1857–65. doi: 10.1002/ijc.25209. [DOI] [PubMed] [Google Scholar]
- You K, Su F, Lv X, et al. SCARA5 plays a critical role in the progression and metastasis of breast cancer by inactivating the ERK1/2, STAT3,and Kat signaling pathways. Mol Cell Biochem. 2017;435:47–58. doi: 10.1007/s11010-017-3055-4. [DOI] [PubMed] [Google Scholar]
Associated Data
This section collects any data citations, data availability statements, or supplementary materials included in this article.
Data Availability Statement
The datasets analyzed during the current study are available at the “Genomic Data Commons Data Portal” (https://portal.gdc.cancer.gov/).


