Abstract
Obesity is associated with insulin resistance, an important risk factor of type 2 diabetes, atherogenic dyslipidemia, and nonalcoholic fatty liver disease. The major purpose of this study was to test hypothesize that prophylactic removal of epididymal visceral adipose tissue (VAT) prevents obesity-induced multi-organ (liver, skeletal muscle, adipose tissue) insulin resistance. Accordingly, we surgically removed epididymal VAT pads from adult C57BL/6J mice and evaluated in vivo and cellular metabolic pathways involved in glucose and lipid metabolism following chronic high-fat diet (HFD) feeding. We found that VAT removal decreases HFD-induced body weight gain while increasing subcutaneous adipose tissue (SAT) mass. Strikingly, VAT removal prevents obesity-induced insulin resistance and hyperinsulinemia and markedly enhances insulin-stimulated AKT-phosphorylation at serine-473 (Ser473) and threonine-308 (Thr308) sites in SAT, liver, and skeletal muscle. VAT removal leads to decreases in plasma lipid concentrations and hepatic triglyceride (TG) content. In addition, VAT removal increases circulating adiponectin, a key insulin-sensitizing adipokine, whereas it decreases circulating interleukin 6, a pro-inflammatory adipokine. Consistent with these findings, VAT removal increases adenosine monophosphate–activated protein kinase C phosphorylation, a major downstream target of adiponectin signaling. Data obtained from RNA sequencing suggest that VAT removal prevents obesity-induced oxidative stress and inflammation in liver and SAT, respectively. Taken together, these findings highlight the metabolic benefits and possible action mechanisms of prophylactic VAT removal on obesity-induced insulin resistance and hepatosteatosis. Our results also provide important insight into understanding the extraordinary capability of adipose tissue to influence whole-body glucose and lipid metabolism as an active endocrine organ.
Keywords: obesity, insulin resistance, adipose tissue, adipokine, adiponectin, free fatty acids
Obesity is associated with increased risk of insulin resistance, which is a critical pathological condition involved in type 2 diabetes, atherogenic dyslipidemia, nonalcoholic fatty liver disease (NAFLD), inflammation, and cardiovascular disease [1,2]. Visceral adipose tissue (VAT) accumulation is strongly related to insulin resistance in people with obesity. For example, data obtained from large population-based studies, such as Framingham Heart Study and Dallas Heart Study, have shown that VAT mass is correlated with insulin resistance to a greater extent than total body fat mass [3,4]. Accordingly, waist circumference, which may reflect the VAT mass, is widely used as an independent predictor of insulin resistance and other cardiovascular abnormalities [5]. The mechanism linking VAT and insulin resistance is unclear, but could involve the endocrine function of VAT.
Adipose tissue secretes many bioactive adipokines and lipids implicated in whole-body glucose metabolism and insulin sensitivity [6-10], such as adiponectin, interleukin 6 (IL-6), leptin, monocyte chemoattractant protein-1 (MCP-1), and free fatty acids (FFA) [6,7]. It has been postulated that VAT is a major source of circulating pro-inflammatory adipokines, such as IL-6 and MCP-1 [11,12], whereas VAT mass is inversely correlated with a key insulin-sensitizing adipokine, adiponectin [13]. The alterations in VAT-derived adipokines could cause obesity-induced multi-organ insulin resistance. In addition, VAT is known to show higher lipolytic activity and greater FFA release into the portal vein and systemic circulation than subcutaneous adipose tissue (SAT) [14,15]. Thus, elevated FFA concentrations due to lipolysis of VAT TGs could also contribute to obesity-induced insulin resistance in liver and skeletal muscle [16,17], although controversy exists regarding the contribution of VAT lipolysis in systemic FFA availability in people [18,19].
Taken together, these findings underscore the importance of VAT as a therapeutic target for treating obesity-induced insulin resistance and other systemic metabolic complications. Indeed, previous studies have shown that postemptive VAT removal depots treats insulin resistance and hepatosteatosis, improves lipid metabolism, increases plasma adiponectin concentration, and decreases markers of inflammation in obese rodents [20-26], although there have been contradictory reports regarding the effects of VAT removal on metabolic function in people with obesity [27,28]. On the other hand, only 1 study to date has reported the benefits of pre-emptive VAT removal on hepatic insulin resistance in rats at the very early stage (3 days after obesogenic diet initiation) of diet-induced obesity [29]. Thus, the preventive effects and action mechanisms of VAT removal on diet-induced obesity and multi-organ insulin resistance remain largely elusive.
The major purpose of the present study was to test the hypothesis that prophylactic VAT removal increases plasma adiponectin concentration, decreases pro-inflammatory adipokines, and prevents obesity-induced multi-organ (liver, skeletal muscle, and adipose tissue) insulin resistance and other systemic metabolic complications, such as hyperinsulinemia, hepatosteatosis, and inflammation. To test this hypothesis, we surgically removed epididymal VAT pads from adult male C57BL6/J mice prior to the initiation of HFD and then evaluated in vivo metabolic pathways involved in glucose and lipid metabolism, such as insulin sensitivity, glucose tolerance, plasma concentrations of insulin and several key adipokines (adiponectin, IL-6, leptin, MCP-1), and plasma and tissue lipid profiles, after 8 weeks of HFD challenge. In addition, we determined the putative action mechanisms of VAT removal by using targeted (insulin signaling) and untargeted approaches [RNA sequencing (RNA-seq)].
Materials and Methods
Animal experimentation
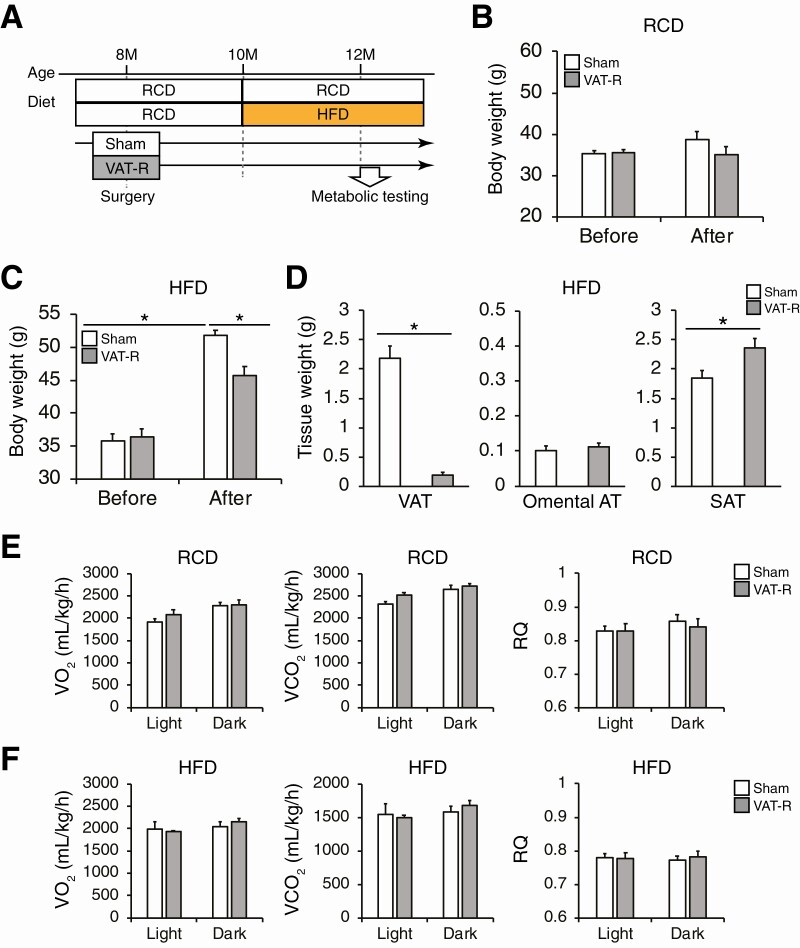
The overall study design is summarized in Figure 1A. C57BL/6J male mice (#000664) were purchased from the Jackson Laboratory (Bar Harbor, ME, USA). All mice were housed in a barrier facility with 12-h light/12-h dark cycles and were allowed free access to a regular-chow diet (RCD) (LabDiet 5053; LabDiet, St. Louis, MO, USA) and water. At 8 to 9 months of age, mice were assigned to sham operation and VAT removal operation groups (described in the following text). For a HFD study, mice were placed on a HFD (45% kcal from fat) (Research Diets D12451; Research Diets, Inc, New Brunswick, NJ, USA) ad libitum. Tissue samples were collected, immediately frozen in liquid nitrogen, and stored at −80°C until analyses. All animal studies were approved by the Washington University Institutional Animal Care and Use Committee.
Figure 1.
VAT removal prevents high-fat diet (HFD)-induced weight gain. (A) Overall study design (see the details in Materials and Methods). At 8 to 9 months of age, C57BL/6J male mice were assigned to sham operation and epididymal visceral adipose tissue (VAT) removal operation groups. Mice were fed either a regular-chow diet (RCD) or HFD after surgery. Body weight was measured in sham and VAT-removed (VAT-R) mice before surgery and 2 months after RCD (n = 5-6 per group) (B) and HFD feeding (n = 11-12 per group) (C). (D) Tissue weight of VAT, omental AT, and inguinal subcutaneous adipose tissue (SAT) were determined 3 months after HFD feeding (n = 5-12 per group). Whole-body oxygen consumption (VO2), carbon dioxide production (VCO2), and respiratory quotient (RQ) were evaluated in 12- to 13-month-old sham and VAT-R mice under RCD (E) and HFD (F) conditions (n = 4 per group). Values are means ± SEM. Data were analyzed by 1-way analysis of variance with the Tukey’s post-hoc test (B and C) and Student’s unpaired t-test (D). *P < 0.05.
Epididymal VAT removal surgery
Mice were anesthetized by using isoflurane. After the abdominal cavity was opened, epididymal visceral fat pads were removed and weighted (1.13 ± 0.13 g). Specifically, we carefully avoided damage to blood vessels and other organs, such as intestine and testis, as previously described [22]. Sham operation consisted of abdominal incision without fat pads removal. Following the sutures, topical antibiotic ointment was administered at the surgical site and a dosage of Buprenorphine-SR analgesic (1.0 mg/kg body weight) was injected subcutaneously. Operated mice were allowed to recover from surgery and fed a RCD. In the RCD group, mice were subjected to metabolic testing at 12 months of age. In the HFD group, mice were switched from RCD to HFD feeding at 10 months of age and subjected to metabolic testing at 12 months of age (approximately 2 months after HFD feeding).
Glucose metabolism
After mice were fasted for approximately 15 h, 50% dextrose solution (2 g/kg-body weight) was injected intraperitoneally for intraperitoneal glucose tolerance tests (IPGTTs). Tail blood was taken at 0, 15, 30, 60, and 120 min, and glucose levels were determined using the Accu-Chek II glucometer (Roche Diagnostics, Indianapolis, IN, USA) as we previously described [30-32]. For insulin tolerance tests (ITTs), mice were injected with human insulin (0.75 U/kg-body weight; Lilly, Indianapolis, IN, USA) after they were fasted for approximately 4 h. Blood glucose levels were measured at 0, 15, 30, 45, and 60 min after insulin injection. Blood samples were also collected for plasma insulin measurements with the Erenna immunoassay system (Singulex, Alameda, CA, USA) at the Washington University Core Laboratory for Clinical Studies.
Energy metabolism
The rates of whole-body oxygen consumption (VO2) and CO2 production (VCO2) were determined by using a Phenomaster system (TSE Systems, Bad Homburg, Germany) at the Washington University Diabetes Models Phenotyping Core of the Diabetes Research Center as previously described [30,31]. Respiratory quotient, also known as respiratory exchange ratio, was calculated as the ratio of VCO2 to VO2 (VCO2/VO2). VO2 and VCO2 values were normalized by total body weight. Food intake was monitored in caged mice for approximately 5 weeks and normalized by body weight.
Western blot analyses of insulin signaling
For the assessment of in vivo insulin signaling, sham and VAT removed (VAT-R) mice were fasted for 4 h and then intraperitoneally injected with a bolus of phosphate-buffered saline (−) or insulin (10 U/kg body weight). After 15 min, mice were sacrificed and SAT, liver, and skeletal muscle were collected. Tissue samples were homogenized in lysis buffer containing protease and phosphatase inhibitor cocktail, and proteins were extracted as described previously [30-34]. Extracted protein samples were loaded onto polyacrylamide gels, separated by sodium dodecyl sulphate–polyacrylamide gel electrophoresis, and transferred to polyvinylidene difluoride membranes. The blotted membranes were incubated with the following primary antibodies: rabbit monoclonal anti-phospho-AKT (Ser473) (#4060; Cell Signaling Technology) [35], rabbit monoclonal anti-phospho-AKT (Thr308) (#4056; Cell Signaling Technology) [36], rabbit monoclonal anti-AKT (#9272; Cell Signaling Technology) [37], rabbit monoclonal anti-phospho-adenosine monophosphate–activated protein kinase C (AMPK) α (Thr172) (#2535; Cell Signaling Technology) [38], and rabbit monoclonal anti-AMPKα (#5831; Cell Signaling Technology) [39]. Secondary antibody was a horseradish peroxidase–linked anti-rabbit antibody (#7074; Cell Signaling Technology) [40]. Blots were developed by using the SignalFire Elite ECL Reagent (#12757; Cell Signaling Technology). Western blot densitometry was quantitated using ImageJ software (NIH ImageJ 1.52q; http://imagej.nih.gov/ij) [41].
Measurements of plasma and tissue lipids
Blood samples were collected from the tail vein after overnight fasting. Plasma concentrations of total cholesterol (TC), TG, and FFA, were determined at the Washington University Animal Model Research Core as previously described [30-32]. Tissue TG contents were determined by the Infinity Triglyceride Reagent (Thermo Scientific, Hudson, NH, USA), and data were normalized by tissue weight.
Histological assessments
For the histological assessments, tissue samples were fixed in formalin and embedded in paraffin at the Advanced Imaging and Tissue Analysis Core of the Washington University Digestive Disease Research Core Center. Hematoxylin-eosin section were used to evaluate fat content and NAFLD activity score (steatosis + inflammation + ballooning) as previously described [42].
Plasma adipokines measurements
Plasma concentrations of adiponectin, IL-6, leptin, and MCP-1 were determined by the Mouse Adiponectin/Acrp30 Quantikine ELISA kit (#MRP300; R&D Systems, Minneapolis, MN, USA) [43], Mouse IL-6 Quantikine ELISA kit (#M6000B; R&D Systems), Mouse/Rat Leptin Quantikine ELISA Kit (#MOB00; R&D Systems) [44], and Mouse CCL2/JE/MCP-1 Quantikine ELISA Kit (#MJE00B; R&D Systems), respectively.
RNA sequencing
Total RNA was isolated from liver and SAT by using TRIzol Reagent (#15596018; Invitrogen) and RNeasy Mini Kit (#74104; Qiagen, Chatsworth, CA, USA), respectively. Library preparation was performed with 1 μg of total RNA after integrity was determined using an Agilent bioanalyzer (Agilent Technologies Palo Alto, CA, USA). Ribosomal RNA was removed by a hybridization method using Ribo-ZERO kits (Illumina, San Diego, CA, USA). Messenger RNA was reverse transcribed to yield complimentary DNA using SuperScript III RT enzyme (Life Technologies, Gaithersburg, MD, USA) and random hexamers. Complimentary DNA fragments were sequenced on an Illumina NovaSeq S4 2 × 150. P-value and false discovery rate (FDR) for each gene was calculated by using the edgeR R Bioconductor package. The FDR < 0.1 was used to identify differentially expressed genes (DEGs). Functional enrichment analyses were performed on DEGs using the Database for Annotation, Visualization, and Integrated Discovery (DAVID) Bioinformatics Resources 6.8 (http://david.abcc.ncifcrf.gov/) [45] with gene ontology (GO) biological process and direct and molecular function categories as we previously described [30]. GO terms with a FDR < 5% were considered to be significantly enriched. Redundant GO terms were then removed by REVIGO program (http://revigo.irb.hr/) [46]. All RNA-seq data used in this study have been deposited into the National Center for Biotechnology Information Gene Expression Omnibus database under accession number GSE157798 [47].
Statistical analysis
Differences between 2 groups were assessed by using Student’s unpaired t-tests. Differences in continuous metabolic parameters (eg, glucose values during the ITTs) were evaluated by using repeated-measures analyses of variance. Comparisons between multiple groups were performed using 1-way analysis of variance with the Tukey’s post hoc test. Pearson’s correlation analysis was used to examine correlations between plasma adiponectin concentration and SAT mass. Data are reported as means ± SEM. A P-value less than 0.05 was considered statistically significant. Statistical analyses were performed by using SPSS (version 26, IBM, Armonk, NY, USA) [48].
Results
VAT removal prevents obesity-induced multi-organ insulin resistance
VAT-R mice did not alter body weight under an RCD condition, compared to sham mice (Fig. 1B). In contrast, VAT removal significantly decreased body weight under a HFD condition without any alteration in daily food intake (sham = 0.058 ± 0.002; VAT-R = 0.058 ± 0.002 g/g body weight, P = 0.84) (Fig. 1C). In addition, HFD-fed VAT-R mice had a marked reduction in epididymal VAT mass and a significant increase in inguinal SAT mass (Fig. 1D). However, VAT removal did not affect omental fat mass under a HFD condition (Fig. 1D). VAT removal had minimal impact on VO2, VCO2, and respiratory quotient (Fig. 1E and 1F).
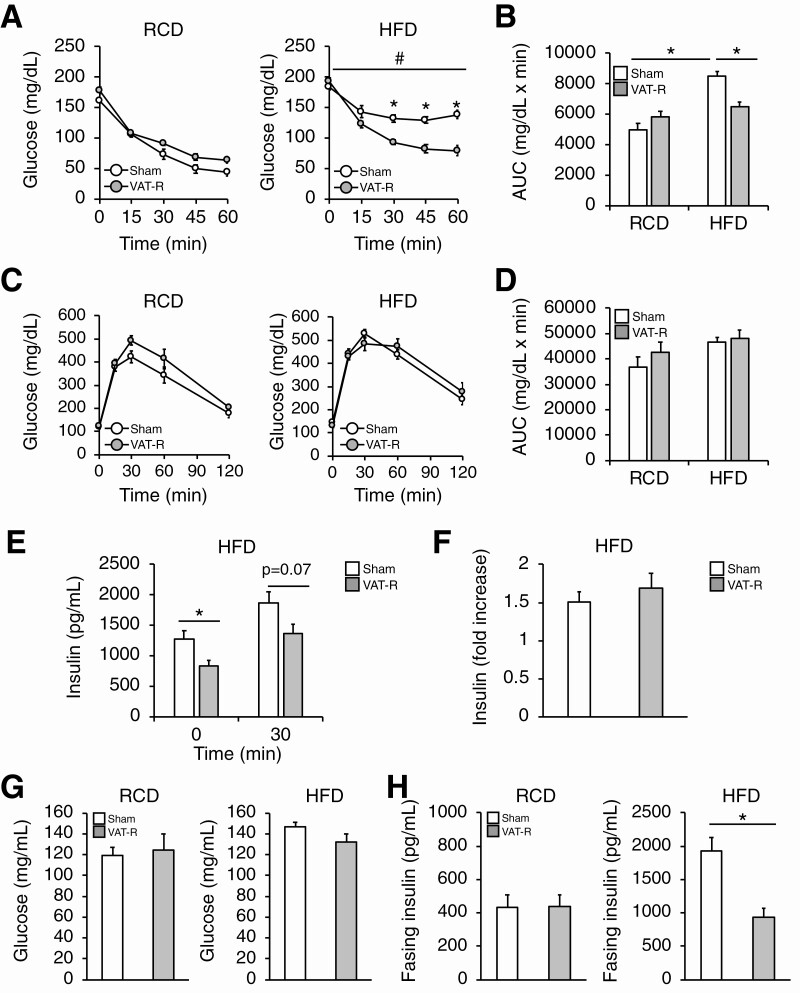
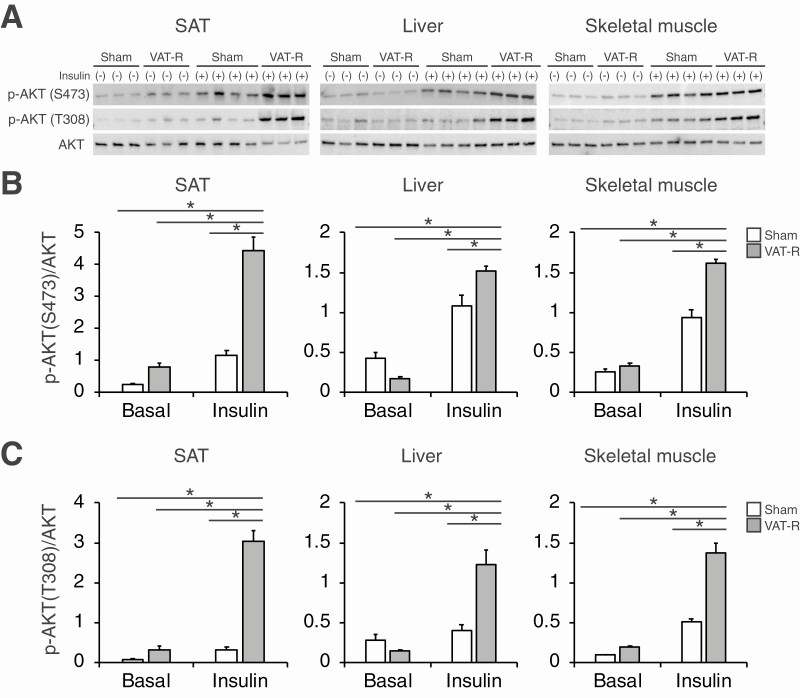
Data obtained from ITTs demonstrate that prophylactic VAT removal did not affect insulin sensitivity under a RCD condition (Fig. 2A and 2B). Although HFD feeding induced severe insulin resistance in sham mice, VAT removal markedly improved and nearly normalized insulin sensitivity under a HFD condition (Fig. 2A and 2B). Although VAT removal did not affect blood glucose levels during the intraperitoneal glucose tolerance tests (Fig. 2C and 2D), it decreased plasma insulin concentrations without changing the insulin response to a glucose challenge (Fig. 2E and 2F). Taken together, these findings indicate that VAT removal improves insulin sensitivity but not β-cell function. Consistent with these findings, VAT removal tended to decrease fasting glucose concentration and markedly reduced fasting insulin concentration under a HFD but not an RCD condition (Fig. 2G and 2H). VAT removal, compared to sham operation, markedly increased insulin-stimulated AKT phosphorylation at both Ser473 and Thr308 sites in key insulin-sensitive organs, including SAT, liver, and skeletal muscle, under a HFD condition (Fig. 3). Taken together, these results demonstrate that VAT removal prevents obesity-induced multi-organ insulin resistance.
Figure 2.
VAT removal prevents obesity-induced insulin resistance. Insulin tolerance tests (ITTs) and intraperitoneal glucose tolerance tests (IPGTTs) were conducted in 12- to 13-month-old mice under RCD (n = 4-6 per group) and HFD conditions (n = 11 per group). (A) After a 4-h fasting period, mice were intraperitoneally injected with insulin (0.75 U/kg body weight), and blood glucose concentration was measured. (B) The area under the curves (AUC) during the ITTs were determined. (C) After overnight fasting, mice were intraperitoneally injected with dextrose (2 g/kg body weight) and blood glucose concentration was measured. (D) The area under the curves (AUC) during the IPGTTs were determined. Plasma insulin concentrations before (0 min) and 30 min after the intraperitoneal injection of glucose (E) and fold-increase in plasma insulin concentration (F) were determined in HFD-fed mice (n = 6–7 per group). Fasting blood glucose (G) and insulin (H) concentrations were evaluated in sham and VAT-R mice under RCD (n = 5-6 per group) and HFD conditions (n = 10-12 per group). Values are means ± SEM. #Analysis of variance revealed a significant group × time interaction (P < 0.05). Data were analyzed by Student’s unpaired t test (A, E, F, G, H) and 1-way analysis of variance with the Tukey’s post-hoc test (B). *P < 0.05.
Figure 3.
VAT removal enhances insulin signaling in SAT, liver, and skeletal muscle. (A) Insulin signaling in subcutaneous adipose tissue (SAT), liver, and skeletal muscle were evaluated in HFD-fed sham and VAT-R mice (n = 3-4 per group). Mice were intraperitoneally injected with phosphate-buffered saline (−) or insulin (10 U/kg body weight) following a 4-h fasting. After 15 min, mice were sacrificed and tissue samples were collected. Phosphorylated AKT (p-AKT) on Serine473 (S473) and Threonine308 (T308) and total AKT protein were evaluated by Western blot. Densitometric analyses of p-AKT S473 (B) and p-AKT T308 (C) relative to total AKT. Values are means ± SEM. Data were analyzed by 1-way analysis of variance with the Tukey’s post-hoc test. *P < 0.05.
VAT removal improves whole-body lipid metabolism under HFD condition
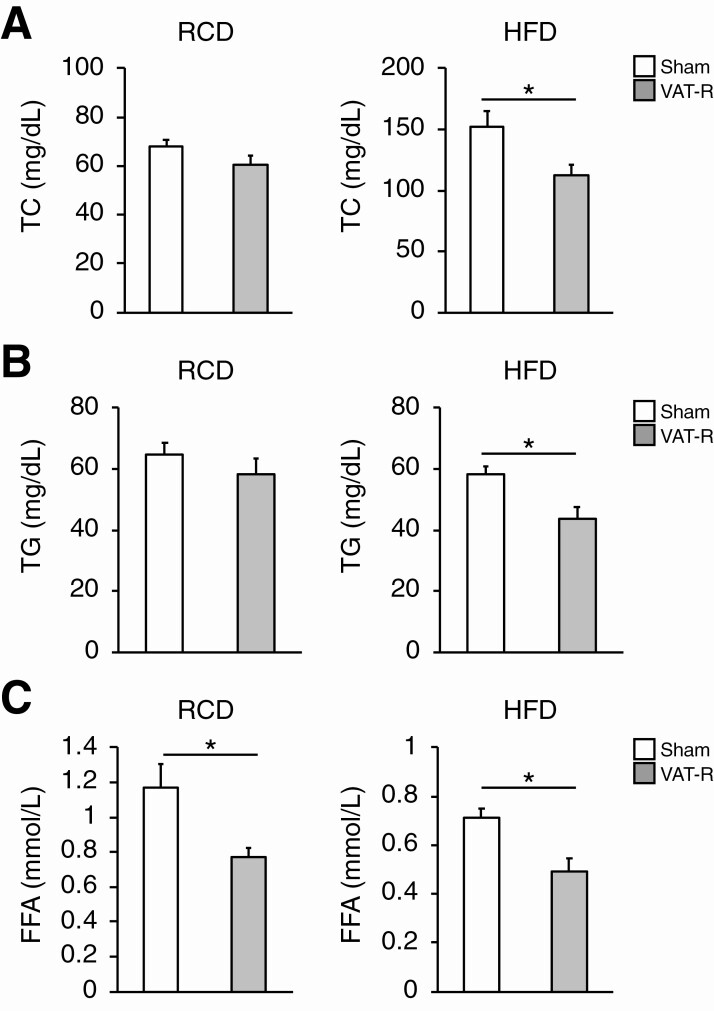
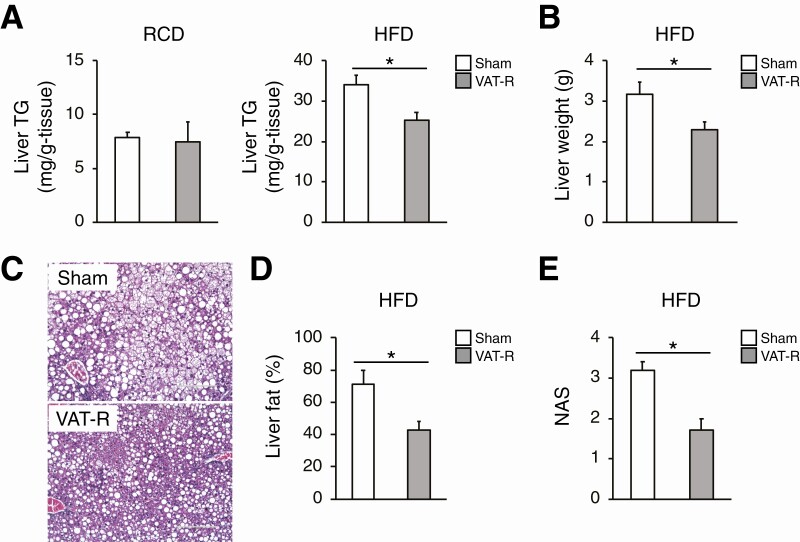
We next evaluated the effects of VAT removal on lipid metabolism, which is a key determinant of glucose metabolism and insulin sensitivity. Compared to sham mice, VAT-R mice had decreases in fasting plasma concentrations of TC and TG under a HFD but not an RCD condition (Fig. 4A and 4B). VAT removal decreased fasting plasma FFA concentration under both RCD and HFD conditions (Fig. 4C). In addition, VAT-R mice had a marked decrease in hepatic TG content under a HFD but not an RCD condition (Fig. 5A). VAT removal also resulted in a decrease in liver weight (Fig. 5B). Histological examination confirmed that VAT removal prevents HFD-induced hepatosteatosis and reduces hepatic lipid content and NAFLD activity score (Fig. 5C-5E). Taken together, these findings suggest that VAT removal improves whole-body lipid metabolism under the HFD condition.
Figure 4.
VAT removal improves plasma lipid profiling under HFD condition. Twelve- to 13-month-old sham and VAT-R mice were fasted overnight and plasma concentrations of total cholesterol (TC) (A), triglyceride (TG) (B), and free fatty acids (FFA) (C) in sham and VAT-R mice under RCD (n = 5-6 per group) and HFD conditions (n = 10-11 per group) were measured. Values are means ± SEM. *Data were analyzed by Student’s unpaired t-test (P < 0.05).
Figure 5.
VAT removal prevents HFD-induced hepatosteatosis. (A) Hepatic TG content in 12- to 13-month-old sham and VAT-R mice under RCD (n = 5 per group) and HFD conditions (n = 5–7 per group). (B) Liver weight in HFD-fed sham and VAT-R mice (n = 5-7 per group). (C) Representative hematoxylin and eosin staining images of liver from HFD-fed sham and VAT-R mice. Liver fat content (%) (D) and NAFLD activity score (NAS) (E) were determined by analyzing the hematoxylin- and eosin-stained section (n = 5-7 per group). Values are means ± SEM. *Data were analyzed by Student’s unpaired t-test (P < 0.05).
VAT removal affects circulating adipokines involved in glucose and lipid metabolism
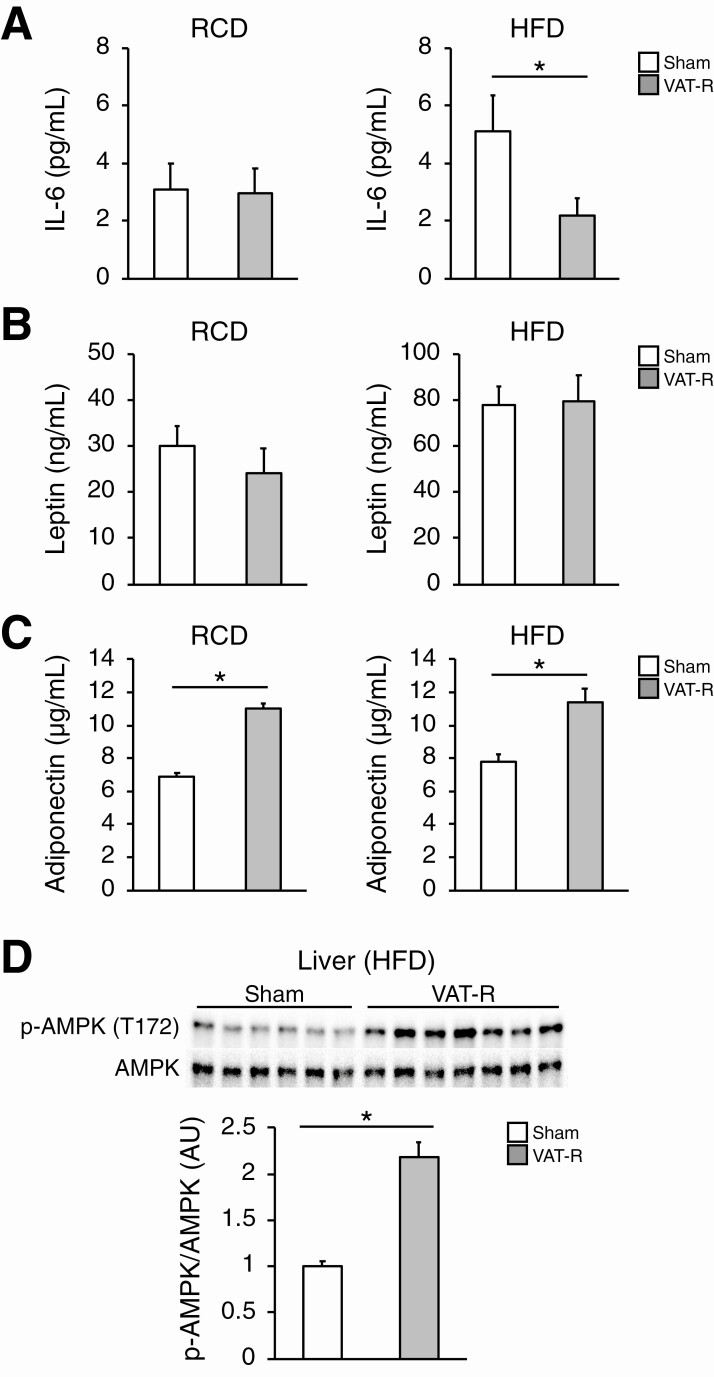
Given the systemic metabolic benefits induced by VAT removal, we next hypothesized that VAT removal affects plasma concentrations of key adipokines involved in whole-body glucose and lipid metabolism. Plasma concentration of IL-6, a proinflammatory adipokine implicated in the pathogenesis of insulin resistance, was markedly reduced after VAT removal under a HFD condition (Fig. 6A). However, VAT removal did not significantly affect plasma concentrations of other pro-inflammatory adipokines, such as leptin and MCP-1 (Fig. 6B, data not shown). In addition, VAT removal lead to marked increases in plasma concentrations of adiponectin, a key insulin-sensitizing adipokine, under both RCD and HFD conditions (Fig. 6C). Plasma adiponectin concentration was strongly associated with SAT mass (R = 0.73, P < 0.01), indicating SAT could be a major source of circulating adiponectin in HFD-fed VAT-R mice. Consistent with these findings, VAT removal significantly increased hepatic AMPK-phosphorylation at Thr172, a major downstream mediator of adiponectin signaling involved in glucose and lipid metabolism [8], under a HFD condition (Fig. 6D).
Figure 6.
Effects of VAT removal on key adipokines. Plasma concentrations of IL-6 (A), leptin (B), and adiponectin (C) were determined in 12- to 13-month-old sham and VAT-R mice under RCD and HFD conditions (n = 5-7 per group). (D) Western blot analysis of phosphorylated AMPK on Threonine172 (p-AMPK T172) and total AMPK in liver obtained from HFD-fed sham and VAT-R mice (n = 6-7 per group). Densitometric analysis of p-AMPK normalized to total AMPK is shown. Values are means ± SEM. *Data were analyzed by Student’s unpaired t-test (P < 0.05).
VAT removal changes genes and metabolic pathways involved in oxidative stress and inflammation in liver and SAT, respectively
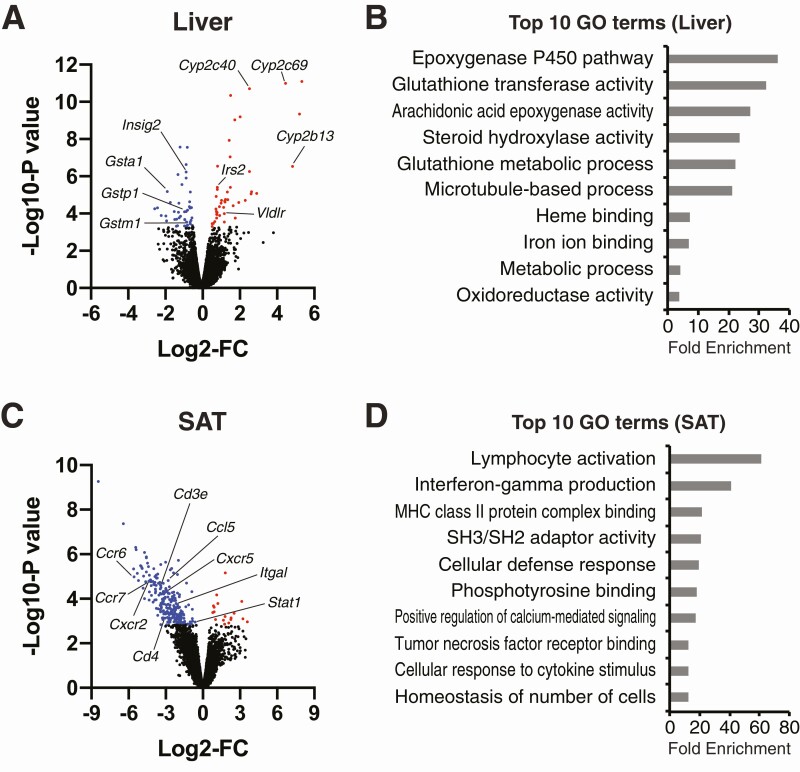
We determined the effects of VAT removal on liver and SAT gene expression profiling by RNA-seq and explored potential action mechanisms of VAT removal. Data obtained from RNA-seq analysis show that 89 genes were identified in the liver as DEGs (Fig. 7A). DEGs were primarily enriched with the biological pathways involved in regulating detoxification, stress responses, and metabolism (eg, epoxygenase P450 pathway, glutathione transferase activity, oxidoreductase activity, metabolic process) (Fig. 7B). Upregulated DEGs involve cytochrome P450 enzymes (eg, Cyp2a22, Cyp2c69, Cyp2c40, Cyp2b13), major regulators of detoxification function, whereas downregulated DEGs involve markers of oxidative stress (eg, Gstma1, Gstp1, Gstm1, Gclc) (Fig. 7A). Consistent with insulin signaling results (Fig. 3), VAT removal significantly increased gene expression of insulin receptor substrate 2, a positive regulator of hepatic AKT insulin signaling [49], whereas it decreased gene expression of insulin induced gene 2, which is known to be suppressed by insulin-stimulated AKT activation [50] (Fig. 7A).
Figure 7.
Effects of VAT removal on gene expression profiling in liver and SAT. RNA-sequencing of liver (A and B) and SAT (C and D) obtained from sham and VAT-R mice under a HFD condition (n = 5 per group). (A and C) Volcano plots of RNA-seq data with log2-fold change (FC) (X-axis) and -log10-P-value (Y-axis). Up- and downregulated differentially expressed genes (DEGs) between HFD-fed sham and VAT-R mice are shown as red and blue dots, respectively. (B and D) The DAVID Bioinformatics Resources identified biological pathways significantly enriched with DEGs. The top 10 Gene Ontology terms ranked by fold-enrichment are shown.
Finally, data obtained from RNA-seq analysis of SAT found that VAT removal significantly affected 260 genes (Fig. 7C). Downregulated DEGs involve numerous markers of inflammation and immune cells (eg, Ccl5, Ccr6, Ccr7, Cxcr2, Cxcr5, Cd3e, Cd4, Itgal, Stat1) (Fig. 7C). DEGs were highly enriched in the biological pathways involved in immune function and inflammatory response (eg, lymphocyte activation, cellular defense response, cellular response to cytokine stimulus) (Fig. 7D). Taken together, these results suggest that VAT removal inhibits obesity-induced oxidative stress and inflammation in liver and SAT, respectively, which could explain the mechanisms responsible for the preventive effects of VAT removal on obesity-induced insulin resistance.
Discussion
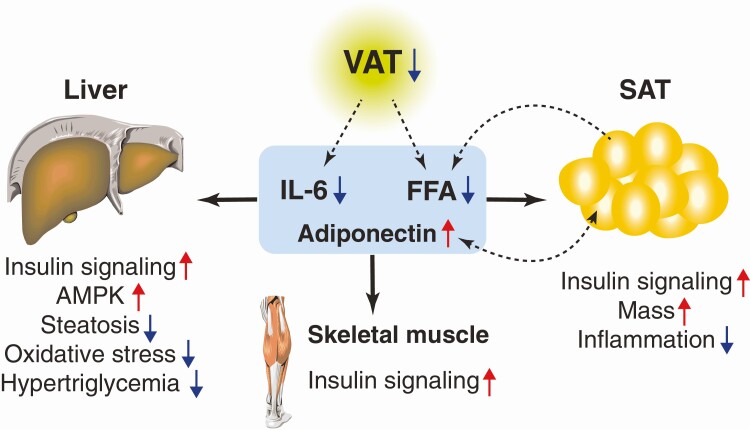
The present study highlights the health benefits and possible action mechanisms of prophylactic VAT removal on obesity-induced multi-organ insulin resistance (Fig. 8). We found (i) surgical removal of epididymal VAT decreases HFD-induced weight gain while increasing SAT mass; (ii) VAT removal prevents obesity-induced insulin resistance and hyperinsulinemia; (iii) VAT removal enhances insulin-stimulated AKT phosphorylation at Ser473 and Thr308 in SAT, liver, and skeletal muscle; (iv) VAT removal reduces plasma lipids (TC, TC, FFA) concentrations and hepatic TG content; (v) VAT removal increases plasma concentration of adiponectin, a key insulin-sensitizing adipokine, while decreasing circulating IL-6, a pro-inflammatory adipokine; (vi) VAT removal increases AMPK-phosphorylation in liver; and (vii) VAT removal may prevent obesity-induced oxidative stress and inflammation in liver and SAT, respectively. Taken together, these findings provide important insight into understanding the causative role of excess VAT in the development of obesity and insulin resistance.
Figure 8.
Systemic metabolic benefits induced by prophylactic VAT removal. The present study demonstrates prophylactic VAT removal prevents obesity and its related systemic metabolic abnormalities, such as insulin resistance, hepatosteatosis, inflammation, and oxidative stress. The alterations in adipose tissue-derived adipokine and FFA likely explain the mechanism of the systemic metabolic benefits induced by prophylactic VAT removal.
In the present study, we demonstrate that pre-emptive VAT removal improves insulin sensitivity and enhances AKT-mediated insulin signaling in adipose tissue, liver, and skeletal muscle. These findings are consistent with data obtained from a previous study that found the preventive effects of VAT removal on hepatic insulin resistance in rats during the initial stage obesity (after 3 days of HFD) [29]. Given that postemptive VAT removal improves insulin resistance and insulin signaling in obese rodents [20-26], these results indicate VAT removal has similar metabolic benefits regardless of timing of treatment. We found that a reduction of insulin resistance is accompanied by a marked increase in plasma adiponectin concentration. There is considerable evidence that adiponectin increases insulin sensitivity and insulin signaling in skeletal muscle, liver, and adipose tissue; decreases circulating lipids and hepatic TG content; and inhibits inflammation and oxidative stress in obese rodents [6-10]. These findings suggest adiponectin is an important mediator of the insulin-sensitizing effects of VAT removal. Supporting this idea, VAT removal increases protein content of phosphorylated AMPK and gene expression of insulin receptor substrate 2 in liver, key downstream targets of adiponectin signaling involved in regulating glucose metabolism and insulin sensitivity [8,49,51]. In addition, our RNA-seq results found VAT removal could decrease oxidative stress in the liver by increasing gene expression of detoxification enzymes. Given the importance of adiponectin in regulating detoxification and oxidative stress [8,51,52], adiponectin-induced by VAT removal could be involved in decreasing oxidative stress, which is a key contributor to obesity-induced insulin resistance [53]. In contrast, VAT removal leads to a marked decrease in circulating level of IL-6, a pro-inflammatory adipokine that is known to induce multi-organ insulin resistance [54,55]. This is consistent with previous data showing that VAT is a major source of circulating IL-6 in people with obesity [12]. Moreover, our RNA-seq results suggest that VAT removal prevents SAT inflammation, a hallmark of obesity and insulin resistance [6,7]. Increased adiponectin production could contribute to the resolution of SAT inflammation in an autocrine/paracrine manner [8,56]. Taken together, these findings indicate the causal relationship between excess VAT accumulation and systemic and topical inflammation during obesity.
Despite being more insulin-sensitive, VAT-R mice had similar glucose tolerance to sham mice. These apparently conflicting results could be explained by the difference in fasting period between ITTs (4 h) and IPGTTs (overnight). Indeed, data obtained from studies conducted in B6 mice suggest overnight (18-h) fasting could be a confounding factor on detecting the effect of HFD feeding on glucose tolerance [57]. In addition, overnight (18-h) fasting increases whole-body insulin sensitivity compared with 5-h fasting [58]. It is therefore possible that overnight fasting masked an effect induced by VAT removal on glucose tolerance and insulin sensitivity.
We found that prophylactic VAT removal decreases plasma FFA and TG concentrations while increasing SAT mass, which supports the hypothesis that SAT functions as a metabolic “buffer” for circulating FFA. Therefore, VAT removal likely prevents the development of obesity-induced hepatic insulin resistance and hepatosteatosis, at least in part, through decreased systemic FFA availability. However, data obtained from studies conducted in people and rodents suggest that FFA derived from VAT accounts for only a small portion of FFA delivered to liver [19,59]. Taken together, these findings suggest VAT removal decreases hepatic TG content by inhibiting lipolytic activity in other white adipose tissue depots. In addition, adiponectin induced by VAT removal could improve hepatic lipid metabolism by activating AMPK [6-10].
Our results suggest that VAT removal has minimal impact on glucose metabolism and insulin sensitivity in middle-age mice under an RCD condition despite an increase in plasma adiponectin concentrations and a decrease in plasma FFA concentration. However, our results do not exclude the possibility that VAT removal exerts metabolic benefits in older animals even under a RCD condition, because decreased adiponectin level and increased FFA availability are associated with aging and related metabolic complications, including insulin resistance [8,16]. Supporting this notion, a series of elegant studies conducted by Barzilai’s group found that VAT removal prevents age-induced hepatic insulin resistance and increases mean and maximum lifespan in RCD-fed rats [26,60-62].
There are several important limitations in the present study. First, we surgically removed only epididymal VAT, but not other VAT, such as omental VAT and mesenteric VAT. Given each VAT depot has unique role in regulating metabolic function [63,64], future studies are required to determine whether removal of other VAT depots has additional and/or unique metabolic benefits. Second, although our results suggest that the alterations in adiponectin and IL-6 likely mediate systemic metabolic benefits induced by VAT removal, additional studies that involve knockout mouse models are needed to further determine the precise roles of these adipokines in VAT-R mice. Third, we did not continuously monitored daily food intake or plasma leptin concentration throughout the study. Therefore, we cannot exclude the possibility that VAT removal decreases appetite and food intake in different time points, which could contribute to weight loss and metabolic benefits induced by VAT removal. Lastly, only male mice were evaluated in this study.
In conclusion, the present study provides important insight into understanding the causative role of excess VAT in the development of obesity and its related systemic metabolic complications, such as multi-organ insulin resistance, hyperinsulinemia, hepatosteatosis, inflammation, and oxidative stress. Our results also highlight the extraordinary capability of adipose tissue to influence whole-body glucose and lipid metabolism as an active endocrine organ. Further studies are needed to understand the importance of the inter-organ communication mediated by adipose-derived adipokines and lipids in the pathogenesis of obesity and insulin resistance.
Acknowledgments
The authors thank Dr. Sangeeta Adak (Washington University Diabetes Research Center) for technical assistance. We also thank members in the Yoshino lab for critical discussion and suggestion.
Financial support: This study was funded by National Institutes of Health grants DK104995, DK056341(Washington University NORC), DK020579 (Washington University Diabetes Research Center), DK052574 (Washington University Digestive Disease Research Core Center), CA91842 and UL1TR002345 (Washington University Genome Technology Access Center).
Author Contributions: J.Y. conceptualized and designed the project, supervised all of the experiments, and provided funding. M.P.F. and J.Y. performed the experiments and analyzed the data. M.H. provided the histological assessments for liver samples. All authors reviewed and edited the manuscript. J.Y. is the guarantor of this work and, as such, had full access to all the data in the study and takes responsibility for the integrity of the data and the accuracy of the data analysis.
Additional Information
Disclosure Statement: The authors have nothing to disclose.
Data Availability
All RNA-seq data used in this study have been deposited into the NCBI GEO database under accession number GSE157798.
References
- 1. Klein S, Wadden T, Sugerman HJ. AGA technical review on obesity. Gastroenterology. 2002;123(3):882-932. [DOI] [PubMed] [Google Scholar]
- 2. Fabbrini E, Sullivan S, Klein S. Obesity and nonalcoholic fatty liver disease: biochemical, metabolic, and clinical implications. Hepatology. 2010;51(2):679-689. [DOI] [PMC free article] [PubMed] [Google Scholar]
- 3. Preis SR, Massaro JM, Robins SJ, et al. Abdominal subcutaneous and visceral adipose tissue and insulin resistance in the Framingham heart study. Obesity (Silver Spring). 2010;18(11):2191-2198. [DOI] [PMC free article] [PubMed] [Google Scholar]
- 4. Neeland IJ, Ayers CR, Rohatgi AK, et al. Associations of visceral and abdominal subcutaneous adipose tissue with markers of cardiac and metabolic risk in obese adults. Obesity (Silver Spring). 2013;21(9):E439-E447. [DOI] [PMC free article] [PubMed] [Google Scholar]
- 5. Janssen I, Katzmarzyk PT, Ross R. Waist circumference and not body mass index explains obesity-related health risk. Am J Clin Nutr. 2004;79(3):379-384. [DOI] [PubMed] [Google Scholar]
- 6. Crewe C, An YA, Scherer PE. The ominous triad of adipose tissue dysfunction: inflammation, fibrosis, and impaired angiogenesis. J Clin Invest. 2017;127(1):74-82. [DOI] [PMC free article] [PubMed] [Google Scholar]
- 7. Scherer PE. The multifaceted roles of adipose tissue-therapeutic targets for diabetes and beyond: the 2015 banting lecture. Diabetes. 2016;65(6):1452-1461. [DOI] [PMC free article] [PubMed] [Google Scholar]
- 8. Kadowaki T, Yamauchi T, Kubota N, Hara K, Ueki K, Tobe K. Adiponectin and adiponectin receptors in insulin resistance, diabetes, and the metabolic syndrome. J Clin Invest. 2006;116(7):1784-1792. [DOI] [PMC free article] [PubMed] [Google Scholar]
- 9. Yamauchi T, Kamon J, Waki H, et al. The fat-derived hormone adiponectin reverses insulin resistance associated with both lipoatrophy and obesity. Nat Med. 2001;7(8):941-946. [DOI] [PubMed] [Google Scholar]
- 10. Berg AH, Combs TP, Du X, Brownlee M, Scherer PE. The adipocyte-secreted protein Acrp30 enhances hepatic insulin action. Nat Med. 2001;7(8):947-953. [DOI] [PubMed] [Google Scholar]
- 11. Bruun JM, Lihn AS, Pedersen SB, Richelsen B. Monocyte chemoattractant protein-1 release is higher in visceral than subcutaneous human adipose tissue (AT): implication of macrophages resident in the AT. J Clin Endocrinol Metab. 2005;90(4):2282-2289. [DOI] [PubMed] [Google Scholar]
- 12. Fontana L, Eagon JC, Trujillo ME, Scherer PE, Klein S. Visceral fat adipokine secretion is associated with systemic inflammation in obese humans. Diabetes. 2007;56(4):1010-1013. [DOI] [PubMed] [Google Scholar]
- 13. Park KG, Park KS, Kim MJ, et al. Relationship between serum adiponectin and leptin concentrations and body fat distribution. Diabetes Res Clin Pract. 2004;63(2):135-142. [DOI] [PubMed] [Google Scholar]
- 14. Arner P. Differences in lipolysis between human subcutaneous and omental adipose tissues. Ann Med. 1995;27(4):435-438. [DOI] [PubMed] [Google Scholar]
- 15. Wajchenberg BL, Giannella-Neto D, da Silva ME, Santos RF. Depot-specific hormonal characteristics of subcutaneous and visceral adipose tissue and their relation to the metabolic syndrome. Horm Metab Res. 2002;34(11-12):616-621. [DOI] [PubMed] [Google Scholar]
- 16. Roden M, Price TB, Perseghin G, et al. Mechanism of free fatty acid-induced insulin resistance in humans. J Clin Invest. 1996;97(12):2859-2865. [DOI] [PMC free article] [PubMed] [Google Scholar]
- 17. Petersen MC, Shulman GI. Mechanisms of insulin action and insulin resistance. Physiol Rev. 2018;98(4):2133-2223. [DOI] [PMC free article] [PubMed] [Google Scholar]
- 18. Klein S. The case of visceral fat: argument for the defense. J Clin Invest. 2004;113(11):1530-1532. [DOI] [PMC free article] [PubMed] [Google Scholar]
- 19. Nielsen S, Guo Z, Johnson CM, Hensrud DD, Jensen MD. Splanchnic lipolysis in human obesity. J Clin Invest. 2004;113(11):1582-1588. [DOI] [PMC free article] [PubMed] [Google Scholar]
- 20. Barzilai N, She L, Liu BQ, et al. Surgical removal of visceral fat reverses hepatic insulin resistance. Diabetes. 1999;48(1):94-98. [DOI] [PubMed] [Google Scholar]
- 21. Foster MT, Shi H, Seeley RJ, Woods SC. Removal of intra-abdominal visceral adipose tissue improves glucose tolerance in rats: role of hepatic triglyceride storage. Physiol Behav. 2011;104(5):845-854. [DOI] [PMC free article] [PubMed] [Google Scholar]
- 22. Shi H, Strader AD, Woods SC, Seeley RJ. The effect of fat removal on glucose tolerance is depot specific in male and female mice. Am J Physiol Endocrinol Metab. 2007;293(4): E1012-E1020. [DOI] [PubMed] [Google Scholar]
- 23. Pitombo C, Araújo EP, De Souza CT, Pareja JC, Geloneze B, Velloso LA. Amelioration of diet-induced diabetes mellitus by removal of visceral fat. J Endocrinol. 2006;191(3):699-706. [DOI] [PubMed] [Google Scholar]
- 24. Harris RB, Hausman DB, Bartness TJ. Compensation for partial lipectomy in mice with genetic alterations of leptin and its receptor subtypes. Am J Physiol Regul Integr Comp Physiol. 2002;283(5):R1094-R1103. [DOI] [PubMed] [Google Scholar]
- 25. Gabriely I, Barzilai N. Surgical removal of visceral adipose tissue: effects on insulin action. Curr Diab Rep. 2003;3(3):201-206. [DOI] [PubMed] [Google Scholar]
- 26. Das M, Gabriely I, Barzilai N. Caloric restriction, body fat and ageing in experimental models. Obes Rev. 2004;5(1):13-19. [DOI] [PubMed] [Google Scholar]
- 27. Fabbrini E, Tamboli RA, Magkos F, et al. Surgical removal of omental fat does not improve insulin sensitivity and cardiovascular risk factors in obese adults. Gastroenterology. 2010;139(2):448-455. [DOI] [PMC free article] [PubMed] [Google Scholar]
- 28. Thörne A, Lönnqvist F, Apelman J, Hellers G, Arner P. A pilot study of long-term effects of a novel obesity treatment: omentectomy in connection with adjustable gastric banding. Int J Obes Relat Metab Disord. 2002;26(2):193-199. [DOI] [PubMed] [Google Scholar]
- 29. Ben-Shlomo S, Einstein FH, Zvibel I, et al. Perinephric and epididymal fat affect hepatic metabolism in rats. Obesity (Silver Spring). 2012;20(1):151-156. [DOI] [PubMed] [Google Scholar]
- 30. Yamaguchi S, Franczyk MP, Chondronikola M, et al. Adipose tissue NAD+ biosynthesis is required for regulating adaptive thermogenesis and whole-body energy homeostasis in mice. Proc Natl Acad Sci U S A. 2019;116(47):23822-23828. [DOI] [PMC free article] [PubMed] [Google Scholar]
- 31. Porter LC, Franczyk MP, Pietka T, et al. NAD+-dependent deacetylase SIRT3 in adipocytes is dispensable for maintaining normal adipose tissue mitochondrial function and whole body metabolism. Am J Physiol Endocrinol Metab. 2018;315(4):E520-E530. [DOI] [PMC free article] [PubMed] [Google Scholar]
- 32. Stromsdorfer KL, Yamaguchi S, Yoon MJ, et al. NAMPT-mediated NAD(+) biosynthesis in adipocytes regulates adipose tissue function and multi-organ insulin sensitivity in mice. Cell Rep. 2016;16(7):1851-1860. [DOI] [PMC free article] [PubMed] [Google Scholar]
- 33. Yoshino J, Patterson BW, Klein S. Adipose tissue CTGF expression is associated with adiposity and insulin resistance in humans. Obesity (Silver Spring). 2019;27(6):957-962. [DOI] [PMC free article] [PubMed] [Google Scholar]
- 34. Yamaguchi S, Moseley AC, Almeda-Valdes P, et al. Diurnal variation in PDK4 expression is associated with plasma free fatty acid availability in people. J Clin Endocrinol Metab. 2018;103(3):1068-1076. [DOI] [PMC free article] [PubMed] [Google Scholar]
- 35. RRID: AB_2315049. https://scicrunch.org/resolver/AB_2315049 [Google Scholar]
- 36. RRID: AB_331163. https://scicrunch.org/resolver/AB_331163 [Google Scholar]
- 37. RRID: AB_329827. https://scicrunch.org/resolver/AB_329827 [Google Scholar]
- 38. RRID:AB_10622186. https://scicrunch.org/resolver/AB_10622186 [Google Scholar]
- 39. RRID:AB_331250. https://scicrunch.org/resolver/AB_331250 [Google Scholar]
- 40. RRID: AB_2099233. https://scicrunch.org/resolver/AB_2099233 [Google Scholar]
- 41. RRID:SCR_001935. https://scicrunch.org/resolver/SCR_001935 [Google Scholar]
- 42. Brunt EM. Nonalcoholic fatty liver disease: pros and cons of histologic systems of evaluation. Int J Mol Sci. 2016;17(1). [DOI] [PMC free article] [PubMed] [Google Scholar]
- 43. RRID: AB_2832917. https://scicrunch.org/resolver/AB_2832917 [Google Scholar]
- 44. RRID: AB_2732075. https://scicrunch.org/resolver/AB_2732075 [Google Scholar]
- 45. RRID:SCR_001881. https://scicrunch.org/resolver/SCR_001881 [Google Scholar]
- 46. RRID:SCR_005825. https://scicrunch.org/resolver/SCR_005825 [Google Scholar]
- 47. RRID:SCR_005012. https://scicrunch.org/resolver/SCR_005012 [Google Scholar]
- 48. RRID:SCR_002865. https://scicrunch.org/resolver/SCR_002865 [Google Scholar]
- 49. Awazawa M, Ueki K, Inabe K, et al. Adiponectin enhances insulin sensitivity by increasing hepatic IRS-2 expression via a macrophage-derived IL-6-dependent pathway. Cell Metab. 2011;13(4):401-412. [DOI] [PubMed] [Google Scholar]
- 50. Yecies JL, Zhang HH, Menon S, et al. Akt stimulates hepatic SREBP1c and lipogenesis through parallel mTORC1-dependent and independent pathways. Cell Metab. 2011;14(1):21-32. [DOI] [PMC free article] [PubMed] [Google Scholar]
- 51. Liu Q, Yuan B, Lo KA, Patterson HC, Sun Y, Lodish HF. Adiponectin regulates expression of hepatic genes critical for glucose and lipid metabolism. Proc Natl Acad Sci U S A. 2012;109(36):14568-14573. [DOI] [PMC free article] [PubMed] [Google Scholar]
- 52. Yamauchi T, Nio Y, Maki T, et al. Targeted disruption of AdipoR1 and AdipoR2 causes abrogation of adiponectin binding and metabolic actions. Nat Med. 2007;13(3):332-339. [DOI] [PubMed] [Google Scholar]
- 53. Matsuda M, Shimomura I. Increased oxidative stress in obesity: implications for metabolic syndrome, diabetes, hypertension, dyslipidemia, atherosclerosis, and cancer. Obes Res Clin Pract. 2013;7(5):e330-e341. [DOI] [PubMed] [Google Scholar]
- 54. Klover PJ, Zimmers TA, Koniaris LG, Mooney RA. Chronic exposure to interleukin-6 causes hepatic insulin resistance in mice. Diabetes. 2003;52(11):2784-2789. [DOI] [PubMed] [Google Scholar]
- 55. Kim JH, Bachmann RA, Chen J. Interleukin-6 and insulin resistance. Vitam Horm. 2009;80:613-633. [DOI] [PubMed] [Google Scholar]
- 56. Ouchi N, Walsh K. Adiponectin as an anti-inflammatory factor. Clin Chim Acta. 2007;380(1-2):24-30. [DOI] [PMC free article] [PubMed] [Google Scholar]
- 57. Andrikopoulos S, Blair AR, Deluca N, Fam BC, Proietto J. Evaluating the glucose tolerance test in mice. Am J Physiol Endocrinol Metab. 2008;295(6):E1323-E1332. [DOI] [PubMed] [Google Scholar]
- 58. Ayala JE, Bracy DP, McGuinness OP, Wasserman DH. Considerations in the design of hyperinsulinemic-euglycemic clamps in the conscious mouse. Diabetes. 2006;55(2):390-397. [DOI] [PubMed] [Google Scholar]
- 59. Rytka JM, Wueest S, Schoenle EJ, Konrad D. The portal theory supported by venous drainage-selective fat transplantation. Diabetes. 2011;60(1):56-63. [DOI] [PMC free article] [PubMed] [Google Scholar]
- 60. Muzumdar R, Allison DB, Huffman DM, et al. Visceral adipose tissue modulates mammalian longevity. Aging Cell. 2008;7(3):438-440. [DOI] [PMC free article] [PubMed] [Google Scholar]
- 61. Gabriely I, Ma XH, Yang XM, et al. Removal of visceral fat prevents insulin resistance and glucose intolerance of aging: an adipokine-mediated process? Diabetes. 2002;51(10):2951-2958. [DOI] [PubMed] [Google Scholar]
- 62. Huffman DM, Barzilai N. Role of visceral adipose tissue in aging. Biochim Biophys Acta. 2009;1790(10):1117-1123. [DOI] [PMC free article] [PubMed] [Google Scholar]
- 63. Chusyd DE, Wang D, Huffman DM, Nagy TR. Relationships between rodent white adipose fat pads and human white adipose fat depots. Front Nutr. 2016;3:10. [DOI] [PMC free article] [PubMed] [Google Scholar]
- 64. Harris RB, Leibel RL. Location, location, location. Cell Metab. 2008;7(5):359-361. [DOI] [PubMed] [Google Scholar]
Associated Data
This section collects any data citations, data availability statements, or supplementary materials included in this article.
Data Availability Statement
All RNA-seq data used in this study have been deposited into the NCBI GEO database under accession number GSE157798.


