Abstract
Concerns about the potential adverse effects of bisphenol A (BPA) have led to an increase in the use of replacements, yet the toxicity data for several of these chemicals are limited. Using high-content imaging, we compared the effects of BPA, BPAF, BPF, BPS, BPM, and BPTMC in germ (C18-4 spermatogonial) and steroidogenic (MA-10 Leydig and KGN granulosa) cell lines. Effects on cell viability and phenotypic markers were analyzed to determine benchmark concentrations (BMCs) and estimate administered equivalent doses (AEDs). In all 3 cell lines, BPA was one of the least cytotoxic bisphenol compounds tested, whereas BPM and BPTMC were the most cytotoxic. Interestingly, BPF and BPS were cytotoxic only in MA-10 cells. Effects on phenotypic parameters, including mitochondria, lysosomes, lipid droplets, and oxidative stress, were both bisphenol- and cell-line specific. BPA exposure affected mitochondria (BMC: 1.2 μM; AED: 0.09 mg/kg/day) in C18-4 cells. Lysosome numbers were increased in MA-10 cells exposed to BPA or BPAF but decreased in KGN cells exposed to BPAF or BPM. Lipid droplets were decreased in C18-4 cells exposed to BPF and in MA-10 cells exposed to BPTMC but increased in BPF, BPM, and BPTMC-exposed KGN cells. BPA and BPM exposure induced oxidative stress in MA-10 and KGN cells, respectively. In summary, structurally similar bisphenols displayed clear cell-line-specific differences in BMC and AED values for effects on cell viability and phenotypic endpoints. This approach, together with additional data on human exposure, may aid in the selection and prioritization of responsible replacements for BPA.
Keywords: Bisphenol A, BPA replacements, bisphenols, benchmark concentration, high-content imaging, endocrine disrupting chemical
Bisphenol A (BPA), a high production volume chemical, has been used extensively as an additive in the manufacture of polycarbonate plastics, epoxy resins, and thermal receipts (Health Canada, 2018). Human exposure to the BPA that leaches out of consumer products occurs via the diet, dust inhalation, and dermal absorption (Vandenberg, 2011). Extensive in vitro and in vivo studies have linked BPA exposure to a variety of adverse health effects that include adverse effects on reproduction and neurotoxicity (Ahsan et al., 2018; Camacho et al., 2019; Chen et al., 2016; Ge et al., 2014; González-Rojo et al., 2019; Heindel et al., 2020; Jiang et al., 2018; Liu et al., 2013; López-Rodríguez et al., 2019; Lv et al., 2019; Qi et al., 2014; Rubin, 2011; Santoro et al., 2019); further, many of these studies have provided evidence that BPA may act as an endocrine disrupting chemical. Scientific evidence for the detrimental health effects of BPA have led to regulatory restrictions to its use in Canada, since 2010, and in other countries (Boudalia and Oudir, 2016). While the concentrations of BPA found in Canadians have decreased over time, exposure remains widespread. BPA was detected in most of the urine samples collected from Canadians and Americans between the ages of 3–79 from 2009 and 2017 (LaKind et al., 2012; Statistics Canada, 2013); indeed, the last Canadian Health Measures Survey cycle reported that the average urinary concentration of BPA among Canadians was 0.81 micrograms per liter (μg/l).
Regulatory restrictions on the uses of BPA and public pressure together have led to its replacement in products such as polycarbonate bottles and thermal receipts. These products are often labeled as “BPA-free” but there is usually little information available on the chemicals used as substitutes for BPA; frequently, these are BPA analogs. Consequently, a wide variety of bisphenols have been detected in drinking water, serum, and human milk (Deceuninck et al., 2015; Owczarek et al., 2018; Zhang et al., 2019).
The National Toxicology Program published an extensive report in 2017 on the biological activity of BPA and several of its structural analogs based on their review of the literature up until 2015 (Pelch et al., 2017). A follow-up review captured studies that were published prior to January 2019 (Pelch et al., 2019); these reviews summarized extensive studies reporting on the health-related effects of BPA analogs, including a number reporting mammalian reproductive toxicity for Bisphenol S (BPS), Bisphenol F (BPF), and Bisphenol AF (BPAF). The endpoints affected in rodent studies have included a reduction in intratesticular/plasma testosterone levels and effects on spermatogenesis in males (Feng et al., 2012; Shi et al., 2018; Ullah et al., 2018, 2019) and effects on puberty, estrous cyclicity, and ovarian folliculogenesis in females (Ijaz et al., 2020; Yamasaki et al., 2004). It is important to note that equivalent data are not available on the possible effects of exposure to many of the bisphenols detected in our environment (Fan et al., 2021).
In silico and in vitro studies have revealed that BPS, BPF, and BPAF have many of the biological activities of BPA, often at the same or lower concentrations (Pelch et al., 2017, 2019). These activities include actions as an agonist or antagonist to estrogen receptor (ER)-related proteins (ERα, ERβ, GPER, ERRs), as an androgen receptor (AR) antagonist, a peroxisome proliferator-activated receptor (PPAR) α or γ antagonist, or a glucocorticoid receptor antagonist (Ahmed and Atlas, 2016; Amar et al., 2020; Chen et al., 2020; Dvořáková et al., 2018; Feng et al., 2018; Ji et al., 2013; Le Fol et al., 2017; Roelofs et al., 2015; Téteau et al., 2020). Alterations in progesterone, 17-β estradiol, and testosterone production were noted in H295R adrenocortical cells exposed to BPA, BPAF, or BPS (Feng et al., 2016). Additionally, thyroid hormone dysregulation via altered gene expression and cellular proliferation has been reported in in vitro studies following exposure of cell lines, such as GH3 rat pituitary and FRTL-5 thyroid follicular cells, to BPAF, BPF, or BPS (Lee et al., 2017, 2018). In vitro studies on cell lines related to reproduction are limited. In MA-10 Leydig cells, BPA and BPF were reported to act as AR antagonists, whereas BPS had no effect on receptor activity (Roelofs et al., 2015). Interestingly, exposure to BPA, BPF, or BPS altered steroidogenesis in these cells (Roelofs et al., 2015).
Despite the rapidly growing literature on specific bisphenols, to date there is little information on the effects of the broad group of emerging BPA analogs, such as Bisphenol M (BPM) and Bisphenol TMC (BPTMC). This is of concern as the detection frequencies for BPM and BPTMC in Canadian house dust were 77% and 47%, respectively (Fan et al., 2021). In addition, BPTMC has been found in surface and river water, both in Europe and China (Huang et al., 2020; Šauer et al., 2021). Data from a Saccharomyces cerevisiae recombinant reporter gene assay for human estrogen (hERα) and androgen (hAR) receptors demonstrated that BPM and BPTMC have potential ER binding and agonistic effects (Dvořáková et al., 2018). In addition, BPTMC was reported to have greater antiprogesterone activity than BPA in a transgenic human bone cancer U2-OS cell in vitro reporter gene bioassay (anti-PR-CALUX) (Šauer et al., 2021). Thus, these data suggest that BPM and BPTMC not only are present in the environment but also may share some of the biological activities of other, more extensively studied, bisphenols.
The goal of this study was to explore the utility of a rapid, high content imaging approach to assess the biological activities of BPA and 5 bisphenol structural analogs in established cell lines representing key endocrine functions in relation to developmental and reproductive toxicology: C18-4 mouse spermatogonial cells, MA-10 mouse Leydig tumor cells, and KGN human granulosa cells. We used single cell high-content imaging to determine the effects of BPA and its analogs on cell viability and on phenotypic markers of cell morphology or function. Each chemical was tested at a range of concentrations designed to reflect levels to which humans may be exposed (Heinälä et al., 2017; Hines et al., 2017; Statistics Canada, 2013). Benchmark concentrations (BMCs) were calculated to rank bisphenols based on their bioactivity. In vitro to in vivo extrapolation (IVIVE) modeling was done to estimate administered equivalent doses (AEDs), predictive of the in vivo doses that may have an impact on human health, to provide a parallel to the effect levels used in risk assessment. Overall, this high-content image approach, coupled with BMC and IVIVE analyses, provides a novel methodology to support the effect identification and potency evaluation of potential BPA chemical substitutes.
MATERIALS AND METHODS
Chemicals
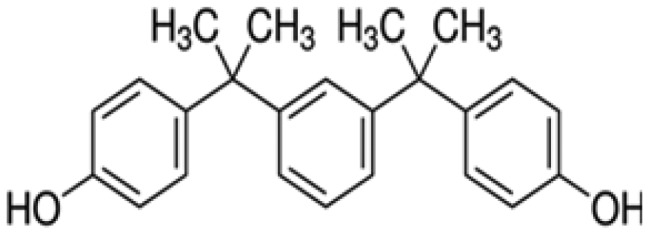
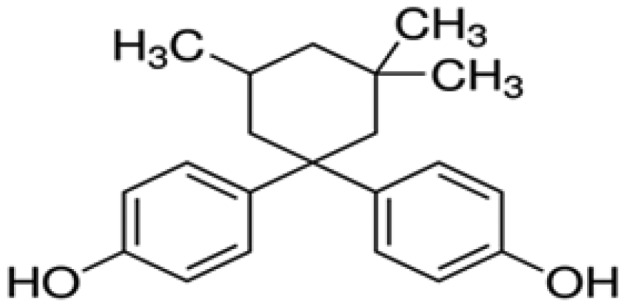
Information on the specific bisphenols tested is provided in Table 1. We are grateful to Dr Nicole Kleinstreuer from NTP NICEATM for providing us with BPA, BPAF, BPF, and BPS. BPM and BPTMC were purchased from Toronto Research Chemicals (Toronto, Ontario, Canada).
Table 1.
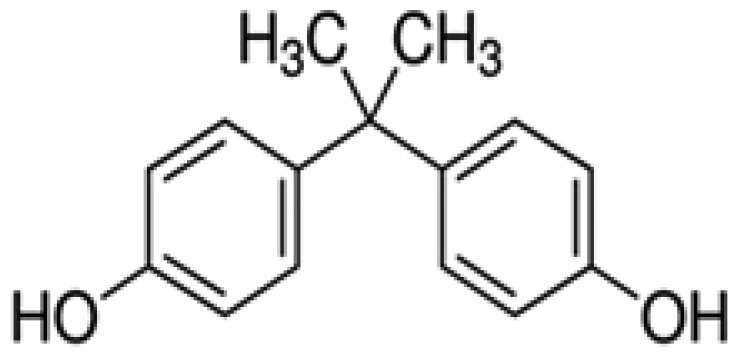
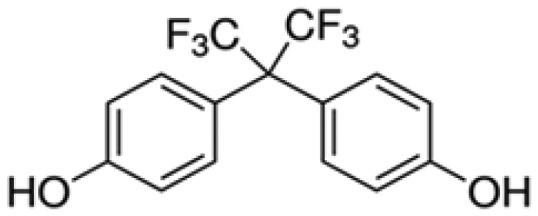
Names, Acronyms, CAS Numbers, Chemical Structures, and Sources of the 6 Bisphenols Studied
| Comp. Compound | Acronym | Systematic Name | CAS | Chemical Structure | Supplier (Purity) |
|---|---|---|---|---|---|
| Bisphenol A | BPA | 4,4′-(Propane-2,2-diyl)diphenol | 80-05-7 |
|
Sigma-Aldrich (98.1%) |
| Bisphenol AF | BPAF |
4-[1,1,1,3,3,3-Hexafluoro-2- (4-hydroxyphenyl)propan-2-yl]phenol |
1478-61-1 |
|
3B Pharmachem International Co. Ltd. (98.0%) |
| Bisphenol F | BPF | Bis(4-hydroxyphenyl)methane | 620-92-8 |

|
Sigma-Aldrich (99.7%) |
| Bisphenol S | BPS | Bis(4-hydroxyphenyl) sulfone | 80-09-1 |

|
Sigma-Aldrich (99.9%) |
| Bisphenol M | BPM | 1,3-Bis(2-(4-hydroxyphenyl)-2-propyl)benzene | 13595-25-0 |
|
Toronto Research Chemicals |
| Bisphenol TMC | BPTMC | 1,1-Bis(4-hydroyphenyl)-3,3,5-trimethyl-cyclohexane | 129188-99-4 |
|
Toronto Research Chemicals |
Cell cultures
The C18-4 spermatogonial cell line was a gift from Dr Marie-Claude Hofmann (MD Anderson Cancer Center, Houston, Texas) (Braydich-Stolle et al., 2005; Hofmann et al., 2005). MA-10 mouse Leydig tumor cells were a gift from Dr Mario Ascoli (University of Iowa) (Ascoli, 1981). KGN human ovarian granulosa-like tumor cells were a gift from Dr Christopher Price and Dr Bruce Murphy (Université de Montréal); authorization to use KGN cells was obtained from Dr Toshihiko Yanase (Fukuoka University, Fukuoka, Japan) (Nishi et al., 2001). All cell lines were cultured in 75 cm2 virgin polystyrene cell culture flasks in phenol red-free medium at 37°C with 5% CO2. C18-4 cells were cultured in 87.5% Dulbecco-modified Eagle medium (DMEM), 10% fetal bovine serum, 1 mM sodium pyruvate, 0.5% penicillin/streptomycin 100×, and 1% nonessential amino acids 100× (Wisent Inc., St-Bruno, Quebec, Canada). MA-10 Leydig cells were cultured in DMEM/F-12 culture medium (15 mM HEPES; Gibco, Thermo-Fisher, Ottawa, Ontario, Canada), supplemented with 5% fetal bovine serum (Wisent Inc.), 2.5% horse serum (Wisent Inc.), 20 mM HEPES (Wisent Inc.), and 0.5% penicillin-streptomycin (Wisent Inc.). KGN cells were cultured in DMEM/F-12 (15 mM HEPES; Gibco) and 10% charcoal-stripped fetal bovine serum (Wisent Inc.).
Cultured cells were seeded in 96-well sterile black opaque plates (Perkin Elmer, Waltham, Massachusetts, product no. 6005660) and incubated for 24 h prior to chemical treatment at a seeding density of 2000 cells/well for C18-4 and MA-10 cells. A seeding density of 6000 cells/well was used for KGN cells. The cells were exposed to the specified concentrations of each chemical (control/vehicle, 0.001, 0.01, 0.1, 1, 5, 10, 20, 50, and 100 µM in 0.5% DMSO) for 48 h. Each experiment was done with technical triplicates for each concentration and all experiments were repeated 5 or 6 times.
High-content imaging
Morphometric and functional parameters were determined using cell-permeable fluorescent dyes. Four different dye combinations were used to optimize fluorescent color output and minimize color bleeding; the dyes, the combinations used, and their dilutions are shown in Supplementary Table 1. The dyes were diluted in serum-free medium and applied to the cells for 30 min. All plates were read using the Perkin Elmer Operetta High-Content imaging system (Perkin Elmer) at 40× magnification. Images were analyzed using the Columbus (Perkin Elmer) image data management and analysis system. Prior to analysis, images were selected for advanced flatfield correction with standard coloring. The image acquisition and processing for each dye combination are described in the Supplementary data file. All assays were done for each bisphenol in all 3 cell lines.
Analyses of IC50 and benchmark concentrations for cytotoxicity
Hoechst stained nuclei were counted to determine cytotoxicity, defined as <70% viable cells. One-way ANOVA with Dunnett’s multiple comparison was conducted to determine this cytotoxicity by comparing all concentrations to the lowest concentration tested, 0.001 μM (GraphPad, San Diego, California). The IC50 values for the cytotoxic concentrations of each chemical, relative to the vehicle control (0.5% DMSO), were determined using a nonlinear dose response regression model where concentrations were plotted as log folds.
To calculate BMCs for each of the bisphenols studied, unadjusted (raw) cell counts were analyzed using the PROAST 65.5 software package in R version 3.5.3. The f.proast package function was used to model a benchmark response (BMR) of 10%, using the continuous data sets with the chemical as a covariate. The best fit of either model 3 or 5 from the nested exponential family of models was used. BMC values were only documented if estimated values were less than the highest concentration tested. Data are reported as BMC values with the upper (BMCU) and lower (BMCL) limit values based on the 90% confidence intervals.
Analyses of the benchmark concentrations at which phenotypic endpoints were affected
BMD Express 2.2 (SciOne, Research Triangle Park, North Carolina) was used to analyze the concentrations at which exposure to bisphenols affected cell phenotypic endpoints. All concentrations at which cytotoxicity was not observed were compared to the lowest concentration tested, 0.001 μM. First, concentrations at which changes in phenotypic endpoints were observed were analyzed using 1-way ANOVA with Dunnett’s multiple comparison (GraphPad 8). BMCs were determined for models that were found to be significant (p < .05) with multiple testing correction (Benjamini and Hochberg-FDR) for data sets in which concentration response curves were monotonic.
All possible models were selected (Exp 2, 3, 4 and 5; Linear; Poly 2, 3 and 4; Hill; Power) Factor (10%), with selection for the best poly model test (nested chi square test), to determine the BMCs in various 1-way analyses for BMR assessment. Recommended models by analyses based on low Akaike Information Criterion (AIC) and the best fit model were selected for BMC value determinations. In the case of a flagged Hill model (ie, if the Hill model returned a BMC < 1/3 of the lowest nonsolvent concentration), the next best fit model (fit p > .05) and lowest AIC was selected.
IVIVE modeling
IVIVE modeling estimates the AED, in units of mg/kg body weight/day from each BMC. IVIVE was done using the high-throughput toxicokinetics (HTTK) library v1.10 in R (Pearce et al., 2017). The 3-compartment steady-state model (“3compartmentss”) was used to calculate the steady-state concentration in the plasma (Css) at a constant dose rate of 1 mg/kg body weight/day. Following a linear assumption, the AED required to produce a Css equal to the measured BMC was estimated using the equation AED = BMC × (1 mg/kg bw/day/Css) (Paul Friedman et al., 2020). Specifically, the calc_mc_css() function was used, with output.units=“uM” and well.stirred.correction=TRUE, in order to model the Css. The parameters required to model the Css were supplemented using in silico tools (Supplementary Table 2). Specifically, ADMET v9.5 provided estimates of the fraction unbound in plasma and intrinsic clearance, with units converted to µl/min/106 cells (Sipes et al., 2017). The OpenBabel C++ project (O’Boyle et al., 2011), interfaced through the ChemmineOB R library v1.20 (Horan and Girke, 2020), provided estimates of octanol-water partition coefficient and molecular weight. These parameters were incorporated into the HTTK chemical physical and in vitro dataset using the add_chemtable() function with overwrite=FALSE.
RESULTS
Cytotoxicity of Bisphenol Compounds to C18-4, MA-10 and KGN Cells
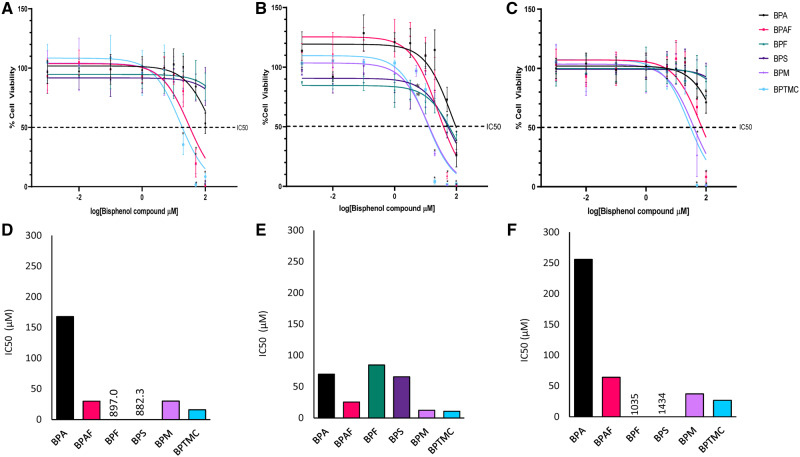
To assess and compare the cytotoxicity of BPA, BPAF, BPF, BPS, BPM, and BPTMC in spermatogonial and steroidogenic cell lines, IC50 values were obtained by testing for cell toxicity across a range of concentrations (Figure 1). BPA, BPF, and BPS were only weakly cytotoxic in C18-4 mouse spermatogonial cells, with IC50 values exceeding 100 µM, the highest concentration tested (Figs. 1A and 1D); in contrast, the IC50 values for BPAF, BPM, and BPTMC were equal to or less than 30 µM in these cells. All bisphenol analogs tested were cytotoxic to MA-10 Leydig cells (Figs. 1B and 1E); BPAF, BPM, and BPTMC were the most cytotoxic analogs, with IC50 values less than or equal to 25 µM, followed by BPF and BPS. BPF was the only bisphenol analog that was less cytotoxic than BPA in MA-10 cells. BPA, BPF, and BPS were not cytotoxic in KGN cells at the highest concentration tested (Figs. 1C and 1F); these cells were most sensitive to BPTMC (IC50: 26.7 µM), followed by BPM and BPAF.
Figure 1.
Comparison of nonlinear regression cell viability curves and IC50 values for the cytotoxicity of BPA and bisphenol analogs in: C18-4 mouse spermatogonial cells (A and D), MA-10 mouse tumor Leydig cells (B and E), and KGN human granulosa cell lines (C and F). Cells were exposed to the chemical for 48 h followed by fluorescence microscopy using the Operetta High Content imaging system (40× magnification). Hoechst stained nuclei were counted to determine cytotoxicity, defined as <70% viable cells. Cytotoxicity was quantitated by comparing all concentrations to the lowest concentration tested, 0.001 μM, using 1-way ANOVA with Dunnett’s multiple comparison. N = 5 or 6 replicates. Colors are used to identify each bisphenol (BPA—black lines and bars; BPAF—red; BPF—green; BPS—purple; BPM—violet; BPTMC—turquoise). Numbers in the IC50 graphs indicate the estimated values in those instances when these exceeded the highest concentration tested.
We used a BMC analysis approach, mathematical modeling our concentration response data, to compare the cytotoxicity of bisphenol analogs in C18-4, MA-10, and KGN cells (Figure 2;Table 2). These data are depicted as the BMC values (BMR = 10%) and the upper (BMCU) and lower (BMCL) limit values. The BMC values for the cytotoxicities of BPA, BPAF, BPM, and BPTMC in C-18-4, MA-10, and KGN cells were all below 80 μM. BPAF was most cytotoxic in MA-10 cells (BMC: 13.5 μM), followed by C18-4 and KGN. In contrast, although both BPF and BPS were cytotoxic to MA-10 cells, they were not cytotoxic to C18-4 or KGN cells. BPM was cytotoxic in all 3 cell lines, with the highest sensitivity observed in MA-10 cells (BMC: 7.1 μM). BPTMC was also highly cytotoxic in all 3 cell lines, with BMC values ranging from 4.5 to 14.7 μM.
Figure 2.
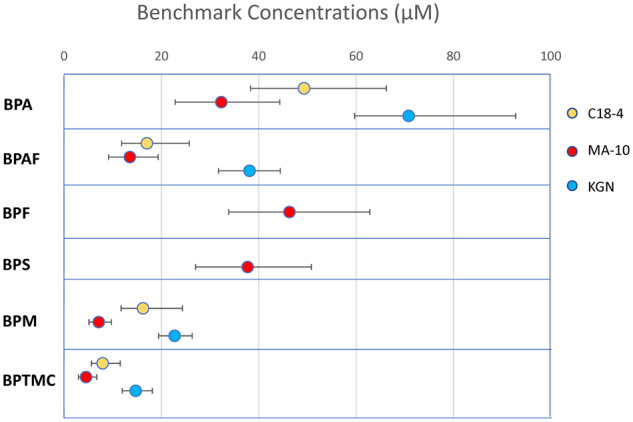
Benchmark concentration (BMC) analyses of the cytotoxicity of bisphenols in C18-4, MA-10, and KGN cells: BMC values (μM) at which a 10% change was observed in the number of nuclei in comparison to control. Data points represent the BMC values, whereas ± bars represent the upper (BMCU) and lower (BMCL) values, respectively.
Table 2.
Comparison of Bisphenol Cytotoxicity in C18-4, MA-10, and KGN Cells Using Benchmark Concentration (BMC) Analyses and Administered Equivalent Doses (AED) Estimation
| Chemical | Cell Line | BMR = 10%(BMC; BMCL; BMCU) | AED(AED; AEDL; AEDU) |
|---|---|---|---|
| BPA | C18-4 | 49.3 (38.3–66.2) | 3.6 (2.8–4.8) |
| MA-10 | 32.3 (22.8–44.3) | 2.3 (1.7–3.2) | |
| KGN | 70.8 (59.7–92.8) | 5.2 (4.3–6.7) | |
| BPAF | C18-4 | 17.0 (11.8–25.7) | 3.0 (2.1–4.6) |
| MA-10 | 13.5 (9.1–19.3) | 2.4 (1.6–3.5) | |
| KGN | 38.1 (31.7–44.4) | 6.8 (5.7–8.0) | |
| BPF | C18-4 | N/A (not cytotoxic) | N/A (not cytotoxic) |
| MA-10 | 46.3 (33.8- 62.8) | 4.0 (2.9–5.4) | |
| KGN | N/A (not cytotoxic) | N/A (not cytotoxic) | |
| BPS | C18-4 | N/A (not cytotoxic) | N/A (not cytotoxic) |
| MA-10 | 37.7 (27.0–50.8) | 0.3 (0.21–0.40) | |
| KGN | N/A (not cytotoxic) | N/A (not cytotoxic) | |
| BPM | C18-4 | 16.2 (11.7–24.3) | 3.8 (2.7–5.7) |
| MA-10 | 7.1 (5.1–9.7) | 1.7 (1.2–2.3) | |
| KGN | 22.7 (19.4–26.3) | 5.3 (4.5–6.2) | |
| BPTMC | C18-4 | 7.9 (5.6–11.5) | 0.4 (0.3–0.7) |
| MA-10 | 4.5 (2.9–6.7) | 0.3 (0.2–0.4) | |
| KGN | 14.7 (11.9–18.1) | 0.8 (0.7–1.0) |
BMCL, benchmark concentration lower limit; BMCU, benchmark concentration upper limit; Benchmark concentrations are μM. AEDL, administered equivalent dose lower limit; AEDU, administered equivalent dose upper limit; AED values are expressed as mg/kg bw/day.
To enable a comparison with in vivo data, AEDs (expressed as mg/kg body weight/day) were calculated based on the BMC values for cell cytotoxicity (Table 2). The AEDs for bisphenols that displayed cytotoxicity ranged from 0.3 mg/kg/day for BPTMC or BPS in MA-10 cells up to 6.8 mg/kg/day for BPAF in KGN cells. In C18-4 cells, the AEDs for BPAF, BPM, and BPTMC were lower than that for BPA (3.6 mg/kg/day). In MA-10 cells, BPS and BPTMC had lower AEDs for cytotoxicity than BPA (2.3 mg/kg/day). Interestingly, with the exception of BPTMC (AED: 0.8 mg/kg/day), the AEDs for bisphenol analogs were higher than that for BPA (5.2 mg/kg/day) in KGN cells; AEDs were not calculated for BPF and BPS in these cells.
Overall, BPTMC was the most toxic bisphenol compound studied, based on both the BMCs (from 4.5 to 14.7 μM) and the AEDs (0.3–0.8 mg/kg/day). In contrast, the rank order for the other chemicals differed depending on whether BMC or AED estimations were used due to modeled differences in chemical disposition of each compound. This was particularly true in MA-10 cells in which the BMC values were: BPTMC < BPM < BPAF < BPA < BPS <BPF, whereas the AED estimations were: BPTMC = BPS < BPM < BPA < BPAF < BPF. Notably, BPS ranking was most affected by the application of toxicokinetics modeling, as the Css for BPS was 7–30 times higher than that for the other bisphenols (Supplementary Table 2).
Effects of BPA and Bisphenol Analogs on Morphology and Function in C18-4, MA-10, and KGN Cells
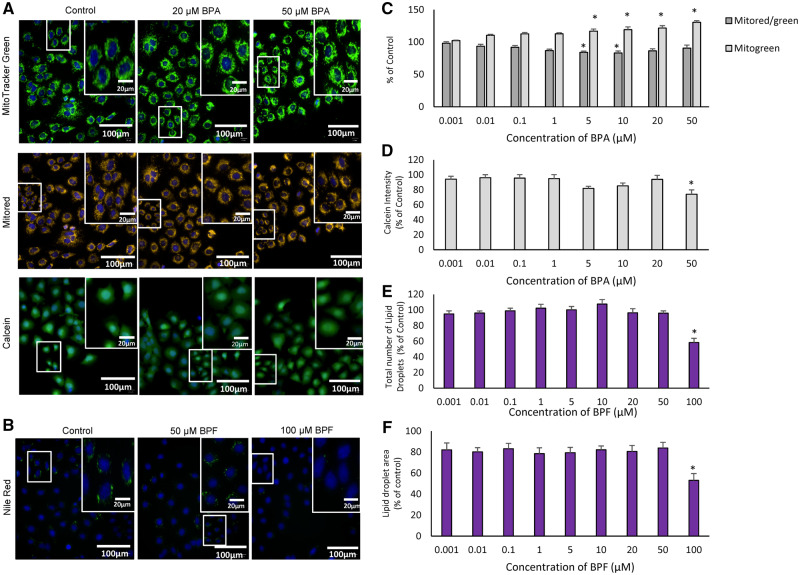
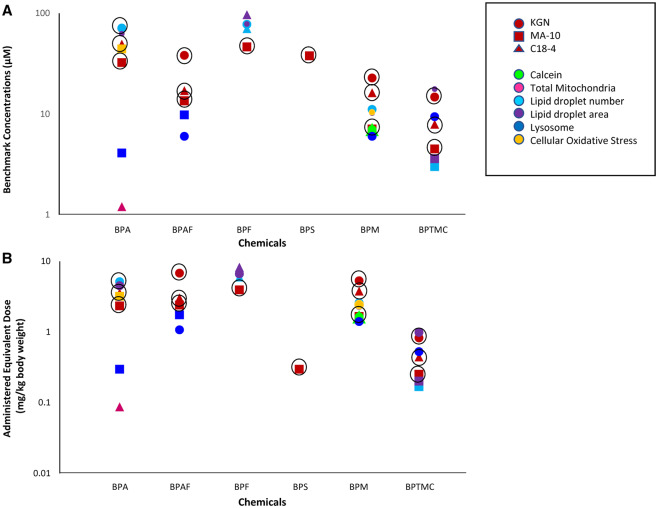
Exposure to increasing concentrations of BPA and BPF affected phenotypic markers in C18-4 mouse spermatogonial cells (Figure 3). Specifically, BPA exposure resulted in an increase in the total number of mitochondria (Figs. 3A and 3C); significant effects were noted at BPA concentrations of 5 μM and higher. The BMC for this endpoint was 1.2 μM; the calculated AED was 0.09 mg/kg/day (Figure 6; Table 3). A significant decrease in the ratio of active to total mitochondria was observed after exposure to 5 or 10 μM BPA (Figs. 3A and 3C). Calcein intensity was decreased in C18-4 cells after exposure to 50 μM BPA (Figs. 3A and 3D); the BMC for this endpoint was 39.2 μM and the calculated AED was 2.9 mg/kg/day (Figure 6; Table 3). Exposure of C18-4 cells to the highest concentration of BPF tested (100 μM) decreased the number and area of lipid droplets (Figs. 3B, E, and F). The BMCs for the effects of BPF on lipid droplet number and area were 70.2 µM and 96.5 µM, respectively; the AEDs were 6.0 mg/kg/day and 8.3 mg/kg/day, respectively (Figure 6; Table 3).
Figure 3.
Effects of bisphenols on C18-4 mouse spermatogonial cells. Cells were exposed for 48 h to each chemical followed by fluorescence microscopy using the Operetta High Content imaging system (40× magnification). (A) Images illustrating the effects of BPA on mitochondrial numbers and calcein intensity in C18-4 cells. Total mitochondrial numbers and the ratios of active: total mitochondria were determined using Mitotracker Green and Red dye staining. Calcein intensity was determined using Calcein dye staining. Control versus 10, 20, and 50 μM, at which effects were observed, are displayed (N = 5). (B) Images illustrating the effects of BPF on lipid droplet numbers in C18-4 cells. Lipid droplet numbers were determined using Nilered dye staining. Control versus 10, 20, 50, and 100 μM, at which effects were seen, are displayed (N = 5). (C) Graph illustrating the effects of BPA on total mitochondrial numbers and the ratio of active: total mitochondria, and (D) graph representing the effect of BPA on calcein intensity, an indication of cell membrane integrity. (E and F) Graphs illustrating the effects of BPF on the total number of lipid droplets (E) and lipid droplet areas (F) in C18-4 cells. One-way ANOVA was conducted to determine concentrations where there were significant effects *p < .05. Values represent the mean ± SEM, N = 5 replicates.
Figure 6.
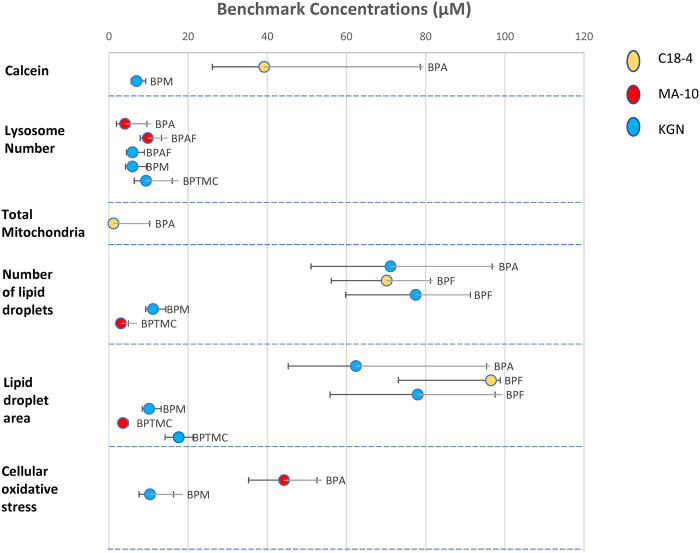
BMC analyses of the effects of bisphenols on C18-4, MA-10, and KGN cells: BMC concentrations (μM) at which a 10% change was observed for various phenotypic endpoints in comparison to control are indicated by the data points. The bars represent upper (BMCU) and lower (BMCL), BMCs, respectively.
Table 3.
Comparison of the Effects of Bisphenols on Phenotypic Parameters in C18-4, MA-10, and KGN Cells Using Benchmark Concentration (BMC) Analyses and AED Estimation
| Phenotypic Parameter | Chemical | Cell Line | BMR = 10% (BMC; BMCL; BMCU) | AED (AED; AEDL; AEDU) | ||
|---|---|---|---|---|---|---|
| Calcein | BPA | C18-4 | 39.2 (26.1–78.7) | 2.9 (1.9–5.7) | ||
| BPM | KGN | 7.0 (5.6–9.3) | 1.6 (1.3–2.2) | |||
| Lysosome | BPA | MA-10 | 4.1 (1.9–9.6) | 0.3 (0.1–0.7) | ||
| BPAF | MA-10 | 9.8 (7.9–13.3) | 1.8 (1.4- 2.38) | |||
| KGN | 6.0 (4.4–8.9) | 1.1 (0.8–1.6) | ||||
| BPM | KGN | 6.0 (4.2–9.5) | 1.4 (1.0–2.2) | |||
| BPTMC | KGN | 9.4 (6.4–16.0) | 0.5 (0.4–0.9) | |||
| Total mitochondria | BPA | C18-4 | 1.2 (N/A*–10.3) | 0.09 (N/A*–0.75) | ||
| No. of lipid droplets | BPA | KGN | 71.1 (51.0–96.8) | 5.2 (3.7–7.0) | ||
| BPF | C18-4 | 70.2 (56.2–81.2) | 6.0 (4.8–6.9) | |||
| KGN | 77.5 (59.8–91.3) | 6.6 (5.1–7.8) | ||||
| BPM | KGN | 11.1 (9.3–14.4) | 2.6 (2.2–3.4) | |||
| BPTMC | MA-10 | 3.0 (2.4–4.9) | 0.2 (0.1–0.3) | |||
|
Lipid droplet area |
BPA | KGN | 62.4 (45.3–95.4) | 4.5 (3.3–6.9) | ||
| BPF | C18-4 | 96.5 (73.1–98.8) | 8.3 (6.3–8.5) | |||
| KGN | 78.0 (55.9–97.5) | 6.7 (4.8–8.3) | ||||
| BPM | KGN | 10.2 (8.4–13.2) | 2.4 (2.0- 3.1) | |||
| BPTMC | MA-10 | 3.6 (2.8–4.9) | 0.2 (0.1–0.3) | |||
| KGN | 17.7 (14.2–21.2) | 1.0 (0.8–1.2) | ||||
| Oxidative stress | BPA | MA-10 | 44.2 (35.3–52.6) | 3.2 (2.6–3.8) | ||
| BPM | KGN | 10.4 (7.6–16.3) | 2.4 (1.8–3.8) | |||
BMCL, benchmark concentration lower limit; BMCU, benchmark concentration upper limit; benchmark concentrations are expressed in μM. AEDL, administered equivalent dose lower limit; AEDU, administered equivalent dose upper; AED values are expressed as mg/kg bw/day.
∗N/ A: the estimated BMC value was below the lowest concentration tested.
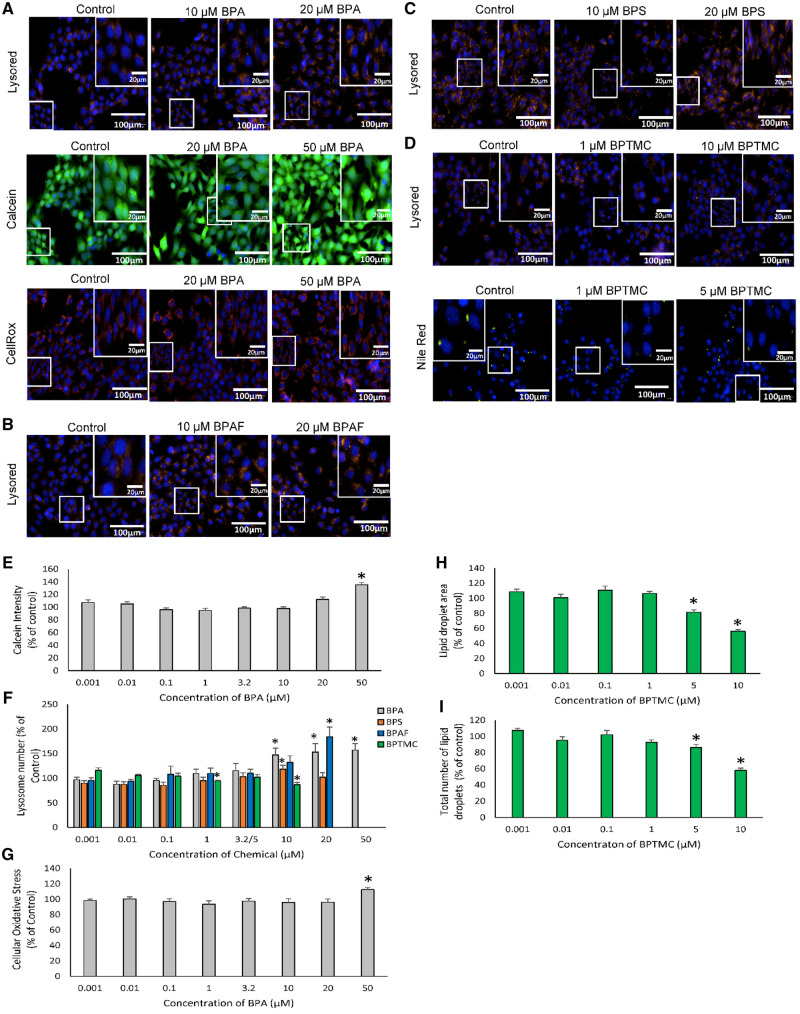
Exposure to BPA, BPAF, BPS, or BPTMC all affected lysosome numbers in MA-10 cells (Figs. 4A–D, and F). Increasing concentrations of BPA (Figure 4A) or BPAF (Figure 4B) increased lysosome numbers but to different extents (Figure 4F). The BMC for the increase in lysosomes induced by BPA was 4.1 µM, with an AED of 0.3 mg/kg/day, whereas the BMC for BPAF was 9.8 µM, with an AED of 1.8 mg/kg/day (Figure 7; Table 3). An increase in lysosome numbers was also observed after exposure to 10 µM BPS, whereas exposure to BPTMC resulted in a decrease at 1 and 10 μM (Figs. 4C, D, and F). The exposure of MA-10 cells to BPA also increased Calcein intensity (indicative of an effect on cell viability, intracellular pH, mitochondrial permeability, oxidative stress, or cell proliferation), and CellRox staining (indicative of oxidative stress) (Figs. 4A, E, and G). The BMC and AED for BPA for oxidative stress were 44.2 µM and 3.2 mg/kg/day, respectively (Figs. 6 and 7; Table 3); no significant BMC model was generated for Calcein intensity data due to poor fit. Exposure to low concentrations of BPTMC affected the area and number of lipid droplets in MA-10 cells (Figs. 4D, H, and I) with a BMCs of 2.4 µM and 3.2 µM, respectively; the AEDs for these parameters were 0.2 mg/kg/day and 0.1 mg/kg/day, respectively (Figs. 6 and 7; Table 3).
Figure 4.
Effects of bisphenols on MA-10 mouse tumor Leydig cells. Cells were exposed for 48 h to each chemical followed by fluorescence microscopy using the Operetta High Content imaging system (40× magnification). Images illustrating the effects of: (A) BPA on lysosome numbers, calcein intensity, and cellular oxidative stress in MA-10 cells; (B) BPAF on lysosome numbers in MA-10 cells; (C) BPS on lysosome numbers in MA-10 cells; and (D) BPTMC on lipid droplet numbers in MA-10 cells. Concentrations at which significant changes were seen are displayed. Lysosome numbers, calcein intensity, and cellular oxidative stress were determined using Lysored, Calcein, and Cellrox dye staining, respectively. Lipid droplet numbers were determined using Nilered dye staining (N = 5). Graphs illustrate the results for the effects of BPA on calcein intensity (E), BPA, BPAF, and BPS on lysosome numbers (F), BPA on oxidative stress (G), BPM and BPTMC on lipid droplet area (H), and BPTMC on lipid droplet numbers (I). Values represent the means ± SEM. One-way ANOVA was conducted to determine concentrations where there were significant effects *p < .05, N = 5.
Figure 7.
Comparison of (A) BMCs (µM) and (B) administered equivalent doses (AEDs, mg/kg body weight/day) values for cellular viability assays and phenotypic endpoints among bisphenols. Circle outlines are used to highlight cell viability values.
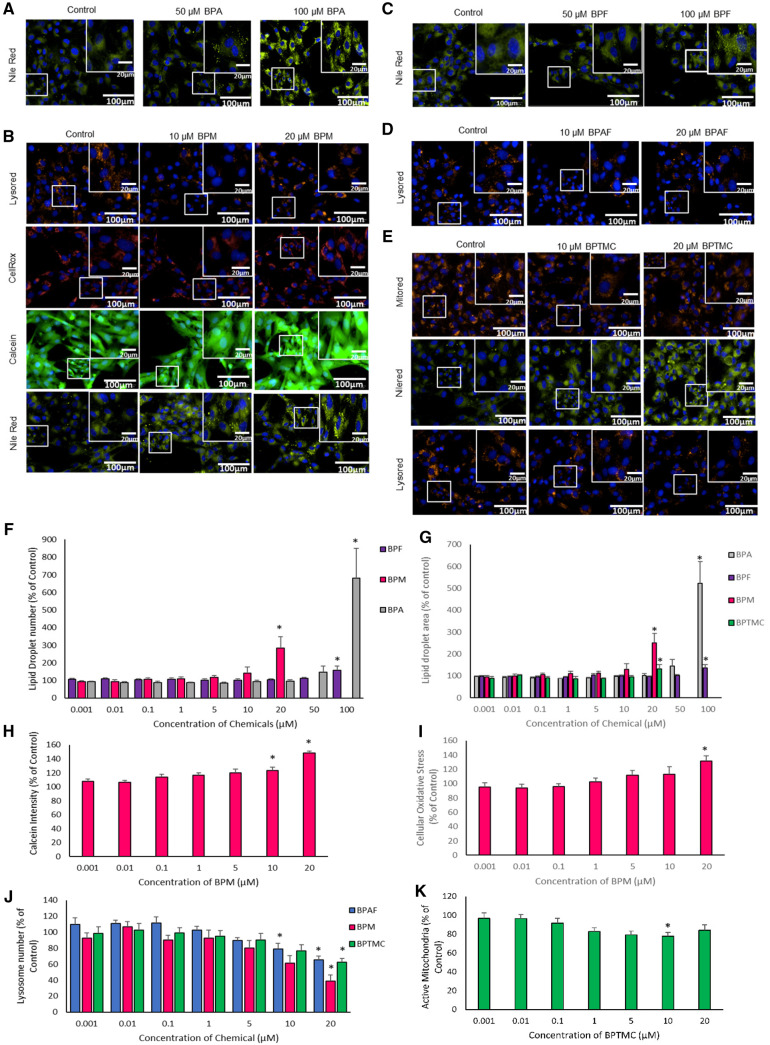
Exposure to bisphenols affected a variety of morphological and functional endpoints in KGN cells (Figure 5). Specifically, exposure to increasing concentrations of BPA (Figure 5A), BPM (Figure 5B), BPF (Figure 5C), and BPTMC (Figure 5E) increased lipid droplet numbers and areas (Figs. 5F and 5G). The lowest BMCs for effects on lipid droplet numbers and area in KGN cells were for BPM (11.1 and 10.2 μM, respectively; Figure 6, Table 3). The corresponding AED values for these endpoints for BPM were 2.6 and 2.4 mg/kg/day (Figure 7; Table 3). Furthermore, exposure to increasing concentrations of BPM (Figure 5B), BPAF (Figure 5D), and BPTMC (Figure 5E) decreased lysosome numbers (Figure 5J). The BMCs for BPAF and BPM for this endpoint were both 6 μM, while the BMC value for BPTMC was 9.4 μM (Figure 6). The AEDs were for 1.1 mg/kg/day for BPAF, 1.4 mg/kg/day for BPM and 0.5 mg/kg/day for BPTMC (Figure 7; Table 3). The exposure of KGN cells to BPM also increased Calcein and CellRox staining (Figs. 5B, H, and I); the AEDs for BPM for these stress responses were 1.6 mg/kg/day and 2.4 mg/kg/day, respectively (Figure 7; Table 3). A significant decrease in active mitochondria was observed only in KGN cells exposed to 10 µM BPTMC (Figs. 5E and 5K).
Figure 5.
Effects of bisphenols on KGN human granulosa cells. Cells were exposed for 48 h to each chemical followed by fluorescence microscopy using the Operetta High Content imaging system (40× magnification). A, Images illustrating the effects of BPA on lipid droplets; (B) effects of BPM on lysosome numbers, oxidative stress, calcein, and lipid droplet numbers in KGN cells; (C) effects of BPF on lipid droplet numbers in KGN cells; (D) effects of BPAF on lysosome numbers; (E) effects of BPTMC on active mitochondria, lipid droplet, and lysosome numbers. Lysosome numbers, oxidative stress, calcein intensity, active mitochondria, and lipid droplet numbers were determined using Lysored, CellRox, Calcein Mitotracker Red, and Nilered dye staining, respectively. Graphs illustrate results for the effects of: (G) BPF, BPM, and BPA on lipid droplet numbers; BPTMC on lipid droplet areas; (H) BPM on calcein intensity; (I) BPM on cellular oxidative stress; (J) BPAF, BPM, and BPTMC on lysosome numbers; and (K) BPTMC on active mitochondrial numbers. One-way ANOVA was conducted to determine concentrations at which there were significant effects *p < .05, Values represent means ± SEM, N = 5.
An overall comparison of the BMCs and AEDs for the cytotoxicity and cell-type specific phenotypic changes observed in C18-4, MA-10, and KGN cells after exposure to BPA and its analogs is provided in Figure 7. BPS was cytotoxic only in MA-10 cells and did not significantly affect phenotypic markers in any of the cell lines. It is noteworthy that the effects of the other bisphenols on morphological and functional endpoints were generally observed at BMCs and AEDs lower than those associated with cytotoxicity. The lowest BMC we observed was for the increase in mitochondrial numbers in C18-4 cells exposed to BPA. Lipid droplets were the endpoint that was most affected; effects on lipid droplets were observed after exposure to BPA, BPF, BPM, and BPTMC in all 3 cell lines.
DISCUSSION
In this study, we used a live cell high-content imaging approach to demonstrate that six bisphenols, BPA and five structural analogs, induced distinct cellular phenotypic responses in established cell lines, C18-4 male spermatogonial cells, MA-10 Leydig cells, and KGN granulosa cells, representing major aspects of the male and female reproductive system. These cell lines have been used in previous studies to assess endocrine disrupting activity for other chemical families, such as the phthalates (Boisvert et al., 2016; Ernst et al., 2014; Jones et al., 2016; Piché et al., 2012). Our data provide evidence that this approach can be used to sensitively, more rapidly, and more reliably assess and compare the potential effects of bisphenols on targets related to reproduction.
Effects of Bisphenols on C18-4, MA-10, and KGN Cell Viability
Clear cell-line-specific differences among bisphenol analogs with respect to effects on cell viability were observed (Figs. 1 and 2; Table 2); a comparison of the BMC and AED estimates for cytotoxicity is presented in Figure 7. In terms of cell-line-specific effects, BPF and BPS were cytotoxic in MA-10 Leydig cells, but not (at the highest concentrations tested) in C18-4 spermatogonial or KGN cells. In comparing the six bisphenols studied, we found that BPM and BPTMC displayed the highest cytotoxicity in all 3 cell lines, based on IC50, BMC, and AED estimations (Figs. 1 and 2, Table 2); the latter measure is considered to be reflective of an in vivo equivalent dose. This is interesting since there are very few studies available on the potential effects of BPM and BPTMC, despite evidence for their presence in the environment, in house dust in Canada (Fan et al., 2021) and in surface water in Europe and China (Huang et al., 2020; Šauer et al., 2021).
A previous study demonstrated that BPAF was more cytotoxic to C18-4 cells then either BPA or BPS (Liang et al., 2017). Here, we show that both BPA and BPAF were cytotoxic to C18-4 cells, whereas BPS was not. In these cells, BPAF cytotoxicity was observed at a BMC (17.0 μM) similar to that for BPM (16.2 μM). The lowest BMC observed (7.9 μM) in these cells was for BPTMC. The estimated AED for BPTMC (0.4 mg/kg/day) was also lower than that for either BPAF (3.0 mg/kg/day) or BPM (3.8 mg/kg/day). Together, these data suggest that in C18-4 cells, BPTMC is more cytotoxic than the other bisphenols we studied.
Exposure to all the bisphenols tested decreased MA-10 Leydig cell viability. Previous studies with MA-10 cells (Lan et al., 2017; Roelofs et al., 2015) reported that BPS concentrations greater than 30 μM induced cytotoxicity, whereas concentrations greater than 100 μM were required for BPA or BPF cytotoxicity. Here, MA-10 cells were most sensitive to BPM and BPTMC, with BMC values of 7.1 μM and 4.5 μM, respectively. Previous experiments with a testicular coculture system reported that BPA and BPAF were cytotoxic only at high concentrations (Yin et al., 2020). Interestingly, MA-10 cell viability was decreased by exposure to BPF and BPS (BMCs: BPF, 46.3 μM; BPS, 37.7 μM); in contrast, no cytotoxicity was observed with these chemicals in C18-4 or KGN cells.
We did not observe cytotoxicity in KGN cells exposed to BPF or BPS. In contrast to this observation, Huang et al (2020) reported that BPA, BPF, and BPS (at 100 μM), and BPAF (10 μM) all reduced KGN cell viability. The other 4 bisphenols we tested did reduce KGN cell viability; specifically, BPAF, BPM, and BPTMC (BMCs ranging from 14.7 to 38.1 μM) were all more cytotoxic than BPA (BMC, 70.8 μM).
BMC values calculated from our data for each cell line (in triangles) are compared with data from the literature reporting the lowest bisphenol concentrations at which significant decreases in cell viability were observed (in circles) in Supplemental Figure 3. The BMC values that we obtained for the cytotoxicity of BPA, BPS, BPF, and BPAF are generally consistent with the lowest concentrations at which significant decreases in cell viability was observed previously. To the best of our knowledge, no equivalent data are available for BPM and BPTMC.
Effects of Bisphenols on Morphological and Functional Endpoints in C18-4, MA-10, and KGN Cells
The key advantage of live cell high-content imaging is that it is possible to query the effects of a chemical exposure on cell organelles and their functions; this allows a comparison of the effects of chemicals at a “sub-cellular” level and may provide some information on their modes of action. Using fluorescent dye combinations, we assessed the effects of BPA and five analogs on mitochondria, lysosomes, lipid droplets, and oxidative stress. Interestingly, the 6 bisphenols studied induced distinct cellular phenotypic responses that were contingent on the cell type that was exposed.
An increase in “total” mitochondria was observed only in BPA-exposed C18-4 spermatogonial cells, in the absence of a significant effect on the number of active mitochondria or on the ratio of active to total mitochondria. A previous study reported that BPA exposure (100 μM) produced a decrease in the number of active mitochondria in TM3 Leydig cells (Gonçalves et al., 2018). However, in hippocampal neuronal stem cells, BPA treatment increased mitochondrial fragmentation (Agarwal et al., 2016), leading these authors to conclude that BPA-induced neurotoxicity was associated with impairments in mitochondrial dynamics. Dysregulation of mitochondria fission and fusion may occur in response to cellular stress (reviewed by Youle and van der Bliek, 2012). Ultrastructural analyses of mitochondria would help to determine if BPA exposure dysregulates mitochondrial fission in C18-4 cells.
Lysosomes are involved in recycling organelles and proteins during autophagy. They also play a crucial role in cholesterol uptake from LDL, an important source of cholesterol for steroidogenic cells. Interestingly, exposure to bisphenols produced opposite effects on lysosome numbers in 2 steroidogenic cell lines, MA-10 and KGN cells. Lysosome numbers were increased after exposure to BPA or BPAF in MA-10 cells (Figure 4). In contrast, exposure to BPAF, BPM, or BPTMC decreased the number of lysosomes in KGN cells (Figure 5). Previous studies have shown that Leydig cells have high frequencies of autophagy in comparison to other cell types (Tang, 1988; Tang et al., 1988, 1992). Further, autophagy promoted cholesterol uptake in Leydig cells by eliminating Na+/H+ exchanger regulatory factor 2 (NHERF2) accumulation in the cells, thus preventing decreases in steroidogenesis (Gao et al., 2018). Autophagy and cholesterol uptake from LDL are also important in the regulation of steroidogenesis in ovarian granulosa cells; hence, further investigations would be needed to explain the differences we observed in the responses of MA-10 and KGN cells to bisphenols.
Lipid droplets play key roles in cell energy metabolism and function. In C18-4 cells, exposure to BPF (100 μM) decreased the number and total area of lipid droplets (Figure 3). A decrease in lipid droplets was also observed in MA-10 cells exposed to BPTMC (1 μM) (Figure 4). In contrast to these findings, the exposure of KGN cells to BPA (100 μM), BPM (20 μM), or BPF (100 μM) increased lipid droplet numbers (Figure 5). Lipid droplet accumulation may be due to a disruption in cholesterol transport out of cells due to hindrance in enzymes, such as hormone sensitive lipases (LIPE) (Kraemer and Shen, 2002) or to a defect in the fusion of the autophagosome to the lysosome (Song et al., 2019). A previous study reported that the exposure of KGN cells to BPA resulted in an increase in PPARγ expression, a known regulator of fatty acid biosynthesis and storage (Kwintkiewicz et al., 2010). A better understanding of lipid droplet dynamics and their composition is needed to determine the impact of increased or decreased droplets on energy metabolism or, in the case of MA-10 or KGN cells, on steroidogenesis.
An increase in cellular oxidative stress was observed in C18-4 and MA-10 cells exposed to increasing concentrations of BPA and in KGN cells exposed to increasing concentrations of BPM. Previous studies have associated BPA-induced oxidative toxicity with male reproductive toxicity (Kabuto et al., 2004; Othman et al., 2016). Further studies are needed to elucidate the impact of the increase in oxidative stress induced by BPM on cell dynamics.
Conclusions
Our data reveal that phenotypic endpoints may be more sensitive measures of chemical-induced cellular insult than cytotoxicity. Using a single cell imaging approach, we have shown that the six bisphenols tested have effects that are both chemical and cell-line specific. Overall, BPTMC was the most potent bisphenol studied, whereas BPS induced the lowest in vitro toxicity across the endpoints and cell-lines tested. Importantly, some of the chemicals that are replacing BPA in commerce today may be similar to or more potent than BPA.
Together, these data illustrate the value of using a set of target cell lines and phenotypic markers to compare the effects of a regulated (legacy) substance, such as BPA, with chemicals analogs that are in use or under consideration as substitutes. Estimated BMC values and AED doses, together with additional data on human exposure, can be a useful line of evidence for screening chemicals to identify those with a higher potential for concern in downstream risk assessment applications.
SUPPLEMENTARY DATA
Supplementary data are available at Toxicological Sciences online.
Supplementary Material
ACKNOWLEDGMENTS
We thank Dr Nicole Kleinstreuer for providing some of the bisphenols and Dr Nicolas Audet for his help with the high content imaging system. We thank Drs Michael Wade and Clotilde Maurice for their helpful comments and input during manuscript preparation. Finally, we should also like to thank Charlise Chen for her assistance in comparing our bisphenol cytotoxicity data with the data from the literature that are presented in Supplementary Figure 3.
FUNDING
This study was supported by a Canadian Institutes of Health Research (CIHR) Institute for Population and Public Health team (FRN no. IP3‐150711) and by McGill University. A.R. is the recipient of a Postdoctoral Fellowship from the Faculty of Medicine of McGill University. B.F.H. and B.R. are James McGill Professors.
DECLARATION OF CONFLICTING INTERESTS
The authors declared no potential conflicts of interest with respect to the research, authorship, and/or publication of this article.
REFERENCES
- Agarwal S., Yadav A., Tiwari S. K., Seth B., Chauhan L. K., Khare P., Ray R. S., Chaturvedi R. K. (2016). Dynamin-related protein 1 inhibition mitigates bisphenol A-mediated alterations in mitochondrial dynamics and neural stem cell proliferation and differentiation. J. Biol. Chem. 291, 5923–15939. [DOI] [PMC free article] [PubMed] [Google Scholar]
- Ahmed S., Atlas E. (2016). Bisphenol S- and bisphenol A-induced adipogenesis of murine preadipocytes occurs through direct peroxisome proliferator-activated receptor gamma activation. Int. J. Obes. 40, 1566–1573. [DOI] [PubMed] [Google Scholar]
- Ahsan N., Ullah H., Ullah W., Jahan S. (2018). Comparative effects of Bisphenol S and Bisphenol A on the development of female reproductive system in rats; a neonatal exposure study. Chemosphere 197, 336–343. [DOI] [PubMed] [Google Scholar]
- Amar S., Binet A., Téteau O., Desmarchais A., Papillier P., Lacroix M. Z., Maillard V., Guérif F., Elis S. (2020). Bisphenol S impaired human granulosa cell steroidogenesis in vitro. Int. J. Mol. Sci. 21, 1821.. [DOI] [PMC free article] [PubMed] [Google Scholar]
- Ascoli M. (1981). Characterization of several clonal lines of cultured leydig tumor cells: Gonadotropin receptors and steroidogenic responses. Endocrinology 108, 88–95. [DOI] [PubMed] [Google Scholar]
- Boisvert A., Jones S., Issop L., Erythropel H. C., Papadopoulos V., Culty M. (2016). In vitro functional screening as a means to identify new plasticizers devoid of reproductive toxicity. Environm. Res. 150, 496–512. [DOI] [PubMed] [Google Scholar]
- Boudalia S., Oudir M. (2016). Bisphenol-A: Legislation in industrials countries and in Algeria. Res. J. Environ. Toxicol. 10, 189–192. [Google Scholar]
- Braydich-Stolle L., Hussain S., Schlager J. J., Hofmann M. C. (2005). In vitro cytotoxicity of nanoparticles in mammalian germline stem cells. Toxicol. Sci. 88, 412–419. [DOI] [PMC free article] [PubMed] [Google Scholar]
- Camacho L., Lewis S. M., Vanlandingham M. M., Olson G. R., Davis K. J., Patton R. E., Twaddle N. C., Doerge D. R., Churchwell M. I., Bryant M. S., et al. (2019). A two-year toxicology study of bisphenol A (BPA) in Sprague-Dawley rats: CLARITY-BPA core study results. Food Chem. Toxicol. 132, 110728.. [DOI] [PubMed] [Google Scholar]
- Chen Q., Zhou C., Shi W., Wang X., Xia P., Song M., Liu J., Zhu H., Zhang X., Wei S., et al. (2020). Mechanistic in silico modeling of bisphenols to predict estrogen and glucocorticoid disrupting potentials. Sci. Total Environ. 728, 138854.. [DOI] [PubMed] [Google Scholar]
- Chen Z. J., Zhang K. S., Ge L. C., Liu H., Chen L. K., Du J., Wang H. S. (2016). Signals involved in the effects of bisphenol A (BPA) on proliferation and motility of Leydig cells: A comparative proteomic analysis. Toxicol. Res. 5, 1573–1584. [DOI] [PMC free article] [PubMed] [Google Scholar]
- Deceuninck Y., Bichon E., Marchand P., Boquien C. Y., Legrand A., Boscher C., Antignac J. P., Le Bizec B. (2015). Determination of bisphenol A and related substitutes/analogues in human breast milk using gas chromatography-tandem mass spectrometry. Anal. Bioanal. Chem. 407, 2485–2497. [DOI] [PubMed] [Google Scholar]
- Dvořáková M., Kejlová K., Rucki M., Jírová D. (2018). Selected bisphenols and phthalates screened for estrogen and androgen disruption by in silico and in vitro methods. Neuroendocrinol. Lett. 39, 409–416. [PubMed] [Google Scholar]
- Ernst J., Jann J. C., Biemann R., Koch H. M., Fischer B. (2014). Effects of the environmental contaminants DEHP and TCDD on estradiol synthesis and aryl hydrocarbon receptor and peroxisome proliferator-activated receptor signalling in the human granulosa cell line KGN. Mol. Hum. Reprod. 20, 919–928. [DOI] [PubMed] [Google Scholar]
- Fan X., Katuri G. P., Caza A. A., Rasmussen P. E., Kubwabo C. (2021). Simultaneous measuremnt of 16 bisphenol analogues in house dust and evaluation of two sampling techniques. Emerg. Contam. 7, 1–9. [Google Scholar]
- Feng Y., Yin J., Jiao Z., Shi J., Li M., Shao B. (2012). Bisphenol AF may cause testosterone reduction by directly affecting testis function in adult male rats. Toxicol. Lett. 211, 201–209. [DOI] [PubMed] [Google Scholar]
- Feng Y., Jiao Z., Shi J., Li M., Guo Q., Shao B. (2016). Effects of bisphenol analogues on steroidogenic gene expression and hormone synthesis in H295R cells. Chemosphere 147, 9–19. [DOI] [PubMed] [Google Scholar]
- Feng Y., Shi J., Jiao Z., Duan H., Shao B. (2018). Mechanism of bisphenol AF-induced progesterone inhibition in human chorionic gonadotrophin-stimulated mouse Leydig tumor cell line (mLTC-1) cells. Environ. Toxicol 33, 670–678. [DOI] [PubMed] [Google Scholar]
- Gao F., Li G., Liu C., Gao H., Wang H., Liu W., Chen M., Shang Y., Wang L., Shi J., et al. (2018). Autophagy regulates testosterone synthesis by facilitating cholesterol uptake in Leydig cells. J. Cell Biol. 217, 2103–2119. [DOI] [PMC free article] [PubMed] [Google Scholar]
- Ge L. C., Chen Z. J., Liu H., Zhang K. S., Su Q., Ma X. Y., Huang H. B., Zhao Z. D., Wang Y. Y., Giesy J. P., et al. (2014). Signaling related with biphasic effects of bisphenol A (BPA) on Sertoli cell proliferation: A comparative proteomic analysis. Biochim. Biophys. Acta 1840, 2663–2673. [DOI] [PubMed] [Google Scholar]
- Gonçalves G. D., Semprebon S. C., Biazi B. I., Mantovani M. S., Fernandes G. S. A. (2018). Bisphenol A reduces testosterone production in TM3 Leydig cells independently of its effects on cell death and mitochondrial membrane potential. Reprod. Toxicol. 76, 26–34. [DOI] [PubMed] [Google Scholar]
- González-Rojo S., Lombó M., Fernández-Díez C., Herráez M. P. (2019). Male exposure to bisphenol a impairs spermatogenesis and triggers histone hyperacetylation in zebrafish testes. Environ. Pollut. 248, 368–379. [DOI] [PubMed] [Google Scholar]
- Health Canada. (2018). Bisphenol A (BPA) risk management approach: Performance evaluation for BPA-HEALTH component. Available at: https://www.canada.ca/en/environment-climate-change/services/evaluating-existing-substances/bpa-performance-evaluation.html. Accessed February 4, 2021.
- Heinälä M., Ylinen K., Tuomi T., Santonen T., Porras S. P. (2017). Assessment of occupational exposure to bisphenol A in five different production companies in Finland. Ann. Work Expos. Health 61, 44–55. [DOI] [PubMed] [Google Scholar]
- Heindel J. J., Belcher S., Flaws J. A., Prins G. S., Ho S.-M., Mao J., Patisaul H. B., Ricke W., Rosenfeld C. S., Soto A. M., et al. (2020). Data integration, analysis, and interpretation of eight academic CLARITY-BPA studies. Reprod. Toxicol. S0890-6238, 30150–30157. [DOI] [PMC free article] [PubMed] [Google Scholar]
- Hines C. J., Jackson M. V., Deddens J. A., Clark J. C., Ye X., Christianson A. L., Meadows J. W., Calafat A. M. (2017). Urinary bisphenol A (BPA) concentrations among workers in industries that manufacture and use BPA in the USA. Ann. Work Expos. Health 61, 164–182. [DOI] [PMC free article] [PubMed] [Google Scholar]
- Hofmann M.-C., Braydich-Stolle L., Dettin L., Johnson E., Dym M. (2005). Immortalization of mouse germ line stem cells. Stem Cells 23, 200–210. [DOI] [PMC free article] [PubMed] [Google Scholar]
- Horan K., Girke T. (2020). ChemmineOB: R interface to a subset of OpenBabel functionalities. R package version 1.20.0. Available at: https://github.com/girke-lab/ChemmineOB. Accessed February 4, 2021.
- Huang M., Liu S., Fu L., Jiang X., Yang M. (2020). Bisphenol A and its analogues bisphenol S, bisphenol F and bisphenol AF induce oxidative stress and biomacromolecular damage in human granulosa KGN cells. Chemosphere 253, 126707.. [DOI] [PubMed] [Google Scholar]
- Huang Z., Zhao J. L., Yang Y. Y., Jia Y. W., Zhang Q. Q., Chen C. E., Liu Y. S., Yang B., Xie L., Ying G. G. (2020). Occurrence, mass loads and risks of bisphenol analogues in the Pearl River Delta region, South China: Urban rainfall runoff as a potential source for receiving rivers. Environ. Pollut. 263, 114361.. [DOI] [PubMed] [Google Scholar]
- Ijaz S., Ullah A., Shaheen G., Jahan S. (2020). Exposure of BPA and its alternatives like BPB, BPF, and BPS impair subsequent reproductive potentials in adult female Sprague Dawley rats. Toxicol. Mech. Methods 30, 60–72. [DOI] [PubMed] [Google Scholar]
- Ji K., Hong S., Kho Y., Choi K. (2013). Effects of bisphenol S exposure on endocrine functions and reproduction of zebrafish. Environ. Sci. Technol. 47, 8793–8800. [DOI] [PubMed] [Google Scholar]
- Jiang X., Yin L., Zhang N., Han F., Liu W. B., Zhang X., Chen H. Q., Cao J., Liu J. Y. (2018). Bisphenol A induced male germ cell apoptosis via IFNβ-XAF1-XIAP pathway in adult mice. Toxicol. Appl. Pharmacol. 355, 247–256. [DOI] [PubMed] [Google Scholar]
- Jones S., Boisvert A., Naghi A., Hullin-Matsuda F., Greimel P., Kobayashi T., Papadopoulos V., Culty M. (2016). Stimulatory effects of combined endocrine disruptors on MA-10 Leydig cell steroid production and lipid homeostasis. Toxicology 355–356, 21–30. [DOI] [PubMed] [Google Scholar]
- Kabuto H., Amakawa M., Shishibori T. (2004). Exposure to bisphenol A during embryonic/fetal life and infancy increases oxidative injury and causes underdevelopment of the brain and testis in mice. Life Sci. 74, 2931–2940. [DOI] [PubMed] [Google Scholar]
- Kraemer F. B., Shen W. J. (2002). Hormone-sensitive lipase: Control of intracellular tri-(di-)acylglycerol and cholesteryl ester hydrolysis. J. Lipid Res. 43, 1585–1594. [DOI] [PubMed] [Google Scholar]
- Kwintkiewicz J., Nishi Y., Yanase T., Giudice L. C. (2010). Peroxisome proliferator-activated receptor-γ mediates bisphenol A inhibition of FSH-stimulated IGF-1, aromatase, and estradiol in human granulosa cells. Environ. Health Perspect. 118, 400–406. [DOI] [PMC free article] [PubMed] [Google Scholar]
- LaKind J. S., Levesque J., Dumas P., Bryan S., Clarke J., Naiman D. Q. (2012). Comparing United States and Canadian population exposures from National Biomonitoring Surveys: Bisphenol A intake as a case study. J. Expos. Sci. Environ. Epidemiol. 22, 219–226. [DOI] [PMC free article] [PubMed] [Google Scholar]
- Lan H. C., Wu K. Y., Lin I. W., Yang Z. J., Chang A. A., Hu M. C. (2017). Bisphenol A disrupts steroidogenesis and induces a sex hormone imbalance through c-Jun phosphorylation in Leydig cells. Chemosphere 185, 237–246. [DOI] [PubMed] [Google Scholar]
- Lee J., Kim S., Choi K., Ji K. (2018). Effects of bisphenol analogs on thyroid endocrine system and possible interaction with 17β-estradiol using GH3 cells. Toxicol. In Vitro 53, 107–113. [DOI] [PubMed] [Google Scholar]
- Lee S., Kim C., Youn H., Choi K. (2017). Thyroid hormone disrupting potentials of bisphenol A and its analogues - In vitro comparison study employing rat pituitary (GH3) and thyroid follicular (FRTL-5) cells. Toxicol. In Vitro 40, 297–304. [DOI] [PubMed] [Google Scholar]
- Le Fol V., Aït-Aïssa S., Sonavane M., Porcher J. M., Balaguer P., Cravedi J. P., Zalko D., Brion F. (2017). In vitro and in vivo estrogenic activity of BPA, BPF and BPS in zebrafish-specific assays. Ecotoxicol. Environ. Saf. 142, 150–156. [DOI] [PubMed] [Google Scholar]
- Liang S., Yin L., Yu K. S., Hofmann M. C., Yu X. (2017). High-content analysis provides mechanistic insights into the testicular toxicity of Bisphenol A and selected analogues in mouse spermatogonial cells. Toxicol. Sci. 155, 43–60. [DOI] [PMC free article] [PubMed] [Google Scholar]
- Liu C., Duan W., Li R., Xu S., Zhang L., Chen C., He M., Lu Y., Wu H., Pi H., et al. (2013). Exposure to bisphenol A disrupts meiotic progression during spermatogenesis in adult rats through estrogen-like activity. Cell Death Dis. 4, e676. [DOI] [PMC free article] [PubMed] [Google Scholar]
- López-Rodríguez D., Franssen D., Sevrin E., Gérard A., Balsat C., Blacher S., Noël A., Parent A. S. (2019). Persistent vs transient alteration of folliculogenesis and estrous cycle after neonatal vs adult exposure to bisphenol A. Endocrinology 160, 2558–2572. [DOI] [PubMed] [Google Scholar]
- Lv Y., Li L., Fang Y., Chen P., Wu S., Chen X., Ni C., Zhu Q., Huang T., Lian Q., et al. (2019). In utero exposure to bisphenol A disrupts fetal testis development in rats. Environ. Pollut. 246, 217–224. [DOI] [PubMed] [Google Scholar]
- Nishi Y., Yanase T., Mu Y. M., Oba K., Ichino I., Saito M., Nomura M., Mukasa C., Okabe T., Goto K., et al. (2001). Establishment and characterization of a steroidogenic human granulosa-like tumor cell line, KGN, that expresses functional follicle-stimulating hormone receptor. Endocrinology 142, 437–445. [DOI] [PubMed] [Google Scholar]
- O’Boyle N. M., Banck M., James C. A., Morley C., Vandermeersch T., Hutchison G. R. (2011). Open babel: An Open chemical toolbox. J. Cheminform. 3, 33. [DOI] [PMC free article] [PubMed] [Google Scholar]
- Othman A. I., Edrees G. M., El-Missiry M. A., Ali D. A., Aboel-Nour M., Dabdoub B. R. (2016). Melatonin controlled apoptosis and protected the testes and sperm quality against bisphenol A-induced oxidative toxicity. Toxicol. Ind. Health 32, 1537–1549. [DOI] [PubMed] [Google Scholar]
- Owczarek K., Kubica P., Kudłak B., Rutkowska A., Konieczna A., Rachoń D., Namieśnik J., Wasik A. (2018). Determination of trace levels of eleven bisphenol A analogues in human blood serum by high performance liquid chromatography–tandem mass spectrometry. Sci. Total Environ. 628–629, 1362–1368. [DOI] [PubMed] [Google Scholar]
- Paul Friedman K., Gagne M., Loo L.-H., Karamertzanis P., Netzeva T., Sobanski T., Franzosa J. A., Richard A. M., Lougee R. R., Gissi A., et al. (2020). Utility of in vitro bioactivity as a lower bound estimate of in vivo adverse effect levels and in risk-based prioritization. Toxicol. Sci. 173, 202–225. [DOI] [PMC free article] [PubMed] [Google Scholar]
- Pearce R. G., Setzer R. W., Strope C. L., Sipes N. S., Wambaugh J. F. (2017). Httk: R package for high-throughput toxicokinetics. J. Stat. Softw. 79, 1–26. [DOI] [PMC free article] [PubMed] [Google Scholar]
- Pelch K., Wignall J. A., Goldstone A. E., Ross P. K., Blain R. B., Shapiro A. J., Holmgren S. D., Hsieh J. H., Svoboda D., Auerbach S. S., et al. (2019). A scoping review of the health and toxicological activity of bisphenol A (BPA) structural analogues and functional alternatives. Toxicology 424, 152235.. [DOI] [PubMed] [Google Scholar]
- Pelch K., Wignall J., Goldstone A., Ross P., Blain R., Shapiro A., Holmgren S., Hsieh J.-H., Svoboda D., Auerbach S., et al. (2017). NTP research report on biological activity of bisphenol A (BPA) structural analogues and functional alternatives. NTP Res. Rep. National Toxicology Program, Research Triangle Park, NC. [PubMed]
- Piché C. D., Sauvageau D., Vanlian M., Erythropel H. C., Robaire B., Leask R. L. (2012). Effects of di-(2-ethylhexyl) phthalate and four of its metabolites on steroidogenesis in MA-10 cells. Ecotoxicol. Environ. Saf. 79, 108–115. [DOI] [PubMed] [Google Scholar]
- Qi S., Fu W., Wang C., Liu C., Quan C., Kourouma A., Yan M., Yu T., Duan P., Yang K. (2014). BPA-induced apoptosis of rat Sertoli cells through Fas/FasL and JNKs/p38 MAPK pathways. Reprod. Toxicol. 50, 108–116. [DOI] [PubMed] [Google Scholar]
- Roelofs M. J. E., Berg M. v d., Bovee T. F. H., Piersma A. H., Duursen MBM v. (2015). Structural bisphenol analogues differentially target steroidogenesis in murine MA-10 Leydig cells as well as the glucocorticoid receptor. Toxicology 329, 10–20. [DOI] [PubMed] [Google Scholar]
- Rubin B. S. (2011). Bisphenol A: An endocrine disruptor with widespread exposure and multiple effects. J. Steroid Biochem. Mol. Biol. 127, 27–34. [DOI] [PubMed] [Google Scholar]
- Santoro A., Chianese R., Troisi J., Richards S., Nori S. L., Fasano S., Guida M., Plunk E., Viggiano A., Pierantoni R., et al. (2019). Neuro-toxic and reproductive effects of BPA. Curr. Neuropharmacol. 17, 1109–1132. [DOI] [PMC free article] [PubMed] [Google Scholar]
- Shi M., Sekulovski N., MacLean J. A. 2nd, Hayashi K. (2018). Prenatal exposure to bisphenol A analogues on male reproductive functions in mice. Toxicol. Sci. 163, 620–631. [DOI] [PubMed] [Google Scholar]
- Sipes N. S., Wambaugh J. F., Pearce R., Auerbach S. S., Wetmore B. A., Hsieh J. H., Shapiro A. J., Svoboda D., Devito M. J., Ferguson S. S. (2017). An intuitive approach for predicting potential human health risk with the Tox21 10k library. Environ. Sci. Technol. 51, 10786–10796. [DOI] [PMC free article] [PubMed] [Google Scholar]
- Song D., Chen Y., Wang B., Li D., Xu C., Huang H., Huang S., Liu R. (2019). Bisphenol A inhibits autophagosome-lysosome fusion and lipid droplet degradation. Ecotoxicol. Environ. Saf. 183, 109492.. [DOI] [PubMed] [Google Scholar]
- Statistics Canada. (2013). Canadian Health Measures Survey: Environmental laboratory data, 2016 and 2017. https://www150.statcan.gc.ca/n1/daily-quotidien/191113/dq191113a-eng.htm. Last accessed August 6, 2020.
- Šauer P., Švecová H., Grabicová K., Gönül Aydın F., Mackuľak T., Kodeš V., Blytt L. D., Henninge L. B., Grabic R., Kocour Kroupová H. (2021). Bisphenols emerging in Norwegian and Czech aquatic environments show transthyretin binding potency and other less-studied endocrine-disrupting activities. Sci. Total Environ. 751, 141801.. [DOI] [PubMed] [Google Scholar]
- Tang X. M. (1988). The autophagic activity of Leydig cells in normal rat testes. Shi yan sheng wu xue bao. J. Exp. Biol. 21, 119–129. [PubMed] [Google Scholar]
- Tang X. M., Zhang H. X., Yi J. (1992). Leydig cells—A normal cell model of cellular autophagy. Shi Yan Sheng Wu Xue Bao 25, 39–47. [PubMed] [Google Scholar]
- Tang X. M., Clermont Y., Hermo L. (1988). Origin and fate of autophagosomes in Leydig cells of normal adult rats. J. Androl. 9, 284–293. [DOI] [PubMed] [Google Scholar]
- Téteau O., Jaubert M., Desmarchais A., Papillier P., Binet A., Maillard V., Elis S. (2020). Bisphenol A and S impaired ovine granulosa cell steroidogenesis. Reproduction 159, 571–583. [DOI] [PubMed] [Google Scholar]
- Ullah A., Pirzada M., Jahan S., Ullah H., Shaheen G., Rehman H., Siddiqui M. F., Butt M. A. (2018). Bisphenol A and its analogs bisphenol B, bisphenol F, and bisphenol S: Comparative in vitro and in vivo studies on the sperms and testicular tissues of rats. Chemosphere 209, 508–516. [DOI] [PubMed] [Google Scholar]
- Ullah A., Pirzada M., Afsar T., Razak S., Almajwal A., Jahan S. (2019). Effect of bisphenol F, an analog of bisphenol A, on the reproductive functions of male rats. Environ. Health Prev. Med. 24, 41. [DOI] [PMC free article] [PubMed] [Google Scholar]
- Vandenberg L. N. (2011). Exposure to bisphenol A in Canada: Invoking the precautionary principle. CMAJ 183, 1265–1270. [DOI] [PMC free article] [PubMed] [Google Scholar]
- Yamasaki K., Noda S., Imatanaka N., Yakabe Y. (2004). Comparative study of the uterotrophic potency of 14 chemicals in a uterotrophic assay and their receptor-binding affinity. Toxicol. Lett. 146, 111–120. [DOI] [PubMed] [Google Scholar]
- Yin L., Siracusa J. S., Measel E., Guan X., Edenfield C., Liang S., Yu X. (2020). High-content image-based single-cell phenotypic analysis for the testicular toxicity prediction induced by bisphenol A and its analogs bisphenol S, Bisphenol AF, and tetrabromobisphenol a in a three-dimensional testicular cell co-culture model. Toxicol. Sci. 173, 313–335. [DOI] [PMC free article] [PubMed] [Google Scholar]
- Youle R. J., van der Bliek A. M. (2012). Mitochondrial fission, fusion, and stress. Science 337, 1062–1065. [DOI] [PMC free article] [PubMed] [Google Scholar]
- Zhang H., Zhang Y., Li J., Yang M. (2019). Occurrence and exposure assessment of bisphenol analogues in source water and drinking water in China. Sci. Total Environ. 655, 607–613. [DOI] [PubMed] [Google Scholar]
Associated Data
This section collects any data citations, data availability statements, or supplementary materials included in this article.


