Objective
Pancreatic cancer stem-like cells (P-CSLCs) are thought to be associated with poor prognosis. Previously, we used proteomic analysis to identify a chaperone pro-phagocytic protein calreticulin (CALR) as a P-CSLC–specific protein. This study aimed to investigate the association between CALR and P-CSLC.
Methods
PANC-1-Lm cells were obtained as P-CSLCs from a human pancreatic cancer cell line, PANC-1, using a sphere induction medium followed by long-term cultivation on laminin. To examine the cancer stem cell properties, subcutaneous injection of the cells into immune-deficient mice and sphere formation assay were performed. Cell surface expression analysis was performed using flow cytometry.
Results
PANC-1-Lm showed an increased proportion of cell surface CALR-positive and side-population fractions compared with parental cells. PANC-1-Lm cells also had higher frequency of xenograft tumor growth and sphere formation than PANC-1 cells. Moreover, sorted CALRhigh cells from PANC-1-Lm had the highest sphere formation frequency among tested cells. Interestingly, the number of programmed death-ligand 1–positive cells among CALRhigh cells was increased as well, whereas that of human leukocyte antigen class I–positive cells decreased.
Conclusion
In addition to the cancer stem cell properties, the P-CSLC, which showed elevated CALR expression on the cell surface, might be associated with evasion of immune surveillance.
Key Words: pancreatic cancer, cancer stem cell, calreticulin, immune surveillance, cell surface
Pancreatic cancer has no clear symptoms, and early detection methods for this disease are lacking. In most cases, patients have advanced disease that has already metastasized. Among those patients with pancreatic cancer, only 5% to 25% of patients are able to undergo curative resection. Even after radical resection, a 5-year survival rate is less than 20%, and the median survival time ranges from 12 to 20 months.1 As a result, the 5-year survival rate in patients with pancreatic cancer is approximately 9%.2 This poor prognosis in pancreatic cancer is thought to be due to metastasis even in the early stage and high drug resistance. Pancreatic cancer increases the metastatic ability and resistance to anticancer drugs through the formation of cancer stem cells (CSCs).3,4
Cancer stem cells, including those formed in digestive cancers, have stem cell-like properties such as self-renewal, initiation of tumorigenesis, and therapy resistance.5 To date, a number of human CSCs have been identified and purified in a variety of malignancies, including pancreatic cancer.6 Various studies suggested that CSCs play an important role in metastasis and postoperative recurrence.7 Numerous studies have identified CSC markers in human digestive cancers and investigated their roles in malignancy. These markers are also expressed in normal stem cells.5 It was reported that there was a significant correlation between the expression of a CSC marker CD44 in pancreatic cancer tissues and clinical stage, lymph node metastasis, and the differentiation degree. Moreover, patients with high CD44 expression had worse overall survival than those with low CD44 expression.8 Improving the prognosis in pancreatic cancer requires the development of a novel therapy directed at CSC elimination.
In pancreatic cancer, several cell surface markers such as CD44, CD24, and epithelial-specific antigen (ESA) have been reported and used for identification of CSCs.4 Pancreatic CSCs, which have the 2 functional criteria of self-renewal and differentiation into the cancer cell, were first defined by the simultaneous expression of CD44, CD24, and ESA.9 In addition, pancreatic CSC expressing CD133 showed high proliferative potential and tumorigenesis, including the resistance to chemotherapy.3 Interestingly, a fraction of pancreatic cancer cells positive for both CD44/CD24/ESA and CD133 was restricted to 10% to 40% of the CSC cell population.3 Therefore, this is a limiting factor in identifying pancreatic CSC with known markers such as CD44, CD24, and ESA.10
Pancreatic CSCs are difficult to isolate because this cell population is very rare: triple-positive cells for CD44, CD24, and ESA account for 0.2% to 0.8% of tumor cells.4 To accurately examine different characteristics of pancreatic CSC, a large amount of pancreatic cancer cells is required. We have developed a novel technique to generate pancreatic cancer stem-like cells (P-CSLCs), which allowed us to obtain populations of cells enriched with increased expression of CD44 and CD24 from pancreatic cancer cell lines in serum-free medium.11 Using this technique and our established series of pancreatic cancer cell lines, the Yamaguchi's Pancreatic Krebs (YPK) lines, we obtained sufficient number of cells for 2-dimensional electrophoresis followed by tandem mass spectrometry analysis. We consequently identified several proteins that were specifically expressed in P-CSLC.12 Among those P-CSLC-specific proteins, cell surface calreticulin (CALR) was overexpressed in P-CSLCs compared with the parental cell line. Moreover, CALRhigh cells showed highly enriched side population (SP), which correlated with adenosine triphosphate–binding cassette transporter activity, suggesting that CALRhigh P-CSLCs may have high drug resistance.12
Calreticulin is a 46- to 65-kd chaperone protein localized to the endoplasmic reticulum (ER) that plays diverse roles in cellular metabolism, including Ca2+ homeostasis, cell adhesion, and human leukocyte antigen (HLA) class I assembly. It was also shown that cell surface CALR expression was involved in immune response, during which cell surface CALR in apoptotic cells induced phagocytosis, whereas it could also induce CD47, which caused antiphagocytic signals.13
This study aimed to test the induction of P-CSLCs in commercially available PANC-1 cells. Furthermore, we aimed to investigate the expression of immune surveillance–related molecules in CALR-expressing P-CSLCs to examine the association between CSCs and immune evasion.
MATERIALS AND METHODS
Cell Lines
A human pancreatic cancer cell line, PANC-1, was purchased from the American Type Culture Collection (Rockville, Md). Cells were cultured in Dulbecco's modified Eagle's medium/Nutrient Mixture F-12 (DMEM/F-12, Sigma-Aldrich, Tokyo, Japan) containing 10% heat-inactivated fetal bovine serum (FBS) (Thermo Fisher Scientific, Tokyo, Japan), penicillin (100 U/mL), and streptomycin (100 μg/mL) at 37°C in a humidified atmosphere with 5% CO2.
Induction and Enrichment of P-CSLCs
Cells were suspended in the sphere induction medium, which was a modified neural stem cell medium as previously described.11 The basal composition for the sphere induction medium was DMEM/F-12 supplemented with 10 mM 4-(2-hydroxyethyl)-1-piperazineethanesulfonic acid, 1× antibiotic-antimycotic solution, and 0.6% glucose (all obtained from Sigma-Aldrich). Complete sphere induction medium was prepared by adding final concentrations of 2 μg/mL heparin (Sigma-Aldrich), 10 ng/mL human recombinant epidermal growth factor (Sigma-Aldrich), 10 ng/mL basic fibroblast growth factor (Merck Millipore, Tokyo, Japan), 10 ng/mL leukemia inhibitory factor (Merck Millipore), 60 μg/mL N-acetyl-l-cysteine (Sigma-Aldrich), 1× hormone mix, and 1/50 vol neural survival factor-1 (Lonza, Tokyo, Japan) to the basal medium. The composition of 10× hormone mix was 1 mg/mL transferrin, 250 μg/mL insulin, 0.6 mM putrescine, 0.3 μM sodium selenite, and 0.2 μM progesterone (all obtained from Sigma-Aldrich).
Parental cells were collected and washed to remove serum and then cultured in the sphere induction medium at 37°C in a humidified atmosphere with 5% CO2 for 1 week. The obtained sphere cells were collected and transferred to the 1% laminin–coated dishes (Sigma-Aldrich) with the CSC culture medium. The CSC culture medium was prepared by adding a final concentration of 20 μL/mL B27 supplement (Thermo Fisher Scientific), 2 μg/mL heparin, 10 ng/mL human recombinant epidermal growth factor, 10 ng/mL basic fibroblast growth factor, and 1× hormone mix to the basal medium. Half of the medium was changed every week. After 4 weeks, the obtained adherent cells were designated a PANC-1-Lm.
Flow Cytometry
After cell cultivation, cells were dissociated with Accumax or Accutase (Innovative Cell Technologies, San Diego, Calif). For flow cytometric analysis, the cells were incubated with the following fluorescence-conjugated antibodies: anti-CALR Alexa Fluor 647 (ab196159; Abcam, Tokyo, Japan), anti-CD24 fluorescein isothiocyanate (FITC) (130-095-952; Miltenyi Biotec, Tokyo, Japan), anti-CD44 phycoerythrin (PE)–Vio770 (130-113-336; Miltenyi Biotec), anti-ESA Pacific Blue (324217; BioLegend, San Diego, Calif), anti–programmed death-ligand 1 (PD-L1) PE (329706; BioLegend), anti-HLA class I FITC (560965; BD, Franklin Lakes, NJ), and anti-CD47 PE (556046; BD). Rabbit immunoglobulin G (IgG) Isotype Control Alexa Fluor 647 (ab199093; Abcam), Mouse IgG1 Isotype Control FITC (A07795; BECKMAN COULTER, Tokyo, Japan), recombinant human IgG1 REA Control (S) PE-Vio770 (130-113-440; Miltenyi Biotec), Rat IgG2bκ Isotype Ctrl Antibody Pacific Blue (400627; BioLegend), Mouse IgG2bκ Isotype Control PE (555743; BioLegend), Mouse IgG1κ Isotype Control FITC (555748, BD), and Mouse IgG1κ Isotype Control PE (349043, BD) were used as negative controls for anti-CALR Alexa Fluor 647, anti-CD24 FITC, anti-CD44 PE-Vio770, anti-ESA Pacific Blue, anti–PD-L1 PE, anti-HLA class I FITC, and anti-CD47 PE, respectively. Flow cytometry analysis was performed using a FACSAria III (BD) or a MACSQuant analyzer (Miltenyi Biotec).
Western Blot Analysis
Cells were lysed in a buffer containing 50 mM Tris-HCl (pH 8.0), 5 mM ethylenediaminetetraacetic acid, 5 mM EGTA, 0.2% SDS, 0.5% Nonidet P-40, 1 mM Na3VO4, 20 mM sodium pyrophosphate, and a complete protease inhibitor mixture (Roche Diagnostics, Tokyo, Japan). Afterward, 10 μg of proteins was separated by sodium dodecyl sulfate-polyacrylamide gel electrophoresis and transferred onto a polyvinylidene fluoride membrane (Bio-Rad, Hercules, Calif). Membranes were blocked with 3% skim milk and treated with primary antibodies, and immunoreactive bands were visualized using an ECL Pro (PerkinElmer, Waltham, Mass) and Amersham Imager (GE Healthcare Life Sciences, Tokyo, Japan). Band densities were quantified using ImageJ densitometry analysis software version 1.5.1 (National Institutes of Health, Bethesda, Md). The following antibodies were used: anti–phospho-p44/42 mitogen-activated protein kinase [extracellular signal-regulated kinase 1/2 (ERK1/2)] (#9101; Cell Signaling Technology, Danvers, Mass) and anti–valosin-containing protein (VCP) (GTX113030; Gene Tex, Tokyo, Japan). The expression level of VCP was used as reference.
Side Population Analysis
For SP analysis, the cells were suspended in 5% FBS-containing DMEM/F-12 at a concentration of 1 × 10⁶ cells/mL, and incubated with 5 μg/mL Hoechst 33342 (Sigma-Aldrich) at 37°C for 30 minutes. After washing with 2% FBS-containing PBS, the cells were resuspended in 2% FBS-containing PBS at a concentration of 1 × 10⁷ cells/mL and examined using a BD LSRFortessa X-20 cell analyzer (BD Biosciences, Tokyo, Japan). Hoechst 33342 was excited with a 375-nm trigon violet laser, and dual fluorescence signals were detected using 450/20 (Hoechst 33342-Blue) and 670 LP (Hoechst 33342-Red) filters.
Xenograft Model
Mice with NOD-Rag1null IL2rγnull double mutation (NRG mice) were purchased from the Jackson Laboratory (Bar Harbor, Me) and maintained in a high-efficiency particulate air-filtered environment with autoclave-sterilized cages, food, and bedding. Mice (8–12 weeks old, male) were inoculated subcutaneously with 102, 103, or 104 cells using a 27-gauge needle in each experiment. After 100 days, mice were killed, and the tumor size was measured. All animal studies were conducted in accordance with the Institutional Animal Care and Use Committee of Yamaguchi University and conformed to the Guide for the Care and Use of Laboratory Animals published by the US National Institutes of Health.
Cell Sorting
Dissociated cells were incubated with the rabbit Alexa Fluor 647–conjugated anti-CALR (clone EPR3924; Abcam, Cambridge, Mass) for 30 minutes at 4°C. CALRhigh and CALRlow cells were sorted using BD FACSAria III (BD Biosciences, San Jose, Calif.).
Sphere Formation Assay
Cells (at concentrations of 1, 10, and 100 cells/100 μL) were seeded into 96-well ultralow attachment plates (Corning, Tokyo, Japan) and cultured in the sphere culture medium. After 7 days of culture, the wells in which the sphere was formed were counted.
Statistical Analysis
Each experiment was repeated at least 3 times. Data were expressed as mean (standard deviation [SD]). Significant differences were evaluated using the Fisher exact test, or Student or Welch t test, using R version 3.4.0 software (R Development Core Team, the R project, http://www.r-project.org/). A P value of less than 0.05 was considered statistically significant.
RESULTS
Induction of P-CSLCs
PANC-1 cells showed adherent morphology when cultured in DMEM/F-12 (Fig. 1A), whereas they formed sphere cells when cultured in our sphere induction medium (Fig. 1B). The sphere formation was observed within a few days of culture in cell suspension, and the spheroids grew to a diameter of approximately 200 μm after a week of culture (Fig. 1B). At that point, the spheroids were transferred to the laminin-coated dishes where they were attached to the surface and incubated with sphere culture medium for a month (Fig. 1C).
FIGURE 1.
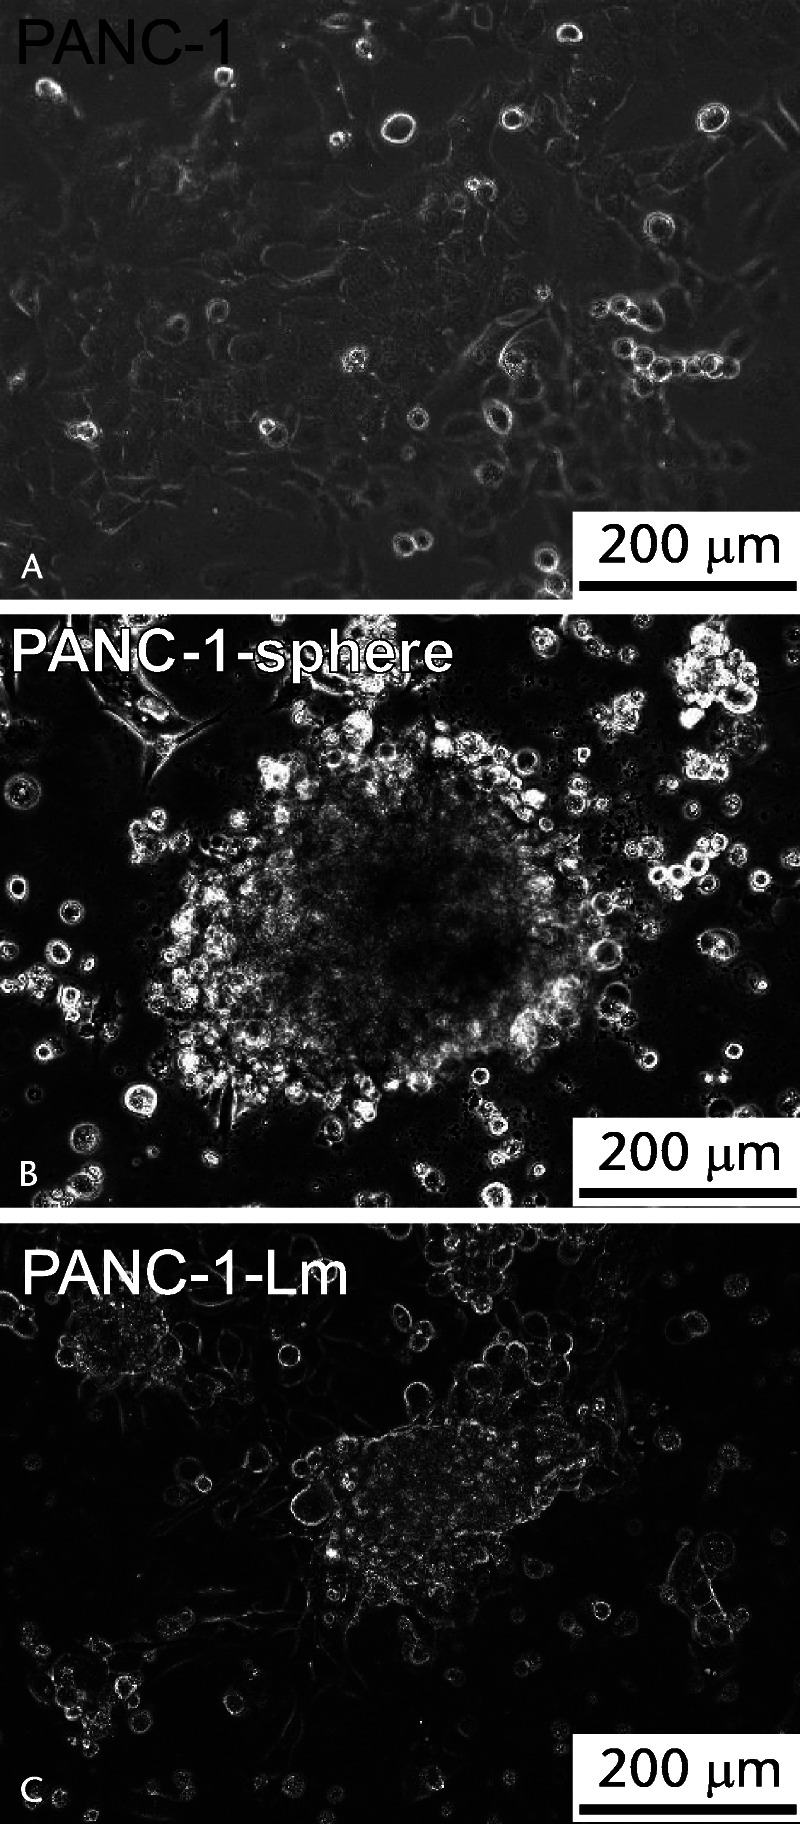
Morphology of the cells derived from PANC-1. A, PANC-1 cells cultured in DMEM/F-12 show adherent morphology. B, PANC-1 cells were suspended in the sphere induction medium and incubated for a week as described in Materials and Methods. C, Obtained PANC-1 spheroids were transferred to the laminin-coated dishes and incubated with CSC culture medium for a month.
Cell Surface CALR Expression and ERK1/2 Phosphorylation Levels in P-CSLCs
Cell surface expression of CALR, which was shown to be induced by the process of sphere formation in other human pancreatic cancer cell lines (YPK-2 and YPK-5),12 was observed in the PANC-1-Lm cells but not in parental PANC-1 cells (Fig. 2). It has been reported that phosphorylation of ERK1/2 was associated with CALR translocation from the ER to the cell surface.14 We therefore examined the levels of ERK1/2 phosphorylation and found that it was approximately 5-fold higher in PANC-1-Lm cells compared with those in PANC-1 cells (Fig. 3).
FIGURE 2.
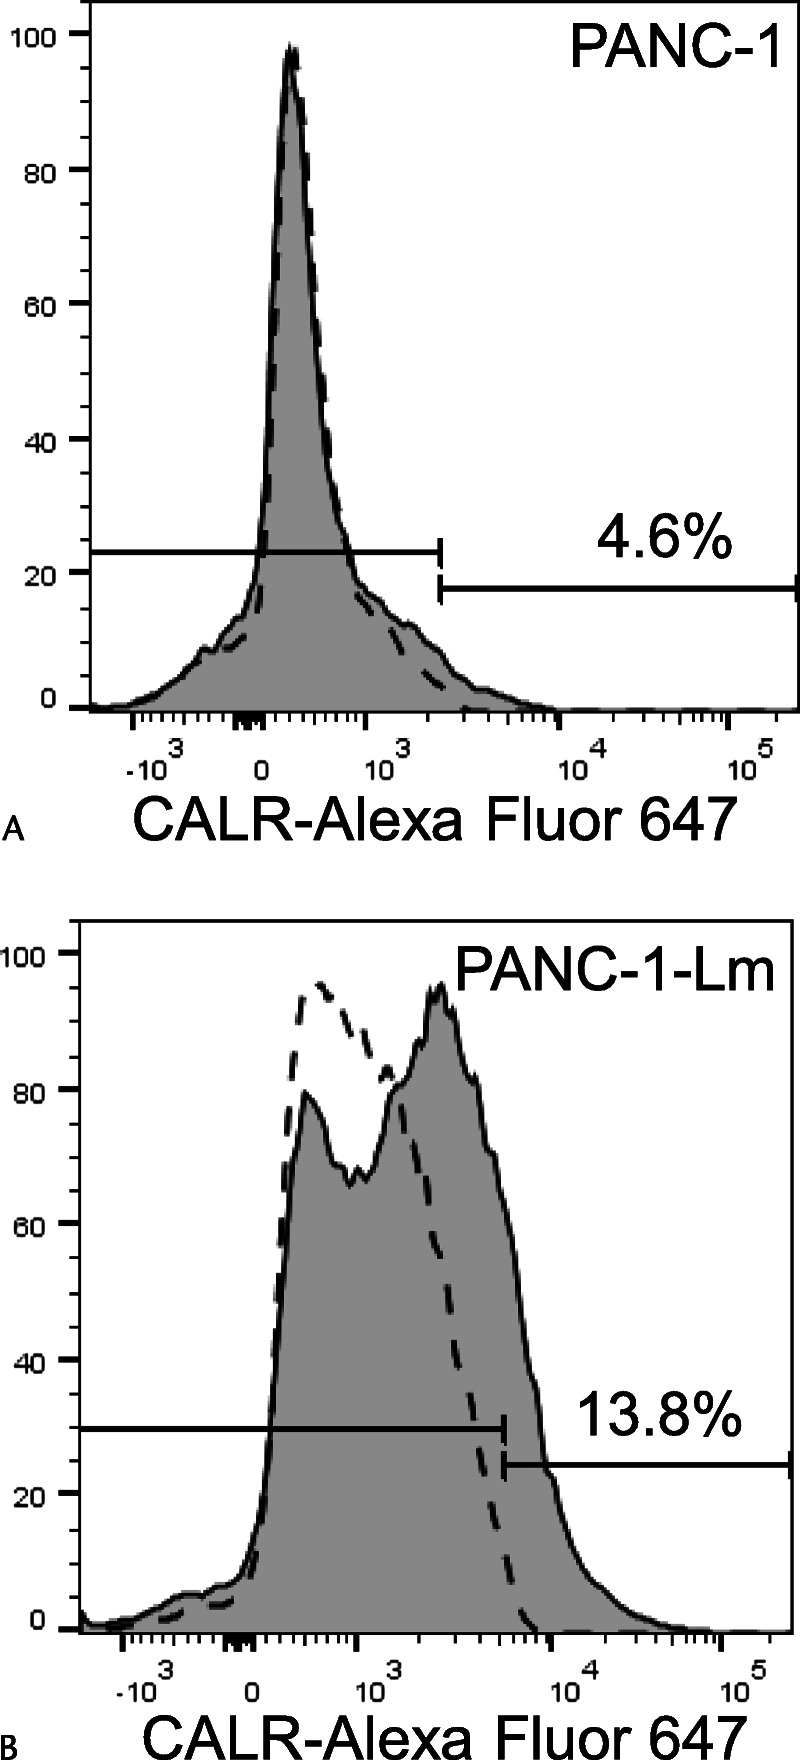
Cell surface expression of CALR. Cells were stained with Alexa Fluor 647–conjugated anti-CALR antibody and then sorted using a flow cytometer. The CALR-positive cell population of PANC-1-Lm cells (B) was higher than that of parental PANC-1 cells (A). Gray histograms and dotted lines represent cells stained with anti-CALR and isotype control antibodies, respectively.
FIGURE 3.
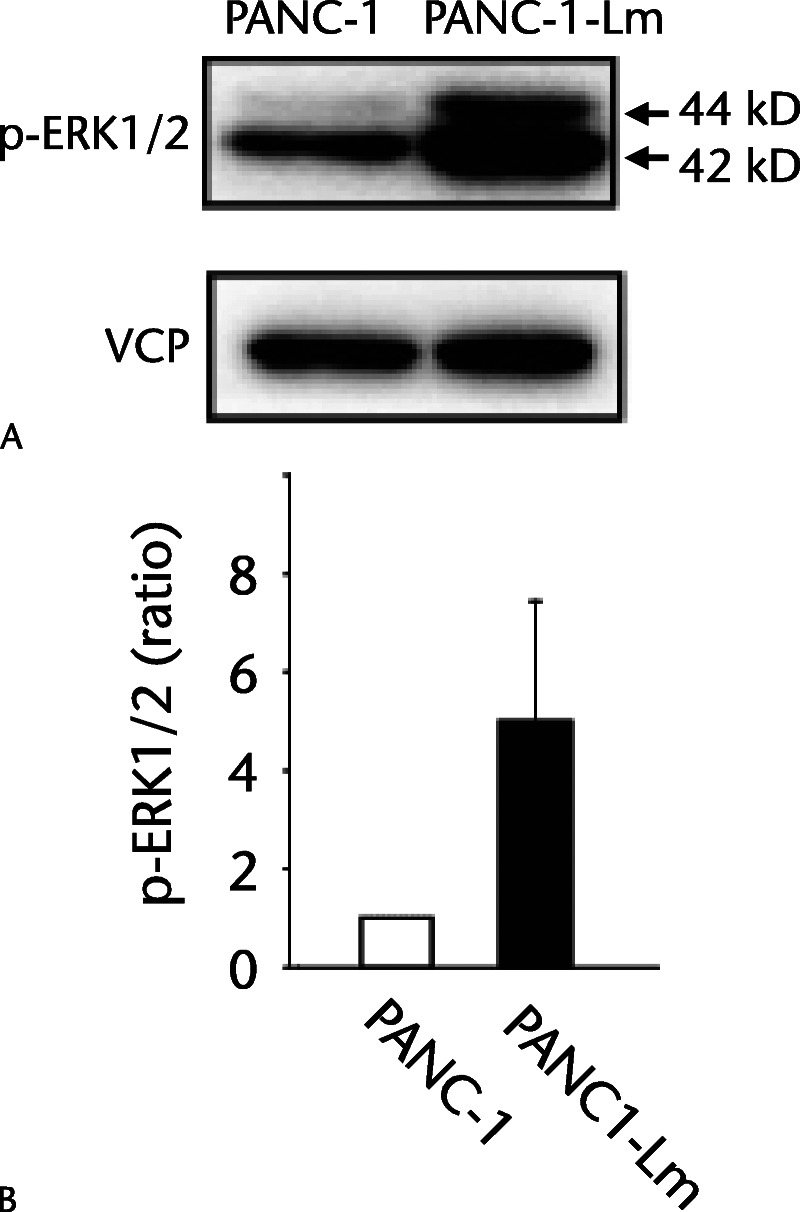
ERK1/2 phosphorylation levels in P-CSLCs. Representative p-ERK1/2 (44/42 kd) protein bands tested using Western blot assay in PANC-1 and PANC-1-Lm (A). Valosin-containing protein (VCP) was used as a loading control. B, Band densities were quantified followed by normalizing to VCP as described in Materials and Methods. The intensities are represented as relative values to PANC-1.
Side-Population in P-CSLCs
Cells with the ability of effluxion of Hoechst dye accomplished by mainly adenosine triphosphate–binding cassette subfamily G member 2 are represented as the SP fraction. The proportion of Hoechst 33342–excreting SP cell fraction among PANC-1 cells was only 1.1%, whereas it was 62.3% among PANC-1-Lm cells (Figs. 4A, D). In PANC-1 cells, both SP and non-SP cell fractions did not show cell surface expression of CALR (Figs. 4B, C). In contrast, PANC-1-Lm cells had CALR-positive cells in both SP and non-SP fractions (Figs. 4E, F). Interestingly, the CALR-positive cells in the non-SP fraction showed moderate intensity, whereas CALR-positive SP cells had higher intensity than those in the non-SP fraction.
FIGURE 4.
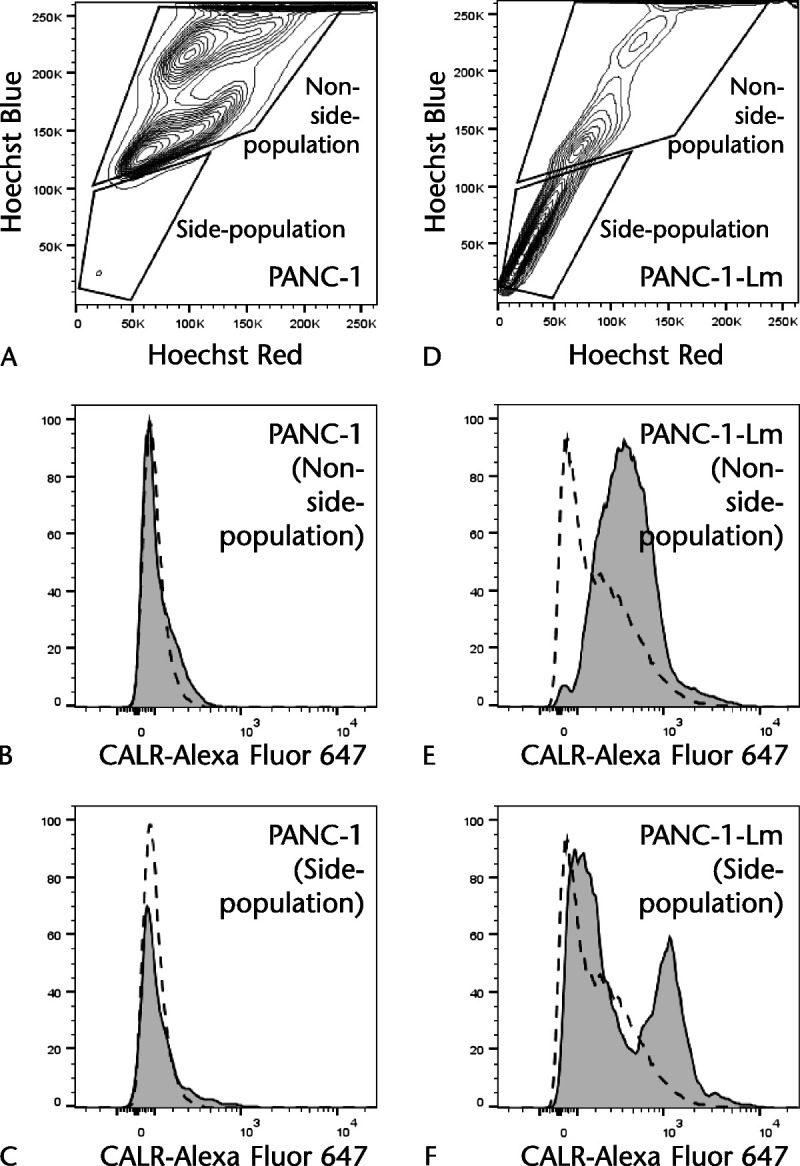
Side population of PANC-1–derived cells. Cells were stained with Alexa Fluor 647–conjugated anti-CALR antibody and incubated with Hoechst 33342. The cells were excited with a 375-nm trigone-violet laser, and dual fluorescence signals were detected in PANC-1 (A) and PANC-1-Lm (D). The lower gate is the SP fraction, and the upper gate is the non-SP fraction, respectively. The CALR expression in the non-SP fraction from PANC-1-Lm (E) is higher than that from PANC-1 (B). The SP fraction from PANC-1-Lm (F) showed higher CALR expression than that from PANC-1 (C). Gray histograms and dotted lines represent cells stained with anti-CALR and isotype control antibodies, respectively.
Tumorigenicity and Tumor Growth Capacity of P-CSLCs in a Xenograft Model
We examined the tumorigenic potential of the PANC-1-Lm cells that were grown in the laminin-coated dish (Fig. 5). PANC-1-Lm and parental PANC-1 cells were inoculated into the right and left flanks of NRG mice, respectively. After 100 days, the mice were killed and tumors were removed. The frequency of tumor formation was higher for the PANC-1-Lm cells than for the parental PANC-1 cells (Table 1). PANC-1-Lm cells could form tumors after the injection of 102 cells, whereas PANC-1 cells could not form tumors after the injection of 103 cells. Among inoculated mice with 104 cells, tumor size after PANC-1-Lm inoculation was significantly larger than that after PANC-1 inoculation [198.5 mm3 (SD, 24.7 mm3) vs 4.3 mm3 (SD, 28.5 mm3); P = 0.005].
FIGURE 5.
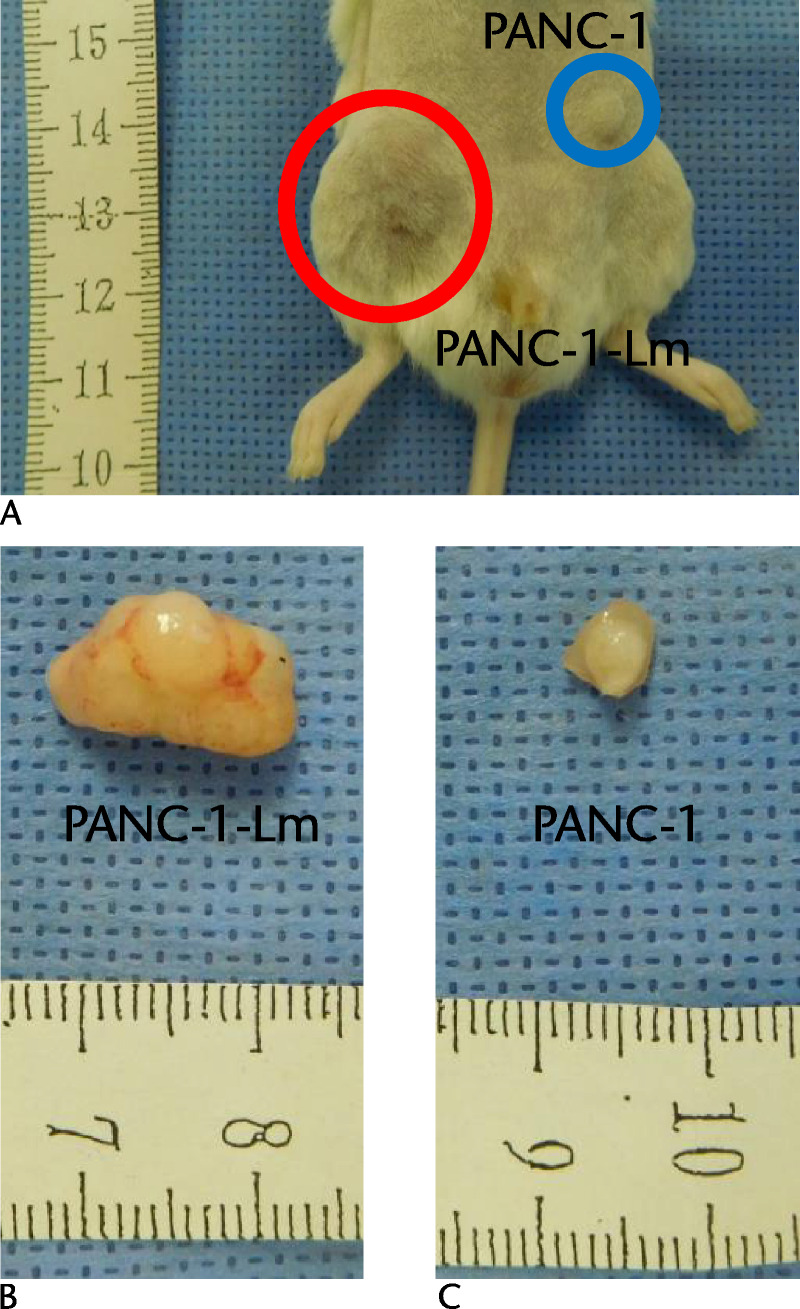
Tumorigenicity of P-CSPCs in a xenograft model. The tumorigenic potential of the cells was evaluated by subcutaneous injection into the immune-deficient NRG mice. A, 104 cells of PANC-1-Lm and same number of PANC-1 cells were inoculated into the right and left flanks, respectively. After 100 days, formed tumors were resected and measured (B and C).
TABLE 1.
Frequencies of Tumor Formation
| Frequency (%) | ||
|---|---|---|
| Cells | PANC-1 | PANC-1-Lm |
| 102 | 0/6 (0.0) | 2/6 (33.3) |
| 103 | 0/7 (0.0) | 3/7 (42.9) |
| 104 | 3/6 (50.0) | 4/6 (66.7) |
Represented number of cells were injected subcutaneously in NRG mice, and then the tumor formation was counted at day 100.
Sphere Formation Capacity of CALRhigh and CALRlow Cells
We also performed in vitro sphere formation assay to evaluate the self-renewal ability of cells. In addition to PANC-1 and PANC-1-Lm cells, CALRhigh and CALRow cells obtained from PANC-1-Lm cells using FACS sorting were examined (Table 2). There was no sphere formation observed in wells with 1 cell. Among wells in which 10 cells were seeded, only the CALRhigh cells formed spheres. In contrast, the CALRlow cells formed no spheres when seeded 100 cells/well, whereas the remaining cells tested formed spheres: PANC-1 (5.0%), PANC-1-Lm (46.2%), and CALRhigh (100.0%).
TABLE 2.
Sphere Formation Frequencies of P-CSLCs
| Frequency (%) | ||||
|---|---|---|---|---|
| Cells | PANC-1 | PANC-1-Lm | CALRlow | CALRhigh |
| 1 | 0/20 (0.0) | 0/26 (0.0) | 0/27 (0.0) | 0/26 (0.0) |
| 10 | 0/20 (0.0) | 0/28 (0.0) | 0/25 (0.0) | 6/25 (24.0) |
| 100 | 1/20 (5.0) | 12/26 (46.2) | 0/25 (0.0) | 25/25 (100.0) |
Sphere formation frequencies of cells with represented numbers were counted in 96-well plates. CALRlow and CALRhigh cells were sorted form PANC-1-Lm cells.
Expression of CSC Markers
Almost all cells among PANC-1 and PANC-1-Lm were CD44 positive (Figs. 6A, C). The CD44-positive cells were further divided based on the CD24 and ESA expression (Figs. 6B, D). Cell fractions triple-positive for CD44, CD24, and ESA in PANC-1 and PANC-1-Lm cells were 0.8 and 2.7%, respectively. The cell surface CALR expression levels in the CD44-positive cells were further examined in accordance with CD24 and ESA expressions (Figs. 6B1–B4 and D1–D4). The highest proportion of CALR-positive cells was observed in a triple-positive PANC-1-Lm cell population. In contrast, PANC-1 cells showed a low population of cells with positive CALR levels (3.1% to 12.0%) in all 4 fractions.
FIGURE 6.
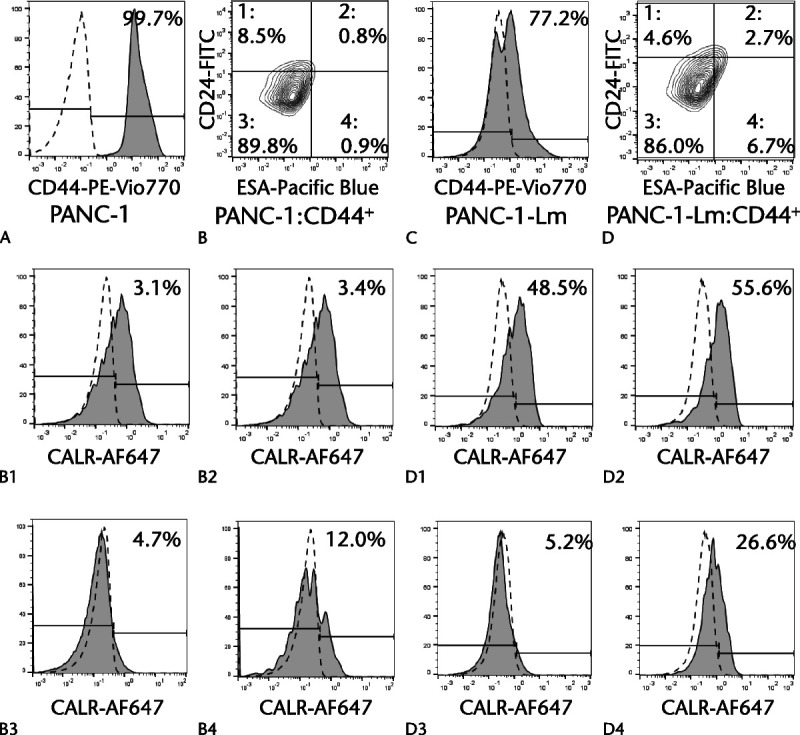
CALR expressions in CD24+/CD44+/ESA+ cells. Cells were stained simultaneously with PE-Vio770–conjugated anti-CD44 antibody, FITC-conjugated anti-CD24 antibody, Pacific Blue–conjugated anti-ESA antibody, and Alexa Fluor 647–conjugated anti-CALR antibody and then sorted using a flow cytometer. Most cells were positive for CD44 among PANC-1 cells (A) and PANC-1-Lm cells (C). Positive cells for CD44 in PANC-1 cells were divided into 4 populations based on the CD24 and ESA expressions (B and D). High expression of CD44, CD24, or ESA was determined with the cutoff line of the top 1% of cells treated with each isotype control. The expression of CALR in each group was examined (B1–B4 and D1–D4). Gray histograms and dotted lines represent cells stained with anti-target and isotype control antibodies, respectively.
Expression of the Cancer Immune-Related Molecules in P-CSLCs
We examined cell surface expression of PD-L1, HLA class I, and CD47 in the PANC-1-derived cells, because the relationship between cell surface CALR and immune response has been reported previously.13 PANC-1-Lm and CALRhigh cells had higher proportion of PD-L1-positive cells than PANC-1 did (8.6%, 30.6%, and 4.8% for PANC-1-Lm, CALRhigh, and PANC-1, respectively) (Figs. 7A–C). Conversely, the proportion of HLA class I-positive cells was decreased in PANC-1-Lm (47.6%) and CALRhigh (38.3%) cells compared with that in the parental PANC-1 cells (95.7%) (Figs. 7D–F). Positive cells for CD47 in PANC-1-Lm and CALRhigh cells were lower than those in PANC-1 cells (PANC-1, 96.0%; PANC-1-Lm, 37.1%; CALRhigh, 38.9%; Figs. 7G–I).
FIGURE 7.
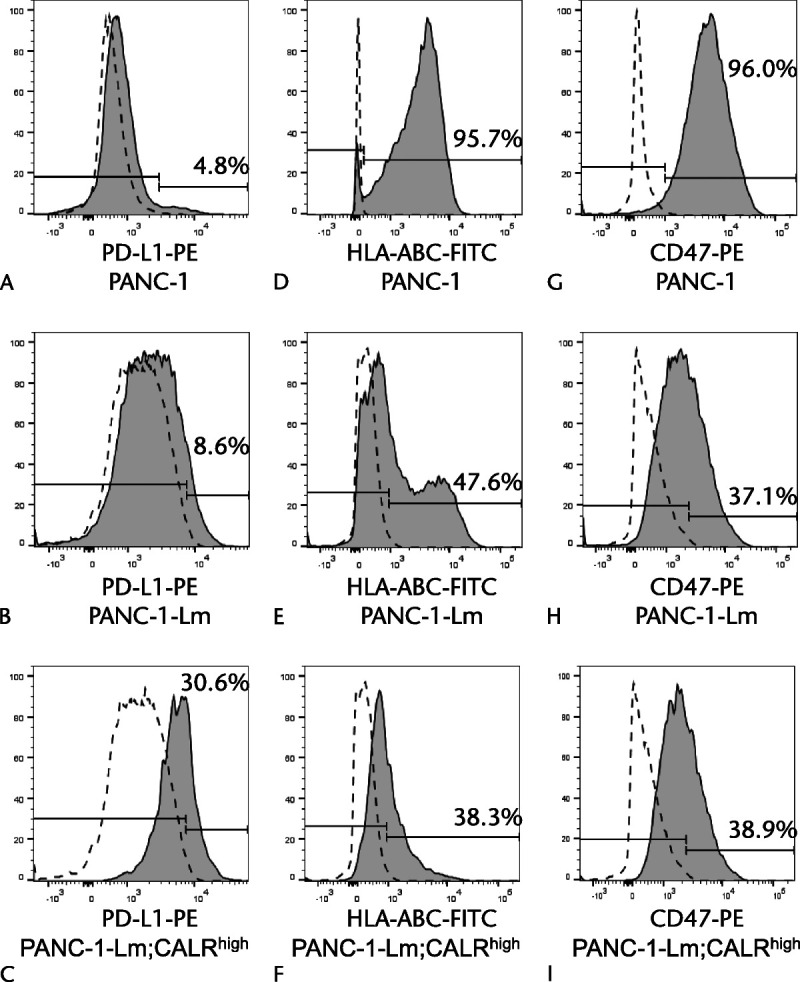
Expressions of PD-L1, HLA class I, and CD47 in P-CSLCs. Cells were stained with PE-conjugated anti–PD-L1 antibody (A–C), FITC-conjugated anti-HLA class I antibody (D–F), and PE-conjugated anti-CD47 antibody (G–I), and then sorted using a flow cytometer. Gray histograms represent cells stained with anti–PD-L1, anti-HLA class I, or anti-CD47 antibodies. Dotted lines represent cells stained with isotype control antibodies.
DISCUSSION
In this study, the PANC-1-Lm cells were induced as P-CSLCs using a commercially available human pancreatic cancer cell line, PANC-1, using our previously reported CSLC induction/enrichment method (Fig. 1).11 The PANC-1-Lm cells obtained had the characteristics of P-CSLCs including an increased population of SP fraction (Fig. 4), capacity of sphere formation (Table 2), and tumorigenic potential (Table 1). A sorting of SP fraction is known as a method for stem cell collection, and it has been reported that SP fraction in gastrointestinal cancer cells had a high tumorigenic potential.15,16 Sphere formation assay indicates self-renewal capability of cells under nonadhesive conditions.17 In pancreatic cancer, it was also reported that the sphere-forming cells showed increased resistance to anticancer drugs, cell growth, metastatic potential, and enriched SP fraction.18–20 Examination of a tumor formation ability using immunodeficient mice is one of the usual methods for identification of CSC properties.21 In pancreatic cancer, the cells positive for pancreatic cancer stem cell (P-CSC) surface markers CD44, CD24, and ESA represent a highly tumorigenic subpopulation.4 The important CSC properties are the capacity for self-renewal and tumorigenicity, which allow generation of new cancer cells.22 Therefore, we considered that our PANC-1-Lm cells obtained from PANC-1 cells had the characteristics of P-CSLC as shown in the previous report with other cell lines.18–21
Our previous proteomic analysis showed that the expression level of CALR was higher in P-CSLCs, YPK-2-Lm, and YPK-5-Lm cells than in parental YPK-2 and YPK-5 cells.12 Interestingly, the increased CALR expression occurred on the cell surface but not in the intracellular space.12 In this study, almost no CALR expression was observed on the cell surface in PANC-1 cells, whereas PANC-1-Lm showed increased CALR expression on the cell surface (Fig. 2). Furthermore, cell surface CALR expression was observed in an SP fraction of PANC-1-Lm (Figs. 4E, F). The CALR-positive expression levels in the SP fraction of PANC-1-Lm cells were represented by a binomial distribution. It suggested that the CALR-positive cells contained not only P-CSLCs but also the non-P-CSLCs. In addition to CD24+/CD44+/ESA+ cells as mentioned above, CD133 highly expressing pancreatic cancer cells have been reported as P-CSCs with resistance to chemotherapy, high proliferative potential, and increased tumorigenesis.3 Several other P-CSC markers have also been reported; however, there was a partial overlap in their expression patterns due to the heterogeneity of P-CSC.10 Although each P-CSC marker might be able to label the subpopulation of P-CSC, it may be difficult to identify the universal marker for P-CSC even in the complex combination of the markers.
Calreticulin is a 46- to 65-kd chaperone protein predominantly located in the ER. It has been reported to be involved in intracellular metabolism, including calcium homeostasis and cell adhesion.23 Our previous and present studies indicated the importance of cell surface localization of CALR in P-CSLCs.12 Calreticulin was reported as normally expressed in ER, and ERK phosphorylation caused CALR translocation to the cell surface.14 Similarly, the expression of CALR on cell surface may be caused by activation of ERK signaling, as phosphorylation of ERK was observed in PANC-1-Lm cells (Fig. 3). In addition, it has been reported that CALR expression is related to carcinogenesis, enhancement of the therapeutic resistance in cancer, and the promotion of epithelial-mesenchymal transition.24 These qualities related to the CALR expression also correspond to the characteristics of CSCs. Indeed, the CALRhigh cell population in PANC-1-Lm showed the highest sphere formation efficiency; on the other hand, sphere formation was not observed in the CALRlow cell population in PANC-1-Lm (Table 2). Among different subpopulations based on the CALR expression in PANC-1-Lm, the CALR-positive rate was the highest in CD24+/CD44+/ESA+ cells (Figs. 6D1–D4). Therefore, the CALR expression might reflect CSCs.
Another known role of CALR is the regulation of the immune response, which is associated with MHC class I and CD47.13,25 In this study, the decreased expression of both HLA class I and CD47 was observed in P-CSLC (Figs. 7D–I). Furthermore, the expression of PD-L1, which is a ligand for exhaustion receptor in T cells,26 was increased along with CALR expression (Figs. 7A–C). It has been reported that immune evasion of P-CSC was accomplished by both decreasing costimulatory molecules and increasing suppressive molecules, including PD-L1 in T-cell activation.27 Decrease in the level of HLA class I on the cell surface causes the reduction in antigen presentation, which helps in escaping the immune surveillance performed by the T cells,28 although cells with loss of HLA class I expression can be attacked by natural killer cells.29 Recently, it has been reported that immune evasion of pancreatic cancer was induced by an autophagy-dependent down-regulation of MHC class I.30 The mechanism by which the increased expression of CALR on the cell surface reduces HLA class I expression is unclear. Translocation of CALR to the cell surface from ER might weaken the role of CALR in the promotion of antigen/HLA complex formation. The expression of CD47, which acts as the CALR antagonist, allows cancer cells to evade phagocytosis by macrophage cells.13 In this study, however, the immune-suppressive CD47 expression was decreased in P-CSLCs, although the changes in PD-L1 and HLA class I molecule expression in P-CSLCs suggest the escape from immune surveillance by T cells. In contrast, reduction in CD47 has been reported to increase self-renewal, asymmetric division, and differentiation ability of cells.31,32 It is suggested that the decrease in CD47 expression enhances the self-renewal ability of P-CSLCs.
Immunotherapy targeting PD-1/PD-L1 in patients with pancreatic cancer was not effective in a multicenter phase I trial.33 However, pancreatic cancer with the coexpression of PD-L1 and c-Myc showed poor overall survival.34 In the xenograft model, a combination of JQ1, an inhibitor of c-Myc, with an anti–PD-L1 antibody was reported to exert a synergistic inhibition of pancreatic ductal adenocarcinoma growth.34 MYC protein has been reported as a positive regulator of not only PD-L1 but also CD47 expression.35 Although only few immune-related molecules were tested in this study and the mechanisms of the CALR regulation of the immune system are unclear, the changes in expression of the immune-related molecules, PD-L1 and HLA class I, in P-CSLCs with elevated CALR level were observed. This study suggests that the possibility of combined immune-targeted therapy including CALR might be effective for P-CSLCs.
ACKNOWLEDGMENT
We appreciate Akiko Sano for her assistance with this project.
Footnotes
This study was partially supported by the Pancreas research foundation of Japan and JSPS KAKENHI grant numbers 18K16365, 18K08646, and 17H06903.
The authors declare no conflict of interest.
Contributor Information
Yasuhiro Fujiwara, Email: yasuhifu@yamaguchi-u.ac.jp.
Kiyoshi Yoshimura, Email: kyoshim1@med.showa-u.ac.jp.
Satoshi Matsukuma, Email: smatsu@yamaguchi-u.ac.jp.
Nobuyuki Fujiwara, Email: nobu07172002@gmail.com.
Mitsuo Nishiyama, Email: n-mitsuo@yamaguchi-u.ac.jp.
Shinsuke Kanekiyo, Email: sin018@yamaguchi-u.ac.jp.
Hiroto Matsui, Email: matsui-h@yamaguchi-u.ac.jp.
Yoshitaro Shindo, Email: y.shindo@yamaguchi-u.ac.jp.
Yukio Tokumitsu, Email: yt790604@yamaguchi-u.ac.jp.
Shin Yoshida, Email: syoshida@yamaguchi-u.ac.jp.
Michihisa Iida, Email: miida@yamaguchi-u.ac.jp.
Nobuaki Suzuki, Email: nobusuzu@yamaguchi-u.ac.jp.
Shigeru Takeda, Email: shigerut@yamaguchi-u.ac.jp.
Tatsuya Ioka, Email: ioka64t@yamaguchi-u.ac.jp.
Shoichi Hazama, Email: hazama@yamaguchi-u.ac.jp.
Hiroaki Nagano, Email: hnagano@yamaguchi-u.ac.jp.
REFERENCES
- 1.Fischer R Breidert M Keck T, et al. Early recurrence of pancreatic cancer after resection and during adjuvant chemotherapy. Saudi J Gastroenterol. 2012;18:118–121. [DOI] [PMC free article] [PubMed] [Google Scholar]
- 2.Siegel RL, Miller KD, Jemal A. Cancer statistics, 2019. CA Cancer J Clin. 2019;69:7–34. [DOI] [PubMed] [Google Scholar]
- 3.Hermann PC Huber SL Herrler T, et al. Distinct populations of cancer stem cells determine tumor growth and metastatic activity in human pancreatic cancer. Cell Stem Cell. 2007;1:313–323. [DOI] [PubMed] [Google Scholar]
- 4.Li C Heidt DG Dalerba P, et al. Identification of pancreatic cancer stem cells. Cancer Res. 2007;67:1030–1037. [DOI] [PubMed] [Google Scholar]
- 5.Tsunedomi R Yoshimura K Suzuki N, et al. Clinical implications of cancer stem cells in digestive cancers: acquisition of stemness and prognostic impact. Surg Today. 2020;50:1560–1577. [DOI] [PubMed] [Google Scholar]
- 6.Chikamatsu K Takahashi G Sakakura K, et al. Immunoregulatory properties of CD44+ cancer stem-like cells in squamous cell carcinoma of the head and neck. Head Neck. 2011;33:208–215. [DOI] [PMC free article] [PubMed] [Google Scholar]
- 7.Kucia M Reca R Miekus K, et al. Trafficking of normal stem cells and metastasis of cancer stem cells involve similar mechanisms: pivotal role of the SDF-1–CXCR4 axis. Stem Cells. 2005;23:879–894. [DOI] [PubMed] [Google Scholar]
- 8.Li XP Zhang XW Zheng LZ, et al. Expression of CD44 in pancreatic cancer and its significance. Int J Clin Exp Pathol. 2015;8:6724–6731. [PMC free article] [PubMed] [Google Scholar]
- 9.Bednar F, Simeone DM. Pancreatic cancer stem cells and relevance to cancer treatments. J Cell Biochem. 2009;107:40–45. [DOI] [PubMed] [Google Scholar]
- 10.Ishiwata T Matsuda Y Yoshimura H, et al. Pancreatic cancer stem cells: features and detection methods. Pathol Oncol Res. 2018;24:797–805. [DOI] [PubMed] [Google Scholar]
- 11.Watanabe Y Yoshimura K Yoshikawa K, et al. A stem cell medium containing neural stimulating factor induces a pancreatic cancer stem-like cell-enriched population. Int J Oncol. 2014;45:1857–1866. [DOI] [PMC free article] [PubMed] [Google Scholar]
- 12.Matsukuma S Yoshimura K Ueno T, et al. Calreticulin is highly expressed in pancreatic cancer stem-like cells. Cancer Sci. 2016;107:1599–1609. [DOI] [PMC free article] [PubMed] [Google Scholar]
- 13.Chao MP Jaiswal S Weissman-Tsukamoto R, et al. Calreticulin is the dominant pro-phagocytic signal on multiple human cancers and is counterbalanced by CD47. Sci Transl Med. 2010;2:63ra94. [DOI] [PMC free article] [PubMed] [Google Scholar]
- 14.Panaretakis T Kepp O Brockmeier U, et al. Mechanisms of pre-apoptotic calreticulin exposure in immunogenic cell death. EMBO J. 2009;28:578–590. [DOI] [PMC free article] [PubMed] [Google Scholar]
- 15.Chiba T Kita K Zheng YW, et al. Side population purified from hepatocellular carcinoma cells harbors cancer stem cell-like properties. Hepatology. 2006;44:240–251. [DOI] [PubMed] [Google Scholar]
- 16.Haraguchi N Utsunomiya T Inoue H, et al. Characterization of a side population of cancer cells from human gastrointestinal system. Stem Cells. 2006;24:506–513. [DOI] [PubMed] [Google Scholar]
- 17.Singh SK Clarke ID Terasaki M, et al. Identification of a cancer stem cell in human brain tumors. Cancer Res. 2003;63:5821–5828. [PubMed] [Google Scholar]
- 18.Yin T Wei H Gou S, et al. Cancer stem-like cells enriched in Panc-1 spheres possess increased migration ability and resistance to gemcitabine. Int J Mol Sci. 2011;12:1595–1604. [DOI] [PMC free article] [PubMed] [Google Scholar]
- 19.Gaviraghi M Tunici P Valensin S, et al. Pancreatic cancer spheres are more than just aggregates of stem marker-positive cells. Biosci Rep. 2011;31:45–55. [DOI] [PMC free article] [PubMed] [Google Scholar]
- 20.Gou S Liu T Wang C, et al. Establishment of clonal colony-forming assay for propagation of pancreatic cancer cells with stem cell properties. Pancreas. 2007;34:429–435. [DOI] [PubMed] [Google Scholar]
- 21.Collins AT Berry PA Hyde C, et al. Prospective identification of tumorigenic prostate cancer stem cells. Cancer Res. 2005;65:10946–10951. [DOI] [PubMed] [Google Scholar]
- 22.Abbaszadegan MR Bagheri V Razavi MS, et al. Isolation, identification, and characterization of cancer stem cells: a review. J Cell Physiol. 2017;232:2008–2018. [DOI] [PubMed] [Google Scholar]
- 23.Lu YC, Weng WC, Lee H. Functional roles of calreticulin in cancer biology. Biomed Res Int. 2015;2015:526524. [DOI] [PMC free article] [PubMed] [Google Scholar]
- 24.Wu Y Xu X Ma L, et al. Calreticulin regulates TGF-β1-induced epithelial mesenchymal transition through modulating Smad signaling and calcium signaling. Int J Biochem Cell Biol. 2017;90:103–113. [DOI] [PubMed] [Google Scholar]
- 25.Neerincx A Hermann C Antrobus R, et al. TAPBPR bridges UDP-glucose:glycoprotein glucosyltransferase 1 onto MHC class I to provide quality control in the antigen presentation pathway. Elife. 2017;6:e23049. [DOI] [PMC free article] [PubMed] [Google Scholar]
- 26.Iwai Y Hamanishi J Chamoto K, et al. Cancer immunotherapies targeting the PD-1 signaling pathway. J Biomed Sci. 2017;24:26. [DOI] [PMC free article] [PubMed] [Google Scholar]
- 27.Hou YC Chao YJ Hsieh MH, et al. Low CD8+ T cell infiltration and high PD-L1 expression are associated with level of CD44+/CD133+ cancer stem cells and predict an unfavorable prognosis in pancreatic cancer. Cancers (Basel). 2019;11:541. [DOI] [PMC free article] [PubMed] [Google Scholar]
- 28.Garrido F, Cabrera T, Aptsiauri N. “Hard” and “soft” lesions underlying the HLA class I alterations in cancer cells: implications for immunotherapy. Int J Cancer. 2010;127:249–256. [DOI] [PubMed] [Google Scholar]
- 29.Ljunggren HG, Kärre K. In search of the ‘missing self’: MHC molecules and NK cell recognition. Immunol Today. 1990;11:237–244. [DOI] [PubMed] [Google Scholar]
- 30.Yamamoto K Venida A Yano J, et al. Autophagy promotes immune evasion of pancreatic cancer by degrading MHC-I. Nature. 2020;581:100–105. [DOI] [PMC free article] [PubMed] [Google Scholar]
- 31.Kaur S Elkahloun AG Singh SP, et al. A function-blocking CD47 antibody suppresses stem cell and EGF signaling in triple-negative breast cancer. Oncotarget. 2016;7:10133–10152. [DOI] [PMC free article] [PubMed] [Google Scholar]
- 32.Kaur S Soto-Pantoja DR Stein EV, et al. Thrombospondin-1 signaling through CD47 inhibits self-renewal by regulating c-Myc and other stem cell transcription factors. Sci Rep. 2016;3:1673. [DOI] [PMC free article] [PubMed] [Google Scholar]
- 33.Brahmer JR Tykodi SS Chow LQ, et al. Safety and activity of anti-PD-L1 antibody in patients with advanced cancer. N Engl J Med. 2012;366:2455–2465. [DOI] [PMC free article] [PubMed] [Google Scholar]
- 34.Pan Y Fei Q Xiong P, et al. Synergistic inhibition of pancreatic cancer with anti-PD-L1 and c-Myc inhibitor JQ1. Oncoimmunology. 2019;8:e1581529. [DOI] [PMC free article] [PubMed] [Google Scholar]
- 35.Casey SC Tong L Li Y, et al. MYC regulates the antitumor immune response through CD47 and PD-L1. Science. 2016;352:227–231. [DOI] [PMC free article] [PubMed] [Google Scholar]


