Abstract
Purpose
To demonstrate the feasibility of CT-less attenuation and scatter correction (ASC) in the image space using deep learning for whole-body PET, with a focus on the potential benefits and pitfalls.
Materials and Methods
In this retrospective study, 110 whole-body fluorodeoxyglucose (FDG) PET/CT studies acquired in 107 patients (mean age ± standard deviation, 58 years ± 18; age range, 11–92 years; 72 females) from February 2016 through January 2018 were randomly collected. A total of 37.3% (41 of 110) of the studies showed metastases, with diverse FDG PET findings throughout the whole body. A U-Net–based network was developed for directly transforming noncorrected PET (PETNC) into attenuation- and scatter-corrected PET (PETASC). Deep learning–corrected PET (PETDL) images were quantitatively evaluated by using the standardized uptake value (SUV) of the normalized root mean square error, the peak signal-to-noise ratio, and the structural similarity index, in addition to a joint histogram for statistical analysis. Qualitative reviews by radiologists revealed the potential benefits and pitfalls of this correction method.
Results
The normalized root mean square error (0.21 ± 0.05 [mean SUV ± standard deviation]), mean peak signal-to-noise ratio (36.3 ± 3.0), mean structural similarity index (0.98 ± 0.01), and voxelwise correlation (97.62%) of PETDL demonstrated quantitatively high similarity with PETASC. Radiologist reviews revealed the overall quality of PETDL. The potential benefits of PETDL include a radiation dose reduction on follow-up scans and artifact removal in the regions with attenuation correction– and scatter correction–based artifacts. The pitfalls involve potential false-negative results due to blurring or missing lesions or false-positive results due to pseudo–low-uptake patterns.
Conclusion
Deep learning–based direct ASC at whole-body PET is feasible and potentially can be used to overcome the current limitations of CT-based approaches, benefiting patients who are sensitive to radiation from CT.
Supplemental material is available for this article.
© RSNA, 2020
Summary
CT-less direct correction of attenuation and scatter in the image space is feasible with use of deep learning for whole-body PET, and the potential benefits and pitfalls of this approach in relation to clinical translation are described.
Key Points
■ Deep learning–based direct correction can reduce the radiation dose by removing CT solely for attenuation and scatter correction, potentially benefiting patients who are more sensitive to radiation.
■ Deep learning–based correction can potentially overcome the current limitations of CT-based correction, such as motion artifacts near the diaphragm and washout artifacts near the bladder.
■ The pitfalls of deep learning–based correction can potentially lead to false-positive or false-negative results because of the technical limitations related to deep learning, such as resolution loss and data dependency.
Introduction
PET/CT has increased sensitivity and specificity for cancer imaging, providing functional and anatomic information simultaneously (1). The use of CT has been important for the attenuation and scatter correction (ASC), which are important quantitative imaging techniques for PET (2). Without successful ASC, artifacts are introduced on reconstructed images, complicating clinical interpretation and causing profound quantitative errors. In addition, correlation with CT can be helpful in distinguishing cases of classic pitfalls of fluorodeoxyglucose (FDG) PET and reducing false-positive and false-negative results. At FDG PET, physiologic activity, benign conditions, and inflammatory processes can mimic and/or mask disease owing to glucose metabolism that is not specific to malignancy (3,4).
In this sense, CT is often a useful component of PET/CT for image interpretation. However, a substantial number of CT examinations are still performed exclusively for PET ASC, a process generally referred to as CT-based attenuation correction, and these scans are redundant if diagnostic CT is performed after PET and/or if diagnostic CT images yield better anatomic information. Thus, if CT-less ASC is feasible at PET/CT, the patient can be spared the additional radiation exposure from CT. Accordingly, removing CT for ASC has the potential to benefit certain subgroups of patients who may require repetitive PET/CT examinations (5,6), especially during childhood (7,8), in terms of their long-term health (9).
In addition to the potential risk related to the CT radiation dose, there are technical limitations to CT-based correction that can cause or worsen artifacts. In the setting of attenuation correction, differences in respiratory motion between PET and CT scans can result in attenuation artifacts (eg, banana artifacts) that can cause a liver lesion to register over the lungs and mimic a lung nodule (4). In addition, high-density metallic implants with high CT numbers (or Hounsfield units) result in high PET attenuation coefficients that can lead to overestimation of the PET activity in the corresponding region and consequently false-positive PET findings (10). In terms of scatter correction, overestimated scatter around the urinary bladder results in washout artifacts or photopenic regions, potentially negatively impacting PET image interpretations (11). This is another motivation for developing a strategy to overcome the limitations of CT-based ASC for PET.
A CT-less ASC approach that could benefit patients by reducing the radiation dose and described artifacts has recently been demonstrated. CT-less correction was developed mainly for PET/MRI because MRI cannot provide the photon attenuation information needed for PET ASC. Accordingly, recent developments have been focused on generating pseudo-CT images from MR images. These developments were enabled with use of deep learning by using convolutional neural networks (12–14). Furthermore, without using MR images, the prediction of pseudo-CT images from noncorrected PET (PETNC) (15–17) and the direct prediction of attenuation- and scatter-corrected PET (PETASC) images from PETNC (18–20) were demonstrated. These predictions can also be applied in PET/CT for CT-less ASC. Specifically, the direct prediction of PETASC from PETNC is performed in the image space—not in the sinogram or projection space—in an accelerated one-step process, without any intermediate step (18). However, in existing studies (19,20), the potential benefits and pitfalls of this direct technique were not evaluated with use of diverse clinical cases. Rather, these studies were focused mainly on technical demonstration of the model’s feasibility and overall quantitative accuracy.
Therefore, the aim of the current study was to investigate the technical and clinical aspects of CT-less ASC performed by using deep learning, illustrating the applicability of this approach to a diversity of clinical cases, an aspect not addressed in the previous studies (18–20). As with any deep learning technique, there is always a risk that it will miss important patterns or generate pseudopatterns when it is exposed to new test data with different characteristics. Hence, the potential benefits and pitfalls of this approach are illustrated through representative studies that were carefully selected on the basis of collaborations with physicians.
Materials and Methods
Patients and Data Description
In this institutional review board–approved study, written consent was waived on the basis of the Health Insurance Portability and Accountability Act Privacy Rule. We used clinical data-access software (mPower; Nuance Healthcare, Burlington, Mass) to retrospectively collect whole-body FDG PET/CT studies in our department. For this study, the first 120 studies that appeared in our search of all cases acquired with a single scanner from February 2016 through January 2018 were collected. We included 110 studies for training and testing and excluded 10 studies that were from small children (eg, infants) or had substantial photopenic artifacts (eg, washout artifacts in the bladder). The 110 studies were from 107 patients because three patients underwent two studies during this period. In terms of pathologic findings, 41 (37.3%) of the 110 studies showed metastases. FDG PET findings were in the head and/or neck for 32 (29.1%) studies; in the chest for 63 (57.3%) studies; in the abdomen or pelvis for 60 (54.5%) studies; and in musculoskeletal regions for 31 (28.2%) studies (Table E1 [supplement]). Thirty-eight of the 110 studies were acquired in males, and 72 were acquired in females. The mean patient age was 58 years ± 18 (standard deviation) (range, 11–92 years); the mean patient weight, 70.2 kg ± 18.2 (range, 38.6–129.3 kg); and the mean body mass index, 25.1 kg/m2 ± 5.8 (range, 14.7–50.5 kg/m2).
FDG PET/CT Image Acquisition
All images were acquired by using a single Gemini TF 64 time-of-flight scanner (Philips Healthcare; Best, the Netherlands) with a 15.3-cm axial field of view. The mean administered dose of FDG was 292.0 MBq ± 65.3 (standard deviation) (range, 161.9–458.8 MBq). The whole-body PET imaging session started 50–90 minutes after the FDG injection, and patients were scanned serially in multiple table positions, with positions ranging from the vertex to the midthigh or toes. The mean scanning duration for each table position was 84.5 seconds ± 11.8 (range, 45–90 seconds). Prior to each PET scan acquisition, a whole-body low-dose CT scan was obtained for ASC.
PET Image Reconstruction
The PET images were reconstructed by using a three-dimensional, blob-based, time-of-flight, list-mode ordered-subsets expectation-maximization algorithm with default parameters (three iterations, 33 subsets, blob increment of 2.0375 voxels, blob radius of 2.5 voxels, blob shape parameter alpha of 8.3689, relaxation parameter of 0.7, voxel size of 4 × 4 × 4 mm). The image matrix size was 144 × 144 or 169 × 169 pixels for a 576-mm or 676-mm transaxial field of view, respectively. The reconstruction for PETNC and PETASC included corrections for normalization, decay, dead time, and randomness; however, postfiltering was not applied.
Deep Learning Workflow and Model Training
A two-dimensional U-Net for CT-less direct ASC in the image space, without any intermediate step (Fig 1), was implemented, as described in the literature (18), by using Keras libraries (version 2.2.0) with a TensorFlow (version 1.9.0) backend on an Ubuntu 18.04 server with a single graphics processing unit (Tesla V100; Nvidia, Santa Clara, Calif). The proposed model was modified to accept an input size of 160 × 160 pixels, considering the size of our whole-body PET data. PETNC images (without CT-based ASC) and PETASC images (with CT-based ASC) were used as paired input and output data for training. A parametric rectified linear unit was used instead of a rectified linear unit for activation to improve the performance of the model. Model training was performed by using the mean squared error (or L2 loss) and an RMSprop optimizer with a learning rate initialized by 0.001 and a minibatch of 256. Data were split such that 90% of the data were used for training and 10% of the data were used for testing (10-fold cross-validation) (18).
Figure 1:
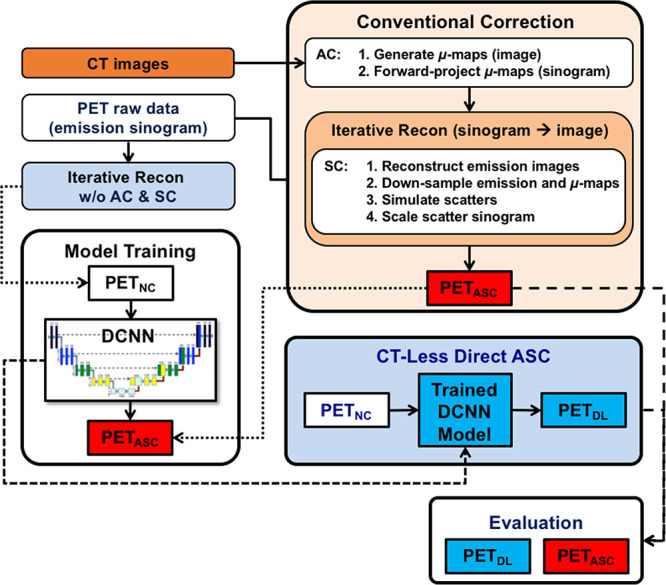
Workflow of CT-less direct attenuation and scatter correction (ASC) using a deep convolutional neural network (DCNN) in the image space, compared with conventional attenuation correction (AC) and scatter correction (SC) performed separately in the sinogram space. PETASC = attenuation- and scatter-corrected PET, PETDL = deep learning–corrected PET, PETNC = noncorrected PET, Recon = reconstruction; w/o = without.
Quantitative and Statistical Analysis
Normalized root mean square error, peak signal-to-noise ratio, and structural similarity index values were used, as described in a previous brain study (18), to evaluate the generalized performance of our proposed model with whole-body PET data. For evaluation, pixel values were transformed to standardized uptake values (SUVs), where SUV = U/(d/w); U is the image-derived uptake (in megabecquerels per milliliter), d is the injection dose (in megabecquerels), and w is the patient’s weight (in grams). In addition,
 |
 |
 |
where ŷij and yij denote the SUV at pixel (i, j) inside the body for the predicted (deep learning–corrected PET [PETDL]) and ground truth (PETASC) images, respectively. MAX is the peak intensity of the image, and MSE is the mean square error. C1 and C2 are constants; μŷ, μy, σŷ, σy, and σŷy are image statistics (mean and standard deviation) calculated in the patch centered at pixel (i, j) (21).
For statistical analysis, a joint histogram was used to show the distribution of voxel-based correlation between the PETDL and reference PETASC. In addition, the distribution of voxel-based errors was shown on an error histogram.
Qualitative Analysis and Presentation by Clinical Radiologists
A nuclear medicine physician (S.C.B.) with 10 years of experience and a postgraduate year-5 radiologic resident (J.H.S.) supervised by a board-certified radiologist (S.C.B.) selected the representative and clinically informative studies encountered in routine clinical practice from overall maximum intensity projection (MIP) images. The radiologist’s review was focused on identifying examples of potential advantages that could benefit patients and identifying recurring or clinically significant cases of pitfalls that could cause false-positive or false-negative results (3). Thus, the following categories of selected studies were presented: (a) representative studies from a healthy individual, patients with metastases, and an obese patient to demonstrate the overall performance of the deep learning approach; (b) 2-month follow-up studies and studies obtained in radiation-sensitive children to show the potential benefits for patients; (c) studies with common attenuation or scatter artifacts to show another potential benefit of the deep learning approach as compared with conventional CT-based ASC; (d) studies showing high-uptake lesions and other patterns generated by deep learning to demonstrate potential pitfalls that may lead to false-negative results; and (e) studies showing pseudo–low-uptake patterns generated by deep learning to illustrate potential pitfalls that may lead to false-positive results.
Results
Quantitative Agreement between PETDL and PETASC
Compared with the reference PETASC, the PETDL had an average normalized root mean square error of 0.21 ± 0.05 (mean SUV ± standard deviation) and a mean peak signal-to-noise ratio of 36.3 ± 3.0. The mean structural similarity index was 0.98 ± 0.01, demonstrating a high level of similarity between the PETDL and PETASC. The joint histogram showed a voxelwise correlation (mean correlation coefficient, 97.62% ± 1.16) between the PETDL and PETASC, with a slope of 0.93 and an R2 value of 0.93 (Fig 2a). The error histogram consistently showed that 90% of voxelwise errors stayed within an SUV of ±0.5 (Fig 2b).
Figure 2a:
![(a) Joint histogram and (b) error histogram of PET voxels at PETDL. Note that the counts were log scaled (ie, log10 [counts]) to visualize small counts in a and normalized to show relative ratios in b. Dashed line = slope of 0.93 derived from the joint histogram through linear regression. SUV = standardized uptake value.](https://cdn.ncbi.nlm.nih.gov/pmc/blobs/da32/8043359/ed8343fb8aec/ryai.2020200137.fig2a.jpg)
(a) Joint histogram and (b) error histogram of PET voxels at PETDL. Note that the counts were log scaled (ie, log10 [counts]) to visualize small counts in a and normalized to show relative ratios in b. Dashed line = slope of 0.93 derived from the joint histogram through linear regression. SUV = standardized uptake value.
Figure 2b:
![(a) Joint histogram and (b) error histogram of PET voxels at PETDL. Note that the counts were log scaled (ie, log10 [counts]) to visualize small counts in a and normalized to show relative ratios in b. Dashed line = slope of 0.93 derived from the joint histogram through linear regression. SUV = standardized uptake value.](https://cdn.ncbi.nlm.nih.gov/pmc/blobs/da32/8043359/0d1439c28f6e/ryai.2020200137.fig2b.jpg)
(a) Joint histogram and (b) error histogram of PET voxels at PETDL. Note that the counts were log scaled (ie, log10 [counts]) to visualize small counts in a and normalized to show relative ratios in b. Dashed line = slope of 0.93 derived from the joint histogram through linear regression. SUV = standardized uptake value.
Qualitative Agreement between PETDL and PETASC
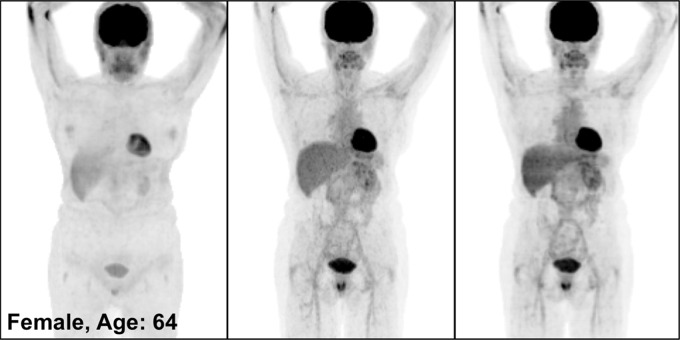
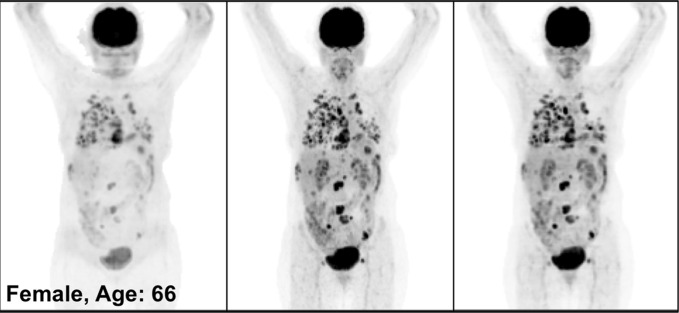
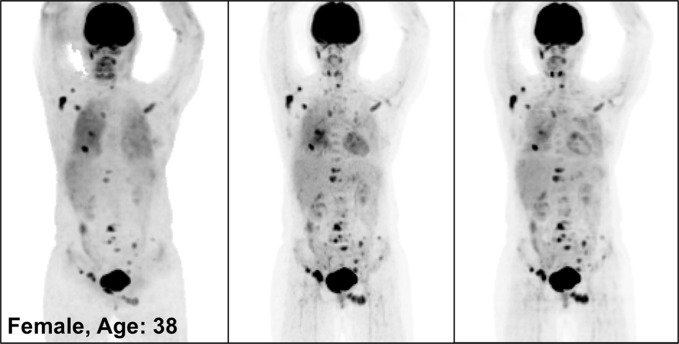
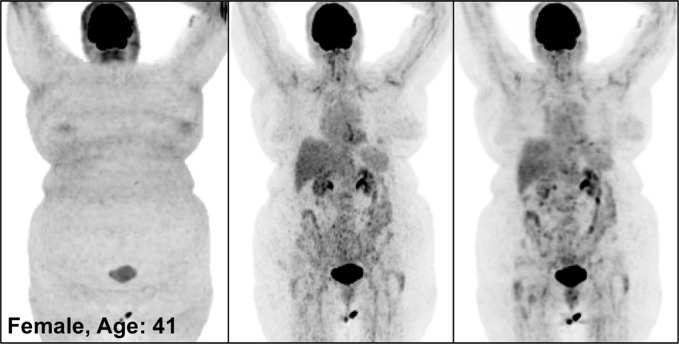
Figure 3 illustrates the overall quality of PETDL on MIP images from four representative studies: an image in a healthy individual (Fig 3a), images in patients with widespread (Fig 3b) and sparse (Fig 3c) metastases, and an image in an obese patient (Fig 3d). Specifically, the two cases of metastases showed the adaptability of the proposed deep learning model for various lesion locations and sizes throughout the body. The case of obesity showed the robustness of the model in terms of correcting images obtained in patients with a high body mass index, which might have substantial attenuation and scatter due to the longer penetration distances of photons. Some loss of resolution (ie, blurring), which specifically affected small lesions with low uptake, was observed. Rotating MIP animations of corresponding studies are presented in Figure E1 (supplement).
Figure 3a:
PETNC (left), PETASC (middle), and PETDL (right) maximum intensity projection (MIP) images in (a) a healthy patient, (b) a patient with widely metastatic cancer, (c) a patient with sparsely metastatic cancer, and (d) an obese patient demonstrate the overall quality of PETDL images. Rotating MIP animations of PETASC and PETDL are shown in Figure E1 (supplement).
Figure 3b:
PETNC (left), PETASC (middle), and PETDL (right) maximum intensity projection (MIP) images in (a) a healthy patient, (b) a patient with widely metastatic cancer, (c) a patient with sparsely metastatic cancer, and (d) an obese patient demonstrate the overall quality of PETDL images. Rotating MIP animations of PETASC and PETDL are shown in Figure E1 (supplement).
Figure 3c:
PETNC (left), PETASC (middle), and PETDL (right) maximum intensity projection (MIP) images in (a) a healthy patient, (b) a patient with widely metastatic cancer, (c) a patient with sparsely metastatic cancer, and (d) an obese patient demonstrate the overall quality of PETDL images. Rotating MIP animations of PETASC and PETDL are shown in Figure E1 (supplement).
Figure 3d:
PETNC (left), PETASC (middle), and PETDL (right) maximum intensity projection (MIP) images in (a) a healthy patient, (b) a patient with widely metastatic cancer, (c) a patient with sparsely metastatic cancer, and (d) an obese patient demonstrate the overall quality of PETDL images. Rotating MIP animations of PETASC and PETDL are shown in Figure E1 (supplement).
Qualitative Assessment of PETDL Benefits
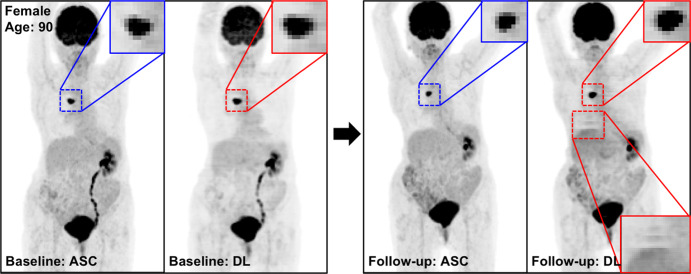
Figure 4 shows the MIP images from baseline and 2-month follow-up studies (Fig 4a, 4b), as well as images in two adolescent patients (Fig 4c, 4d), highlighting the potential applications of PETDL to provide patients with a clinical benefit. As illustrated in Figures 4a and 4b, although PETASC and PETDL images look alike visually, at closer assessment of the PETDL images, as compared with the corresponding PETASC images, the tumor was overestimated and streak artifacts were observed with PETDL (Fig 4a), and a low-uptake small lesion was blurred out with PETDL (Fig 4b). Nevertheless, these artifacts and blurred lesions did not affect the clinical interpretation and were not detected on the adolescent studies (Fig 4c, 4d). Rotating MIP animations from Figure 4 are presented in Figure E2 (supplement).
Figure 4a:
The potential benefits of PETDL are illustrated on baseline and 2-month follow-up PETASC and PETDL maximum intensity projection (MIP) scans in (a, b) patients with cancer and (c, d) adolescents who are at higher risk for radiation-induced damage. Note the overestimated tumor and streak artifacts on the DL-corrected images in a and the small blurred out low-uptake lesion on the DL-corrected images in b. Rotating MIP animations of PETASC and PETDL are shown in Figure E2 (supplement). Blue arrows indicate FDG findings with very low uptake that are not seen in PETDL.
Figure 4b:
The potential benefits of PETDL are illustrated on baseline and 2-month follow-up PETASC and PETDL maximum intensity projection (MIP) scans in (a, b) patients with cancer and (c, d) adolescents who are at higher risk for radiation-induced damage. Note the overestimated tumor and streak artifacts on the DL-corrected images in a and the small blurred out low-uptake lesion on the DL-corrected images in b. Rotating MIP animations of PETASC and PETDL are shown in Figure E2 (supplement). Blue arrows indicate FDG findings with very low uptake that are not seen in PETDL.
Figure 4c:
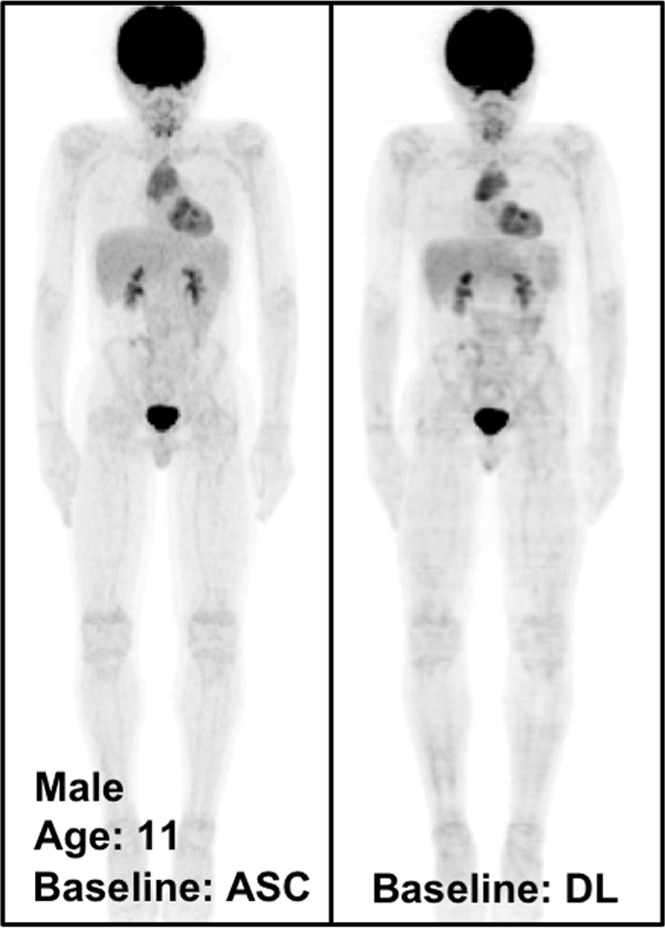
The potential benefits of PETDL are illustrated on baseline and 2-month follow-up PETASC and PETDL maximum intensity projection (MIP) scans in (a, b) patients with cancer and (c, d) adolescents who are at higher risk for radiation-induced damage. Note the overestimated tumor and streak artifacts on the DL-corrected images in a and the small blurred out low-uptake lesion on the DL-corrected images in b. Rotating MIP animations of PETASC and PETDL are shown in Figure E2 (supplement). Blue arrows indicate FDG findings with very low uptake that are not seen in PETDL.
Figure 4d:
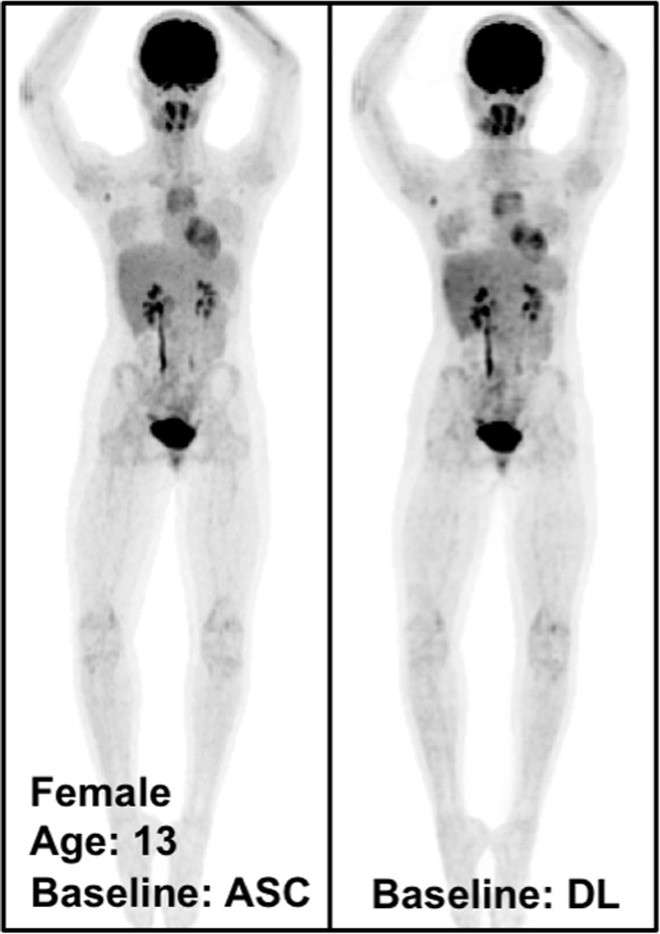
The potential benefits of PETDL are illustrated on baseline and 2-month follow-up PETASC and PETDL maximum intensity projection (MIP) scans in (a, b) patients with cancer and (c, d) adolescents who are at higher risk for radiation-induced damage. Note the overestimated tumor and streak artifacts on the DL-corrected images in a and the small blurred out low-uptake lesion on the DL-corrected images in b. Rotating MIP animations of PETASC and PETDL are shown in Figure E2 (supplement). Blue arrows indicate FDG findings with very low uptake that are not seen in PETDL.
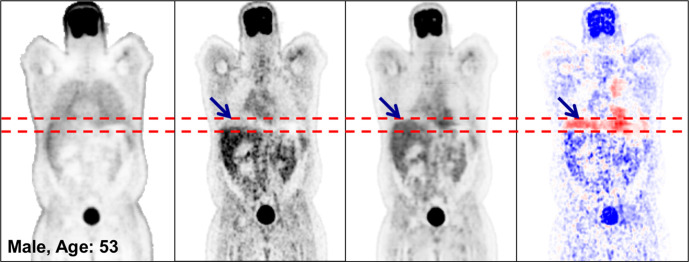
Figure 5 illustrates the robustness of the deep learning model in terms of some of the classic pitfalls of CT-based ASC. In Figure 5a, attenuation artifacts that were due to a respiratory mismatch between PET and CT, as observed on the PETASC image, are removed on the PETDL image. In Figure 5b, severe washout artifacts caused by overcorrected scatter near the bladder on the PETASC image are removed on the PETDL image. Note that the patient in Figure 5b was excluded from the training set because of significant photopenic artifact.
Figure 5a:
Coronal PETNC (far left column), PETASC (second from left column), PETDL (third from left column), and PETDL − PETASC (far right column) images illustrate the potential benefits of PETDL in (a) a patient with attenuation artifacts at the liver dome (blue arrows) and (b) a patient with washout artifacts near the bladder, who was excluded from the training set because of significant photopenic artifact. The pixel units on the difference images (far right) are standardized uptake values. Red dashed lines indicate range of the bladder. Blue and red coloration indicate under- and overestimated voxels in PETDL compared to the reference PETASC.
Figure 5b:
Coronal PETNC (far left column), PETASC (second from left column), PETDL (third from left column), and PETDL − PETASC (far right column) images illustrate the potential benefits of PETDL in (a) a patient with attenuation artifacts at the liver dome (blue arrows) and (b) a patient with washout artifacts near the bladder, who was excluded from the training set because of significant photopenic artifact. The pixel units on the difference images (far right) are standardized uptake values. Red dashed lines indicate range of the bladder. Blue and red coloration indicate under- and overestimated voxels in PETDL compared to the reference PETASC.
Qualitative Assessment of PETDL Pitfalls
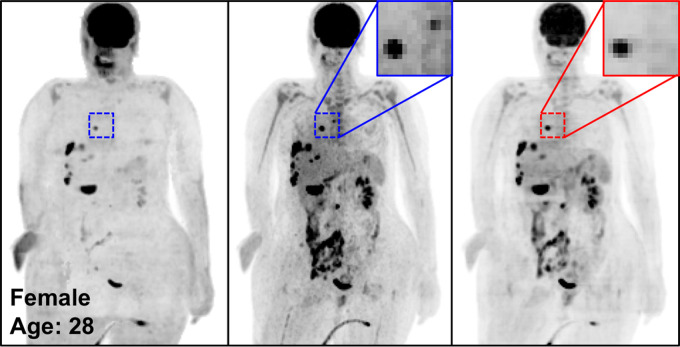
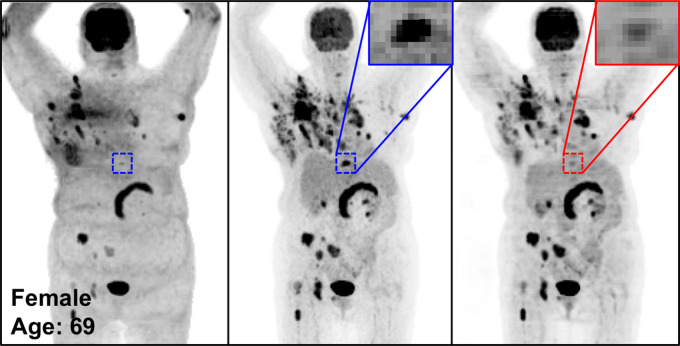
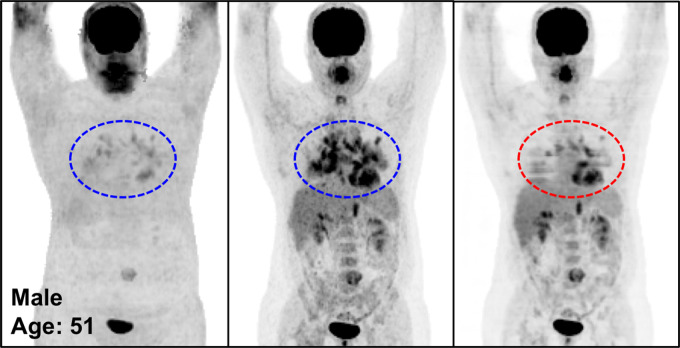
Figure 6 shows the potential pitfalls of deep learning that might cause false-negative results. In general, PETDL recovered relatively high-uptake patterns correctly, with little blurring. However, a high-uptake lesion was totally missed (Fig 6a) or substantially blurred (Fig 6b). In addition, PETDL was not able to correct pathologic patterns accurately in Figures 6c and 6d.
Figure 6a:
The potential pitfalls of PETDL are illustrated on noncorrected (left), attenuation- and scatter-corrected (middle), and deep learning–corrected (right) maximum intensity projection (MIP) PET images with (a) a missing one of two lesions in the chest (zoomed-in red box vs blue box), (b) an underestimated lesion in the spine, and (c, d) uncorrected pathologic structures in the chest (red vs blue dashed ellipse). A high-uptake lesion was missed in a and blurred in b, and the pathologic patterns were not corrected accurately on the PETDL images in b and c.
Figure 6b:
The potential pitfalls of PETDL are illustrated on noncorrected (left), attenuation- and scatter-corrected (middle), and deep learning–corrected (right) maximum intensity projection (MIP) PET images with (a) a missing one of two lesions in the chest (zoomed-in red box vs blue box), (b) an underestimated lesion in the spine, and (c, d) uncorrected pathologic structures in the chest (red vs blue dashed ellipse). A high-uptake lesion was missed in a and blurred in b, and the pathologic patterns were not corrected accurately on the PETDL images in b and c.
Figure 6c:
The potential pitfalls of PETDL are illustrated on noncorrected (left), attenuation- and scatter-corrected (middle), and deep learning–corrected (right) maximum intensity projection (MIP) PET images with (a) a missing one of two lesions in the chest (zoomed-in red box vs blue box), (b) an underestimated lesion in the spine, and (c, d) uncorrected pathologic structures in the chest (red vs blue dashed ellipse). A high-uptake lesion was missed in a and blurred in b, and the pathologic patterns were not corrected accurately on the PETDL images in b and c.
Figure 6d:
The potential pitfalls of PETDL are illustrated on noncorrected (left), attenuation- and scatter-corrected (middle), and deep learning–corrected (right) maximum intensity projection (MIP) PET images with (a) a missing one of two lesions in the chest (zoomed-in red box vs blue box), (b) an underestimated lesion in the spine, and (c, d) uncorrected pathologic structures in the chest (red vs blue dashed ellipse). A high-uptake lesion was missed in a and blurred in b, and the pathologic patterns were not corrected accurately on the PETDL images in b and c.
In areas of low FDG uptake, there is potential to generate low-uptake pseudopatterns or lose existing low-contrast patterns at PETDL (Figure E3 [supplement]), potentially causing false-positive or false-negative results. Specifically, in the current study, the generation of pseudopatterns or loss of existing patterns tended to occur in structures of the lung, heart, and bowel, the boundaries of which were not clearly distinguished from neighboring organs. Rotating MIP animations of Figure E3 are presented in Figure E4 (supplement).
Discussion
In this retrospective study, we demonstrated the feasibility of CT-less direct ASC in the image space using deep learning for whole-body FDG PET, and investigated the potential benefits and pitfalls of the proposed technique in terms of clinical translation. Our work is an extension of the prior technical innovation of using deep learning for direct ASC in the image space (18). Although previous studies (18–20) have been focused on the technical feasibility and quantitative accuracy of CT-less ASC, in our study, we additionally examined the potential clinical effect of this technique by assessing various imaging studies encountered in routine clinical practice. There is always the risk that the trained model will miss important patterns or generate pseudopatterns when it is exposed to new test data with different characteristics that are not encountered in the training data. In this sense, our work in analyzing potential benefits and pitfalls will better inform physicians who are interested in applying our deep learning–based approach to clinical practice. Technically, because scatter correction is the most time-consuming process of image reconstruction, our accelerated deep learning–based correction will save a great deal of time, specifically for dynamic PET imaging that requires many image reconstructions for a large number of frames.
It is difficult to answer questions related to the clinical acceptability of using deep learning–predicted images without qualitative assessment by well-trained and experienced nuclear medicine physicians (22). Therefore, the clinical readers in this study had an important role in qualitative assessment, which yielded clinically important findings of this study. Because it was difficult to manage many clinical cases, it was reasonable to use representative clinical cases chosen by expert physicians to examine the potential clinical impact. However, visual assessment might allow observer-dependent variations. To minimize this concern, we carefully selected various representative cases that were encountered in routine clinical practice and related to the potential advantages and pitfalls of deep learning, providing both MIP images and rotating MIP animations for prospective readers to check.
The diagnostic value of the CT component of PET/CT is undeniable in some instances. CT can help to improve anatomic localization of a region of FDG uptake. It can also help resolve potential cases of FDG PET pitfalls (eg, brown fat) and help avoid false-positive diagnostic interpretations (3,4). Nevertheless, the CT-less correction technique may benefit patients in different clinical situations. First, the radiation dose reduction achieved by using CT-less correction can be particularly beneficial to patients with cancer who need to undergo longitudinal follow-up scanning and/or dosimetric studies, which require multiple PET/CT scans over short time intervals (5,6).
In our literature review, the average effective radiation dose from whole-body CT performed in the context of whole-body PET/CT was found to be 7.22 mSv, which was higher than the radiation dose from whole-body PET alone (6.23 mSv) (23). In another study (24), radiation doses from CT studies performed for both ASC and diagnostic purposes were surveyed, and the average radiation doses were found to be 1.4 mGy and 9.9 mGy for CT-based ASC and diagnostic CT, respectively. In this case, if our CT-less deep learning approach replaced CT-based ASC repeatedly, the accumulated dose reduction would be comparable to the average dose of radiation from diagnostic CT (9.9 mGy) and thus beneficial for patients who need multiple follow-up scans. A specific dose calculation was beyond the scope of this study because the radiation dose from CT varies substantially. However, performing whole-body CT for ASC prior to each PET session increases the cumulative radiation dose several-fold in relation to the total number of repetitions, specifically for dosimetric studies that may require repeated PET/CT scans over short time intervals. In addition, the long-term accumulation of radiation might lead to a substantial increase in the lifetime cancer risk, especially in pediatric patients, who are at higher risk for radiation-induced damage (7,8). Dose reduction is particularly relevant for this specific patient population, especially if we consider their long-term health. For this reason, radiation dose reductions at PET/CT are more substantial in the targeted patient population (ie, pediatric patients with cancer), as these patients are frequently imaged during the course of ongoing treatment. Therefore, although the individual dose reduction per scan is modest, the cumulative reduction could be quite substantial for many patients.
Furthermore, this dose reduction could be beneficial in total-body PET/CT examinations because the ultra–low-dose PET feature (25) could be retained by removing the extra radiation dose from the CT examination required for PETASC. Low-dose CT techniques may render our deep learning technique redundant for a while; however, considering that it is not yet clear whether there is a threshold dose below which there is no risk (26), any reduction in radiation dose, even if it is small, could be valuable. In addition, deep learning–based correction can be used to robustly manage the attenuation and scatter that are frequent sources of artifacts and technical limitations in CT-based corrections (10,11). Altogether, this technique may have a useful role in situations in which there is companion diagnostic imaging (eg, CT or MRI) or when diagnostic imaging is not necessary (ie, dosimetric studies). Finally, our deep learning approach could be useful at PET/MRI, as our deep learning approach will be free of MRI-derived attenuation artifacts (27) and could save time for performing other MRI sequences during short PET protocols (90–150 seconds) by eliminating the need to perform MRI to generate pseudo-CT images (20–40 seconds). Last, another important point is that PETNC is still useful for distinguishing artifacts embedded on PETACS images (10).
As with any technique, there are potential pitfalls and limitations to overcome in terms of clinical translation. First, blurring was recognized throughout the body in every case in our study. This is the technical limitation of a deep convolutional neural network for low-resolution images such as whole-body PET scans. It is known that minimizing the euclidean distance (or L2 loss) between predicted and ground truth pixels throughout the training tends to cause blurry results (28). Small lesions (eg, lung nodules) potentially can be blurred out because of this limitation, which potentially can result in false-negative results. However, the blurring issue may be overcome by using generative adversarial networks (28) and a superresolution deep learning technique (29). Building and optimizing a new neural network is a substantial task, and we plan to include further developments with generative adversarial networks and potentially include other promising neural networks. Without applying such advanced deep learning techniques, simply using PET images reconstructed with a smaller pixel size can prevent the blurring, according to results of the previous brain study (involving a pixel size of 1 × 1 mm) (18), in which the blurring was not recognized. Although the whole-body PET images used in this study had a large pixel size of 4 × 4 mm owing to the low sensitivity of the conventional PET scanner, it would be feasible to reconstruct PET images with a smaller voxel size by using a highly sensitive total-body PET system.
Second, there is always a risk of missing low-uptake lesions or underestimating uptake in the correction of uptake patterns that were not encountered in the training data, which might result in false-negative results. Although only 110 studies were used for training and testing, the deep learning–based ASC showed potential to correct most of the pathophysiologic patterns that were barely shown in the training set. Nevertheless, the risk was recognized in this study and in a more recent study (20) involving 1150 cases (900 for training, 100 for validation,150 for testing). Although a more generalized model could be derived from large training sets, a new knowledge base might not be gained by simply increasing the sample size, unless a normative large database is carefully constructed with annotations (eg, anatomy, pathologic condition, body mass index, sex, age, etc) that account for intra- and interpatient variations and more diverse pathophysiologic patterns, including many outlier studies.
Another potential risk is the generation of low-uptake pseudopatterns, which could potentially result in false-positive results. These pseudopatterns were recognized on several images, specifically around the lung, heart, and bowel, which had low uptake levels and thus boundaries that were not clearly distinguishable from those of neighboring organs. However, the pseudopatterns did not change any clinical interpretation, at least not in our data set, because the uptake levels were not clinically significant. Applying generative adversarial networks to the proposed deep learning model may reduce the likelihood of generating illusions that are not present at the ground truth (28).
Last, although we illustrated potential pitfalls that might cause false-positive and false-negative results, the error rates were not quantified in a human-observer study. However, radiologist scoring to quantify error rates would be extremely time-consuming and impractical and unlikely to change our core message about risk stratification to overcome potential false-positive and false-negative results toward clinical translation.
On the basis of the limitations described, there is still room for further optimization and refinement of our deep learning technique. For future work, an advanced network design (eg, generative adversarial networks) and organ-specific training will be applied to improve the precision of the quantitative SUV, specifically for treatment follow-ups. The reference studies (21,22) demonstrated that the performance of a universal whole-body model was inconsistent according to region (eg, high-uptake brain vs low-uptake lung). Thus, the use of organ-specific training may overcome the limitation of our universal whole-body model, with organ-specific models adapted to large variations of uptake patterns among diverse organs. In addition, it will be important and necessary to develop a validation program, as there is no robust and efficient method for validating deep learning technologies, such as automatic organ- or lesion-segmentation tools and automatic quality-assessment frameworks, as good surrogates for the human visual system (21). Finally, it will also be important to train physicians to differentiate the potential pitfalls of deep learning, just as they are trained to distinguish classic pitfalls of FDG PET by using CT and other modalities (3,4). “Reading through” the classic PET/CT artifacts is an important skill set for radiologists and nuclear medicine physicians, but the deep learning method, with its set of pitfalls, may pose a challenge to the clinical community, and more subtle clinically significant changes may end up going undetected (22). In this sense, companion diagnostic anatomic imaging would have an important role in helping physicians avoid the potential pitfalls of deep learning, if this approach were to be used in clinical practice.
In this study, we demonstrated the feasibility of performing CT-less direct ASC in the image space by using deep learning and investigated the potential benefits and pitfalls of this correction approach. Although the results are promising, further studies with larger, more diverse, and outlier clinical cases are needed to establish the safety and consistency required for reliable interpretation in clinical translation.
SUPPLEMENTAL TABLE
SUPPLEMENTAL FIGURES
Supported in part by the National Institutes of Health (grants R01HL135490 and R01EB026331).
Disclosures of Conflicts of Interest: J.Y. Activities related to the present article: study supported in part by National Institutes of Health grants R01HL135490 and R01EB026331. Activities not related to the present article: disclosed no relevant relationships. Other relationships: disclosed no relevant relationships. J.H.S. Activities related to the present article: received Biomedical Imaging for Clinician Scientists T32 grant (NIBIB 2T32EB001631) from National Institute of Biomedical Imaging and Bioengineering. Activities not related to the present article: disclosed no relevant relationships. Other relationships: disclosed no relevant relationships. S.C.B. Activities related to the present article: disclosed no relevant relationships. Activities not related to the present article: paid member of AAA advisory board for trial design, small business innovation research grant from CTT. Other relationships: disclosed no relevant relationships. G.T.G. Activities related to the present article: institution received National Institutes of Health grant (1R01HL135490-01: Dynamic Cardiac SPECT; principal investigators, Y.S. and G.T.G.). Activities not related to the present article: paid consultant for Spectrum Dynamics (for consulting on development of reconstruction algorithms for processing the acquisition of SPECT dynamic cardiac data), employed by TF Instruments for work on development of x-ray bi-prism interferometry system, principal investigator for SolvingDynamics for work funded by NSF proposal (1842671: SBIR Phase I: Improving Accuracy and Reducing Scan Time of Dynamic Brain PET”). Other relationships: disclosed no relevant relationships. Y.S. Activities related to the present article: institution received National Institutes of Health grants (R01HL135490 and R01EB026331). Activities not related to the present article: disclosed no relevant relationships. Other relationships: disclosed no relevant relationships.
Abbreviations:
- ASC
- attenuation and scatter correction
- FDG
- fluorodeoxyglucose
- MIP
- maximum intensity projection
- NC
- noncorrected
- PETASC
- attenuation- and scatter-corrected PET
- PETDL
- deep learning–corrected PET
- PETNC
- noncorrected PET
- SUV
- standardized uptake value
References
- 1.Beyer T, Townsend DW, Brun T, et al. A combined PET/CT scanner for clinical oncology. J Nucl Med 2000;41(8):1369–1379. [PubMed] [Google Scholar]
- 2.Meikle SR, Badawi RD. Quantitative techniques in PET. In: Positron emission tomography. London, England: Springer-Verlag, 2005; 93–124. [Google Scholar]
- 3.Lakhani A, Khan SR, Bharwani N, et al. FDG-PET/CT pitfalls in gynecologic and genitourinary oncologic imaging. RadioGraphics 2017;37(2):577–594. [DOI] [PubMed] [Google Scholar]
- 4.Truong MT, Viswanathan C, Carter BW, Mawlawi O, Marom EM. PET/CT in the thorax: pitfalls. Radiol Clin North Am 2014;52(1):17–25. [DOI] [PubMed] [Google Scholar]
- 5.Watanabe S, Shiga T, Hirata K, et al. Biodistribution and radiation dosimetry of the novel hypoxia PET probe [18F]DiFA and comparison with [18F]FMISO. EJNMMI Res 2019;9(1):60. [DOI] [PMC free article] [PubMed] [Google Scholar]
- 6.Hohberg M, Kobe C, Krapf P, et al. Biodistribution and radiation dosimetry of [18F]-JK-PSMA-7 as a novel prostate-specific membrane antigen-specific ligand for PET/CT imaging of prostate cancer. EJNMMI Res 2019;9(1):66. [DOI] [PMC free article] [PubMed] [Google Scholar]
- 7.Hong JY, Han K, Jung JH, Kim JS. Association of exposure to diagnostic low-dose ionizing radiation with risk of cancer among youths in South Korea. JAMA Netw Open 2019;2(9):e1910584. [Google Scholar]
- 8.Mathews JD, Forsythe AV, Brady Z, et al. Cancer risk in 680,000 people exposed to computed tomography scans in childhood or adolescence: data linkage study of 11 million Australians. BMJ 2013;346:f2360. [DOI] [PMC free article] [PubMed] [Google Scholar]
- 9.Task Group on Control of Radiation Dose in Computed Tomography. Managing patient dose in computed tomography: a report of the International Commission on Radiological Protection. Ann ICRP 2000;30(4):7–45. [DOI] [PubMed] [Google Scholar]
- 10.Sureshbabu W, Mawlawi O. PET/CT imaging artifacts. J Nucl Med Technol 2005;33(3):156–161; quiz 163–164. [PubMed] [Google Scholar]
- 11.Lawhn-Heath C, Flavell RR, Korenchan DE, et al. Scatter artifact with Ga-68-PSMA-11 PET: severity reduced with furosemide diuresis and improved scatter correction. Mol Imaging 2018;17:1536012118811741. [DOI] [PMC free article] [PubMed] [Google Scholar]
- 12.Leynes AP, Yang J, Wiesinger F, et al. Zero-echo-time and Dixon deep pseudo-CT (ZeDD CT): direct generation of pseudo-CT images for pelvic PET/MRI attenuation correction using deep convolutional neural networks with multiparametric MRI. J Nucl Med 2018;59(5):852–858. [DOI] [PMC free article] [PubMed] [Google Scholar]
- 13.Liu F, Jang H, Kijowski R, Bradshaw T, McMillan AB. Deep learning MR imaging–based attenuation correction for PET/MR imaging. Radiology 2018;286(2):676–684. [DOI] [PMC free article] [PubMed] [Google Scholar]
- 14.Gong K, Yang J, Kim K, El Fakhri G, Seo Y, Li Q. Attenuation correction for brain PET imaging using deep neural network based on Dixon and ZTE MR images. Phys Med Biol 2018;63(12):125011. [DOI] [PMC free article] [PubMed] [Google Scholar]
- 15.Armanious K, Küstner T, Reimold M, et al. Independent brain 18F-FDG PET attenuation correction using a deep learning approach with generative adversarial networks. Hell J Nucl Med 2019;22(3):179–186. [DOI] [PubMed] [Google Scholar]
- 16.Dong X, Wang T, Lei Y, et al. Synthetic CT generation from non-attenuation corrected PET images for whole-body PET imaging. Phys Med Biol 2019;64(21):215016. [DOI] [PMC free article] [PubMed] [Google Scholar]
- 17.Liu F, Jang H, Kijowski R, Zhao G, Bradshaw T, McMillan AB. A deep learning approach for 18F-FDG PET attenuation correction. EJNMMI Phys 2018;5(1):24. [DOI] [PMC free article] [PubMed] [Google Scholar]
- 18.Yang J, Park D, Gullberg GT, Seo Y. Joint correction of attenuation and scatter in image space using deep convolutional neural networks for dedicated brain 18F-FDG PET. Phys Med Biol 2019;64(7):075019. [DOI] [PMC free article] [PubMed] [Google Scholar]
- 19.Dong X, Lei Y, Wang T, et al. Deep learning-based attenuation correction in the absence of structural information for whole-body positron emission tomography imaging. Phys Med Biol 2020;65(5):055011. [DOI] [PMC free article] [PubMed] [Google Scholar]
- 20.Shiri I, Arabi H, Geramifar P, et al. Deep-JASC: joint attenuation and scatter correction in whole-body 18F-FDG PET using a deep residual network. Eur J Nucl Med Mol Imaging 2020;47(11):2533–2548. [DOI] [PubMed] [Google Scholar]
- 21.Renieblas GP, Nogués AT, González AM, Gómez-Leon N, Del Castillo EG. Structural similarity index family for image quality assessment in radiological images. J Med Imaging (Bellingham) 2017;4(3):035501. [DOI] [PMC free article] [PubMed] [Google Scholar]
- 22.Zaharchuk G. Next generation research applications for hybrid PET/MR and PET/CT imaging using deep learning. Eur J Nucl Med Mol Imaging 2019;46(13):2700–2707. [DOI] [PMC free article] [PubMed] [Google Scholar]
- 23.Huang B, Law MW, Khong PL. Whole-body PET/CT scanning: estimation of radiation dose and cancer risk. Radiology 2009;251(1):166–174. [DOI] [PubMed] [Google Scholar]
- 24.Bebbington NA, Haddock BT, Bertilsson H, et al. A Nordic survey of CT doses in hybrid PET/CT and SPECT/CT examinations. EJNMMI Phys 2019;6(1):24. [DOI] [PMC free article] [PubMed] [Google Scholar]
- 25.Zhang X, Zhou J, Cherry SR, Badawi RD, Qi J. Quantitative image reconstruction for total-body PET imaging using the 2-meter long EXPLORER scanner. Phys Med Biol 2017;62(6):2465–2485. [DOI] [PMC free article] [PubMed] [Google Scholar]
- 26.Darby SC, Cutter DJ, Boerma M, et al. Radiation-related heart disease: current knowledge and future prospects. Int J Radiat Oncol Biol Phys 2010;76(3):656–665. [DOI] [PMC free article] [PubMed] [Google Scholar]
- 27.Attenberger U, Catana C, Chandarana H, et al. Whole-body FDG PET-MR oncologic imaging: pitfalls in clinical interpretation related to inaccurate MR-based attenuation correction. Abdom Imaging 2015;40(6):1374–1386. [DOI] [PubMed] [Google Scholar]
- 28.Isola P, Zhu JY, Zhou TH, Efros AA. Image-to-image translation with conditional adversarial networks. In: Proceedings of the 2017 IEEE conference on computer vision and pattern recognition. Piscataway, NJ: Institute of Electrical and Electronics Engineers, 2017; 5967–5976. [Google Scholar]
- 29.Song TA, Yang F, Chowdhury SR, et al. PET image deblurring and super-resolution with an MR-based joint entropy prior. IEEE Trans Comput Imaging 2019;5(4):530–539. [DOI] [PMC free article] [PubMed] [Google Scholar]
Associated Data
This section collects any data citations, data availability statements, or supplementary materials included in this article.


