Abstract
Purpose
To explore whether generative adversarial networks (GANs) can enable synthesis of realistic medical images that are indiscernible from real images, even by domain experts.
Materials and Methods
In this retrospective study, progressive growing GANs were used to synthesize mammograms at a resolution of 1280 × 1024 pixels by using images from 90 000 patients (average age, 56 years ± 9) collected between 2009 and 2019. To evaluate the results, a method to assess distributional alignment for ultra–high-dimensional pixel distributions was used, which was based on moment plots. This method was able to reveal potential sources of misalignment. A total of 117 volunteer participants (55 radiologists and 62 nonradiologists) took part in a study to assess the realism of synthetic images from GANs.
Results
A quantitative evaluation of distributional alignment shows 60%–78% mutual-information score between the real and synthetic image distributions, and 80%–91% overlap in their support, which are strong indications against mode collapse. It also reveals shape misalignment as the main difference between the two distributions. Obvious artifacts were found by an untrained observer in 13.6% and 6.4% of the synthetic mediolateral oblique and craniocaudal images, respectively. A reader study demonstrated that real and synthetic images are perceptually inseparable by the majority of participants, even by trained breast radiologists. Only one out of the 117 participants was able to reliably distinguish real from synthetic images, and this study discusses the cues they used to do so.
Conclusion
On the basis of these findings, it appears possible to generate realistic synthetic full-field digital mammograms by using a progressive GAN architecture up to a resolution of 1280 × 1024 pixels.
Supplemental material is available for this article.
© RSNA, 2020
Summary
Progressive generative adversarial network architecture can be used to create high-resolution synthetic mammograms that are not easily distinguishable from real images.
Key Points
■ Progressive generative adversarial network architecture can be used to create high-resolution synthetic mammograms.
■ It is almost impossible for domain experts to distinguish these synthetic images from real images.
■ Synthetic images can suffer from subtle image artifacts that may not be noticed by domain experts.
Introduction
The framework for training generative models in an adversarial manner was introduced in the work of Goodfellow et al (1) in 2014 (Fig 1). It is based on a simple but powerful idea: a generator neural network aims to produce realistic examples able to deceive a discriminator network, which aims to discern between real and synthetic ones (a “critic”) (Fig 1). The process is unstable and susceptible to collapse, especially for higher pixel resolutions.
Figure 1:

Schematic representation of a generative adversarial network.
Assessment of the quality of the synthetic images is also notoriously difficult. Several evaluation metrics have been proposed in the literature, such as the inception score, the Fréchet inception distance, and the sliced Wasserstein distance (2) (Appendix E1[supplement]). However, they are mainly useful when comparing different synthesis methods and cannot provide an objective measure of image realism.
The generation of synthetic medical images is of increasing interest to both the medical and machine learning communities for several reasons. First, synthetic images can potentially be used to improve methods for downstream tasks by means of data augmentation (3,4). Second, image-to-image translation can be used for domain adaptation (5), image enhancement (6), and superresolution (7).
The main purpose of our work is to investigate whether recent advances in generative adversarial networks (GANs) can enable synthesis of realistic medical images indiscernible from real ones, even by domain experts.
The generation of realistic images is important to establish whether such methods can be useful in fields like full-field digital mammography, in which images need to be processed at relatively high resolutions because of fine structural details of high diagnostic importance, such as lesion spiculation and microcalcifications.
To assess the quality of the generated images, we propose a systematic assessment of distributional alignment for ultra–high-dimensional pixel distributions and show that our method can reveal areas of alignment and potential misalignment. Finally, we present a reader study assessing the perceived realism of synthetic medical images from a human-expert perspective.
It is beyond the scope of this work to address whether and how synthetically generated images can be used for clinically significant purposes. In fact, this is a difficult question that has yet to be convincingly addressed in the literature for either natural or medical images.
Materials and Methods
Data and Clinical Setting
In our retrospective study (undertaken 2009–2017), we used our large proprietary full-field digital mammogram dataset (>1 000 000 images; 90 000 patients; mean age, 56 years ± 9 [standard deviation]). The data were fully anonymized according to data-protection law, and further ethics approval was not required for this experimental work. To ensure synthesis of physiologic breast tissue, we deliberately excluded images from this set that contained postoperative artifacts (eg, metal clips) and large foreign bodies (eg, pacemakers and implants). Otherwise, the images contain a wide variation in terms of anatomic differences (size and density) and histopathologic findings (including benign and malignant cases), and the dataset corresponds to what is typically found in screening clinics.
We applied the default windowing level for the hardware, which was followed by aspect ratio–preserving image resizing to normalize the dataset resolution to 1280 × 1024 pixels, our target resolution for synthesis. Ideally, images should be processed at their full resolution by deep learning algorithms. However, because of the current hardware limitations, this would have resulted in a small batch size during training, which can substantially degrade performance. We have observed that resolutions up to 1280 × 1024 pixels are sufficient for most applications.
Progressive Training of GANs
In our study, we used progressive training for scaling GANs to higher resolutions. According to this concept, training starts at a low resolution, at which the dimensionality of the problem is low, before gradually increasing it as more layers are phased in, which increases the capacity of the network (Fig 2). For a background primer on GANs and details regarding how training was conducted, refer to Appendix E2 (supplement).
Figure 2:
Illustration of the progressive training process. Data are pixels.
Assessing Distributional Alignment
It is difficult to estimate the alignment of ultra–high-dimensional pixel distribution. All available metrics outlined in Appendix E1 (supplement) are mainly focused on comparing synthesis methods rather than on measuring the alignment in absolute terms.
For that reason, we propose the use of the first five statistical moments to directly assess the similarity between low-level pixel distributions of real and synthetic images. We show that the pixel moments can be used to effectively reduce the dimensionality of the problem for both visualizing these high-dimensional distributions and quantitatively assessing their alignment by means of mutual information.
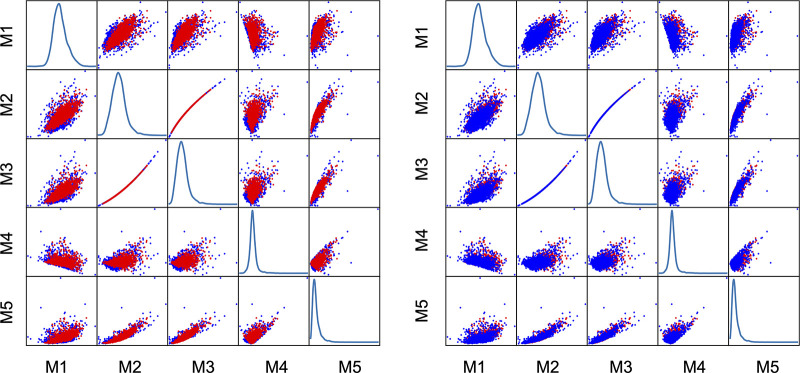
Scatterplots of the first five centered statistical moments, namely the mean, variance, skewness, kurtosis, and hyperskewness, are shown in Figure 3.
Figure 3:
Moment plots assessing the pixel distribution alignment between real and synthetic images. Red dots are moments of real images and blue dots are synthetic image moments. Subjectively, there appears to be a considerable degree of moment overlap. M1 = mean, M2 = variance, M3 = skewness, M4 = kurtosis, M5 = hyperskewness.
For the five aforementioned moments, we examine both the mutual information between all possible combinations of moment pairs and the mutual information between moments and the real and/or synthetic label, indicating how discriminative each moment is for distinguishing between real and synthetic images. Lower values indicate the difficulty of separating the images on the basis of each moment and therefore indicate better overlap.
We provide more details about mutual information in Appendix E3 (supplement).
Reader Study
We conducted a randomized user study to determine whether synthetic images could be distinguished from real ones as a proxy for their perceptual realism. A total of 1000 synthetic and 1000 real randomly sampled mediolateral oblique (MLO) images were used. We subsequently excluded synthetic images with visible artifacts and real images of low acquisition quality.
The decision to use only MLO images was aimed at reducing the number of factors influencing the outcome and was based on our observation that the MLO view is more challenging for the network to generate. We observed roughly twice as many MLO images with visible artifacts as craniocaudal images.
Randomly selected real and synthetic image pairs were displayed in random order within a custom tablet application with image pinch and zoom capability (Fig 4, Appendix E4 [supplement]). The application was offered to attendees during the 104th Scientific Assembly and Annual Meeting of the Radiological Society of North America in Chicago in 2018. Volunteers were each asked to select the real image in 10 randomly ordered pairs of real and synthetic images with no time limit.
Figure 4:
Screenshots of the survey (left) and tutorial (middle) pages of the user study iPad application. Screenshot of image presentation layout (right). Two full-field digital mammographic images, one real and one synthetic, are displayed simultaneously. Users are able to pinch and zoom, are able to scroll the images, and have unlimited time to compare and assess them. The right-hand image has been zoomed in for demonstration purposes. One image from each of 10 randomly assigned pairs must eventually be selected by the user as being “real.”
Participant demographics.—A total of 117 readers volunteered to take part in our study. Of the 117, 47% (55 of 117) were radiologists and 53% (62 of 117) were nonradiologists. Of the 55 radiologists, 82% (45 of 55) were board certified and 18% (10 of 55) were trainees; 60% of the radiologists (33 of 55) were breast specialists and 40% (22 of 55) were not. Of the breast specialists, 94% (31 of 33) worked in breast screening, whereas 6% (two of 33) did not. Most participants completed the process once; however, there were 16 repeated efforts, which we also include in the statistical analysis.
Statistical analyses.—We aimed to investigate the extent to which participant responses were close to random. For the remainder of this work, we define the probability of a participant correctly identifying the real image in a given pair as the success probability.
Under the hypothesis of random responses, the number of successes xi for subject i in 10 repeated Bernoulli trials would follow a binomial distribution with some success probability \pi (xi ~ Bin [10,π]). The assumptions made under the binomial hypothesis are that the outcome of one trial does not affect the results of another and that conditions are the same for each trial.
We can assume that responses are independent, as each participant was presented with a random set of 10 pairs of real and synthetic images drawn with replacement from 1000 candidates per set.
However, the conditions of each trial may have varied because of two possible effects: some participants may have been more observant than others and thus more successful in distinguishing between real and synthetic images, and it is possible that our participants became more effective as they were presented with more images.
We used the χ2 goodness-of-fit test with the null hypothesis that our observations were drawn from a binomial distribution with a success probability of π = 0.5 (coin toss).
We used the Kruskal-Wallis test followed by Conover post hoc analysis to test the hypothesis that participants would improve during the experiment and for all stratification analyses.
Results
Image Resolution and Qualitative Assessment
We successfully generated images that were 1280 × 1024 pixels, which, to our knowledge, is the highest spatial resolution reported to date both for natural and medical images (Fig 5).
Figure 5:
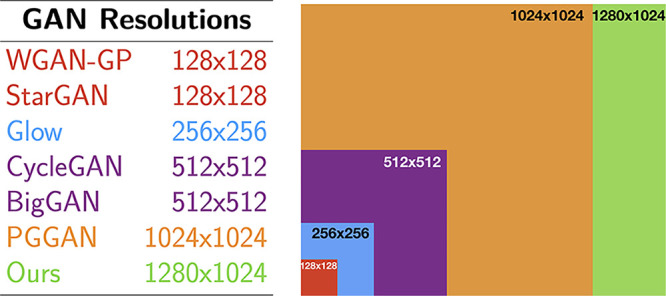
Pixel resolution of various generative adversarial network (GAN) architectures reported in the literature: Wasserstein GAN with gradient penalty (WGAN-GP) (8), StarGAN (9), Glow (10), cycle-consistent GAN (CycleGAN) (11), BigGAN (12), and progressive growing GAN (PGGAN) (2).
We observed that the craniocaudal view was subjectively easier for the network to successfully synthesize and exhibited fewer artifacts than the MLO view. Casual inspection of 1000 random synthetic images from each view, by an untrained observer (D.K.), revealed 64 (6.4%) craniocaudal images and 136 (13.6%) MLO images with obvious artifacts. Examples of some of the most common artifacts we observed are shown in Figure E2 (supplement).
Distributional Alignment
Scatterplots for all five moment pairs are presented in Figure 3, visually showing good overlap between real and synthetic images. In addition, we quantified the distributional overlap by means of mutual information in the following scenarios.
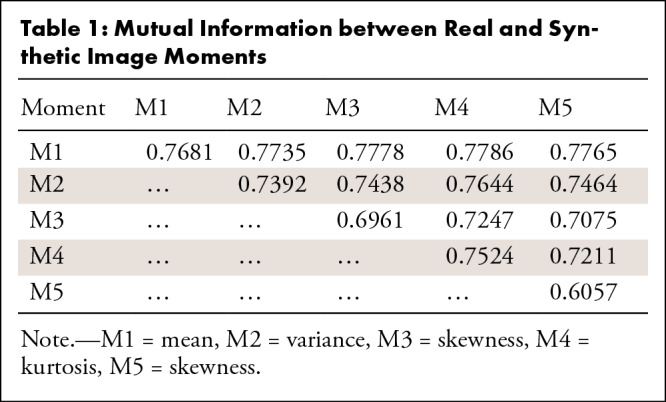
Mutual information between moment pairs.—The mutual information for all moment pairs is presented in Table 1 and ranges from 60% to 78%. Higher values indicate better overlap between the two groups, namely real and synthetic images.
Table 1:
Mutual Information between Real and Synthetic Image Moments
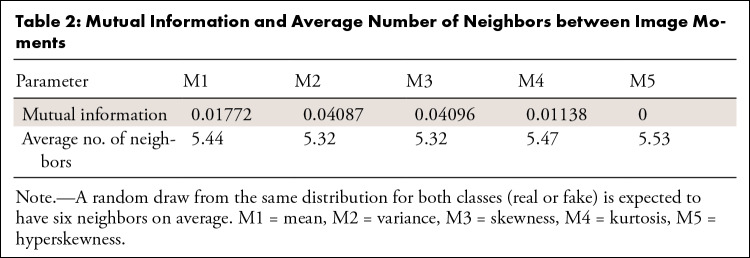
Mutual information between moments and the real and/or synthetic label.—The mutual information between moments and the real and/or synthetic label is presented in Table 2. It should be noted that the maximum possible value in this case is 0.69. Low values indicate difficulty in separating the images based on each moment and therefore indicate high overlap. We can observe that the value is low for most moments.
Table 2:
Mutual Information and Average Number of Neighbors between Image Moments
In Table 2, we also present the average number of neighbors mi within a radius equal to di, the distance to the third nearest neighbor within the same class (Appendix E4 [supplement]). We observed that the average number of neighbors ranged between 5.2 and 5.5, which is very close to the theoretical “worst case” of six neighbors, corresponding to perfect overlap.
Sources of misalignment.—Prompted by the lower-than-expected mutual information between moment pairs, we took a closer look into the sources of misalignment.
Two main factors govern the mutual-information score, namely the support and the shape of the real (target) and synthetic (source) distributions. Good alignment in the support of the two distributions guarantees sample diversity and is arguably more important than shape alignment.
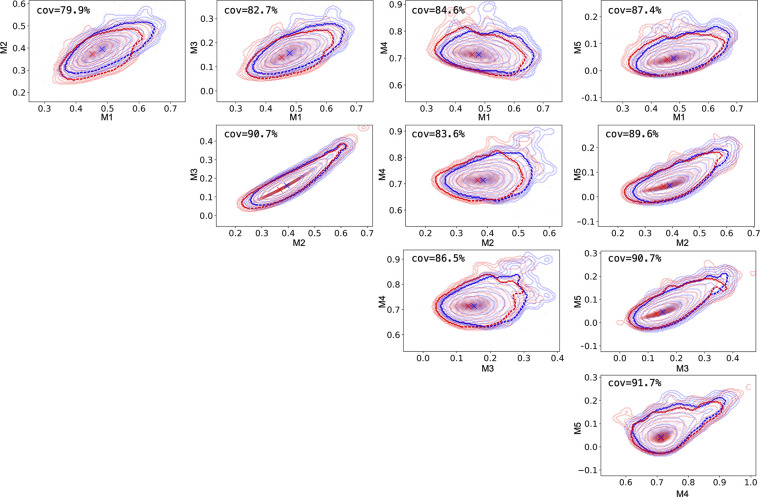
In Figure 6, we visualize each two-dimensional distribution of moment pairs by using kernel-density estimation plots and 10 contours equally spaced between the 95th and 99.99th percentile. For the 97th percentile, we also presented the percentage of the real distribution contour covered by the synthetic distribution. The coverage ranged from roughly 80% to roughly 90%, showing good alignment of the support of both distributions and a strong indication against model collapse. However, we also observed mode misalignment, which led to worse-than-anticipated mutual-information scores (Table 2).
Figure 6:
Distributional alignment of moments. We use kernel-density estimation plots to approximate the distributions of real and synthetic images, drawn in red and blue, respectively. We show the contours of the kernel-density estimation plots drawn at 10 regular intervals between the 95th and 99.99th percentile. More prominent dashed lines denote the contours at the 97th percentile and with x, we draw the models of the kernel-density estimation plots. Finally, we show the percentage of the real contour covered by the synthetic image contour at the 97th percentile. cov = covariance.
Reader Study
As previously mentioned, we used the χ2 goodness-of-fit test with the null hypothesis that our observations are drawn from a binomial distribution with a success probability π value of 0.5, corresponding to random responses. The P value of the test is .999, which indicates failure to reject the null hypothesis at any significance level and a strong indication in its favor. The histogram of all responses is presented in Figure 7.
Figure 7:
Histogram distribution of all responses (left), kernel-density estimation plot of stratified results among radiologists and nonradiologists (middle), and kernel-density estimation plot of stratified results between breast radiologists and all other radiologists (right).
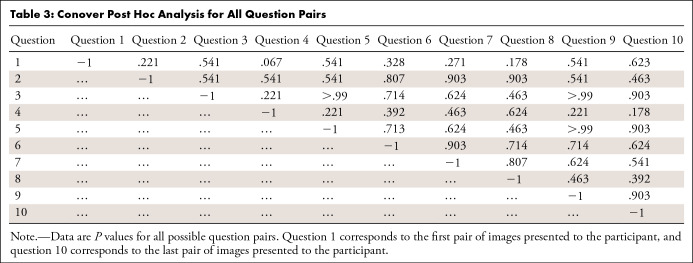
To test whether there was any statistically significant merit to the hypothesis that the success probability increased as the experiment progressed, we grouped the results per response for all participants and employed a Kruskal-Wallis test followed by Conover post hoc analysis. The P value of the Kruskal-Wallis test was .84, indicating failure to reject the null hypothesis that there is no statistically significant difference between the groups. Conover post hoc analysis was also negative for any significance level lower than 5% for all groups (Table 3).
Table 3:
Conover Post Hoc Analysis for All Question Pairs
Stratification analysis.—We used the Kruskal-Wallis test to estimate whether there is any statistically significant difference between the following participant of different demographics. Kernel-density estimation plots for the main stratifications can be seen in Figure 7.
By considering all attempts, we reported the following P values, with the numbers in parentheses indicating the number of attempts in each cohort: radiologists (n = 64) versus nonradiologists (n = 69) (P = .4928); board-certified radiologists (n = 55) versus trainees (n = 11) (P = .9783); breast specialists (n = 37) versus non–breast specialists (n = 27) (P = .0773); and working in screening (n = 35) versus not (n = 29) (P = .1470).
By considering only the first attempt per participant, we reported the following P values: radiologists (n = 55) versus nonradiologists (n = 62) (P =.502); board-certified radiologists (n = 45) versus trainees (n = 10) (P = .4091); breast specialists (n = 33) versus non–breast specialists (n = 22) (P = .2840); and working in screening (n = 31) versus not (n = 24) (P = .4986).
All P values are above the 5% significance level; however, some cohorts contained too few samples for this test to be conclusive.
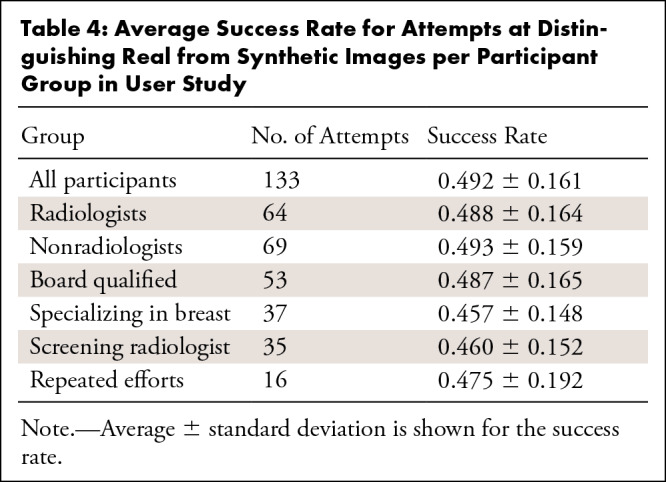
Finally, Table 4 shows the success probability for all groups.
Table 4:
Average Success Rate for Attempts at Distinguishing Real from Synthetic Images per Participant Group in User Study
Discussion
In this work, we demonstrated that generation of realistic whole-image, full-field digital mammograms is possible by using progressive GAN architecture; we achieved the highest resolution reported to date, to our knowledge; and we achieved the level of realism required to ensure that synthetic images are perceptually inseparable from real images, even by domain experts.
Because of the specialist nature of medical imaging, it is reasonable to assume that domain experts would have performed better than nontrained observers in the reader study. However, our results show that both expert and nonexpert readers converged to the same effectively random success probability. Breast radiologists as a subgroup performed similarly. The overall distribution for each group approximated to random, with no statistical difference between the groups in their performance. Furthermore, the results indicate that participants did not improve over the course of assessing the 10 cases, likely because of the fact that they received no feedback during the assessment.
Vascular Artifacts
Even in the case of very realistic synthetic images, close inspection can reveal subtle artifactual patterns. The path and structure of some background blood vessels within the synthesized breast parenchyma do not always perfectly conform to normal anatomic logic. In some cases, vessels seem to arise with no origin, others taper proximally rather than distally, and others converge rather than diverge as they approach the skin (Fig E3 [supplement]).
It is of note that the vast majority of radiologists in the study did not pick up on this, suggesting that vascular patterns and morphologic characteristics are not image features that are routinely assessed on full-field digital mammograms, opposed to retinal imaging, for instance. Only one radiologist noticed these artifacts during the reader study and subsequently correctly identified nine of 10 real images from the randomly paired cases.
We have not found any literature suggesting that such vascular morphologic characteristics on mammograms are associated with any malignant pathologic conditions.
Common Failures and Artifacts
We observed several types of failures in the generated images during the qualitative assessment (Fig E4 [supplement]). Some of them are clearly network failures, which indicates that not all possible latent vectors correspond to valid images in pixel space. Others can be attributed to problems in the training set. For instance, we observed that a small number of images containing breast implants were accidentally included in the training set, and the generator sometimes attempted to unsuccessfully produce such images (Fig E4 [supplement]).
Calcifications and Metal Markers
Calcifications are caused by calcium deposition and can occur naturally in the breast. They can vary in size and shape but appear very bright (white) on the image as they fully absorb passing x-rays. They are important in mammography because certain patterns can be a strong indication of malignancy (clustered microcalcifications), whereas others are benign (intravascular deposits).
External skin markers are frequently used by technicians performing mammography to indicate the position of a palpable lesion in the breast for the attention of the radiologists. They also appear very bright and are distinctively fully circular in shape (Fig E5 [supplement]).
We observed that the generator strongly resisted producing these structures. It is only at late stages of training that features roughly similar to medium-sized calcifications appeared in the generations, but they were not convincing. Our hypothesis is that the network architecture acts as a strong prior against such discontinuous features, a theory supported by the literature (13).
Limitations
As with any work that uses neural networks, a major limitation is the breadth and quantity of data available for training. Although our screening mammographic dataset is large and covers a wide demographic population, the prevalence of malignant images is low and it is unlikely that the network would be successful in synthesizing malignancies.
The reader study had limitations. The study took place at a busy radiology conference with bright lighting, and an iPad Pro (Apple) was used. Participants self-volunteered after approaching our commercial booth and were often distracted during the game. Some participants effectively “gave up” after several cases after being convinced they were failing to find real images and selected subsequent images as being real at random. Some visitors also refused to participate because they were reluctant to be compared with their colleagues. A more ideal study setting would have been a standard radiology reading room with a statistically powered cohort of participants in both groups required to give full attention to the task until completion of all cases. Additionally, the images were not at full clinical resolution, a limitation that cannot currently be overcome because of the limitations of GANs.
Although we have presented results for all group stratifications, some sample sizes were insufficient to extract reliable conclusions about statistical significance.
Future Work
We suggest that further work on GANs in medical imaging should explore several areas: refining GAN architecture to create higher-resolution images closer to those of clinical full-field digital mammography; cosynthesizing both MLO and craniocaudal views simultaneously to produce image pairs that represent the same breast at different angles; assessing whether the GAN-derived synthetic images, or patches of them, can successfully be used to augment training datasets for deep learning malignancy classifiers; and investigating the effects of both the perceived and quantitative realism of outlier pruning on the basis of moments plots.
APPENDIX
SUPPLEMENTAL FIGURES
Acknowledgments
Acknowledgments
We thank members of the Kheiron team for their continued support through the development of the project. In particular, we thank Matheus Tylicki for feedback on the tool and Gareth Williams for developing the iPad application. Furthermore, we thank W. F. Wiggins of Duke University Hospital for his insight and labeling of anomalous vascular morphologic patterns.
Disclosures of Conflicts of Interest: D.K. disclosed no relevant relationships. H.H. disclosed no relevant relationships. A.H. disclosed no relevant relationships. E.K. disclosed no relevant relationships. G.W. disclosed no relevant relationships. T.R. Activities related to the present article: disclosed no relevant relationships. Activities not related to the present article: disclosed money paid to author for employment by Kheiron Medical Technologies; stock/stock options from Kheiron Medical Technologies; patents pending related to GAN work. Other relationships: disclosed no relevant relationships. P.K. disclosed no relevant relationships. B.G. Activities related to the present article: disclosed no relevant relationships. Activities not related to the present article: disclosed editorial board membership for Medical Image Analysis, Image and Vision Computing; consultancy from Axon Advisors; employment with HeartFlow, Microsoft Research; grants/grants pending from European Commission, EPSRC, NIHR, UKRI; stock/stock options in HeartFlow. Other relationships: disclosed no relevant relationships.
Abbreviations:
- GAN
- generative adversarial network
- MLO
- mediolateral oblique
References
- 1.Goodfellow I, Pouget-Abadie J, Mirza M, et al. Generative adversarial nets. In: Ghahramani Z, Welling M, Cortes C, Lawrence N, Weinberger KQ, eds. Proceedings of the 27th International Conference on Neural Information Processing Systems. Vol 2. Cambridge, Mass: MIT Press, 2014; 2672–2680. https://dl.acm.org/doi/10.5555/2969033.2969125. [Google Scholar]
- 2.Karras T, Aila T, Laine S, Lehtinen J. Progressive growing of GANs for improved quality, stability, and variation. Presented at the 6th International Conference on Learning Representations (ICLR 2018). Vancouver, Canada, April 30 to May 3, 2018. NVIDIA Web site. https://research.nvidia.com/sites/default/files/pubs/2017-10_Progressive-Growing-of/karras2018iclr-paper.pdf. Published February 15, 2018. Accessed February 11, 2021.
- 3.Salehinejad H, Valaee S, Dowdell T, Colak E, Barfett J. Generalization of deep neural networks for chest pathology classification in x-rays using generative adversarial networks. In: Proceedings of the 2018 IEEE International Conference on Acoustics, Speech and Signal Processing (ICASSP 2018). Piscataway, NJ: Institute of Electrical and Electronics Engineers, 2018; 990–994. [Google Scholar]
- 4.Frid-Adar M, Klang E, Amitai M, Goldberger J, Greenspan H. Synthetic data augmentation using GAN for improved liver lesion classification. In: Proceedings of the 2018 IEEE 15th International Symposium on Biomedical Imaging (ISBI 2018). Piscataway, NJ: Institute of Electrical and Electronics Engineers, 2018; 289–293. [Google Scholar]
- 5.Kamnitsas K, Baumgartner C, Ledig C, et al. Unsupervised domain adaptation in brain lesion segmentation with adversarial networks. In: Niethammer M, Styner M, Aylward S, et al., eds. Information processing in medical imaging. IPMI 2017. Vol 10265, Lecture Notes in Computer Science. Cham, Switzerland: Springer, 2017; 597–609. [Google Scholar]
- 6.Yi X, Babyn P. Sharpness-aware low-dose CT denoising using conditional generative adversarial network. J Digit Imaging 2018;31(5):655–669 [DOI] [PMC free article] [PubMed] [Google Scholar]
- 7.Ledig C, Theis L, Huszár F, et al. Photo-Realistic Single Image Super-Resolution Using a Generative Adversarial Network. In: Proceedings of the 2017 IEEE Conference on Computer Vision and Pattern Recognition (CVPR). Piscataway, NJ: Institute of Electrical and Electronics Engineers, 2017; 4681–4690. [Google Scholar]
- 8.Ross BC. Mutual information between discrete and continuous data sets. PLoS One 2014;9(2):e87357. [DOI] [PMC free article] [PubMed] [Google Scholar]
- 9.Choi Y, Choi M, Kim M, Ha JW, Kim S, Choo J. Stargan: Unified generative adversarial networks for multi-domain image-to-image translation. In: Proceedings of the IEEE conference on computer vision and pattern recognition. 2018;8789–8797. [Google Scholar]
- 10.Kingma DP, Dhariwal P. Glow: generative flow with invertible 1× 1 convolutions. In: Proceedings of the 32nd International Conference on Neural Information Processing Systems. 2018;10236–10245. [Google Scholar]
- 11.Zhu JY, Park T, Isola P, Efros AA. Unpaired image-to-image translation using cycle-consistent adversarial networks. In: Proceedings of the IEEE international conference on computer vision. 2017;2223-2232. [Google Scholar]
- 12.Brock A, Donahue J, Simonyan K. 2018. Large scale GAN training for high fidelity natural image synthesis. arXiv 1809.11096 [preprint] https://arxiv.org/abs/1809.11096.Pubmed Partial Author stitle stitle Volume Page [Google Scholar]
- 13.Ulyanov D, Vedaldi A, Lempitsky V. Deep image prior. In: Proceedings of the 2018 IEEE/CVF Conference on Computer Vision and Pattern Recognition. Piscataway, NJ: Institute of Electrical and Electronics Engineers, 2018; 9446–9454. [Google Scholar]
Associated Data
This section collects any data citations, data availability statements, or supplementary materials included in this article.


