

CytoTalk is a novel computational method that infers cell type–specific signaling networks from single-cell transcriptomic data.
Abstract
Single-cell technology enables study of signal transduction in a complex tissue at unprecedented resolution. We describe CytoTalk for de novo construction of cell type–specific signaling networks using single-cell transcriptomic data. Using an integrated intracellular and intercellular gene network as the input, CytoTalk identifies candidate pathways using the prize-collecting Steiner forest algorithm. Using high-throughput spatial transcriptomic data and single-cell RNA sequencing data with receptor gene perturbation, we demonstrate that CytoTalk has substantial improvement over existing algorithms. To better understand plasticity of signaling networks across tissues and developmental stages, we perform a comparative analysis of signaling networks between macrophages and endothelial cells across human adult and fetal tissues. Our analysis reveals an overall increased plasticity of signaling networks across adult tissues and specific network nodes that contribute to increased plasticity. CytoTalk enables de novo construction of signal transduction pathways and facilitates comparative analysis of these pathways across tissues and conditions.
INTRODUCTION
Single-cell RNA sequencing (scRNA-seq) technologies are increasingly being used to characterize the heterogeneity of a complex tissue. Beyond cataloging cell types and transcript abundance, it is critical to understand how different cell types interact with one another to give rise to the emergent tissue complexity. Signal transduction is the primary mechanism for cell-cell communication. scRNA-seq technology holds great promise for studying cell-cell communication at much higher resolution. Using scRNA-seq data, several methods have been developed to infer ligand-receptor pairs that are active between two cell types. Skelly et al. (1) and Kumar et al. (2) predict ligand-receptor pairs if the two genes are expressed in the two respective cell types. Zhou et al. (3) and Vento-Tormo et al. (4) identify ligand-receptor pairs whose expression is specific to the cell types considered. Signaling pathways are highly dynamic, and cross-talk among them is prevalent. Because of these two features, simply examining expression levels of ligand and receptor genes cannot reliably capture the overall activities of signaling pathways and interactions among them (5, 6). As a step forward, Wang et al. (7) developed SoptSC and Browaeys et al. (8) developed NicheNet to identify both ligand-receptor pairs and genes downstream of them. However, these methods are based on known annotations of signaling pathways. To our knowledge, no method currently exists to perform de novo prediction of full signal transduction pathways emanating from the ligand-receptor pairs.
Here, we describe the CytoTalk algorithm for de novo construction of a signaling network (union of multiple signaling pathways) between two cell types using single-cell transcriptomic data. The algorithm first constructs an integrated network consisting of intracellular and intercellular functional gene interactions. It then identifies the signaling network by solving a prize-collecting Steiner forest (PCSF) problem based on appropriately defined node prize (i.e., cell-specific gene activity) and edge cost (i.e., probability of functional interaction between two genes). The objective of the PCSF problem is to find an optimal subnetwork in the integrated network that includes genes with high levels of cell type–specific expression and close connection to highly active ligand-receptor pairs. We benchmark the performance of CytoTalk using high-throughput spatial transcriptomic data and scRNA-seq data with perturbation to the receptor genes in a signaling pathway. To gain new insight into the heterogeneity of signaling pathways across tissues and developmental stages, we apply CytoTalk to perform a comparative analysis of signaling networks between macrophages and endothelial cells across human adult and fetal tissues. A software package implementing the CytoTalk algorithm has been deposited at GitHub (https://github.com/tanlabcode/CytoTalk).
RESULTS
Wiring of signaling pathways is highly cell type dependent
A hallmark of signal transduction pathways is their high level of cell type–specific wiring pattern. Single-cell transcriptome data allow us to examine the cell type–specific activity of individual signaling pathways beyond just ligand and receptor genes. To this end, we examined the canonical fibroblast growth factor receptor 2 (FGFR2) signaling pathway in two tissues, mammary gland and skin. Four canonical downstream pathways are known to signal from FGFR2 (9), including Janus kinase and signal transducer and activator transcription proteins (JAK-STAT), protein kinase C (PKC), mitogen-activated protein kinase (MAPK), and phosphoinositide 3-kinase and protein kinase B (PI3K/AKT) pathways. For mammary gland, we studied FGFR2 signaling between fibroblasts and luminal epithelial cells or basal cells (10, 11). For skin, we studied FGFR2 signaling between keratinocyte stem cells and basal cells (12). Using published scRNA-seq data (13) for each tissue type, we computed an expression specificity score, preferential expression measure (PEM) (14, 15) (see Materials and Methods), for each pathway gene in each cell type (Fig. 1, A to C). We found that the four canonical subpathways downstream of the same receptor (FGFR2) exhibit notable difference in cell type–specific activities not only within the same tissue but also across different tissues. In the mammary gland, the PI3K/AKT and PKC pathways are the most active pathways for signaling between fibroblasts and luminal epithelial cells and basal cells, respectively. In contrast, the JAK-STAT pathway is the most active pathway for signaling between keratinocyte stem cells and basal cells in the skin. To systematically evaluate the extent of cell type–specific wiring of signaling pathways, we examined all manually annotated signaling pathways in the Reactome database (16). For each pathway, we computed its cell type–specific activity score using the same mammary gland and skin scRNA-seq datasets (13). We found that most of the pathways exhibit high degree of cell type–specific activities (Fig. 1, D and E). This is true even for the same cell types from different tissues, such as basal cells from mammary gland versus basal cells from skin (Fig. 1F). Using an alternative source of signaling pathway annotations that include gene signatures for Myc, Ras, E2F3, Src, and β-catenin pathways (17), we found that all pathways exhibit differential activities across cell types in mammary gland and skin (fig. S1). Together, these results highlight the need for analytical tools for de novo construction of complete signaling pathways (instead of ligand-receptor pairs) using single-cell transcriptomic data.
Fig. 1. Wiring of signaling pathways is highly cell type dependent.
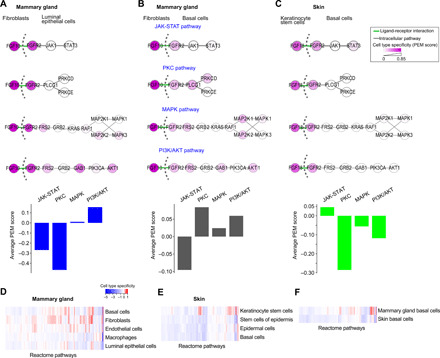
(A to C) Cell type–specific activity of subpathways downstream of the FGFR2 between fibroblasts and luminal epithelial cells (A) and basal cells (B) in mouse mammary gland and between keratinocyte stem cells and basal cells in mouse skin (C). Cell type–specific activities of four canonical subpathways downstream of FGFR2 are shown. PEM, cell type–specific activity score, was calculated using scRNA-seq data (Materials and Methods). Color shade of each gene node is proportional to the PEM score. Top: Individual pathway activities. Bottom: Quantification of average PEM score of subpathway genes. (D) Cell type–specific activity of Reactome pathways across five cell types in mammary gland. Each vertical bar represents the average PEM score of one pathway. (E) Cell type–specific activity of Reactome pathways across four cell types in skin. (F) Differential pathway activity in basal cells from two different tissues, mammary gland and skin.
Overview of the CytoTalk algorithm
CytoTalk is designed for de novo construction of a signal transduction network between two cell types (Fig. 2; Materials and Methods), which is defined as the union of multiple signal transduction pathways. It first constructs a weighted integrated gene network composed of both intracellular and intercellular functional gene-gene interactions. Intracellular functional gene interactions are computed and weighted using mutual information between two genes. Two intracellular networks are connected via cross-talk edges (i.e., known ligand-receptor interactions). Ligand-receptor pairs with higher cell type–specific gene expression but lower correlated expression within the same cell type (thus more likely to be involved in cross-talk instead of self-talk) are assigned higher cross-talk weights. Nodes in the integrated network are weighted by a combination of their cell type–specific gene expression and closeness to the ligand/receptor genes in the network. We use a network propagation procedure to determine the closeness of a gene to the ligand/receptor genes. With the integrated network as the input, we formulate the identification of signaling network as a PCSF problem (18, 19). The rationale for using the PCSF algorithm is to find an optimal subnetwork that includes genes with high levels of cell type–specific expression and close connection to high-scoring ligand-receptor pairs. The objective function of the PCSF algorithm is designed to capture these two types of information/weights (see Materials and Methods for details). This optimal subnetwork is defined as the signaling network between the two cell types. The statistical significance of the identified signaling network is computed using a null score distribution of signaling networks generated using degree-preserving randomized networks.
Fig. 2. Schematic overview of the CytoTalk algorithm.
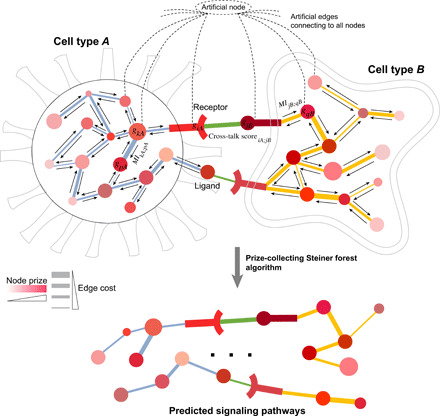
An integrated gene network is constructed de novo using single-cell transcriptomic data alone. The integrated network consists of two intracellular networks that are connected by known ligand-receptor gene pairs. giA and gjB, genes i and j in cell type A and B, respectively; MIkA;pA, mutual information between genes k and p in cell type A; Cross-talk scoreiA;jB, cross-talk score between gene i in cell type A and gene j in cell type B. Node color is proportional to node prize, and edge thickness is inversely proportional to edge cost. Node prize is computed on the basis of both gene expression specificity and network distance to ligand/receptor gene. Edge cost is computed on the basis of mutual information or cross-talk score. Directed arrows along each edge indicate network propagation procedure. An artificial node (root node) is included in the integrated network to enable search using the PCSF algorithm. Statistical significance of the predicted pathways is computed by comparing to null models of PCSFs identified from 1000 randomized networks.
Performance evaluation using spatial transcriptomic data
To evaluate the performance of CytoTalk, we applied it to scRNA-seq datasets on mouse visual cortex (20) and olfactory bulb (21), respectively. Both datasets cover the following cell types: neurons, astrocytes, microglia cells, endothelial cells, oligodendrocytes, and oligodendrocyte precursor cells. In the visual cortex dataset, neurons were further classified into two subtypes, glutamatergic (Glut) neurons and GABAergic (GABA) neurons. On average, 6358 and 836 genes were detected per cell in the visual cortex and olfactory bulb datasets, respectively. Among the covered cell types, neurons, endothelial cells, astrocytes, and microglia cells are known to signal to each other (22–29). We identified signaling networks between five pairs of these cell types, including neuron–endothelial cell (NeuronEndo for the olfactory bulb or GlutEndo and GABAEndo for the visual cortex), neuron-astrocyte (NeuronAstro or GlutAstro and GABAAstro), neuron-microglia (NeuronMicro or GlutMicro and GABAMicro), astrocyte–endothelial cell (AstroEndo), and endothelial cell–microglia cell (EndoMicro), respectively. The eight predicted cell type pair–specific signaling networks in the visual cortex consist of 567, 445, 692, 332, 643, 628, 577, and 403 genes and involve 24, 22, 42, 29, 32, 28, 39, and 45 ligand-receptor interactions (cross-talk edges), respectively (table S1). For the olfactory bulb, the five predicted signaling networks consist of 627, 542, 604, 764, and 684 genes and involve 10, 14, 10, 20, and 23 cross-talk edges, respectively (table S1). Compared to PCSFs identified using 1000 randomized input networks, all predicted signaling networks have significantly smaller objective function scores (empirical P ≤ 0.01; see Materials and Methods and fig. S2, A and B) and larger fractions of cross-talk edges (empirical P ≤ 0.04; fig. S2, C and D). Several predicted ligand-receptor pairs are known to mediate signal transduction between these five pairs of cell types. For example, neuronal protein SLIT2 can modulate vascular permeability by binding to ROBO4 expressed on endothelial cells (23, 30). NLGN1 expressed on astrocytes can interact with NRXN1 expressed on neurons to control astrocyte morphogenesis and synaptogenesis (26). CX3CL1 expressed by neurons can bind to CX3CR1 expressed on microglia to modulate the neuroprotective activity of microglia (29). Astrocytes are known to express VEGFA (vascular endothelial growth factor A) that can signal to endothelial cells in the central nervous system (CNS) via KDR (or VEGFR2), which is important for CNS angiogenesis and the formation of the blood-brain barrier (23, 31). TGFB1 secreted by microglia is known to bind to ACVRL1 and ENG that are expressed on neighboring endothelial cells (32).
To further characterize the predicted signaling networks, we classified them into three groups based on the involvement of three non-neuronal cell types, microglia cells, astrocytes, and endothelial cells. For microglial cell–related networks in the visual cortex, we found that signaling with neuronal cell types (i.e., GlutMicro and GABAMicro) shares a larger number of signaling genes (69%) than signaling with endothelial cells. Similar observations were also made for astrocyte-related networks [i.e., between GlutAstro and GABAAstro (61%)] and for endothelial cell–related networks [i.e., between GlutEndo and GABAEndo (74%)] (Fig. 3A). This result suggests that signaling between glia cells (microglia cells and astrocytes) and endothelial cells is more cell type pair specific than that between glial cells and neurons. A similar phenomenon was also observed in the olfactory bulb (Fig. 3B). We extracted ligand-receptor–associated pathways from the predicted networks. We found that 50 and 33% of the predicted pathways in the visual cortex and olfactory bulb are enriched for known pathways curated in either the Reactome data (16) or the Kyoto Encyclopedia of Genes and Genomes (KEGG) (33) database (fig. S3).
Fig. 3. Performance evaluation of the CytoTalk algorithm using spatial transcriptomic data.
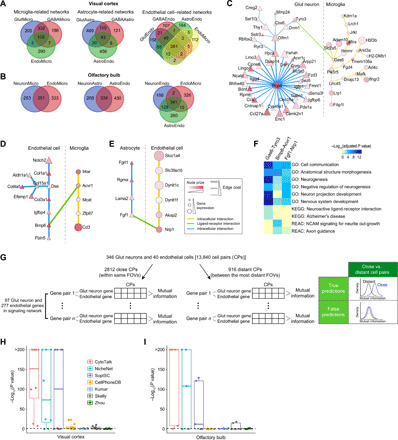
(A and B) Venn diagrams for genes in the microglia-, astrocyte-, and endothelial cell–related signaling networks predicted by CytoTalk in the visual cortex (A) and olfactory bulb (B). (C to E) Representative signaling pathways uniquely predicted by CytoTalk for GlutMicro (C), EndoMicro (D), and AstroEndo (E) in the visual cortex. (F) Pathway genes in (C) to (E) are enriched for nervous system–related Gene Ontology (GO) biological processes and pathways in the Reactome (REAC) and KEGG databases. Shades of blue in the heatmap are inversely proportional to the enrichment P values that were adjusted for multiple testing using the Benjamini-Hochberg method. Nonsignificant P values (> 0.05) are indicated in yellow. (G) Schematic illustration of the procedure and rationale for using SeqFISH+ data to evaluate predicted signaling networks. (H and I) Performance evaluation using mutual information of spatial expression of predicted pathway genes across cell pairs in close and distant groups. Cell pairs were categorized into the two distance groups using SeqFISH+ data. Cells in the same FOV were considered as close, whereas cells from two most distant FOVs were considered as distant. Mutual information of predicted pathway genes was computed using the SeqFISH+ data and compared between the close and distant cell pair groups. Statistical significance between the two distributions of mutual information was computed using one-sided Kolmogorov-Smirnov test for predicted pathways in the visual cortex (H) and olfactory bulb (I). Each dot in the boxplot represents the performance on a given cell type pair. Detailed results are illustrated in fig. S7. Dashed line, significant P value of 0.05.
For benchmarking purpose, we compared CytoTalk to six published algorithms, four designed for predicting ligand-receptor pairs only (1–4), and two designed for predicting full signaling pathways based on known pathway annotations (7, 8). Since a comprehensive list of true ligand-receptor pairs is not available for the 13 cell type pairs, we first asked what fractions of the predicted ligand-receptor pairs are shared among the seven methods. We reasoned that a more accurate method will have, on average, a larger fraction of overlapped predictions with the rest of the methods. We found that CytoTalk has the highest average rank based on the Jaccard index of ligand-receptor pairs between any two methods in all 13 cell type pairs (fig. S4), suggesting that CytoTalk has the highest accuracy among the seven methods. Figure 3 (C to E) shows several representative ligand-receptor pairs and their related pathways uniquely predicted by CytoTalk for cell type pairs in the visual cortex. These pathways are enriched for genes involved in cell communication, nervous system development, and even neurodegenerative diseases (Fig. 3F). Overall, compared to predictions shared among CytoTalk, NicheNet, and SoptSC, genes in the networks uniquely predicted by CytoTalk are more significantly enriched for key cross-talk functions between the given cell type pairs (fig. S5).
To systematically evaluate the performance of CytoTalk, we used two matched sequential fluorescence in situ hybridization (SeqFISH+) datasets for the visual cortex and olfactory bulb (32), respectively, covering the same set of cell types as the scRNA-seq datasets (20, 21). On average, these two datasets provide a spatially resolved abundance of 5826 transcripts (3344 genes) per cell in the visual cortex and 1284 transcripts (844 genes) per cell in the olfactory bulb, respectively. For each pair of cell types under study, we divided cell pairs into close and distant groups based on their physical distance determined using the SeqFISH+ data (fig. S6 and Materials and Methods). We then calculated the mutual information of the SeqFISH+ expression among signaling pathway genes across the two groups of cell pairs (Fig. 3G). We reasoned that cells that are close are more likely to signal to each other. Therefore, bona fide signaling pathway genes are expected to have higher mutual information of spatial expression in these cells than cells that are distant from each other.
For Glut neurons and endothelial cells in the visual cortex, there are 2812 and 916 cell pairs in the close and distant groups, respectively (Materials and Methods). We found that genes in signaling pathways predicted by CytoTalk have significantly larger mutual information of spatial expression in close GlutEndo cell pairs than distant cell pairs (one-sided Kolmogorov-Smirnov test P = 2.0 × 10−100), thus providing support to our predictions (Fig. 3, G and H, and fig. S7A). In comparison, predicted pathway genes by other methods show no or less significant difference in mutual information between close and distant cell pairs (Fig. 3H and fig. S7A), suggesting that those predictions have higher false-positive rates.
For the predicted signaling networks of the other 12 cell type pairs, we also found that CytoTalk predictions have consistently larger mutual information in close cell pairs than distant cell pairs, except for the NeuronMicro signaling network in the olfactory bulb. In comparison, predictions by other methods do not show significant separation in mutual information between close and distance cell pairs (Fig. 3, H and I, and fig. S7). Together, these results demonstrate that CytoTalk has substantial improvement over existing methods.
Performance evaluation using scRNA-seq data with receptor gene perturbation
To further evaluate the accuracy of CytoTalk, we applied it to an scRNA-seq dataset in which the transcriptomes of wild-type and receptor gene knockout cells were measured (34). The dataset covers 13 cell types in the mouse lung, including T and B cells, neutrophils, basophils, monocytes, macrophages, endothelial cells, alveolar type I (AT1) and type II (AT2) cells, club cells, smooth muscle cells, fibroblasts, and pericytes. On average, 2627 transcripts (1143 genes) were detected per cell. The authors found a novel signaling pathway involving interleukin 33 (IL33) secreted by AT2 cells and IL1 receptor–like 1 (IL1RL1) on basophils (34). Using this dataset, we first asked whether the IL33-IL1RL1 interaction between AT2 cells and basophils can be predicted. We found that the three methods (CytoTalk, NicheNet, and SoptSC) can identify the IL33-IL1RL1 interaction (table S1). We then evaluated the prediction accuracy using receiver operating characteristic (ROC) curve. To this end, we used the differentially expressed genes (DEGs; Materials and Methods) between IL1RL1-knockout and wild-type basophils as the ground truth. We found that predictions by CytoTalk have a higher area under the ROC curve (Fig. 4A). Furthermore, the downstream pathway genes predicted by CytoTalk tend to be more significantly differentially expressed compared to the genes predicted by the other two methods (one-sided Wilcoxon P < 1.0 × 10⁻²⁶; Fig. 4B). Together, these results provide additional support for the improved performance of CytoTalk compared to existing methods.
Fig. 4. Performance evaluation of the CytoTalk algorithm using scRNA-seq data with receptor gene perturbation.
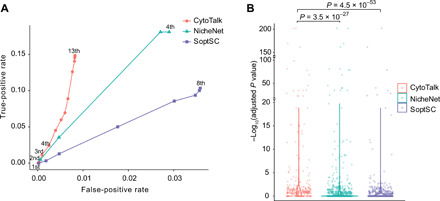
Pathways predicted by CytoTalk, NicheNet, and SoptSC were evaluated by comparing to DEGs between receptor gene knockout and wild-type cells. DEGs were identified by DESeq2 using a Benjamini-Hochberg (BH)–adjusted P value cutoff of 0.05. (A) ROC curve. DEGs between IL1RL1-knockout and wild-type basophils are considered true positives. True-positive rate and false-positive rate were computed using the DEGs. Numbers at each point on the curve indicate the network distance of predicted genes to the receptor (IL1RL1). For instance, 1st means a predicted gene that is a first-order neighbor of the receptor. (B) Distribution of P values of differential expression for all genes in the predicted downstream pathways. Shown are violin plots of −log10(BH-adjusted P value). P values for comparing distributions were computed using one-sided Wilcoxon rank sum test.
Entropy of signaling pathways across human tissues
Our analysis in Fig. 1 suggests that wiring of signaling pathway is highly cell type dependent. To better understand the heterogeneity of signaling pathways, we applied CytoTalk to perform a comparative analysis across tissues and developmental stages. Endothelial cells and macrophages are two common cell types in many mammalian tissues, and their interaction plays a critical role in the tissue adaptability of macrophages and tissue homeostasis (35, 36). We analyzed scRNA-seq datasets of these two cell types from human kidney, heart, and lung, at both fetal and adult stages (table S1) (37). On average, we found that 52 and 47% of the predicted pathway genes are shared among the three tissues at both fetal and adult stages, respectively (Fig. 5A). For shared pathway genes, we calculated their local Shannon entropy (38) that measures the uncertainty of signaling interaction patterns associated with a given pathway gene in a tissue. Genes with higher signaling entropies have more uniform signaling interaction probabilities with their interacting partners in the signaling network. We next identified genes that exhibit significantly large differential entropies across the three tissues (Materials and Methods). These genes represent the most dynamic nodes of the signaling networks across tissues. We identified 18 and 28 significant genes (empirical P < 0.1; table S2) in fetal and adult tissues, respectively. We found that the significant genes have larger differential entropies among adult tissues than fetal tissues (Wilcoxon rank sum test P = 6.8 × 10⁻⁵; Fig. 5B). This is reminiscent of a previous observation that transcriptomes differ more across adult organs than across fetal organs (39).
Fig. 5. Plasticity of signaling networks across tissues and developmental stages.
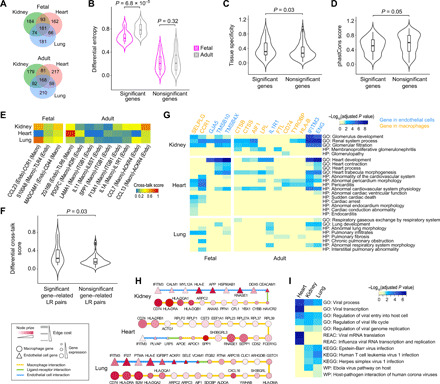
Signaling networks between endothelial cells and macrophages in kidney, heart, and lung were predicted for both fetal and adult stages. (A) Venn diagrams for genes in the predicted signaling networks of the three tissues. (B to D) Distribution of differential entropies (B), tissue specificity scores (C), and sequence conservation scores (D) of the shared signaling network genes of the three tissues. The shared genes were stratified into significant and nonsignificant groups based on empirical P values. (E) Cross-talk scores of ligand-receptor pairs that are most closely related to the significant genes in the predicted networks. (F) Distributions of differential cross-talk scores between the three tissues for the ligand-receptor (LR) pairs that are most closely related to the significant and nonsignificant genes. P values for comparing distributions were computed using one-sided Wilcoxon rank sum test. (G) The neighborhood of significant genes shared by all three tissues in the predicted signaling networks is enriched for tissue-specific Gene Ontology biological processes and human disease phenotypes (HP). (H) The shortest paths between two important host antiviral genes, IFITM3 and CD74, in the predicted signaling networks of the three tissues. (I) Genes on the shortest paths in (H) are enriched for virus-related Gene Ontology biological processes and infection response pathways from Reactome, KEGG, and WikiPathways (WP) databases. Shades of blue in the heatmap are inversely proportional to the enrichment P values that are adjusted for multiple testing using the Benjamini-Hochberg method. Nonsignificant P values (> 0.05) are indicated in yellow.
We hypothesized that genes with differential entropies are associated with their diverse functions across tissues. We found several lines of evidence supporting this hypothesis. First, we observed that genes with significant differential entropies have larger tissue specificity scores (Materials and Methods) than nonsignificant genes (Wilcoxon rank sum test P = 0.03; Fig. 5C and table S2). Second, we found that significant genes are less evolutionary conserved than nonsignificant genes (Wilcoxon rank sum test P = 0.05; Fig. 5D and table S2). This anticorrelation between tissue specificity and sequence conservation was also observed in previous studies (40, 41). Third, we found that the ligand-receptor pairs that are most closely related to the significant genes have larger differential cross-talk scores (see Materials and Methods) across tissues (Fig. 5E) than ligand-receptor pairs related to nonsignificant genes (Wilcoxon rank sum test P = 0.03; Fig. 5F). Last, to further investigate the functions of significant genes that are shared by all three tissues, we extracted their associated pathways (Materials and Methods) from the predicted signaling networks. We found that they are enriched for tissue-specific functions and tissue-specific disease phenotypes (Fig. 5G), probably reflecting their functional adaptation across tissues (39). Together, these results highlight the heterogeneity of signaling pathways between the same cell type pair in different tissues, which may play an important role in tissue adaptation of these cell types.
We noticed that, among the significant genes shared by all three tissues, IFITM3 and CD74 are known to have important antiviral activities in endothelial cells (42) and macrophages (43), respectively. They are also the top genes with differential entropy in the endothelial (first ranked) and macrophage (second ranked) signaling networks, respectively. To investigate whether there exist functional cross-talk pathways between them, we extracted the shortest paths between IFITM3 and CD74 from the predicted signaling networks of the three tissues (Fig. 5H). We found that the majority of the genes (84%) on the shortest paths are different among the tissues. They are enriched for both common and tissue-specific virus-related biological processes and pathways, suggesting that different signaling pathways may be activated in response to a given virus in different tissues (Fig. 5I). Consistent with the fact that the lung is the main target organ of coronavirus infection, only the shortest-path genes in the lung are enriched for the term host-pathogen interaction of human corona viruses. This result implicates a possible role of the IFITM3 and CD74 signaling cross-talk in SARS-CoV-2 (COVID-19) infection, which are also supported by several recent studies (43–45).
DISCUSSION
We introduce a computational method, CytoTalk, for the construction of cell type–specific signaling pathways using single-cell transcriptomic data and known ligand-receptor interactions. Unlike previous methods using known pathway annotations (7, 8), CytoTalk constructs full signaling pathways de novo. Using CytoTalk, we performed a comparative analysis of signaling pathways across human tissues and developmental stages, revealing increased heterogeneity of signaling networks in adult tissues compared to fetal tissues and specific nodes in the network that exhibit significant changes in signaling entropy across tissues.
Systematic evaluation of predicted signaling pathways represents a major challenge due to the lack of gold-standard cell type–specific pathway annotations. Here, we propose two benchmarking strategies using single-cell spatial transcriptomic data and perturbation-based scRNA-seq data, respectively. Using spatial transcriptomic data, cells of two types can be stratified into close and distant cell pair groups based on their physical separation. The predicted signaling pathways can be validated by computing the mutual information of spatial expression for pathway genes across cell pairs. Using perturbation-based scRNA-seq data, especially data with ligand/receptor gene perturbation, DEGs between the perturbed and wild-type cells can be used to validate predicted pathways. Using these two benchmarking approaches, we demonstrated that CytoTalk substantially outperforms six existing methods that also use scRNA-seq data to characterize cell-cell communication.
In the current version of CytoTalk, the node prize is defined on the basis of cell type specificity of gene expression. Thus, CytoTalk may fail to identify signaling pathways whose genes have low expression specificity in the cell types under study. To address this issue, the node prize can be redefined by considering both absolute gene expression level and cell type specificity of gene expression. It is also well known that activity of a signaling pathway is regulated by posttranslational modifications. With the rapid development of single-cell proteomic technologies (46), CytoTalk can be further improved by incorporating these data. The current version of CytoTalk uses intracellular networks constructed using scRNA-seq data. Other types of molecular interaction data such as protein-protein interactions and genetic interactions are becoming more abundant. The utility of these data types can be investigated in the future development of CytoTalk.
In summary, CytoTalk provides a much-needed means for de novo construction of full cell type–specific signaling pathways. Comparative analysis of signaling pathways will lead to a better understanding of cell-cell communication in healthy and diseased tissues.
MATERIALS AND METHODS
Construction of intracellular functional gene interaction network
We construct an intracellular gene coexpression network for each cell type by calculating the mutual information between all pairs of genes using the infotheo R package (47). Edges representing indirect functional relationship between genes are removed using the data processing inequality criterion (48) implemented in the parmigene package (49). Mutual information value is used as the edge weight in the two intracellular networks.
Cross-talk score of a ligand-receptor pair between two cell types
Cell-cell communication in a multicellular organism can be mediated by autocrine signaling, paracrine signaling, and juxtacrine signaling (contact-mediated signaling). There is a fundamental trade-off between autocrine and paracrine signaling (50). The former enables a single cell to talk to itself, whereas the latter is designed to allow multiple cell types to talk to each other. Motivated by this observation, we define a cross-talk score between gene i in cell type A and gene j in cell type B as below. Genes i and j encode a ligand and a receptor or vice versa
where Expression scoreiA,jB is defined as the average PEM (14, 15) (defined below) of gene i and j in cell types A and B, respectively.
The PEM value for cell type specificity of gene i in cell type A is defined as the following
where ExpriA is the observed expression of gene i in cell type A. eiA is the expected expression of gene i in cell type A under the null hypothesis of uniform expression across all M cell types in the single-cell transcriptomic data. Exprim represents the expression of gene i in cell type m. s*m is the sum of expression of all genes in cell type m. s*A is the sum of expression of all genes in cell type A. Since we focus on genes that are expressed higher in a cell type rather than lower, PEMiA is set to zero if it is negative.
Non–self-talk scoreiA,jB is defined on the basis of information-theoretic measures. MIiA;jA (or MIiB;jB) is the mutual information between genes i and j in cell type A (or cell type B). min{Hi*, Hj*} is the upper bound of the mutual information and is used to normalize the mutual information values to [0, 1]. HiA and HjA are Shannon entropy of genes i and j in cell type A, respectively. HiB and HjB are Shannon entropy of genes i and j in cell type B, respectively.
The cross-talk score equals the product of the min-max–normalized expression score and non–self-talk score. If genes i and j are specifically expressed in cell types A and B, respectively, but are not coexpressed in either cell type (likely involved in self-talk), then the Cross-talk scoreiA,jB would be high, suggesting a high possibility of cross-talk between the two cell types.
Construction of an integrated network between two cell types
We construct an integrated network consisting of two intracellular networks connected by known ligand-receptor interactions. We collected 1942 manually annotated ligand-receptor interactions, including 1894 interactions from (51) and 48 interactions from (34, 52–56) (table S3). Note that both secreted and cell surface proteins could be ligands. For each ligand-receptor pair, if the ligand gene and the receptor gene are present in the two intracellular networks, then we connect them and denote the edge as a cross-talk edge. The cross-talk score is used as the edge weight as described above. Because of the difference in scale between mutual information value and cross-talk score, we separately normalize the edge weights of intracellular networks and cross-talk edges using z score transformation.
De novo identification of signaling network between two cell types
We formulate the identification of a signaling network between two cell types as a PCSF problem (18, 19). Because the forest is a disjoint set of trees, the PCSF problem is a generalization of the classical prize-collecting Steiner tree (PCST) problem (57, 58). The individual signaling pathways are represented as trees, and the collection of which (forest) represents the entire signaling network between two cell types.
We define edge costs and node prizes in the integrated network as follows. The z score–normalized edge weights of the integrated network are first scaled to the range of [0, 1]. The cost of edge e in the network is then defined as c(e) = 1 − w(e), where w(e) represents the scaled weight of edge e. Node prize is defined on the basis of both the PEM value of a gene and its closeness to the ligand/receptor genes in the network to identify signaling networks centered around the cross-talk edges. To determine the closeness to ligand/receptor genes, we use a network propagation procedure to calculate a relevance coefficient for each gene in an intracellular network.
where Relevancet is the relevance coefficient vector for all genes in the intracellular network at iteration t. Relevance0 is the initial value of the relevance coefficient vector such that Relevance0(i) = 1 if gene i is a ligand or receptor. Otherwise, Relevance0(i) = 0. W′ is a normalized edge weight matrix for an intracellular network, which is defined as W′=D−1/2WD−1/2. Here, W is set to the original mutual information matrix, and D is defined as a diagonal matrix such that D(i, i) is the sum of row i of the matrix W. This network propagation procedure is equivalent to a random walk with restart on the network. α is a tuning parameter that controls the balance between prior information (known ligands or receptors) and network smoothing. Thus, node prize of gene i in the integrated network is defined as p(i) = PEMi × Relevancet(i). This definition can capture both the cell type specificity and the closeness of this gene to the ligand or receptor gene in the network. To avoid extremely large node prizes for ligand or receptor genes, we used α = 0.9 in this study.
The PCSF algorithm identifies an optimal forest in a network that maximizes the total amount of node prizes and minimizes the total amount of edge costs in the forest. Although the PCSF problem is NP (nondeterministic polynomial time)-hard and often needs a high computational cost (18), we use a PCSF formulation established in (18, 59) and use a highly efficient PCST algorithm (60) to identify the PCSF. The objective function of the PCSF problem is defined as below
where F represents a forest (i.e., multiple disconnected trees) in the integrated network. c(F) denotes the sum of edge costs in the forest F, and denotes the sum of node prizes of the remaining subnetwork excluding the forest F from the network. We modify the integrated network by introducing an artificial node and a number of artificial edges to the original network. The artificial edges connect the artificial node to all genes in the original network. The costs of all artificial edges are the same and are defined as ω, which influences the number of trees, k, in the resulting PCSF. β is a parameter for balancing the edge costs and node prizes, which influences the size of the resulting PCSF. By tuning parameters β and ω, multiple PCSTs can be identified with the artificial node as the root node. For each identified PCST, a PCSF can be obtained by removing the artificial node and artificial edges from the PCST.
We identify the signaling network between two cell types by searching for the most robust PCSF across the full parameter space (see below; fig. S8). To further evaluate the statistical significance of the identified PCSF, we construct null distributions for the objective function and for the fraction of cross-talk edges in a PCSF using 1000 null PCSFs identified from randomized integrated networks (fig. S2). To generate the randomized networks, we separately shuffle the edges of the two intracellular networks while preserving the node degree distribution, node prizes, and cross-talk edges as the original integrated network.
Parameter selection
The main parameters of CytoTalk are β and ω in the objective function of the PCSF problem. We first determined the optimal ranges of the two parameters based on the total number of genes in the input integrated network and the size and overlap of the resulting PCSFs. For the mouse visual cortex dataset, β values were tested from 1 to 60 with a step size of 1. For the mouse olfactory bulb and lung tissue datasets, β values were tested from 5 to 500 with a step size of 5. For the Human Cell Atlas dataset, β values were tested from 1 to 80 with a step size of 1. We found that the upper limit of the test values of β is inversely proportional to the total number of genes in the integrated network of a given cell type pair (fig. S8A). Using β values above this upper limit results in very large PCSFs (>2000 edges) (fig. S8B). On the basis of this observation, we suggest that β values can be tested from 1 to 100 if the total number of genes in a given cell type pair is above 10,000. However, if the total number of genes is below 5000, then it is necessary to increase the upper limit of test β value to 500 to ensure that the largest PCSF includes more than 2000 edges.
For all datasets, ω values were tested from 0.1 to 1.5 with a step size of 0.1. We found using ω values above this range resulting in PCSFs with little difference compared to existing PCSFs (fig. S8C). Subsequent optimal parameter selection was conducted using the above parameter ranges. For all PCSFs identified using the β and ω ranges determined above, the occurrence frequency of each edge in a PCSF was computed to construct a background distribution of edge occurrence frequency. A P value for each PCSF was computed by comparing the edge occurrence frequency distribution of this PCSF to the distribution of all other PCSFs using one-sided Kolmogorov-Smirnov test. The PCSF with the minimum P value (red dot) was considered as the most robust signaling network predicted by CytoTalk (fig. S8D).
Processing of scRNA-seq data
For all scRNA-seq datasets used in this study (table S4), we only retained protein-coding genes based on annotations from the GENCODE database (61). For data from the Human Cell Atlas (37), following the authors’ data processing procedure, we removed genes expressed in fewer than three cells of a given type. For all other datasets, we removed genes expressed in less than 10% of all cells of a given type.
For identifying DEGs between IL1RL1-knockout and wild-type basophils, we first filtered out genes that have fewer than five sequencing reads in at least five cells. Then, we used the zinbwave function in the zinbwave R package (62) to model the zero inflation of the counts. The DESeq2 R package (63) was used to perform differential expression analysis. P values were adjusted for multiple testing using the method of Benjamini-Hochberg (64). A total of 619 DEGs with adjusted P < 0.05 were identified (table S5).
Processing of SeqFISH+ data
Two SeqFISH+ datasets were downloaded from a published study (32), including cell type annotation, cell spatial location [i.e., field of view (FOV) index] data, and two cell-by-gene count matrices for 523 visual cortex cells and 2050 olfactory bulb cells, respectively (table S6). On the basis of the authors’ preprocessing procedure (32), we first log2-transformed the count matrix followed by z score transformation.
Mutual information of spatial expression of signaling pathway genes using SeqFISH+ data
Cell pairs consisting of two types were categorized into two groups based on their physical locations imaged by SeqFISH+, namely close and distant groups. SeqFISH+ can image mRNAs for thousands of genes in all single cells in each FOV. Five and seven FOVs were imaged in the visual cortex and olfactory bulb datasets, respectively (32). We considered two cells in the same FOV as a close cell pair, whereas two cells from two most distant FOVs were considered as a distant cell pair (fig. S6). Genes in predicted signaling pathways were intersected with the genes detected by SeqFISH+. Among these genes, we computed the mutual information of SeqFISH+ expression values between any gene pair (one from each cell type and are connected in the predicted signaling pathways) across individual cells of the two types.
Running of published methods
NicheNet (8) uses a prior ligand-target regulation model by integrating known signaling transduction and transcriptional regulatory interactions to predict a signaling network between two cell types. Given the scRNA-seq data of cell type A and B, we first defined two gene sets that are expressed in these two cell types, respectively. We used the same expression cutoff and only retained protein-coding genes for analysis as described above. NicheNet requires a predefined gene set of interest in cell type B as candidate target genes regulated by ligands in cell type A. This gene set was defined as the genes that are specifically expressed (i.e., PEM score of >0) in cell type B. Using these gene sets as the input, we predicted ligands, their signaling pathways, and target genes using predict_ligand_activities and get_ligand_signaling_path functions in the NicheNet R package. These identified signaling pathways were considered as a “cell type A to B” signaling subnetwork. Using another set of genes that are specifically expressed in cell type A as input, we also predicted a “cell type B to A” signaling subnetwork. By combining the two subnetworks, we obtained a final predicted signaling network between the two cell types.
SoptSC (7) also uses known pathway annotations to predict signaling pathways between two cell types. For comparison, we used mouse Reactome pathways and the same ligand-receptor pairs as used by CytoTalk. For each ligand-receptor pair, we computed a matrix of signaling probabilities between any two cells from cell types A and B using the LR_Interaction function in the SoptSC MATLAB package. Using this matrix, we computed two probabilities of signaling via the given ligand-receptor pair from each direction (A → B and B → A), respectively. On the basis of these signaling probabilities, we selected the same number of ligand-receptor pairs as predicted by CytoTalk and their known downstream pathways for performance comparison.
Different from NicheNet and SoptSC, the other four methods only predict active ligand-receptor pairs between two cell types. Among these four methods, Zhou’s and Skelly’s methods are similar, which consider the gene expression levels of a ligand and its receptor separately. On the basis of Zhou’s method (3), for each gene i, we calculated the mean and SD σi of the gene expression values across all cell types. If the average expression values of the ligand gene in cell type A and the receptor gene in cell type B are both larger than , then this ligand-receptor pair is predicted to be active by Zhou’s method. On the basis of Skelly’s method (1), for each ligand-receptor pair, if the ligand and the receptor genes are expressed in more than 20% of the cells of cell types A and B, respectively, then this ligand-receptor pair is retained and considered to transmit a signal from cell type A to B. We considered all retained ligand-receptor pairs from both directions (A → B and B → A) as the final predictions by Skelly’s method.
Kumar’s method (2) is different from the two methods above, which defines an interaction score for a given ligand-receptor pair as the product of the average expression of the ligand gene in cell type A and the average expression of the receptor gene in cell type B. We selected the same number of ligand-receptor pairs as predicted by CytoTalk based on interaction scores as the final predictions by Kumar’s method.
CellPhoneDB (4) is a repository of curated ligand-receptor pairs and can be used for predicting ligand-receptor interactions based on their cell type specificity. Given an scRNA-seq gene expression matrix and cell type annotation data as the input, we used the cellphonedb function in the CellPhoneDB Python package to compute a P value for the likelihood of cell type specificity of each ligand-receptor pair. For two given cell types A and B, we selected the ligand-receptor pairs with P < 0.05 from each direction (A → B and B → A) as the final predictions by CellPhoneDB.
Differential signaling entropy
Given a signaling network and gene expression data, a local Shannon entropy for each gene in the network can be computed to measure the uncertainty of signaling interaction incident on a given gene. Following the definition in (38), signaling entropy of gene i is defined as
where Ni represents the first-order neighbors of gene i in the signaling network. wij denotes the edge weight between genes i and j and is defined as wij ∝ Expri ∙ Exprj, where Expri and Exprj are the normalized expression levels of gene i and j, respectively. pij is the probability of interaction between genes i and j. Here, ki is the degree of gene i in the signaling network, which serves as a normalization factor to scale the signaling entropy to the range of [0, 1].
We computed signaling entropies for all genes in the predicted networks in kidney, heart, and lung at fetal and adult stages using the R package provided in (38). We then defined differential entropy for a given gene as the absolute value of the difference in signaling entropies between a pair of tissues. Note that a gene shared by all three tissues has three differential entropy values. We selected the maximum differential entropy value of that gene for determining the significance of differential entropy.
To identify genes with significantly large differential entropies, we constructed a null distribution of differential entropies based on randomized networks. To generate the randomized network for each of the three tissues at a developmental stage, we separately shuffled the edges of the two intracellular networks while preserving the node degree distribution, node prizes, and cross-talk edges as the original integrated network. We then identified 100 PCSFs from the randomized integrated networks for each tissue and computed signaling entropies of genes in these PCSFs. To generate the null distribution of differential entropy, we performed a total of 30,000 pair-wise comparisons of signaling entropies between all PCSFs from a pair of tissues. An empirical P value of 0.1 was used as the cutoff to identify genes with significant differential entropies.
Tissue specificity and conservation scores of genes
Tissue specificity scores of genes are based on the Tau metric (65), which is defined as , where N is the number of tissues and xi is the expression of gene x in tissue i normalized by its maximal expression across all tissues. Tau values for all genes were downloaded from (39). Conservation scores of genes were calculated on the basis of the phastCons score, which is the probability that a nucleotide belongs to a conserved element based on the multiple sequence alignment (66). We downloaded phastCons scores based on multiple alignments of 30 mammalian genomes from the University of California, Santa Cruz Genome Browser. Conservation score for a gene was computed as the average phastCons score of all exonic sequences of the gene. Both tissue specificity and conservation scores of the shared pathway genes across kidney, heart, and lung tissues are listed in table S2.
Differential cross-talk score across tissues
For each ligand-receptor pair, we computed three absolute differential values of cross-talk scores between the three human tissues (kidney, heart, and lung) and used the maximum of the three values as the differential cross-talk score for the ligand-receptor pair.
Functional enrichment analysis of signaling pathways
To investigate the functions of the signaling pathway associated with a given gene, we first extracted the 10th-order neighborhood of that gene from the predicted signaling network. Then, we performed enrichment analysis of the neighborhood using g:Profiler (67) and removed redundant Gene Ontology terms using REVIGO (68). Enrichment P values were adjusted for multiple testing using the method of Benjamini-Hochberg (64).
Acknowledgments
We thank the Research Information Services at the Children’s Hospital of Philadelphia for providing computing support. Funding: This work was supported by U.S. NIH grants CA233285, CA243072, and HL156090 (to K.T.); a grant from the Leona M. and Harry B. Helmsley Charitable Trust (2008-04062 to K.T.); a grant from the Alex’s Lemonade Stand Foundation (to K.T.); National Key R&D Program of China grant 2018YFC0910400 (to L.G.); and National Natural Science Foundation of China grants 61532014 (to L.G.) and 62002277 (to Y.H.). Author contributions: Y.H. and K.T. conceived and designed the study. Y.H. and K.T. designed and Y.H. implemented the CytoTalk algorithm. T.P. and L.G. provided additional analytical tools. Y.H. and K.T. performed data analysis. K.T. supervised the overall study. Y.H. and K.T. wrote the paper. Competing interests: The authors declare that they have no competing interests. Data and materials availability: All data needed to evaluate the conclusions in the paper are present in the paper and/or the Supplementary Materials. Additional data related to this paper may be requested from the authors.
SUPPLEMENTARY MATERIALS
Supplementary material for this article is available at http://advances.sciencemag.org/cgi/content/full/7/16/eabf1356/DC1
REFERENCES AND NOTES
- 1.Skelly D. A., Squiers G. T., McLellan M. A., Bolisetty M. T., Robson P., Rosenthal N. A., Pinto A. R., Single-cell transcriptional profiling reveals cellular diversity and intercommunication in the mouse heart. Cell Rep. 22, 600–610 (2018). [DOI] [PubMed] [Google Scholar]
- 2.Kumar M. P., Du J., Lagoudas G., Jiao Y., Sawyer A., Drummond D. C., Lauffenburger D. A., Raue A., Analysis of single-cell RNA-seq identifies cell-cell communication associated with tumor characteristics. Cell Rep. 25, 1458–1468.e4 (2018). [DOI] [PMC free article] [PubMed] [Google Scholar]
- 3.Zhou J. X., Taramelli R., Pedrini E., Knijnenburg T., Huang S., Extracting intercellular signaling network of cancer tissues using ligand-receptor expression patterns from whole-tumor and single-cell transcriptomes. Sci. Rep. 7, 8815 (2017). [DOI] [PMC free article] [PubMed] [Google Scholar]
- 4.Vento-Tormo R., Efremova M., Botting R. A., Turco M. Y., Vento-Tormo M., Meyer K. B., Park J.-E., Stephenson E., Polanski K., Goncalves A., Gardner L., Holmqvist S., Henriksson J., Zou A., Sharkey A. M., Millar B., Innes B., Wood L., Wilbrey-Clark A., Payne R. P., Ivarsson M. A., Lisgo S., Filby A., Rowitch D. H., Bulmer J. N., Wright G. J., Stubbington M. J. T., Haniffa M., Moffett A., Teichmann S. A., Single-cell reconstruction of the early maternal-fetal interface in humans. Nature 563, 347–353 (2018). [DOI] [PMC free article] [PubMed] [Google Scholar]
- 5.Antebi Y. E., Nandagopal N., Elowitz M. B., An operational view of intercellular signaling pathways. Curr. Opin. Syst. Biol. 1, 16–24 (2017). [DOI] [PMC free article] [PubMed] [Google Scholar]
- 6.Billmann M., Chaudhary V., ElMaghraby M. F., Fischer B., Boutros M., Widespread rewiring of genetic networks upon cancer signaling pathway activation. Cell Syst. 6, 52–64.e4 (2018). [DOI] [PMC free article] [PubMed] [Google Scholar]
- 7.Wang S., Karikomi M., MacLean A. L., Nie Q., Cell lineage and communication network inference via optimization for single-cell transcriptomics. Nucleic Acids Res. 47, e66 (2019). [DOI] [PMC free article] [PubMed] [Google Scholar]
- 8.Browaeys R., Saelens W., Saeys Y., NicheNet: Modeling intercellular communication by linking ligands to target genes. Nat. Methods 17, 159–162 (2019). [DOI] [PubMed] [Google Scholar]
- 9.Gallo L. H., Nelson K. N., Meyer A. N., Donoghue D. J., Functions of fibroblast growth factor receptors in cancer defined by novel translocations and mutations. Cytokine Growth Factor Rev. 26, 425–449 (2015). [DOI] [PubMed] [Google Scholar]
- 10.Zhang X., Martinez D., Koledova Z., Qiao G., Streuli C. H., Lu P., FGF ligands of the postnatal mammary stroma regulate distinct aspects of epithelial morphogenesis. Development 141, 3352–3362 (2014). [DOI] [PMC free article] [PubMed] [Google Scholar]
- 11.Polyak K., Kalluri R., The role of the microenvironment in mammary gland development and cancer. Cold Spring Harb. Perspect. Biol. 2, a003244 (2010). [DOI] [PMC free article] [PubMed] [Google Scholar]
- 12.Hsu Y.-C., Li L., Fuchs E., Emerging interactions between skin stem cells and their niches. Nat. Med. 20, 847–856 (2014). [DOI] [PMC free article] [PubMed] [Google Scholar]
- 13.The Tabula Muris Consortium; Overall coordination; Logistical coordination; Organ collection and processing; Library preparation and sequencing; Computational data analysis; Cell type annotation; Writing group; Supplemental text writing group; Principal investigators , Single-cell transcriptomics of 20 mouse organs creates a Tabula Muris. Nature 562, 367–372 (2018). [DOI] [PMC free article] [PubMed] [Google Scholar]
- 14.Huminiecki L., Lloyd A. T., Wolfe K. H., Congruence of tissue expression profiles from Gene Expression Atlas, SAGEmap and TissueInfo databases. BMC Genomics 4, 31 (2003). [DOI] [PMC free article] [PubMed] [Google Scholar]
- 15.Kryuchkova-Mostacci N., Robinson-Rechavi M., A benchmark of gene expression tissue-specificity metrics. Brief. Bioinform. 18, 205–214 (2017). [DOI] [PMC free article] [PubMed] [Google Scholar]
- 16.Jassal B., Matthews L., Viteri G., Gong C., Lorente P., Fabregat A., Sidiropoulos K., Cook J., Gillespie M., Haw R., Loney F., May B., Milacic M., Rothfels K., Sevilla C., Shamovsky V., Shorser S., Varusai T., Weiser J., Wu G., Stein L., Hermjakob H., D’Eustachio P., The reactome pathway knowledgebase. Nucleic Acids Res. 48, D498–D503 (2019). [DOI] [PMC free article] [PubMed] [Google Scholar]
- 17.Bild A. H., Yao G., Chang J. T., Wang Q., Potti A., Chasse D., Joshi M.-B., Harpole D., Lancaster J. M., Berchuck A., Olson J. A. Jr., Marks J. R., Dressman H. K., West M., Nevins J. R., Oncogenic pathway signatures in human cancers as a guide to targeted therapies. Nature 439, 353–357 (2006). [DOI] [PubMed] [Google Scholar]
- 18.Tuncbag N., Braunstein A., Pagnani A., Huang S.-S. C., Chayes J., Borgs C., Zecchina R., Fraenkel E., Simultaneous reconstruction of multiple signaling pathways via the prize-collecting steiner forest problem. J. Comput. Biol. 20, 124–136 (2013). [DOI] [PMC free article] [PubMed] [Google Scholar]
- 19.A. Gupta, J. Könemann, S. Leonardi, R. Ravi, G. Schäfer, An efficient cost-sharing mechanism for the prize-collecting Steiner forest problem, in SODA ‘07 Proceedings of the Eighteenth Annual ACM-SIAM Symposium on Discrete Algorithms (SODA, 2007), pp. 1153–1162. [Google Scholar]
- 20.Tasic B., Menon V., Nguyen T. N., Kim T. K., Jarsky T., Yao Z., Levi B., Gray L. T., Sorensen S. A., Dolbeare T., Bertagnolli D., Goldy J., Shapovalova N., Parry S., Lee C., Smith K., Bernard A., Madisen L., Sunkin S. M., Hawrylycz M., Koch C., Zeng H., Adult mouse cortical cell taxonomy revealed by single cell transcriptomics. Nat. Neurosci. 19, 335–346 (2016). [DOI] [PMC free article] [PubMed] [Google Scholar]
- 21.Tepe B., Hill M. C., Pekarek B. T., Hunt P. J., Martin T. J., Martin J. F., Arenkiel B. R., Single-cell RNA-seq of mouse olfactory bulb reveals cellular heterogeneity and activity-dependent molecular census of adult-born neurons. Cell Rep. 25, 2689–2703.e3 (2018). [DOI] [PMC free article] [PubMed] [Google Scholar]
- 22.Chen A.-Q., Fang Z., Chen X.-L., Yang S., Zhou Y.-F., Mao L., Xia Y.-P., Jin H.-J., Li Y.-N., You M.-F., Wang X.-X., Lei H., He Q.-W., Hu B., Microglia-derived TNF-α mediates endothelial necroptosis aggravating blood brain–barrier disruption after ischemic stroke. Cell Death Dis. 10, 487 (2019). [DOI] [PMC free article] [PubMed] [Google Scholar]
- 23.Wälchli T., Wacker A., Frei K., Regli L., Schwab M. E., Hoerstrup S. P., Gerhardt H., Engelhardt B., Wiring the vascular network with neural cues: A CNS perspective. Neuron 87, 271–296 (2015). [DOI] [PubMed] [Google Scholar]
- 24.Abbott N. J., Rönnbäck L., Hansson E., Astrocyte–endothelial interactions at the blood–brain barrier. Nat. Rev. Neurosci. 7, 41–53 (2006). [DOI] [PubMed] [Google Scholar]
- 25.Bélanger M., Allaman I., Magistretti P. J., Brain energy metabolism: Focus on astrocyte-neuron metabolic cooperation. Cell Metab. 14, 724–738 (2011). [DOI] [PubMed] [Google Scholar]
- 26.Stogsdill J. A., Ramirez J., Liu D., Kim Y. H., Baldwin K. T., Enustun E., Ejikeme T., Ji R.-R., Eroglu C., Astrocytic neuroligins control astrocyte morphogenesis and synaptogenesis. Nature 551, 192–197 (2017). [DOI] [PMC free article] [PubMed] [Google Scholar]
- 27.Segarra M., Aburto M. R., Hefendehl J., Acker-Palmer A., Neurovascular interactions in the nervous system. Annu. Rev. Cell Dev. Biol. 35, 615–635 (2019). [DOI] [PubMed] [Google Scholar]
- 28.Pósfai B., Cserép C., Orsolits B., Dénes Á., New insights into microglia–neuron interactions: A neuron’s perspective. Neuroscience 405, 103–117 (2019). [DOI] [PubMed] [Google Scholar]
- 29.Limatola C., Ransohoff R. M., Modulating neurotoxicity through CX3CL1/CX3CR1 signaling. Front. Cell. Neurosci. 8, 229 (2014). [DOI] [PMC free article] [PubMed] [Google Scholar]
- 30.Sherchan P., Huang L., Akyol O., Reis C., Tang J., Zhang J. H., Recombinant Slit2 reduces surgical brain injury induced blood brain barrier disruption via Robo4 dependent Rac1 activation in a rodent model. Sci. Rep. 7, 746 (2017). [DOI] [PMC free article] [PubMed] [Google Scholar]
- 31.Argaw A. T., Asp L., Zhang J., Navrazhina K., Pham T., Mariani J. N., Mahase S., Dutta D. J., Seto J., Kramer E. G., Ferrara N., Sofroniew M. V., John G. R., Astrocyte-derived VEGF-A drives blood-brain barrier disruption in CNS inflammatory disease. J. Clin. Invest. 122, 2454–2468 (2012). [DOI] [PMC free article] [PubMed] [Google Scholar]
- 32.Eng C.-H. L., Lawson M., Zhu Q., Dries R., Koulena N., Takei Y., Yun J., Cronin C., Karp C., Yuan G.-C., Cai L., Transcriptome-scale super-resolved imaging in tissues by RNA seqFISH+. Nature 568, 235–239 (2019). [DOI] [PMC free article] [PubMed] [Google Scholar]
- 33.Kanehisa M., Furumichi M., Tanabe M., Sato Y., Morishima K., KEGG: New perspectives on genomes, pathways, diseases and drugs. Nucleic Acids Res. 45, D353–D361 (2017). [DOI] [PMC free article] [PubMed] [Google Scholar]
- 34.Cohen M., Giladi A., Gorki A.-D., Solodkin D. G., Zada M., Hladik A., Miklosi A., Salame T.-M., Halpern K. B., David E., Itzkovitz S., Harkany T., Knapp S., Amit I., Lung single-cell signaling interaction map reveals basophil role in macrophage imprinting. Cell 175, 1031–1044.e18 (2018). [DOI] [PubMed] [Google Scholar]
- 35.Hernandez G. E., Iruela-Arispe M. L., The many flavors of monocyte/macrophage--endothelial cell interactions. Curr. Opin. Hematol. 27, 181–189 (2020). [DOI] [PMC free article] [PubMed] [Google Scholar]
- 36.Kalucka J., Bierhansl L., Wielockx B., Carmeliet P., Eelen G., Interaction of endothelial cells with macrophages—Linking molecular and metabolic signaling. Pflügers Arch. 469, 473–483 (2017). [DOI] [PubMed] [Google Scholar]
- 37.Han X., Zhou Z., Fei L., Sun H., Wang R., Chen Y., Chen H., Wang J., Tang H., Ge W., Zhou Y., Ye F., Jiang M., Wu J., Xiao Y., Jia X., Zhang T., Ma X., Zhang Q., Bai X., Lai S., Yu C., Zhu L., Lin R., Gao Y., Wang M., Wu Y., Zhang J., Zhan R., Zhu S., Hu H., Wang C., Chen M., Huang H., Liang T., Chen J., Wang W., Zhang D., Guo G., Construction of a human cell landscape at single-cell level. Nature 581, 303–309 (2020). [DOI] [PubMed] [Google Scholar]
- 38.Teschendorff A. E., Sollich P., Kuehn R., Signalling entropy: A novel network-theoretical framework for systems analysis and interpretation of functional omic data. Methods 67, 282–293 (2014). [DOI] [PubMed] [Google Scholar]
- 39.Cardoso-Moreira M., Halbert J., Valloton D., Velten B., Chen C., Shao Y., Liechti A., Ascenção K., Rummel C., Ovchinnikova S., Mazin P. V., Xenarios I., Harshman K., Mort M., Cooper D. N., Sandi C., Soares M. J., Ferreira P. G., Afonso S., Carneiro M., Turner J. M. A., Vande Berg J. L., Fallahshahroudi A., Jensen P., Behr R., Lisgo S., Lindsay S., Khaitovich P., Huber W., Baker J., Anders S., Zhang Y. E., Kaessmann H., Gene expression across mammalian organ development. Nature 571, 505–509 (2019). [DOI] [PMC free article] [PubMed] [Google Scholar]
- 40.Winter E. E., Goodstadt L., Ponting C. P., Elevated rates of protein secretion, evolution, and disease among tissue-specific genes. Genome Res. 14, 54–61 (2004). [DOI] [PMC free article] [PubMed] [Google Scholar]
- 41.Ryaboshapkina M., Hammar M., Tissue-specific genes as an underutilized resource in drug discovery. Sci. Rep. 9, 7233 (2019). [DOI] [PMC free article] [PubMed] [Google Scholar]
- 42.Sun X., Zeng H., Kumar A., Belser J. A., Maines T. R., Tumpey T. M., Constitutively expressed IFITM3 protein in human endothelial cells poses an early infection block to human influenza viruses. J. Virol. 90, 11157–11167 (2016). [DOI] [PMC free article] [PubMed] [Google Scholar]
- 43.Bruchez A., Sha K., Johnson J., Chen L., Stefani C., McConnell H., Gaucherand L., Prins R., Matreyek K. A., Hume A. J., Mühlberger E., Schmidt E. V., Olinger G. G., Stuart L. M., Lacy-Hulbert A., MHC class II transactivator CIITA induces cell resistance to Ebola virus and SARS-like coronaviruses. Science 370, 241–247 (2020). [DOI] [PMC free article] [PubMed] [Google Scholar]
- 44.Thevarajan I., Nguyen T. H. O., Koutsakos M., Druce J., Caly L., van de Sandt C. E., Jia X., Nicholson S., Catton M., Cowie B., Tong S. Y. C., Lewin S. R., Kedzierska K., Breadth of concomitant immune responses prior to patient recovery: A case report of non-severe COVID-19. Nat. Med. 26, 453–455 (2020). [DOI] [PMC free article] [PubMed] [Google Scholar]
- 45.Zhang Y., Qin L., Zhao Y., Zhang P., Xu B., Li K., Liang L., Zhang C., Dai Y., Feng Y., Sun J., Hu Z., Xiang H., Knight J. C., Dong T., Jin R., Interferon-induced transmembrane protein 3 genetic variant rs12252-C associated with disease severity in coronavirus disease 2019. J. Infect. Dis. 222, 34–37 (2020). [DOI] [PMC free article] [PubMed] [Google Scholar]
- 46.Marx V., A dream of single-cell proteomics. Nat. Methods 16, 809–812 (2019). [DOI] [PubMed] [Google Scholar]
- 47.P. E. Meyer, Information-theoretic variable selection and network inference from microarray data, thesis, Université Libre de Bruxelles (2008). [Google Scholar]
- 48.A. A. Margolin, I. Nemenman, K. Basso, C. Wiggins, G. Stolovitzky, R. Dalla Favera, A. Califano, in BMC Bioinformatics (BioMed Central, 2006), vol. 7, pp. S7. [DOI] [PMC free article] [PubMed] [Google Scholar]
- 49.Sales G., Romualdi C., parmigene—A parallel R package for mutual information estimation and gene network reconstruction. Bioinformatics 27, 1876–1877 (2011). [DOI] [PubMed] [Google Scholar]
- 50.Doganer B. A., Yan L. K. Q., Youk H., Autocrine signaling and quorum sensing: Extreme ends of a common spectrum. Trends Cell Biol. 26, 262–271 (2016). [DOI] [PubMed] [Google Scholar]
- 51.Ramilowski J. A., Goldberg T., Harshbarger J., Kloppmann E., Lizio M., Satagopam V. P., Itoh M., Kawaji H., Carninci P., Rost B., Forrest A. R. R., A draft network of ligand–receptor-mediated multicellular signalling in human. Nat. Commun. 6, 7866 (2015). [DOI] [PMC free article] [PubMed] [Google Scholar]
- 52.Chen L., Flies D. B., Molecular mechanisms of T cell co-stimulation and co-inhibition. Nat. Rev. Immunol. 13, 227–242 (2013). [DOI] [PMC free article] [PubMed] [Google Scholar]
- 53.Baumeister S. H., Freeman G. J., Dranoff G., Sharpe A. H., Coinhibitory pathways in immunotherapy for cancer. Annu. Rev. Immunol. 34, 539–573 (2016). [DOI] [PubMed] [Google Scholar]
- 54.Schildberg F. A., Klein S. R., Freeman G. J., Sharpe A. H., Coinhibitory pathways in the B7-CD28 ligand-receptor family. Immunity 44, 955–972 (2016). [DOI] [PMC free article] [PubMed] [Google Scholar]
- 55.Anderson A. C., Joller N., Kuchroo V. K., Lag-3, Tim-3, and TIGIT: Co-inhibitory receptors with specialized functions in immune regulation. Immunity 44, 989–1004 (2016). [DOI] [PMC free article] [PubMed] [Google Scholar]
- 56.Wang J., Sanmamed M. F., Datar I., Su T. T., Ji L., Sun J., Chen L., Chen Y., Zhu G., Yin W., Zheng L., Zhou T., Badri T., Yao S., Zhu S., Boto A., Sznol M., Melero I., Vignali D. A. A., Schalper K., Chen L., Fibrinogen-like protein 1 is a major immune inhibitory ligand of LAG-3. Cell 176, 334–347.e12 (2019). [DOI] [PMC free article] [PubMed] [Google Scholar]
- 57.Bienstock D., Goemans M. X., Simchi-Levi D., Williamson D., A note on the prize collecting traveling salesman problem. Math. Program. 59, 413–420 (1993). [Google Scholar]
- 58.M. X. Goemans, D. P. Williamson, in Approximation Algorithms for NP-Hard Problems, D. S. Hochbaum, Ed. (PWS publishing company, 1997), pp. 144–191. [Google Scholar]
- 59.Pirhaji L., Milani P., Leidl M., Curran T., Avila-Pacheco J., Clish C. B., White F. M., Saghatelian A., Fraenkel E., Revealing disease-associated pathways by network integration of untargeted metabolomics. Nat. Methods 13, 770–776 (2016). [DOI] [PMC free article] [PubMed] [Google Scholar]
- 60.C. Hegde, P. Indyk, L. Schmidt, in International Conference on Machine Learning (2015), pp. 928–937. [Google Scholar]
- 61.Frankish A., Diekhans M., Ferreira A.-M., Johnson R., Jungreis I., Loveland J., Mudge J. M., Sisu C., Wright J., Armstrong J., Barnes I., Berry A., Bignell A., Sala S. C., Chrast J., Cunningham F., Domenico T. D., Donaldson S., Fiddes I. T., Girón C. G., Gonzalez J. M., Grego T., Hardy M., Hourlier T., Hunt T., Izuogu O. G., Lagarde J., Martin F. J., Martínez L., Mohanan S., Muir P., Navarro F. C. P., Parker A., Pei B., Pozo F., Ruffier M., Schmitt B. M., Stapleton E., Suner M.-M., Sycheva I., Uszczynska-Ratajczak B., Xu J., Yates A., Zerbino D., Zhang Y., Aken B., Choudhary J. S., Gerstein M., Guigó R., Hubbard T. J. P., Kellis M., Paten B., Reymond A., Tress M. L., Flicek P., GENCODE reference annotation for the human and mouse genomes. Nucleic Acids Res. 47, D766–D773 (2018). [DOI] [PMC free article] [PubMed] [Google Scholar]
- 62.Risso D., Perraudeau F., Gribkova S., Dudoit S., Vert J.-P., A general and flexible method for signal extraction from single-cell RNA-seq data. Nat. Commun. 9, 284 (2018). [DOI] [PMC free article] [PubMed] [Google Scholar]
- 63.Love M. I., Huber W., Anders S., Moderated estimation of fold change and dispersion for RNA-seq data with DESeq2. Genome Biol. 15, 550 (2014). [DOI] [PMC free article] [PubMed] [Google Scholar]
- 64.Benjamini Y., Hochberg Y., Controlling the false discovery rate: A practical and powerful approach to multiple testing. J. R. Stat. Soc. B. Methodol. 57, 289–300 (1995). [Google Scholar]
- 65.Yanai I., Benjamin H., Shmoish M., Chalifa-Caspi V., Shklar M., Ophir R., Bar-Even A., Horn-Saban S., Safran M., Domany E., Lancet D., Shmueli O., Genome-wide midrange transcription profiles reveal expression level relationships in human tissue specification. Bioinformatics 21, 650–659 (2005). [DOI] [PubMed] [Google Scholar]
- 66.Siepel A., Bejerano G., Pedersen J. S., Hinrichs A. S., Hou M., Rosenbloom K., Clawson H., Spieth J., Hillier L. W., Richards S., Weinstock G. M., Wilson R. K., Gibbs R. A., Kent W. J., Miller W., Haussler D., Evolutionarily conserved elements in vertebrate, insect, worm, and yeast genomes. Genome Res. 15, 1034–1050 (2005). [DOI] [PMC free article] [PubMed] [Google Scholar]
- 67.Raudvere U., Kolberg L., Kuzmin I., Arak T., Adler P., Peterson H., Vilo J., g: Profiler: A web server for functional enrichment analysis and conversions of gene lists (2019 update). Nucleic Acids Res. 47, W191–W198 (2019). [DOI] [PMC free article] [PubMed] [Google Scholar]
- 68.Supek F., Bošnjak M., Škunca N., Šmuc T., REVIGO summarizes and visualizes long lists of gene ontology terms. PLOS ONE 6, e21800 (2011). [DOI] [PMC free article] [PubMed] [Google Scholar]
Associated Data
This section collects any data citations, data availability statements, or supplementary materials included in this article.
Supplementary Materials
Supplementary material for this article is available at http://advances.sciencemag.org/cgi/content/full/7/16/eabf1356/DC1