

Abstract
Contrast enhanced magnetic resonance imaging (MRI) is an indispensable tool for diagnostic medicine. However, safety concerns related to gadolinium in commercial MRI contrast agents have emerged in recent years. For patients suffering from severe renal impairment, there is an important unmet medical need to perform contrast enhanced MRI without gadolinium. There are also concerns over the long-term effects of retained gadolinium within the general patient population. Demand for gadolinium-free MRI contrast agents is driving a new wave of inorganic chemistry innovation as researchers explore paramagnetic transition metal complexes as potential alternatives. Furthermore, advances in personalized care making use of molecular level information have motivated inorganic chemists to develop MRI contrast agents that can detect pathologic changes at the molecular level. Recent studies have highlighted how reaction-based modulation of transition metal paramagnetism offers a highly effective mechanism to achieve MRI contrast enhancement that is specific to biochemical processes. This Viewpoint article highlights how recent advances in transition metal chemistry are leading the way for a new generation of MRI contrast agents.
Introduction.
Magnetic resonance imaging (MRI) plays a critical role in modern radiology, enabling high resolution visualization of soft tissue and vascular structures without exposing patients to ionizing radiation. Image contrast in MRI depends on the concentration and the relaxation times (T1, T2, T2*) of magnetically resonant protons, comprised predominantly of water and fat. Endogenous contrast is not always sufficient to visualize abnormalities but this can be overcome by administration of a paramagnetic MRI contrast agent, which shortens the relaxation times of nearby water protons and renders pathologic tissue highly conspicuous.1 Contrast agents can add tremendous value to an MRI scan and are now heavily relied upon for detection of abnormalities in the brain and body,2–3 diagnosis and staging of malignancies,4–5 to inform therapeutic interventions,6 and to monitor patient response to treatment.7 Tens of millions of contrast enhanced MRI scans are performed each year worldwide.1
All products currently marketed for MRI contrast comprise aqueous parenteral formulations of low-molecular weight Gd3+ chelates called gadolinium-based contrast agents (GBCAs).8 Nine GBCAs are approved for use by the US Food and Drug Administration (FDA), and six GBCAs are authorized for marketing within the European Union, Figure 1.9 The first GBCA received FDA approval for the detection of blood-brain barrier (BBB) disruptions in 1988, and with the exception of a few agents developed for liver imaging and angiography, the majority of the contrast agents introduced since then were designed as essentially interchangeable products.
Figure 1.

MRI contrast agents that have been approved for use in humans. (A) Acyclic extracellular fluid GBCAs have an FDA contraindication by for use in patients with severe renal insufficiency or acute kidney injury and are no longer marketed in Europe due to toxicity concerns related to retained Gd. Gd-DTPA and Gd-DTPA-BMEA were recently withdrawn from the US market by their manufacturers. (B) Acyclic GBCAs used in liver imaging. Use in the European Union is restricted to liver scans. (C) Macrocyclic GBCAs are considered to be safer with respect to Gd release than acyclic GBCAs. (D) MS-325 and Mn-DPDP are approved for angiography and liver imaging, respectively, but are no longer marketed.
Gd3+ and Eu2+ are the most potent ions for generating T1-relaxation (positive MRI contrast), but it is challenging to stabilize Eu2+ outside of a rigorously anaerobic environment.10–11 Gd3+ chelates were a logical first choice for clinical MRI contrast agents. It is possible to develop potent relaxation agents using other metal ions,12 but substantially less research and development has been dedicated to contrast agents not containing Gd. GBCAs have a very low incidence of adverse drug reactions8 and there was little motivation for chemists to develop alternatives to GBCAs. However, various concerns related to Gd retention and late toxicity have emerged over the last 14 years prompting regulatory actions and concerns amongst physicians and patients.13–16 These safety concerns, which are described in more depth below, have stimulated new research into Gd-free contrast agents.
There is also a growing interest in developing MRI contrast agents for molecular imaging to detect and quantify metabolic or biochemical changes associated with disease. Molecular imaging can aid in early detection,17–18 differential diagnosis,18–20 therapeutic planning,21 and monitoring of treatment response22 based on non-invasively obtained biochemical information. Clinical molecular imaging is performed with nuclear medicine modalities like single photon emission computed tomography (SPECT) and positron emission tomography (PET), which require infrastructure to synthesize and purify compounds containing short lived isotopes, expose patients to ionizing radiation, and offer poor spatial resolution for disease mapping compared to MRI.1, 23–24 No MRI contrasts agents are available for clinical molecular imaging but recent works have demonstrated the tremendous power of transition metal redox and spin crossover as mechanisms for biochemically responsive MR signal modulation.
Here we review some exciting developments in transition metal-based MRI contrast agents in the separate contexts of gadolinium-free MRI and molecular MR imaging. We will provide background on the motivations to pursue this research, outline design criteria for an effective GBCA replacement or biochemically responsive agent, and highlight innovative inorganic chemistry related to these efforts. The scope of this article is limited to low-molecular weight transition metal complexes that generate MRI contrast via T1-relaxation, magnetic saturation transfer, or chemical shift. The theory underlying MRI contrast mechanisms is discussed only insofar as required to contextualize the inorganic chemistry discussed in this article. Readers are referred to excellent existing review articles for information regarding clinical MRI,25 in depth discussions of theory related to MR contrast mechanisms,1, 26–28 lanthanide-based contrast agents,29–30 or macromolecular and nanoparticle-based contrast agents.31–33
Transition metal complexes as alternatives to GBCAs.
Background.
In 2006, GBCA exposure was directly linked to a devasting fibrosing condition termed nephrogenic systemic fibrosis (NSF) that can occur in patients suffering renal impairment.14, 34 In 2007, the US Food and Drug Administration (FDA) responded by applying a boxed warning to all GBCAs and assigning a contraindication for the use of three GBCAs (Gd-DTPA, Gd-DTPA-BMA, and Gd-DTPA-BMEA, see Fig 1) for use in patients suffering from severe renal insufficiency or acute kidney injury.35 The mechanistic link between Gd and NSF remains unknown and underexplored, but a 2009 FDA data-mining analysis indicated that the frequency of NSF incidence associated with different GBCAs is correlated inversely to the kinetic inertness of the chelate.35 The vast majority of NSF cases are associated with acyclic GBCAs derived from a diethylenetriamine backbone, Fig 1A. Few unconfounded NSF cases have been documented for macrocyclic GBCAs derived from a cyclen backbone, which are substantially more inert to Gd dechelation, Fig 1C, although the majority of MRI exams to that point in time were performed with acyclic GBCAs.36
New cases of NSF are now extremely rare due to updated physician guidelines and careful screening of patients with impaired renal function. However, it is important to note that there are currently no clinically available alternatives to GBCAs. Iodinated X-ray contrast agents for computed tomography are the most similar available contrast media, but these agents are associated with nephrotoxicity in patients suffering renal insufficiency.37–38 An estimated 16% of US adults suffer from moderate to advanced chronic kidney disease,39–40 and this patient population is disproportionately afflicted by comorbidities like cancer and peripheral artery disease that are often diagnosed and managed with the aid of medical imaging.
Concerns over GBCA safety were reignited in 2013 following a report that identified endogenously hyperintense signal in the dentate nucleus and globus pallidus of patients receiving prior contrast enhanced scans.41 Elemental analysis of neurologic tissue collected upon autopsy of patients receiving GBCAs confirmed that Gd retention was indeed the cause of the signal hyperintensity.15 Gd accumulation in brain tissue is long-term and cumulative with repeat dosing.42 Gd brain deposition has been observed following exposure to both acyclic and macrocyclic GBCAs, but the acyclic agents are associated with a higher degree of Gd retention.43 As a result of these findings, the European Medicines Agency (EMA) recommended suspending the marketing authorization of three GBCAs in 2017 and restricted the use of two others for liver imaging only, Figs 1A–B.9 Other regulatory bodies such as FDA, Pharmaceuticals and Medical Devices Agency (PMDA, Japan) and Therapeutic Goods Administration (TGA, Australia) did not restrict any GBCAs, but issued revised precautions and warnings.44–46 Recently, two acyclic GBCAs were voluntarily withdrawn from the US market by their manufacturers. It is important to note that there is no confirmed toxicity associated with Gd retention in neurologic tissues.
Recent reports of NSF-like symptoms and clouded mentation arising after GBCA exposure in patients with normal renal function have been broadly characterized as gadolinium deposition disease (GDD).47–48 GDD is controversial and not widely accepted in the medical community. Symptoms are typically self-reported by patients.48 However, NSF-like symptoms are clinically documented and it has been observed that Gd can be found in the urine of these patients long after their last scan. Moreover the Gd urine content can be increased when these patients are provoked with DTPA, including patients who had received the more inert macrocyclic GBCAs.49
Requirements for an effective GBCA alternative.
GBCAs are highly versatile and add tremendous diagnostic value to an MRI scan. Upon intravenous injection, GBCAs rapidly distribute through the blood pool and extracellular spaces, and are then rapidly eliminated by renal filtration. Angiographic images to diagnose vascular abnormalities can be acquired in the seconds after injection when the GBCA makes its first pass through the arteries.50 Dynamic phase images acquired during the arterial and venous phases can also be useful for characterizing tumor vasculature.51 Hyperpermeable lesions remain conspicuously hyperintense in the minutes after injection, after blood pool enhancement has diminished substantially. Dynamic imaging of GBCA uptake and washout from hyperpermeable lesions can be useful for assessing risk for malignancy in diseases like breast cancer.52
A GBCA alternative must provide comparable or improved diagnostic efficacy at a safe dose. A number of considerations must be taken into account when designing a GBCA alternative. Detection sensitivity should be optimized to afford the highest possible contrast enhancement at the lowest possible dose. Pharmacokinetics must also be considered. Current contrast enhanced MRI imaging protocols and workflows are designed for contrast agents that distribute rapidly through the blood pool and extracellular spaces and rapidly washout out from blood and normal tissue. A hyperpermeable lesion is detected minutes after GBCA injection, but may require hours or even longer for detection with a macromolecule or nanoparticle-based agent. In this regard, low-molecular weight, hydrophilic chelates represent the most obvious choice for GBCA alternatives. Metal ion related toxicity is a major safety concern for metal-based contrast agents. Different metal ions are tolerated up to different thresholds, exhibit varying degrees of bioavailability, and different modes of toxicity. There are unfortunately no defined criteria for thermodynamic stability or kinetic inertness that equate to safety. As a rule of thumb, new metal-ion based contrast agents should be designed to be as thermodynamically stable and kinetically inert as reasonably possible. The intact complex itself must also be non-toxic. The contrast agent should be highly soluble in water. GBCAs are formulated at 0.5M or greater, and typically administered intravenously to adult patients at volumes of 10 – 20 mL. New contrast agents need not necessarily be formulated or dosed identically, but the agent should be soluble enough that a diagnostically effective dose can be administered at a reasonable volume. Solutions of the contrast agent must not be too viscous to facilitate intravenous administration.
Transition metal complexes as T1-relaxation agents.
T1-relaxation mechanism.
The signal-generating efficacy of a T1-relaxation agents is measured by relaxivity (r1), Eq 1,
| Eq 1. |
which describes the paramagnetically induced T1 shortening normalized to the concentration of the contrast agent. A contrast agent interacts with water in few different ways and each interaction contributes to r1. Overall r1 receives contributions from water molecules directly coordinated to the paramagnetic metal, if present, (r1IS, IS = inner sphere), from second sphere water molecules that associate with the metal complex via hydrogen bonding interactions (r1SS), as well as from outer sphere water molecules that diffuse in and out of proximity with the metal complex (r1OS). For GBCAs, r1 receives roughly equal contributions from r1IS and r1OS,53 contributions from r1SS are typically small but can be increased substantially by the presence of negatively charged donor groups such as phosphonates or by introducing pendant anionic functional groups. 54–55 For a given metal ion, a chemist can rationally control r1IS through fine tuning the chemical structure, whereas r1SS and r1OS are more challenging to control. The magnitude of r1IS depends on the number (q), relaxation time (T1m) and mean residency time (τm) of water molecules bound to the metal ion, Eq 2, Fig 2.
Figure 2.

Mechanisms contributing to r1. Like the generic ternary complex depicted above, most transition metal-based relaxation agents are comprised of polydentate ligands build from polyamine backbones. Common pendant donor groups (D) include carboxylates, pyridines, phenolates, phosphonates.
| Eq 2. |
Accurate determination of q and τm are important to characterizing and devising strategies to optimize new T1-relaxation agents. Solutions spectroscopic techniques to determine q are well established for Gd complexes, but are comparatively underdeveloped for paramagnetic transition metal complexes. Once q is known τm can be ready determined by measuring the temperature dependence of paramagnetically induced T2 relaxation of bulk water 17O and fitting the data with the Swift-Connick equations describing two-site exchange.56 Two experimental methods have been recently proposed to determine q for Mn2+ complexes. One study demonstrated how the temperature dependence of the Mn2+ induced line-broadening of the bulk water 17O NMR resonance encodes for q.57 It was shown that at the temperature position where line-broadening is greatest, q is directly proportional to the full-width at half-max (FWHM). In another study, a semi-empirical expression to estimate q from r1 recorded at Larmor frequency 1 MHz was proposed after careful analysis of previously reported nuclear magnetic relaxometric dispersion (NMRD) data of 49 Mn2+ complexes.58
At magnetic field strengths ≥0.2T (~10 MHz), which are typical for the vast majority clinical and pre-clinical MRI applications, T1m is governed by a dipolar mechanism which is described by the general Solomon-Bloembergen-Morgan (SBM) Theory, Eq 3
| Eq. 3 |
where γΗ and ωH are the proton gyromagnetic ratio and Larmor frequency, ge is the Landé g-factor for a free electron, and µB is the Bohr Magneton. A chemist can optimize T1m by introducing a metal ion of difference spin quantum number (S), altering the distance between the paramagnetic ion and water 1H (rMH), or by altering the correlation time (time required for 1 radian rotation perpendicular to the applied field) for magnetic field fluctuations experienced by the water 1Hs (τC).
The parameter τC receives contributions from three dynamic processes, Eq 4,
| Eq. 4 |
τm, the rotational correlation time (τR), and the longitudinal electron spin relation time (T1e), which refers to the time constant for electronic spin states to return to their equilibrium populations after ligand field perturbations. τC is controlled by whichever dynamic process occurs on the fastest time scale. For low molecular weight metal complexes, τR occurs on the ps time scale. τm can range from ps to seconds, depending on the metal ion and ligand environment. T1e is on the ns time scale for systems with electronically isolated electronic ground states such as ions with S-state free ion ground term configurations like Gd3+ or Mn2+, or strongly Jahn-Teller distorted ions like in many Cu2+ systems). For systems with excited state configurations that are easily accessed via spin-orbit coupling interactions, T1e occurs typically on the ps time scale. For most GBCAs and Mn2+ complexes, τm and T1e occur on the ns time scale, so .59
The T1m mechanism is most efficient when 1/τC and ωH are closely matched. At MRI Larmor frequencies ranging 20–80 MHz, r1 of Gd3+ and Mn2+ complexes can be increased by incorporation into higher molecular weight, more slowly rotating structures, effectively slowing τC from the ps to ns regime. For example, r1 of the albumin binding complex Mn-LCyPh2 increases from 5.8 mM−1s−1 in water to 46 mM−1s−1 in 660 µM HSA solution at 0.47 T (νH = 20 MHz). At 1.4T (νH = 60 MHz), r1 increases from 5.3 mM−1s−1 to 46 mM−1s-1. As the MRI Larmor frequency increases beyond 80 MHz, the r1 of macromolecule associated Gd3+ or Mn2+ complexes drops precipitously. Note in Table 1 how the r1 increase achieved by albumin binding of Mn-LCyPh2 is substantially lower at νH ≥ 128 MHz than at νH ≤ 60 MHz. The combined influence of τR and 1H Larmor frequency on r1IS are depicted in Figure 3. Because the S(S+1)/rMH6 component of Equation 3 yields nearly identical values for Mn2+ and Gd3+, analogous results are obtained if the same simulation is applied to a Gd3+ complex There is evidence that r1 for complexes of Mn3+ and Fe3+ can also be substantially increased by slowing τR. Mn3+ and Fe3+ complexes are expected to exhibit shorter T1e values than complexes of Gd3+ and Mn2+, and as a result the influence of changing τR may exhibit a different field dependency. To date, the mechanisms underpinning r1 for Mn3+ and Fe3+ complexes have been less extensively studied.
Table 1.
Binding affinity for human serum albumin (HSA) and r1 in water, blood plasma, or 660 µM HSA solution for selected Mn2+ complexes at different field strengths. Protein binding provides a large r1 increase for Mn2+ complexes at 0.47T and 1.5T, but the effect is much more modest at higher field strengths.
| HSA binding affinity |
r1 in water/ r1 in blood plasmab or 660 µM HSAc (mM−1s−1), 37 °C, |
|||||
|---|---|---|---|---|---|---|
| Kd (mM) | % bindinga | 0.47T (20 MHz) | 1.4T (60 MHz) | 3.0T (128 MHz) | 4.7T (200 MHz) | |
| Mn-EDTA-BOM | 0.67231 | 48% | 3.6d231 / 28c,d,e,231 | N/D | N/D | N/D |
| Mn-EDTA-BOM2 | 0.053231 | 92% | 4.3d231 / 41c,d,e,231 | N/D | N/D | N/D |
| Mn-LCyPh2 | 0.011232 | 98% | 5.8232 / 46b,232 | 5.3 / 27c,60 | N/D | 4.5 / 5.6c,60 |
| Mn-PyC3A-3-OBn | 0.49 | 55% | N/D | 2.6 / 9.9 | N/D | N/D |
| Mn-C12OPAADA | 0.018233 | 97% | 5.3d,233 / 30c,d,e,233 | N/D | N/D | N/D |
| Mn-DPAC12A | 0.0077233 | 99% | 8.5d,233 / 15.5c,d,e,233 | N/D | N/D | N/D |
| Mn-DPAC6PhA | 0.14234 | 80% | 4.1d,234 / 37c,d,e,234 | N/D | N/D | N/D |
| Mn-mX(DPAMA)2 | 0.89235 | 41% | 6.1b,235 / 20b,e,235 | N/D | N/D | N/D |
| Mn-1,4-DO2AM | 0.8277 | 43% | 2.5d,77 / 3.8c,d,e,77 | N/D | N/D | N/D |
| Mn-1,4-DO2AMBz | 0.5177 | 54% | 3.5d,77 / 16c,d,e,77 | N/D | N/D | N/D |
| Mn-1,4-BzDO2AM | 0.2677 | 70% | 3.8d,77 / 14c,d,e,77 | N/D | N/D | N/D |
Percentage protein binding under conditions of 0.1 mM contrast agent, 0.66 mM HSA
recorded in bovine blood plasma
recorded under conditions of 0.1 mM contrast agent, 0.66 mM HSA
recorded at 25 °C
r1 estimated from weighted average of r1 for independently reported free and bound complex under protein binding conditions.
Figure 3.

Simulated r1IS as for a q=1 Mn2+ complex of τm = 10 ns as a function of τR and 1H Larmor frequency according to Equations 2–4.
For low molecular weight Gd3+ or Mn2+ systems where τR occurs on the ps time scale r1 is relatively insensitive to changes in τm unless the complex exhibits rare behavior in which τm accelerates into the ps regime where it is fast enough to influence τC or slows to the µs regime where water exchange may be slow with respect to T1m. For complexes where τR is rotationally optimized, r1 can be very sensitive to τm. Figures 4A and 4B depict the influence of τm on r1IS at 0.47T, 1.5T, and 4.7T for a Mn2+ complex where τR = 80 ns and for one where τR has been slowed so that 1/τR = ωH. As in Figure 3, the simulations yield almost identical r1IS values for complexes of Gd3+. The precise τm required for to achieve the greatest r1 will vary as a function of both τR and 1H Larmor frequency, and the reader is referred to more in depth reviews on this topic.60–61 The impact of changing τm for relaxation agents of other paramagnetic ions is less well studied.
Figure 4.

Simulated r1IS as a function of τm for q = 1 Mn2+ complex of (Α) τR = 80 ns and (Β) τR = 1/ωH at 0.47 T, 1.5T, and 4.7T.
Increasing τR can increase the r1 of GBCAs, but on the other hand increasing τR through protein binding or incorporating the GBCA into a macromolecule can also alter pharmacokinetics of the contrast agent in ways that render the agent less useful in the context of clinical imaging protocols, as described above. Low-molecular weight chelates have been favored for clinical development, despite their lower r1.
Mn-based relaxation agents.
High spin Mn2+ complexes can behave as potent relaxation agents. Like Gd3+, high-spin Mn2+ has a symmetrically half-filled valence subshell and is capable of forming ternary complexes with poly/amino-carboxylate chelators and labile water co-ligand(s). There is a precedence for the use of Mn2+ in contrast enhanced MRI in humans. The chelate Mn-DPDP has US FDA and EMA approvals for detection of liver tumors,62 although it is no longer marketed. Mn-DPDP is a labile complex that dissociates Mn2+ upon injection into the bloodstream, and the dissociated Mn2+ transiently accumulates in hepatocytes enabling identification of liver metastases as hypointense abnormalities.63–65 Free dissociated Mn2+ enters cells via pathways of Ca2+ flux, and thus exhibits a high degree of uptake by excitable cells like cardiomyocytes and insulin releasing pancreatic β cells.66–67 A formulation comprised of free Mn2+ and Ca2+ gluconate was developed for cardiac imaging and was evaluated in a Phase II clinical trial (NCT00881075).68 The free Mn2+ transiently accumulates within viable cardiomyocytes via voltage-gated Ca2+ channel uptake.69–70 Free Mn2+ antagonizes voltage-gated Ca2+ uptake, but the toxicity is offset by co-administration of Ca2+. The Mn2+:Ca2+ ratio is tuned so that Mn2+ uptake is diagnostically useful but not cardio-depressive. A liposomal oral formulation containing MnCl2 has an FDA approval for bowel imaging but is no longer marketed. An oral formulation of MnCl2 with D-alanine and vitamin D3 to stimulate enterohepatic circulation is currently being evaluated in Phase III trials for detection of focal lesions in liver tissue (NCT04119843). A formulation comprising paramagnetic Mn(II) containing monodisperse nanoparticles with average hydrodynamic radius 5–6 nm71–72 is currently being evaluated in a Phase I clinical trial to assess safety, tolerability, and pharmacokinetics in breast cancer patients (NCT04080024).
There is a proven diagnostically utility and track record of safe clinical use for Mn-based contrast agents. However, previously used Mn2+-based agents cannot substitute for GBCAs, which are administered as bolus injections, confine to extracellular spaces, and are rapidly eliminated. A suitable Mn-based alternative should have pharmacokinetics that are analogous to GBCAs, be thermodynamically stable and kinetically inert enough to be administered as a bolus injection without inducing any cardiovascular toxicity, and have r1 comparable to or higher than GBCAs.
A number of Mn2+ chelates have been evaluated in the context of GBCA alternatives. A comprehensive review of this expanding body of work extends beyond the scope of this Viewpoint article, but notable examples are shown in Fig 5 and their r1 values are compared in Table 2. Thermodynamic stability constants and Mn2+ dissociation kinetics under different sets of reaction conditions compared in Tables 3 and 4.
Figure 5.

Representative examples of Mn2+ complexes considered as T1 relaxation agents
Table 2.
Comparison of physicochemical properties of representative transition metal-based T1-relaxation agents discussed as GBCA alternatives.
| MW | q | r1 in water or buffer, 37 °C (mM−1s−1) | r1 in blood plasma, 37 °C (mM−1s−1) | |
|---|---|---|---|---|
| GBCAs | ||||
| Gd-DTPA | 546 | 1 | 3.3a,87 3.1b87 | 4.1a,j,87 3.7b,j,87 |
| Gd-DTPA-BMA | 574 | 1 | 3.3a,87 3.2b,87 | 4.3a,j,87 4.0b,j,87 |
| GD-DTPA-BMEA | 662 | 1 | 3.8a, 87 3.6 b, 87 | 4.7a,j,87 4.5b,j,87 |
| Gd-BOPTA | 666 | 1 | 4.0a, 87 4.0 b, 87 | 6.3a,j, 87 5.5 b,j, 87 |
| Gd-EOB-DTPA | 680 | 1 | 4.7a, 87 4.3 b, 87 | 6.9 a,j, 87 6.2 b,j, 87 |
| MS-325 | 904 | 1 | 5.2a, 87 5.3 b, 87 | 19 a,j, 87 9.9 b,j, 87 |
| Gd-DOTA | 558 | 1 | 2.9a, 87 2.8 b, 87 | 3.6 a,j, 87 3.5 b,j, 87 |
| Gd-HP-DO3A | 559 | 1 | 2.9a, 87 2.8 b, 87 | 4.1a,j, 873.7 b,j, 87 |
| Gd-DO3A-butrol | 605 | 1 | 3.3a,87 3.2 b,87 | 5.2a,j,87 5.0 b,j87 |
| Mn2+ complexes | ||||
| Mn-EDTA | 343 | 1 | 2.2c,231 | |
| Mn-EDTA-BOM | 481 | 1 | 3.6d,231 | 28d,k,l,231 |
| Mn-EDTA-BOM2 | 601 | 1 | 4.3d,231 | 41d,k,l,231 |
| Mn-EDTA-Tyr-OH | 449 | 1 | 3.2c,236 | |
| Mn-BTA-EDTA | 596 | 1 | 3.5e,91 | 15.1e,m,91 |
| Mn-EOB-EDTA | 506 | 1 | 2.3e,90 | 6.3 e,m,90 |
| Mn-LCyPh2 | 686 | 157 | 5.8f,232 | 46f,n,232 |
| Mn-CyDTA | 397 | 1 | 2.1c,79 | |
| Mn-PyC3A | 433 | 1 | 2.1c,79 | 3.5c,k,86 3.4b,k,88 , 3.8c,j,79 |
| Mn-PyC3A-3-OBn | 537 | 1 | 2.6c,86 | 9.0c,k,86 |
| Mn-DPAAA | 397 | 1 | 2.7f,234 | |
| Mn-PAADA | 320 | 2 | 3.3f,234 | |
| Mn-DPAMA | 354 | 2 | 4.2f,237 | 9.6d,k,l,237 |
| Mn-12-PyN4A | 317 | 1 | 1.9f,83 | |
| Mn-12-PyN4P | 352 | 1 | 22.3f,83 | |
| Mn-15-PyN5 | 306 | 2 | 3.6f,84 | |
| Mn-15-PyN3O2 | 304 | 2 | 3.1f,84 | |
| Mn-PC2A-EA | 361 | 0<q<1 | 2.5d,78 | |
| Mn-1,4-DO2A | 341 | 1 | 1.7 f,238 | |
| Mn-1,7-DO2A | 341 | 0<q<1 | 1.3 f, 238 | |
| Mn-1,4-DO2AM | 241 | 1 | 2.0 f,77 | 9.6d,k,l,77 |
| Mn-MeNO2A | 328 | 1 | 2.2f,239 | |
| Mn3+ complexes | ||||
| MnTPPS4 | 984 | 2 | 12e,211 | |
| Mn-TCP | 839 | 2 | 7.9b,98 | |
| Mn-PDA-1 | 399 | 2 | 4.1g,104 | |
| Mn-PDA-2 | 499 | 2 | 5.4g,104 | |
| Mn-PDA-3 | 435 | 2 | 5.1g,104 | |
| Mn-P2 | 1808 | 2 | 28.2b,98,14.1/Mn | 32.4b,o,99, 16.2/Mn |
| Fe3+ complexes | ||||
| Fe-CyDTA | 398 | 1 | 2.0h,117 | 2.2 h,p,117 |
| Fe-L1 | 390 | ND | 2.2i,111 | 2.5i,m,111 3.8 i,q,111 |
| Fe-L2 | 471 | ND | 0.81i,111 | 1.1i,m,111 |
| Fe-L3 | 433 | ND | 1.7 i,111 | 2.2, I,m,111 1.8 I,q,111 |
| Fe-L4 | 514 | ND | 0.42 i,111 | 0.96 I,m,111 |
1.5T
3.0T
1.4T
0.47T and 25 °C
1.5T and 25 °C
0.47T
7.0T, 22 °C.
0.94T, 37 °C. RT
4.7T
bovine blood plasma
human serum albumin
estimated r1 for 0.1 mmol complex in 0.66 mM HSA based of r1 values reported for free and HSA-bound complex
0.67 mM human serum albumin
human blood plasma
0.75 mM HSA
fetal calf serum
human blood serum
rabbit blood plasma.
Table 3.
Thermodynamic stability constants for GBCAs and Mn2+ and Fe3+ complexes considered as T1-relaxation agents.
| logKa,b | logKcond pH 7.4 | |
|---|---|---|
| Gd-DTPA1 | 22.5 | 18.4 |
| Gd-DTPA-BMA1 | 16.9 | 14.8 |
| GD-DTPA-BMEA1 | 16.6 | 15.0 |
| Gd-BOPTA1 | 22.6 | 18.4 |
| Gd-EOB-DTPA1 | 23.5 | 18.7 |
| MS-3251 | 22.1 | 18.9 |
| Gd-DOTA1 | 24.7 | 17.2 |
| Gd-HP-DO3A1 | 23.8 | 17.1 |
| Gd-DO3A-butrol1 | 21.8 | 14.7 |
| Mn-EDTA | 12.6,213 13.9231 | 10.7,213 11.0231 |
| Mn-EDTA-BOM231 | 13.5 | 10.6 |
| Mn-EDTA-BOM2231 | 13.9 | 11.0 |
| Mn-CyDTA213 | 14.3 | 12.3 |
| Mn-PyC3A79 | 13.9 | 11.3 |
| Mn-DPAAA234 | 13.19 | 13.0 |
| Mn-PAADA233 | 9.59 | 8.8 |
| Mn-DPAMA237 | 10.13 | 10.1 |
| Mn-PMPA240 | 14.3 | 11.1 |
| Mn-12-PyN4A83 | 11.5 | 7.1 |
| Mn-12-PyN4P83 | 14.1 | 7.4 |
| Mn-15-PyN584 | 10.9 | 7.7 |
| Mn-15-PyN3O284 | 7.2 | 5.2 |
| Mn-PC2A-EA78 | 19.0 | 12.7 |
| Mn-1,4-DO2A241 | 16.1 | 10.1 |
| Mn-1,7-DO2A241 | 14.5 | 8.2 |
| Mn-1,4-DO2AM77 | 12.64 | 8.9 |
| Fe-CyDTA | 30.1 | 28.0 |
| Fe-PyC3A110 | N/D | 23.2 |
| Fe-EHPG212 | >30 | N/D |
K = [metal-ligand complex]/[metal][ligand].
logK may vary depending on measurement conditions (typically within logK +/− 1).
Table 4.
Kinetic inertness data for GBCAs and Mn2+ complexes recorded under different experimental conditions. Dissociation Challenge 1: 2.5 mM contrast agent is incubated with 2.5 mM Zn2+ in 50 mM pH 7.0 phosphate buffer at 37 °C, and kinetic inertness is compared by measuring the time required to achieve 20% release of the paramagnetic ion (t20%). Dissociation Challenge 2: 1 mM contrast agent, 25 mM Zn2+, pH 6.0 MES buffer. Dissociation Challenge 3. [contrast agents] = [Zn2+ or Cu2+] = 0.01 mM, pH 7.4,. Dissociation Challenge 4. [contrast agents] = [Zn2+ or Cu2+] = 1.0 mM.
| t20% Zn2+ challenge 1 (h) | t1/2 Zn2+ challenge 2 (h) | t1/2 Zn2+ challenge 3 (h) | t1/2 Zn2+ challenge 4 (h) | |
|---|---|---|---|---|
| Gd-DTPA | 4.4,242 2.879 | 0.01379 | 330 a, 85 | 3.5 a, 85 |
| Gd-DTPA-BMA | 1.0242 | |||
| Gd-BOPTA | 10242 | |||
| Gd-EOB-DTPA | 25242 | |||
| MS-325 | 60242 | |||
| Gd-DOTA | >83242 | 3.8×10⁵ a, 76 | 3.8×10⁵ a, 76 | |
| Gd-HP-DO3A | >80242 | |||
| Gd-DO3A-butrol | >80242 | |||
| Mn-EDTA | .076a, 114 | 4.3*10−3a, 114 | ||
| Mn-CyDTA | 0.1879 | 12a, 114 | 12a, 114 | |
| Mn-PhCDTA | 19a, 243 | 0.86a, 243 | ||
| Mn-PyC3A | 1.879 | 0.2979 | ||
| Mn-12-PyN4A | 2.6a, 83 | 2.6a, 83 | ||
| Mn-15-PyN5 | 11a, 84 | 11a, 84 | ||
| Mn-PC2A-EA | 5478 | 8100a, 78 | 8100a, 78 | |
| Mn-1,4-DO2A | 49a, 77 | 49a, 77 | ||
| Mn-1,7-DO2A | 58a, 77 | 58a, 77 | ||
| Mn-1,4-DO2AM | 560a, 77 | 560a, 77 |
Denotes t1/2 estimated from empirical rate law data.
Mn2+ complexes with rapidly exchanging water co-ligand(s) can achieve r1 comparable to GBCAs. The smaller S relative to Gd is compensated for by the reduced rMH (estimated 2.8Å and 3.1Å for Mn2+ and Gd3+, respectively). Based on the S(S+1)/rMH6 component of Eq 3, Mn2+ generates r1IS as effectively as Gd3+ for an equivalent τR value. When comparing r1 of Mn2+ and Gd3+ complexes in Table 1, the values largely reflect differences in molecular weight. Note the comparable relaxivities of Mn2+ and Gd3+ chelates of similar molecular weight when recorded under identical conditions (Mn-PyC3A-3-OBn and Gd-DOTA, for example). Like Gd3+, the r1 of most Mn2+ complexes can be increased by slowing τR and Mn2+ agents capable of protein binding exhibit elevated r1 in blood plasma. In this regard, a number of Mn2+ complexes conjugated to albumin-targeting moieties have been synthesized as high-r1 contrast agents. Examples of Mn2+ complexes with exceptionally high affinity for HSA include Mn-EDTA-BOM2, Mn-LCyPh2, Mn-C12OPAADA, Mn-DPAC12A, Mn-DPAC6PHA, and Mn-mX(DPAMA)2, Figure 5; r1 values valued in Table 1.
We are unaware of any studies to aimed at improving r1 through τm optimization, but recent work has demonstrated how τm can be controlled by systematic modifications to ligands that support high r1 and kinetically inert Mn2+ complexes. For example, water exchange at Mn2+-NO2A-type complexes like Mn2+-MeNO2A and Mn2+-MeBzNO2A (Figure 5) occurs by an associative mechanism and the process is slowed by modifications that introduce bulky substituents that hinder access of water molecules approaching the Mn2+ water binding site.73 The effect is illustrated by comparing the τm for Mn2+-MeNO2A (1.6 ns at 25 °C) and Mn2+-MeBzNO2A (38 ns at 25 °C). Water exchange of 7-coordinate ternary complexes comprising acyclic EDTA-like ligands is believed to occur by a dissociative mechanism which can be slowed by increasing ligand rigidity, which raises the activation energy required to achieve the 6-coordinate water dissociated transition state. For example, τm for Mn2+-EDTA and Mn2+-CyDTA are 2.4 ns and 7.1 ns, respectively.74–75
Mn2+ complexes with a vacant coordination site for water co-ligand binding are inherently less thermodynamically stable than GBCAs. The reduced stability of Mn2+ complexes is partially a function of the reduced charge-to-radius ratio compared to Gd3+. Additionally, the smaller size of the Mn2+ ion requires penta- or hexadentate ligands to accommodate q=1, whereas q=1 Gd3+ can be accommodated by octadentate ligands. It is our view that the lower thermodynamic stability of Mn2+ complexes does not mean the complexes are “insufficiently stable.” Several q=1 Mn2+ complexes have conditional pH 7.4 stability constants (log Kcond pH 7.4) greater than 10, i.e. a dissociation constant, Kd < 10 pM.
Of more serious concern is the perceived kinetic lability of Mn2+ chelates compared to GBCAs. Even for thermodynamically stable complexes, substantial exposure to dissociated metal ions can occur if the complex is kinetically labile with respect to metal ion dissociation. However, recent work has shown that using rigid acyclic or macrocyclic ligands, it is indeed possible to develop high-relaxivity Mn2+ complexes that appear to be comparably or more inert than some GBCAs based on functional assays of kinetic inertness.76–79 Comparison of Mn and Gd dissociation rates under four different sets of reaction conditions (Dissociation Challenges 1–4) are listed in Table 4. For example, the q=1 chelate Mn2+-PyC3A is comparably inert to Gd-DTPA under assay conditions used to compare dissociation kinetics of GBCAs (Dissociation Challenge 1).80–81 Under these conditions, 2.5 mM contrast agent is incubated with 2.5 mM Zn2+ in 50 mM pH 7.0 phosphate buffer at 37 °C, and kinetic inertness is compared by measuring the time required to achieve 20% release of the paramagnetic ion (t20%). In a side-by-side comparison, 1.8 h and 2.8 min were required for 20% dissociation of Mn-PyC3A and Gd-DTPA, respectively.79 Under conditions of Dissociation Challenge 2 (1 mM contrast agent, 25 mM Zn2+, pH 6.0 MES buffer), Mn-PyC3A was found to be 20-fold more inert than Gd-DTPA. The complex Mn-PC2A-EA, which appears to be the most kinetically inert Mn2+ complex of q > 0 reported to date,78 appears to be over one and two orders of magnitude more inert than Gd-DTPA when evaluated according to Dissociation Challenge 3 ([contrast agent] = [Zn2+] or [Cu2+] = 0.01 mM, pH 7.4) and Dissociation Challenge 4 ([contrast agent] = [Zn2+] or [Cu2+] = 1.0 mM, pH 7.4), respectively, which estimate the rates of trans-chelation in the presence of Cu2+ or Zn2+ based on quantitative thermodynamic and rate law data.
Side by side comparisons of Mn2+ and Gd3+ dissociation kinetics highlight the inertness of the Mn complexes, but the relative rates of Mn vs. Gd dissociation are not consistent across all reaction conditions. Different complexes may undergo dissociation via different reactions mechanisms. For many of the Mn2+ complexes listed in Table 4, dissociation in the presence of competing metal ions like Cu2+ and Zn2+ is rate limited by spontaneous dissociation of the mono-protonated Mn2+ complex, exhibiting effectively zero-order kinetics with respect to concentration of the challenging metal ion. For example, the rates of Mn2+ dissociation from Mn-CyDTA, Mn-12-PyN4A, Mn-15-PyN5, Mn-PC2A and Mn-DO2A derivatives are either unaffected or modestly inhibited by increasing challenging ion concentration.78, 82–84 On the other hand, dissociation of Gd-DTPA exhibits a first order dependence on challenger metal ion concentration.85 Side by side comparisons of Mn-CyDTA vs. Gd-DTPA kinetic inertness under Dissociation Challenges 3 and 4 exemplifies the challenge in comparing kinetic inertness of complexes that dissociate by different reaction mechanisms. Mn-CyDTA appears to be over an order of magnitude less inert than Gd-DTPA under Dissociation Challenge 3 but is estimated to be almost four-fold more inert under Dissociation Challenge 4, where the concentrations of the contrast agent and challenger metal ion are each elevated by 100-fold. Although GBCA inertness seems to correlate with Gd retention, it is unclear whether there is any in vitro assay to accurately predict the degree to which Mn2+ is dissociated or retained in vivo. It is our view that thermodynamic stability and kinetic inertness should be prioritized when developing complexes of Mn2+ or other metal ions as GBCA alternatives. However, given the paucity of in vivo data related to metal ion retention from Gd-free contrast agents, researchers should also be aware that in vitro assays for stability and inertness may not necessarily predict metal exposure in vivo. As more Mn2+ complexes are evaluated as MRI contrast agents, functional assays capable of predicting kinetic inertness in vivo may emerge.
The complex Mn2+-PyC3A was rationally designed as a GBCA alternative.79 The PyC3A chelate imparts high thermodynamic stability and kinetic inertness, as described above, while simultaneously leaving a vacant coordination site for a rapidly exchanging water co-ligand.79 The r1 of Mn-PyC3A, Gd-DTPA, and Gd-DOTA in human blood plasma are 3.5, 4.1, and 3.6 mM−1s−1, respectively at 1.5T and 37 °C.86–87 The blood clearance pharmacokinetics of Mn-PyC3A were quantified in a baboon model and shown to be analogous to Gd-DTPA.88 Like Gd-DTPA, the hydrophilic character and anionic overall charge limit distribution to the extracellular spaces. Although hydrophilic overall, the hydrophobic trans-1,2-diaminocyclohexyl backbone and pyridyl segments of the chelate impart a degree of amphiphilicity (octanol:water partition coefficient,79, 89 logP = 0.595) which is believed to promote partial hepatobiliary excretion. Partial hepatobiliary clearance has been demonstrated in mouse and baboon imaging studies.79, 88 Quantification of fractional excretion in rats demonstrated roughly 85% renal and 15% hepatobiliary elimination of Mn-PyC3A.89
The comparable r1 values and pharmacokinetics of Mn-PyC3A to GBCAs result in comparable MRI contrast enhancement in vivo. Mn-PyC3A demonstrated angiographic contrast that was not significantly different from an equal dose of Gd-DTPA in a baboon model.88 Mn-PyC3A was also demonstrated to be highly effective for tumor visualization. Figure 6 shows a side by side comparison of axial T1-weighted images of an orthotopic mouse model of breast cancer acquired prior to and 3 min after injection of 0.1 mmol/kg Gd-DOTA and 0.1 mmol/kg Mn-PyC3A. The tumor is located in the upper left thoracic mammary pad and denoted by the yellow arrow. Prior to contrast injection, the tumor is isointense relative to adjacent muscle tissue but is rendered similarly hyperintense after injection of either agent. Quantitation of post-injection – pre-injection tumor vs. muscle contrast-to-noise ratios demonstrated no significant difference using the Gd and Mn agents.89
Figure 6.
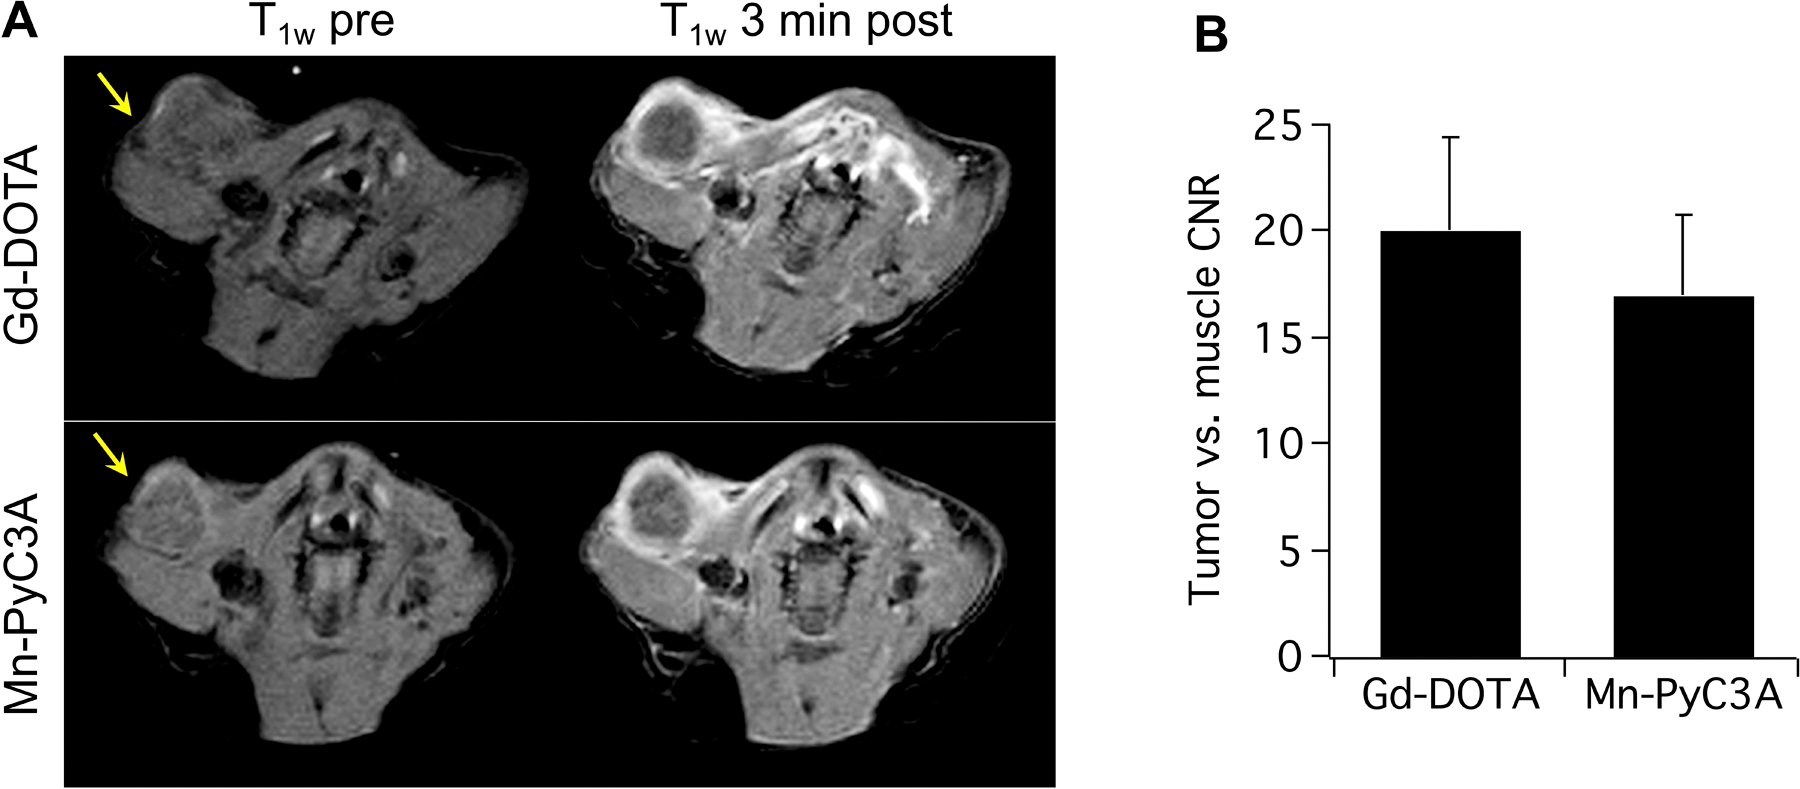
Contrast-enhanced MRI of an orthotopic syngeneic murine model of breast cancer using 0.1 mmol/kg Gd-DOTA and 0.1 mmol/kg Mn-PyC3A. (A) T1-weighted axial MR images through the upper thoracic mammary fat pad and tumor (arrow) before and 3 minutes after injection of Gd-DOTA orMn-PyC3A. Injections of Mn-PyC3A and Gd-DOTA were performed 3 hours apart. For this set of images, Gd-DOTA was injected first. The tumors are denoted by the yellow arrow. (B) Tumor vs. muscle contrast-to-noise ratios obtained using Mn-PyC3A and Gd-DTPA were not significantly different, P = 0.34. Reproduced dapted with permission from reference 114. Copyright (2019, Wolters Kluwer).
The in vivo stability of Mn-PyC3A was demonstrated by tandem HPLC-ICP-MS analysis of blood plasma and urine collected from baboons following Mn-PyC3A injection. The chromatography traces provide sensitive detection of Mn-containing species and revealed little evidence of metabolism or Mn de-chelation.88
A side by side comparison of whole body Mn vs. Gd elimination in rats receiving equal doses of 2.0 mmol/kg Mn-PyC3A or Gd-DOTA demonstrated that significantly lower quantities of Mn than Gd were retained in the rats 1 day and 7 days after injection.89 By 7 days, Mn levels were either significantly lower or not significantly different than Gd levels in each of the 20 tissues analyzed during the study. Tables 3 and 4 show that Gd-DOTA is orders of magnitude more stable than Mn-PyC3A, and is extremely kinetically inert compared to Mn2+ chelates, but the in vivo biodistribution data highlights how Mn2+ and Gd3+ are processed by distinctly different biochemistry and underscores how in vitro assays of stability and inertness are inadequate measures of long term metal exposure.
Mn-based alternatives to liver specific GBCAs have also been explored. Mn-EDTA functionalized with lipophilic ethoxybenzyl (Mn-EOB-DTPA) and benzothiazole aniline moieties (Mn-BTA-EDTA) have been reported, and it was demonstrated that a 0.05 mmol/kg dose of either agent provided delayed phase liver enhancement that improves visualization of liver tumors in mice.90–91 The transient liver uptake of Mn-PyC3A has also been capitalized on for liver specific imaging.89 A more amphiphilic derivative of Mn-PyC3A-3-OBn (logP = 1.15) was recently reported for liver specific imaging and provides substantially greater liver-to-tumor CNR than Mn-PyC3A.86
Mn3+ porphyrins have also been considered as GBCA alternatives, Figure 7, Table 2. The r1 of Mn3+-porphyrins are substantially larger than GBCAs and has been described as ‘anomalously’ high.92 Magnetic relaxation in the presence of Mn3+ is underexplored compared to Gd3+ and Mn2+, but the unexpectedly high relaxivity has been attributed in part to the presence of two rapidly exchanging water co-ligands, close rMH interations, and longer than expected T1e considering the asymmetrically occupied d4 ground state electronic configuration. The long T1e has been attributed to a large Jahn-Teller distortion, resulting in a large energy separation and reduced admixture between the vacant x2-y2 orbitals and four half-filled d-orbitals, effectively minimizing spin-orbit coupling interactions. It has also been proposed that interactions between water-1H and electron spin exceed what is predicted by the 1/rMH6 approximation due to an anisotropic electronic wavefunction that is elongated along the dz2 orbital axis pointing at the water co-ligands.92
Figure 7.

Representative examples of Mn3+ complexes considered as T1 relaxation agents.
Preliminary in vivo evaluation of Mn3+ porphyrins as MRI contrast agents has yielded promising results. Strong tumor enhancement was achieved between 2 and 4 hours following a 0.09 mmol/kg dose of Mn-TPPS4 in murine xenograft models of human carcinoma, lymphoma, and fibrosarcoma.93 In another study, Mn-TPPS4 provided strong contrast enhancement of human breast cancer and colorectal xenografts in mice.94 Mn-TPPS4, Mn-TPPS3, Mn-cis-TPPS 2, and Mn-trans-TPPS 2 were all shown to be effective contrast agents for visualizing tumors in an orthotopic mouse model of breast cancer.95 Mn-TPPS4 and Mn-mesoporphoryin provide delayed liver enhancement than has used for detection of liver metastases in rats.96–97 The anionic chelate Mn-TCP and neutral dimeric chelate Mn-P2 have been evaluated evaluated as GBCA alternatives98–101 Dynamic MRI measurements demonstrated that Mn-TCP has comparable pharmacokinetics, and biodistribution to Gd-DTPA and provided stronger tumor enhancement that Gd-DTPA in a rat xenograft model of breast cancer.100–101 Mn-P2 provided prolonged blood pool enhancement that could be potentially useful for MR angiography applications.99
The thermodynamic stability and kinetic inertness of Mn3+-porphyrins are underexplored. The increased charge-to-radius ratio compared with Mn2+ and ligand field stabilization energy associated with the d4 configuration suggest that Mn3+-porphyrins should be thermodynamically stable. However, the thermodynamic stability of Mn3+ chelates is difficult to assess, as the free Mn3+ ion rapidly disproportionates to Mn4+ and Mn2+, rendering pH-potentiometric titration experiments challenging. We are unaware of any reported experiments to interrogate the kinetic inertness of Mn3+ porphyrins. One study demonstrated that incubation of 0.5 mg/mL Mn-TPPS4 in blood plasma at 37 °C did not result in detectable amounts of free TPPS4 ligand over 9 days.102 Given the high relaxivity and in vivo imaging efficacy of Mn3+-porphyrin complexes, studies to further evaluate the in vivo efficacy and safety are certainly merited.
Mn3+ complexes of 1,2-phenylenediamine bisamidate ligands shown in Fig 7 have also been synthesized as MRI contrast agents. Studies with these complexes have focused on molecular imaging applications,103–104 but this class of compounds could also be considered for evaluation as GBCA alternatives.
Fe-based relaxation agents.
High-spin S=5/2 complexes of Fe3+ represent another potential alternative to GBCAs. Endogenous levels of Fe are high, ranging 3–4 g total Fe in human adults, with highly regulated systems for transport and storage.105 Nonetheless, free Fe3+ exhibits acute toxicity at high doses and Fe3+ solubility is exceedingly low at neutral pH. In this regard, high-relaxivity Fe3+ complexes are subject to the same thermodynamic stability and kinetic inertness considerations as complexes of other metal ions.
The r1 values for Fe3+ chelates that have been evaluated as MRI contrast agents are tabulated in Table 2. Magnetic relaxation in the presence of Fe3+ has not been explored as thoroughly as for Mn2+ and Gd3+ but nuclear magnetic relaxation dispersion (NMRD) measurements performed on Fe-EDTA and relaxometric evaluation of free vs. protein bound Fe3+-EHPG indicate that r1 is controlled predominantly by τR.106–107 Fe3+ is a stronger Lewis acid compared to Gd3+ or Mn2+ and care must be taken to ensure that water co-ligand pKa is high enough to avoid formation of Fe-hydroxide or Fe-oxo ligands, which may substantially reduce inner sphere contributions to r1. The water co-ligand pKa values of four structurally related acyclic chelates are compared in Table 5, and demonstrate how for Fe3+ complexes the water co-ligand pKa is strongly influenced by changes ligand environment.108–110 For example, swapping the trans-1,2-cyclohexylene backbone of Fe-CyDTA for a 1,2-phenylene backbone (Fe-PhDTA) can alter the acidity of the water co-ligand by >5 pKa units. Care must be also taken to ensure stabilization of high-spin Fe3+, as the increased charge-to-radius ratio results in chelates with greater crystal field splitting energy compared to corresponding Mn2+ chelates. For example, the TACN-derived ligands L1-L4, Fig 8, support complexes of high-spin Fe3+, but swapping the 2-hydroybenzyl or acetate pendant donor arms for more strong field 2-methylimidazole (Fe-Tim) or 1-methyl-2-methylimidazole (Fe-Mim) donors results in complexes of low-spin Fe3+.111–112
Table 5.
Comparison of pKa values for water co-ligand of representative Fe3+ complexes shown in Fig 8 demonstrates that water co-ligand pKa is very sensitive to changes in ligand structure and electronics.
Figure 8.

Representative examples of Fe3+ complexes considered as T1 relaxation agents.
Because Fe3+ has a substantially larger charge-to-radius ratio than Mn2+ or Gd3+, Fe3+ tends to form complexes which are more thermodynamically stable.113 For example, the log KML values of the Fe3+, Mn2+ and Gd3+ complexes of DTPA are 28.0, 14.1 and 22.5, respectively.114–115 The kinetic inertness of Fe3+ contrast agents are largely underexplored compared to Mn2+ and Gd3+ contrast agents. There is also paucity of data pertaining to in vivo Fe retention following Fe3+ contrast agent injection, although one study demonstrated 95% recovery of 54Fe labelled Fe3+-CyDTA in urine 1h after injection of a 0.1 mmol/kg dose in mice.113 There is no excretory path for de-chelated iron and this data suggests that Fe3+-CDTA is rapidly eliminated in vivo without undergoing substantial Fe dechelation.
In vivo imaging studies support Fe3+ chelates as potentially suitable GBCA alternatives. Fe3+-EHPG was shown to be an effective hepatobiliary agent and it was reported that doses as high as 2.0 mmol/kg administered to rats were well tolerated without observation of any safety signals.116 Comparison of 0.2 mmol/kg dose of Fe-CyDTA to a 0.1 mmol/kg dose of Gd-DTPA demonstrated comparable tumor vs. adjacent muscle CNR in a murine xenograft model of human breast cancer.117 A 0.05 mmol/kg dose of Fe-L1 showed strong enhancement of the blood pool and kidneys that rapidly diminished in the minutes following injection, consistent with rapid elimination via renal filtration, as well as liver enhancement that persisted for out to 4 hours post-injection but returned to near baseline levels within 24h, consistent with hepatocellular uptake.111
Transition metal complexes as paraCEST agents.
Another way to generate MRI contrast is via the chemical exchange saturation transfer (CEST) mechanism. CEST contrast is achieved though radiofrequency saturation of protons capable of exchange with bulk water, resulting in MR signal loss, Figure 9.118–120 Labile protons for CEST imaging are typically provided by functional groups such as amines, amides, alcohols, or phenols, and can be from endogenous sources like amino acids or exogenously added contrast agents. When the CEST agent is a metal complex, labile protons can be provided via exchangeable water co-ligand(s).121 The magnitude of the CEST effect is most commonly characterized as Magnetization Transfer asymmetry (MTRassym), eq. 7
| Eq. 7 |
where SI(−Δω) and SI(+Δω) are the water 1H signal intensities acquired with RF saturation applied on resonance with the exchangable proton pool and at the off-resonance frequency symmetric with respect to the water signal, SI0 is water 1H signal intensity with no RF saturation applied.119
Figure 9.

CEST contrast is achieved though radiofrequency saturation of protons capable of exchange with bulk water, resulting in MR signal loss.
The CEST effect exhibits dependencies on the magnitude of chemical shift between the 1H of water and the proton exchanging functional group (Δω), the corresponding rate of prototropic exchange (kex), and radiofrequency power used to achieve magnetic saturation (B1) of the labile protons bound to the CEST agent. Each of these parameters can be expressed in Hz. In order for CEST to be achieved, kex must not exceed Δω, CEST criterion 1. Within this limit the CEST effect increases with kex, provided B1 << Δω so as to avoid blunting the CEST effect by direct RF saturation of bulk water protons, CEST criterion 2. Increasing kex results in exchange broadening of the bound proton resonance and requires greater B1 to achieve full magnetic saturation which can result in a violation of CEST criterion 2 and can increases the specific absorption rate (SAR) of RF radiation, resulting in tissue heating. Thus, a careful balance between Δω, kex, and B1 must be struck when optimizing CEST contrast agents.121
CEST criterion 1: kex ≤ Δω
CEST criterion 2: B1 << Δω
Under conditions where CEST criteria 1 and 2 are met, CEST contrast agent efficacy is governed by equation 8,
| Eq. 8 |
where qH is the number of exchangeable protons bound to the contrast agent, τmH is the mean residency time of the exchangeable proton, and T1a refers to the T1 of water.
There have been studies which suggest that CEST agents could be used in place of GBCAs. The iodinated X-ray contrast agents iopamidol, iohexol, and iodixanol, Fig 10a, each contain multiple labile OH groups and have been used to visualize tumors and quantify perfusion in an orthotopic mouse model of breast cancer via CEST contrast enhancement.122–123
Figure 10.

Representative X-ray contrast agents used as diamagnetic CEST agents, (A), lanthanide-based paraCEST agents (B), and transition metal based paraCEST agents (C) discussed in this manuscript.
However, there are also substantial drawbacks to using CEST agents when compared to GBCAs. CEST agents are detected with substantially lower sensitivity than relaxation agents. In the murine breast cancer imaging experiment discussed in the above paragraph, tumor contrast enhancement observed following 10 mmol/kg (7.8 to 16 g contrast agent per kg animal, depending on the X-ray agent used) iodinated contrast agent (reported as percentage saturation transfer) was nearly an order of magnitude lower than that observed after injection of 0.1 mmol/kg Gd-HPDO3A (percentage signal enhancement). Essentially, the CEST agent was detected with 1000-fold lower sensitivity.122 Another drawback is that the CEST effect is also very sensitive to the magnetic field inhomogeneities that are present when scanning live subjects. Moreover, the CEST effect in vivo is superimposed on a very broad CEST-like effect called magnetization transfer.124 Together these factors introduce additional uncertainty when analyzing CEST data.
It has been proposed that CEST detection sensitivity can be improved substantially by expanding Δω with the assistance of a paramagnetic ion.121, 125 Paramagnetically shifted CEST agents (paraCEST agents), can in theory tolerate kex and B1 values up to two orders of magnitude greater than what can be achieved with diamagnetic CEST agents before CEST criteria 1 and 2 are violated, Table 6, and as a result can be detected with much greater sensitivity than conventional CEST agents. CEST agents that can tolerate larger B1 without violating Criterion 2 are also more robust to Δω uncertainties introduced by field inhomogeneities. However, it is in reality very challenging to fully capitalize on the theoretical advantages of paraCEST agents because the large B1 required for full magnetic saturation of rapidly exchangeable protons will result in substantial RF energy deposition and tissue heating.
Table 6.
Chemical shift in ppm and kex for CEST active protons of X-ray contrast agents, lanthanide-based and transition metal-based paraCEST agents shown in Figure 10.
| Functional group | δΗ (ppm) | kex (s−1) | |
|---|---|---|---|
| Iopamidol123 | amide NH | 4.10 | 2,560a |
| Iomeprol244 | amide NH | 4.30 | 1,830a |
| Iohexol244 | Amide NH | 4.30 | 1,610a |
| Ioversol244 | Amide NH | 4.30 | 1,630a |
| Iodixanol244 | Amide NH | 4.30 | 1,210a |
| Tb-DOTA-4AmCE121 | Water co-ligand | −600 | 32,300 |
| Dy-DOTA-4AmCE121 | Water co-ligand | −720 | 58,800 |
| Yb-HPDO3A245 | Alcohol OH | 71b, 99b | N/D |
| Tm-DOTAM-Gly246 | Amide NH | −51c | 3,450 |
| Ho- DOTAM-Gly246 | Amide NH | 39c | 2,500 |
| Dy- DOTAM-Gly246 | Amide NH | 77c | 2,500 |
| Eu-DOTAM-EB247 | Amide NH | 53 | 12,300 |
| Fe-TCMT248 | Amide NH | 69 | 240 |
| Fe-AMPT248 | Aminopyridine NH2 | 6.5 | N/D |
| Fe-BZT248 | Benzothiazole -NH | 53 | N/D |
| Fe-STHP248 | Alcohol OH | 54 | 3,000 |
| Fe-DOTAM248 | Amide NH | 50 | 400 |
| Fe-TAPC131 | Aminopyridine NH2 | −79 | 1,700d |
| Fe-NOPE133 | Amide NH | 92, 24e | 500 |
| Co-TCMT248 | Amide NH | 32 | 890 |
| Co-DOTAM248 | Amide NH | 45 | 300 |
| Co-CCRM248 | Amide NH | 112 | 510 |
| Co-TPT248 | Pyrazole NH | 135 | 9,200 |
| Co-HINO127 | Imdazole NH | 32 | 1020a |
| Co-TAPC131 | Aminopyridine NH2 | −118 | N/D |
| Co-NOPE133 | Amide NH | 59, −19e | 240 |
| Co-L5136 | Alcohol OH | 140 | 5,000f |
| Ni-TCMT248 | Amide NH | 76 | 364 |
| Ni-CCRM248 | Amide NH | 72 | 328 |
| Ni-HINO127 | Imdazole NH | 55 | 1020a |
| Ni-NOPE133 | Amide NH | 72, 11e | 240 |
| Ni-DOTAM249 | Amide NH | 73 | 330 |
| Ni- chxdedpam250 | Amide NH | 91.5e,g | 6,100 |
| Cu2(L)(P2O7)138 | Amide NH | 29 ppm | 420 |
pH 7.4
The two -OH resonances observed have been tentatively assigned to R and S form of Yb-HP-DO3A.
pH 8.1, 312K
pH 7.7
magnetically inequivalent NH from amide NH2.
pH 7.0
pH 7.2
A number of trivalent lanthanide complexes have been evaluated as paraCEST agents, and a few representative examples are shown in Fig 10b The strong magnetic moment, high magnetic anisotropy and rapid T1e of paramagnetic lanthanides are ideal for expanding Δω while minimizing line broadening of the exchangeable 1H resonance via T2 relaxation. Complexes of Tb3+ and Dy3+ have been shown to generate chemical shifts as large as −600 ppm and −720 ppm, respectively,121 Table 6.
On the other hand, given the consistent coordination chemistry across the lanthanide series, metal deposition from lanthanide-based CEST agents may reflect that which occurs when using GBCAs. For example, it was recently shown the biodistribution patterns of Gd and the pseudo-lanthanide Y were nearly identical 48 hours after administration of equal doses of the corresponding DTPA and DOTA chelates in rats.126 Taken together, concerns of lanthanide retention and the substantially higher doses required of paraCEST agents represent substantial challenges to developing lanthanide paraCEST agents as GBCA alternatives.
Transition metal paraCEST agents are comparatively underexplored compared to lanthanide agents. High-spin Fe2+, Co2+, and Ni2+ are all capable of generating large Δω that is not offset by strong paramagnetic relaxation effects. A few monomeric Fe2+, Co2+, and Ni2+ complexes have been evaluated as CEST agents, Figure 10c.127–137 The chemical shift in ppm and kex of transition metal paraCEST agents are compared to representative diamagnetic CEST and lanthanide-based paraCEST agents in Table 6.
It was recently demonstrated that dinuclear complexes of ferromagnetically coupled Cu2+ can be utilized as paraCEST agents.138 Mononuclear complexes of Cu2+ typically exhibit low magnetic anisotropy and long T1e, rendering the CEST effect highly inefficient due to relaxation line broadening.139 Ferromagnetic coupling of the otherwise well-isolated Cu2+ spins of Cu(L)(P2O7), Fig 10c, simultaneously induces strong enough magnetic anisotropy to achieve 29 ppm chemical shift for exchangeable amide-NHs and shortens T1e into the ps regime, allowing for sharp, saturable NMR resonances. The results of these studies suggest that paramagnetic ions typically utilized as relaxation agents may also be utilized as paraCEST agents when incorporated into multinuclear systems that promote magnetic superexchange coupling.
Given the low detection sensitivity of CEST agents compared to relaxation agents, it is our view that it is challenging to develop a CEST or paraCEST contrast agents that could be interchangebly used with GBCAs in any indication. However, there are a number of powerful molecular imaging applications for CEST and paraCEST agents. The majority of CEST molecular imaging to date has been performed using diamagnetic CEST agents. Chemical exchange spin-lock imaging has been used to map glucose consumption in human brain tumors.140 Proton exchanging functional groups exhibit a pH dependence on kex, which can be utilized for pH mapping of pathologic tissue. CEST agents featuring two or more proton exchanging functional groups, each with a distinct Δω and pH dependence on kex, have been developed to evaluate pH via ratiometric analysis of saturation transfer recorded at different frequency offsets.141 For example, the clinical X-ray contrast agent iopamidol has been used for ratiometric pH measurements in human bladder and metastatic ovarian cancer.142–143 ParaCEST agents have been utilized for pH mapping in rodent models of acidosis.144–146 Enzymatically activated paraCEST agents, in which hydrolytic activity liberates proton exchanging -OH or NH2 groups, have also been reported in the chemistry literature.147–153 Modulation of paraCEST via changes in paramagnetism are discussed later in this article.
Transition metal complexes as paraSHIFT agents.
Exogenously administered molecules detected by direct 1H or 19F NMR observation may also be considered as GBCA alternatives. These molecules do not generate contrast between tissues and are therefore not contrast agents - they are instead referred to as chemical shift agents or probes. Tissue containing elevated concentrations of the shift agent (i.e. hyperpermeable lesions) would be detected as an 1H or 19F “hot spots.”
Paramagnetic metal complexes detected by direct nuclear observation are referred to as paraSHIFT agents. Paramagnetically shifted 1H resonances can be unambiguously detected without interference from endogenous 1H of water (~4.8 ppm) and fat (~1.3 ppm). Paramagnetically induced T1-relaxation of the 1H and 19F nuclei can enable multiple MR acquisitions can be acquired in the time frame of a conventional acquisition, effectively improving detection sensitivity relative to corresponding diamagnetic species by an order of magnitude.154–155
The paramagnetic requirements of an effective paraSHIFT agent mirrors those of an effective paraCEST agent - strong magnetic moment, high magnetic anisotropy, and low-relaxivity. In this regard, high-spin complexes of Fe2+, Co2+, and Ni2+ have also been considered as transition-metal based 1H and 19F paraSHIFT agents, Figures 11 and 12, respectively.112, 127, 130, 134, 156–161 The chemical shift in ppm, T1 relaxation time, and full-width at half-height (directly proportional to T2*) of previously reported 1H and 19F paraSHIFT agents are summarized in Tables 7 and 8, respectively. In order to maximize detection sensitivity paraSHFIT agents are typically designed to included several chemically equivalent equivalent 1H or 19F nuclei.
Figure 11.

Representative lanthanide-based 1H paraSHIFT agents (A), and transition metal based 1H paraSHIFT agents (B) discussed in this manuscript.
Figure 12.

Representative transition metal based 19H paraSHIFT agents discussed in this manuscript.
Table 7.
Chemical shift in ppm, T1, and full-width at half max (FWHM) of observed 1H for representative lanthanide-based and transition metal-based paraSHIFT agents.
| 1H resonance | Equiv. protons | T1 (ms) | δH (ppm) | FWHM (Hz) | FWHM (ppm) | |
|---|---|---|---|---|---|---|
| Dy-L2171 | −tBu | 18 | 5.7c | −17.8a −29.9a | 78b,c,f | 0.20 b,c,f |
| Tm-DOTMA171–172 | −CH3 | 24 | 4.1a, 5.3a | −107a, −66.5a | 103a,c,f, 84a,c,f | 0.26a,c,f, 0.21a,c,f |
| DyL2251 | −tBu | 18 | 8.0d | −60.1. −63.8 | N/D | |
| Fe-MPT158 | −CH3 | 9 | 2.4e | 21.2 | 207e | 0.41e |
| Fe-TMPC158 | −CH3 | 6 | 1.1e | −52.3 | 458e | 0.92e |
| Fe-BMPC157 | −CH3 | 6 | 0.62e | −22.5 | 480e | 0.96e |
| Fe-2MPC157 | −CH3 (pyridine) | 6 | 1.0e | −45.5 | 393e | 0.79e |
| −CH3 (amine) | 6 | 1.1e | 105 | 359e | 0.72e | |
| Co-MPT 158 | −CH3 | 9 | 5.7e | 8.03 | 66.5e | 0.13e |
| Co-TMPC158 | −CH3 | 6 | 0.37e | −120 | 909e | 1.8e |
| Co-BMPC157 | −CH3 | 6 | 0.30e | −80.4 | 1150e | 2.3e |
| Co-2MPC157 | −CH3 (pyridine) | 6 | 0.44e | −112.5 | 848e | 1.7e |
| −CH3 (amine) | 6 | 0.18e | 164.4 | 1982e | 4.0e |
two isomers
corresponds to major isomer with δ = 17.8ppm
9.4T
7.0T
11.7T
calculated from T2, assuming T2 ~ 1/(Δν1/2*π).
Table 8.
T1 and full-width at half max (FWHM) of observed 19F resonance for representative ligands and corresponding transition metal-based complexes.
| 19F resonance | Equiv. protons | T1 (ms) | FWHM (Hz) | FWHM (ppm) | |
|---|---|---|---|---|---|
| DOTAm-F12156 | −CF3 | 12 | 880a | 0.59a,b | 0.0017a,b |
| Fe- DOTAm-F12156 | −CF3 | 12 | 5.7a | 103a,b | 0.20a,b |
| Ni-L7160 | −CF3 | 3 | 0.03a | 13a,b | 0.047a,b |
| Ni-L8160 | −CF3 | 6 | 0.01a | 40a,b | 0.14a,b |
7.0T
calculated from T2, assuming T2 ~ 1/(Δν1/2*π).
It is also possible to optimize detection sensitivity of 1H or 19F nuclei through synthetic modifications. The magnitude of the pseudocontact shift of the observed nuclei is governed by both the distance from the paramagnetic ion (r−3 dependence) and positioning relative to the metal ion’s principle magnetic axis.162–163 For transition metal complexes, contact shift contributions may also contribute to Δω. Similarly, there is an r−6 dependence on T2 contributions to line broadening. Thus, there are synthetic handles available for chemists to increase Δω and also tune T1 and T2 relaxation rates of the observed nuclei. For paraSHIFT 19F tracers with no interfering background signal, one could envision using any paramagnetic transition metal ion provided the metal-19F distance is carefully optimized to balance the signal enhancing T1-relaxation against offsetting T2-relaxation.
The majority of in vivo imaging using chemical shift agents has utilized diamagnetic systems. Cell tracking via 19F imaging of cells loaded with perfluorocarbon nanoemulsions (PFCNs) has been demonstrated.164–169 Chemical shift and paraSHIFT agents are detected with low sensitivity compared to GBCAs and other relaxation agents, but PFCNs provide a tremendous 19F payload and confinement within implanted cells enables long-acquisitions to boost 19F signal-to-noise. Pre-clinical rodent studies have been performed to quantitatively monitor pancreatic islet implantation,168 and to monitor monocyte infiltration into multiple sclerosis lesions and head and neck carcinoas.164–165 In a clinical trial, dendritic cells harvested from patients with colorectal cancer were engineered to present tumor specific antigens and for PFCN loading prior to intradermal auto-implantation.166 19F signal loss was tracked over a 24h period, corresponding to either migration or death of the 19F-labelled cells. It was recently shown that that lipophilic perfluoroalkyl functionalized complexes of high-spin Fe3+ relaxation agents incorporated into PFCNs provide up to four-fold sensitivity gain for 19F detection.170
Given the low detection sensitivity of shift and paraSHIFT agents, it is more challenging to image using low molecular weight complexes that are rapidly eliminated. However, it has been demonstrated that a carefully optimized Dy3+ paraSHIFT agents (DyL6, Figure 11A, Table 7) with 18 equivalent 1Hs shifted −18 ppm from water could be detected in tissues of mice following a 0.12 mmol/kg intravenous dose using MR acquisitions requiring less than 4 minutes.171 On the other hand, the resultant in vivo images did not yield “contrast” that could be used to visualize tissue structures. It is our view that like CEST and paraCEST agents, chemical shift and paraSHIFT agents will prove most useful in molecular imaging applications to map changes in temperature change, pH, or molecular level biomarkers. The pseudocontact shift obeys a T−2 temperature dependence and is also sensitive to changes in chemical microenvironment. For example, the 12 equivalent 1Hs of Tm-DOTMA (Figure 11) shift 0.57 ppm per °C, and a 0.6 mmol/kg dose of the complex was used generate maps of ΔT vs. reference tissue in rats (it is important to note here that the rats were fully nephrectomized to slow elimination of that Tm3+ complex).172 Other lanthanide paraSHIFT agents have been developed for magnetic thermometry, as well as for sensing changes in pH and Zn2+ concentration, and one could envision using these paraSHIFT agents in an analogous fashion.
Transition metal complexes as biochemically responsive MRI contrast agents.
Background.
Biochemically specific MRI contrast agents generate signal specifically in the presence of a biochemical target, enabling non-invasive detection, mapping, and in some cases quantification of pathologic changes occurring at the molecular level. One approach to biochemically specific MRI is to develop contrast agents that bind to a specific target, providing delayed signal enhancement after washout of the unbound agent. Gadolinium chelates targeted to protein targets such as fibrin,173 type I collagen,174 and elastin have been validated in vertebrate animal models of thrombosis,175–177 fibrosis,178–180 and cardiovascular tissue remodeling,181–184 respectively. The fibrin-binding contrast agent EP2104R was tested in a Phase II clinical trial.185
Unfortunately, the broad utility of the target-binding approach to biochemically specific MRI is limited by the low detection sensitivity of contrast agents. Gd-based relaxation agents require concentrations ≥10 µM for in vivo detection and CEST and chemical shift agents are detected with substantially lower sensitivity than relaxation agents. The vast majority of imaging biomarkers are inaccessible to MR imaging via this approach. One approach to improving the detection sensitivity of target-binding agents is to increase the Gd payload via multimerization.29, 186 In fact, the fibrin and collagen binding probes discussed above are comprised of four and three Gd complexes conjugated to their respective target-binding moieties. However, for most imaging targets a mere doubling or tripling of r1 per target-binding moiety is insufficient for MR conspicuity. High-molecular weight macromolecular structures containing very high signal generator payloads can be developed, but this will greatly alter the pharmacokinetics and time course of imaging time.
Another approach is to develop contrast agents that modulate the MR signal in the presence of a specific biochemical signature. The biochemically stimulated signal change occurs following a chemical reaction that alters the mechanisms governing T1-relaxation, CEST, or pseudo-contact shift. Biochemically responsive lanthanide-based agents have been developed to respond to changes in pH,187–188 metal ion or neurotransmitter concentrations,189–194 redox potential,195–196 enzymes expressed by reporter genes,197–199 and enzyme markers of injury or disease.148–149, 153, 200–202 Although enzyme concentrations are well below the threshold for direct detection with target-binding agents, catalytic action on biochemically responsive agents can result in meaningful signal change.
There are a number of important criteria to consider when designing a biochemically responsive agent for in vivo use. First, the “activated” or “on” form of the agent must be detectable at concentrations that can be achieved within the tissue studied by the imaging experiment. Second, the signal change achieved between the “off” and “on” states must be large enough so that the biochemically triggered signal change can be interpreted unambiguously. MR signal enhancement by relaxation and CEST agents are functions of both agent concentration and r1 or magnetization transfer efficiency, respectively. The biochemically triggered signal change must well exceed differences in signal enhancement that could result from variations in tissue concentration. For chemical shift agents, the chemical shift difference between the “off” and “on” states must be large enough that signal from the “off” state does not contaminate imaging weighted to signal from the “on” state. Third, a biochemically triggered response must be fast relative to the pharmacokinetics of the agent so that detectable concentrations of the activated agent can accumulate in vivo. Additionally, the agent should be robust against degradation both prior to and after biochemical activation. The agent should also be non-toxic. Our discussion below will focus on chemistry to address detection sensitivity and magnitude of signal response.
Biochemically responsive relaxation agents offer a clear advantage to detection sensitivity over agents detected by CEST or direct nuclear observation. Over the last two decades, innovative chemistry has been applied to develop dozens of biochemically responsive Gd-based relaxation agents, and some Gd-based agents have been advanced to successfully image pH change,203–204 Zn2+ flux,205–206 and enzyme activities199, 207–210 in vertebrate animal models. However, the magnitude of r1 response are typically very low for Gd-based agents. Gd chelates are strong relaxation agents even prior to biochemical activation and only a few of the agents developed to date can achieve a ≥2-fold increase in the presence of clinically relevant concentrations of biochemical stimuli. The Gd-based agents capable of generating the largest r1 change undergo reactions that result in oligomerization or protein binding, with r1 increasing resulting from longer τR. However, the r1 boost conferred to Gd via τR increase is strongest at B0 < 1.5 T, and the effect diminishes precipitously with increasing field strength. For example, the myeloperoxidase sensing agent Gd-MPO, Figure 13, which is forms higher molecular weight oligomers following myeloperoxidase mediated oxidation of the 5-hydroxytryptamine functional group, receives a 2.4-fold r1 increase from 4.3 mM−1s−1 to 10.5 mM−1s−1 at 0.47T , but r1 is virtually unchanged by oligomerization at 4.7T, Table 9. Similarly, the blood plasma r1 of the Zn2+ sensing agent Gd-L1Zn, Fig 12, which binds Zn2+ and subsequently associates with serum albumin, increases 3.1-fold upon Zn2+ binding from 5.8 mM−1s−1 to 18 mM−1s−1 at 0.50T, but the r1 increase is only 10% at 9.4T. Most of the Zn2+ and enzymatically activated agents used in vivo undergo stimuli responsive protein binding or polymerization – selective tissue enhancement is due largely to retention of the activated agent at delayed time points.
Figure 13.

Representative examples of biochemically responsive Gd-based relaxation agents.
Table 9.
Comparison of biochemically mediated r1 change achieved with representative Gd and transition metal complexes studied as biochemically responsive contrast agents.
| r1 change triggered by: | mechanism of r1 change | “off” r1/ “on” r1 (mM−1s−1), magnitude r1 change. | |||
|---|---|---|---|---|---|
| 0.47T | 1.4T | >3.0T | |||
| EgadMe197 | β-galactosidase | q increase | N/Da | N/Da | 0.9/ 2.7b, 3-fold |
| Gd-MPO | H2O2/myeloperoxidase | τR increase by oligomerization | 4.3/10.5, 2.4-fold207 | N/D | 4.9/4.8c, no change110 |
| Gd-LZn252 | Zn2+ binding and subsequent HSA association | τR increase from Zn2+ triggered albumin binding | 5.8/18, 3.1-fold | N/D | 6.0/6.8d, ~10% |
| Gd-4AmP203–204 | pH change | Prototropic exchange, second sphere | N/D | N/D | 6.0 (pH 6)/ 4.0 (pH 4), ~50%, or ~5% per 0.1 pH unitd |
| Mn-TPPS492 | O2 | Oxidation from Mn2+ to Mn3+ | 10/12, ~20% | N/D | N/D |
| Mn-TPPS492 | O2, in presence of β-cyclodextrin | Oxidation from Mn2+ to Mn3+ | 23/58, ~2.5 fold | N/D | N/D |
| Mn-HBET213 | Redox (H2O2, L-Cys) | Mn2+/Mn3+ interchange | N/D | 1.1/2.8, 2.5-fold | 1.1/3.9d, 3.5-fold |
| Mn-HBET-NO2213 | Redox | Mn2+/Mn3+ interchange | N/D | 0.50/2.3, 5.8-fold | 0.7/3.1d, 4.4-fold |
| Mn-CyHBET213 | Redox | Mn2+/Mn3+ interchange | N/D | 0.40/3.3, 8.3-fold | |
| Mn-CyHBET-NO2213 | Redox | Mn2+/Mn3+ interchange | N/D | 0.50/2.3, 5.6-fold | |
| Mn-JED217 | Redox (H2O2/peroxidase, L-Cys) | Mn2+/Mn3+ interchange | N/D | 0.5/3.3, 6.6-fold 0.9/8.0, 8.9-fold |
0.9/4.3d, 4.8-fold 1.1/ 3.6b, 4.6-fold 0.5/2.5d, 5.0-fold 0.5/ 1.9b, 3.8-fold |
| Mn-HPTP1 | H2O2 | Dimerization, τR increase | N/D | N/D | 4.4–3.6e, ~ −20% |
| Fe-PyC3A110 | H2O2, L-cys | Fe2+/Fe3+ interchange | N/D | 0.18/1.8, 10-fold | 0.18/2.4d, 13-fold 0.15/2.2b, 15-fold |
r1 change from q modulation is field independent.
11.7T
4.7T
9.4T
3.0T
The challenge to implementing biochemically responsive agents that provide small r1 change is exemplified by imaging experiments to map pH in rat models of renal acidosis and glioblastoma using the pH sensing agent Gd-DOTA-4AmP, Fig 13. Gd-DOTA-4AmP r1 increases by ~5% per 0.1 pH unit decrease between pH 7.4 and 6.0. Equally large signal change could be generated by small differences in Gd-DOTA-4AmP concentration. In vivo experimentation required a dual probe approach in which a pH-unresponsive agent with similar pharmacokinetics was injected and washed out before injection of Gd-DOTA-4AmP. The dynamic imaging data from the pH-unresponsive agent was used to estimate concentration of the pH sensor agent, and the pH maps were generated from Gd-DOTA-4AmP enhanced signal change normalized to estimated concentration.203–204 This dual probe approach provides an innovative solution to correct for variations in tissue concentration of Gd-DOTA-4AmP, but would be very difficult to implement in a clinical setting due to time constraints and safety concerns of doubling metal ion exposure.
Unlike Gd relaxation agents, it theoretically possible to achieve a true “off/ on” effect with CEST or chemical shift agents. In practice, the low detection sensitivity of CEST agents severely limits the dynamic range for biochemically mediated signal modulation.
There is a growing interest in developing transition metal complexes as biochemically responsive MRI contrast agents. The multiple oxidation states and electron spin configurations available to transition metals, each with unique paramagnetic properties and disparate structural preferences, offer exciting mechanisms by which to modulate MR signal response. Innovative examples highlighting the exciting opportunities for MRI contrast offered by transition metal chemistry are discussed below.
Transition metal complexes as biochemically responsive relaxation agents.
Biochemically activated Gd-based relaxation agents undergo r1 change in response to chemical reactions that alter either q, τm, or τR, Table 9. Using transition metals, it is theoretically possible to impact multiple relaxation mechanisms simultaneously via biochemical triggered change in oxidation state. For example, one could envision changing S, q, and even modulating the influence of τR simply by switching between Mn3+ and Mn2+ oxidation states. The Mn3+ ion has a strong preference for octahedral geometry and complexes comprising hexadentate ligands will likely result in a q=0 system, whereas Mn2+ is a substantially larger ion that can accommodate coordination number 7, thus enabling hexadentate ligands to form complexes of q=1. Given the asymmetric ground state electronic distribution of the Mn3+ ion it is also expected that T1e will contribute substantially to τC, thus limiting the capability to improve r1 by slowing τR change.211 On the other hand, T1-relaxation by Mn2+ complexes are typically controlled by τR, and one could envision further amplifying the Mn3+ vs Mn2+ r1 incorporating the Mn3+/2+ complex into higher molecular weight structures.
Initial proof of concept for MR signal modulation with a redox active Mn complex was demonstrated using Mn3+/2+-TPPS4, Fig 14. Mn3+/2+-TPPS4 was evaluated as a pO2 sensor, with Mn2+ vs Mn3+ composition reflecting pO2 between 0 and 40 torr O2.211 Between 0.47T and 3T at 25 °C the Mn3+-TPPS4 r1 ranges from 12 to 10 mM−1s−1 and Mn2+- TPPS4 ranges 10 to 8 mM−1s−1 (remember the “anomalously” high relaxivity of Mn3+ porphyrins).92 Because Mn3+/2+-TPPS4 does not undergo any substantial structural change upon oxidations state change and because the r1 of Mn3+ porphyrins exceed that predicted by the S(S+1)/rMH6 component of Equation 3, switching from Mn2+-TPPS4 to Mn3+-TPPS4 effects only a modest r1 change. However, a substantially larger 2.5-fold r1 difference was achieved by formation of a macromolecular adduct with β-cyclodextran. Upon association with β-cyclodextran, the 0.47T relaxivity of Mn3+- TPPS4 and Mn2+- TPPS4 increase to 23 mM−1s−1 and 58 mM−1s−1, corresponding to 2.3-fold and 4.8-fold r1 increase, respectively. The improved r1 response achieved by association of Mn3+/2+-TPPS4 with a macromlecular system highlights how Mn3+ T1e is fast relative to Mn2+ T1e at 0.47T, thus rendering the Mn3+ relaxivity less responsive to changes in τR.
Figure 14.

Redox active transition metal complexes (Mn3+/2+ and Fe3+/2+) complexes studied as biochemically responsive relaxation agents.
A series of ligands HBET-R and CyHBET-R, Fig 14, were designed to support isolable complexes of both Mn3+ and Mn2+, which are stabilized by different ligand environments. Ligands like EDTA support stable complexes of Mn2+, but cannot stabilize Mn3+, which will disproportionate to Mn2+ and Mn4+. On the other hand, Mn3+ is stabilized by ligands featuring more electron releasing donors, like TPPS4 or the bis-phenolate ligands HBED and EHPG. Both ligands stabilize Mn3+ exclusively under aerobic conditions.211–212 Based on the Mn3+ and Mn2+ stabilizing preferences of HBED and EDTA, it was hypothesized that the structurally analogous HBET-R and CyBET-R ligands featuring 3 carboxylates and 1 phenolate pendant donor would stabilize both oxidation states.213–214 It was also hypothesized that this class of ligands would also enable q modulation upon switching between Mn3+ and Mn2+. A total of six HBET-R and CyBHET-R systems were studied (R = -H, -OMe, -NO2), and all could be isolated in both the Mn3+ and Mn2+ oxidation states, with the exception of complexes where R = -OMe, which were only isolable in Mn2+ form, as described below. The HBET-R and CyHBET-R ligands form 7-coordinate ternary Mn2+ complexes with a rapidly exchanging water co-ligand. The corresponding Mn3+ complexes are believed to be q = 0, analogous to Mn3+-EHPG.215 For this series of complexes, reduction from Mn3+ to Mn2+ results in r1 increase ranging from 2.5-fold to 8.2-fold, at 1.4T and 37 °C. The effect is field independent, with a comparable turn-on effect achieved at 4.7T.
Mn3+ complexes of the HBET-R and CyHBET-R series reduce to Mn2+ instantaneously upon dissolution in blood plasma. The Mn3+/2+ redox potentials are >500 mV more positive than the thiol/disulfide couples that govern biological redox, and thus favor Mn2+ exclusively in biological milieu. Attempts to depress the redox potential via phenolate R-substituents destabilizes the phenolate-ligands with respect to redox. For example, the Mn3+-HBET-p-OMe can be transiently generated and observed via one electron oxidation with potassium ferricyanide, but undergoes ligand-metal auto-redox resulting in oligomeric Mn2+ species.213 However, Mn3+-phenolate auto-redox can also be a productive mechanism for biochemically responsive MRI contrast. For example, treatment of the complex Mn2+-HPTP1 with H2O2, yields transiently a brown intermediate (likely the corresponding Mn3+ complex) that rapidly converts to a C-C linked dinuclear complex with a concomitant r1 change, Figure 15.216
Figure 15.

Oxidation of Mn-HPTP1 by H2O2 results in a unstable Mn3+ complex that undergoes ligand-metal auto-redox and dimerization, resulting in 20% r1 change.
A different approach to stabilizing both Mn3+ and Mn2+ has been pursued using the complex Mn-JED, in which the ligand undergoes redox triggered isomerization between Mn2+ stabilizing “BPED-like” binding mode and Mn3+ stabilizing “HBED-like” binding modes.217 The JED ligand stabilizes both the Mn3+ and Mn2+ ligands in blood plasma, with little spontaneous interconversion between oxidation states observed over the course of 24 h. Relaxivity measurements in blood plasma demonstrate 9-fold greater r1 for Mn2+-JED vs. Mn3+-JED. Although JED stabilizes both Mn3+ and Mn2+, Mn2+-JED is rapidly and cleanly converted to Mn3+-JED in the presence of peroxidase enzyme activity. The reaction is reversible, as L-cysteine mediates reduction of Mn3+-JED to Mn2+-JED.
Fe3+/2+ redox has also been considered as a mechanism to generate biochemically responsive MRI contrast. As described above, high-spin complexes of Fe3+ are very effective relaxation agents. On the other hand, complexes of Fe2+ are much less effective relaxation agents. For high-spin Fe2+, r1 is limited by short T1e, and low spin Fe2+ is diamagnetic.218 The chelate Fe-PyC3A was demonstrated to be a highly effective redox responsive MRI contrast agent.110 PyC3A forms a ternary complex with high-spin Fe3+ and a rapidly exchanging water co-ligand, resulting in a r1 ranging between 1.8 to 2.2 mM−1s−1 between 1.4 T and 11.7 T at 37 °C. r1 for the sister Fe2+-PyC3A chelate ranges 0.15 to 0.18 mM−1s−1, a full order of magnitude lower. The Fe3+-PyC3A vs. Fe2+-PyC3A relaxivity difference is large enough to provide a virtual “turn off/ turn on” effect as demonstrated in Figure 16, which shows MR images of phantoms containing water, 0.5 mM Fe2+-PyC3A, and Fe3+-PyC3A. Contrast agent concentrations of 0.5 mM or greater are achieved in tissues in vivo following a standard dose of a low-molecular weight agent. The Fe2+-Py3A containing solution is barely contrast enhanced compared to water, whereas the Fe3+-PyC3A containing solution is strikingly hyperintense.
Figure 16.

T1-weighted 2D gradient echo images (TR = 125 ms, TE = 2.96 ms, FA = 60°) of phantoms containing neat water, 0.5 mM Fe2+-PyC3A, and 0.5 mM Fe3+-PyC3A at pH 7.4, room temperature and 4.7 T, demonstrate virtual “off/ on” effect. Reproduced/ adapted with permission from reference 101. Copyright (2019, American Chemical Society).
Fe2+-PyC3A is rapidly oxidized by H2O2. In this regard, Fe2+-PyC3A was evaluated as a sensor for ROS in vivo in a mouse model of pancreatic inflammation. Molecular imaging of ROS has been proposed as biomarker for acute inflammation. Neutrophils that infiltrate inflamed tissue secrete high levels of reactive oxygen species (ROS) via respiratory burst as well as myeloperoxidase, which catalyzes the conversion of respiration-derived ROS into highly deleterious sources of electrophilic oxygen, like ferryl heme and hypochlorous acid. For the study, pancreatic vs. adjacent muscle contrast to noise ratios (CNR) were quantified following injection of 0.2 mmol/kg Fe2+-PyC3A into either a mouse model of pharmacologically induced pancreatic inflammation (caerulein/ lipopolysaccharide model),219 or to control mice treated only with saline (normal pancreas). As a negative control, mice with pancreatic inflammation were imaged with an equal volume dose of 0.02 mmol/kg dose of Mn2+-PyC3A (solution “T1 matched” to Fe2+-PyC3A), which does not react with ROS. The results of the imaging study are shown in Fig 17. Prior to contrast injection, the signal arising from the pancreas and nearby tissues like liver are comparable. Little enhancement is observed after injection of Fe2+-PyC3A to mice with normal pancreas, or after injection of the T1-matched Mn2+-PyC3A dose to mice with inflamed pancreas. On the other hand, the inflamed pancreatic tissue is strongly and selectively enhanced after injection of Fe2+-PyC3A. Importantly, contrast enhancement of the pancreas correlated tightly with ex vivo quantitation of pancreatic myeloperoxidase activity levels.
Figure 17.

T1-weighted 2D coronal images of saline and caerulein/LPS treated mice recorded prior to and 10 min after injection of Fe2+-PyC3A or Mn2+-PyC3A. Organs are labelled as follows: P = pancreas, L = Liver, Sp =spleen, St = stomach, K = kidney, M = muscle, B = bowel. Bl = Bladder. Note that pancreas, and liver are isointense prior to contrast injection (A-C), after injection of Fe2+-PyC3A to saline treated mice (D), or after injection of Mn2+-PyC3A to caerulein/ LPS treated mice (F), but that the pancreas is strongly and selectively enhanced after injection of Fe2+-PyC3A to caerulein/ LPS treated mice (E). The bowel and stomach are strongly enhanced at all times because of high levels of metals including Mn present in the mouse chow. Reproduced/ adapted with permission from reference 101. Copyright (2019, American Chemical Society).
Transition metal complexes as biochemically responsive paraCEST agents.
Structural and paramagnetic differences between transition metal oxidation states can also be used to biochemically modulate CEST. For example, the ligand TPT supports low-spin diamagnetic complexes of Co3+ but high-spin paramagnetic complexes of Co2+ that shift the magnetically saturable pyrazole-NH protons 135 ppm from the bulk water resonance,220 Fig 18. Oxidation state interchange enables a true “off/ on” CEST effect. The Co3+/2+-TPT redox potential of −107 mV vs. NHE enables oxidation and reduction in the presence of O2 and L-cystine, respectively.
Figure 18.

Redox active and spin crossover transition metal complexes studied as biochemically or temperature responsive paraCEST agents.
Oxidation state interchange resulting in distinct paramagnetically shifted resonances for labile, magnetically saturable protons can be capitalized on for ratiometric quantitation of biochemical properties. For example, the dinuclear complex Fe2L(etidronate), Fig 18, supports Fe2+Fe2+ and Fe3+Fe2+ oxidation state configurations that exhibit CEST enhancement at saturation frequencies of 83 ppm and 40 ppm, respectively, which enable quantitation of microenvironment redox potential via ratiometric analysis of distinct CEST signals.221 As with the dinuclear Cu2+:Cu2+ complex Cu2(L)(P2O7) discussed above, Fe3+ T1e is substantially reduced via magnetic coupling interactions with Fe2+. In vitro proof of concept for this ratiometric imaging approach was demonstrated through spectroscopic measurements performed on solutions of defined L-cysteine and potassium superoxide composition, which mediate reduction to Fe2+Fe2+ and oxidation to Fe3+Fe2+, respectively. The ratio of % CEST enhancement arising from magnetic saturation at frequencies corresponding to oxidized and reduced agents correlated strongly with the solution open circuit potential determined by electrode readings.221
The CEST effect can also be modulated by spin crossover phenomena. The Fe2+ complexes Fe-3-BPP and Fe-Me2NPY5Me2, Fig 18, exhibit spin crossover from low-spin to high-spin in the 20 °C to 60 °C temperature range, which results in a 0.23 ppm per °C and 1.0 ppm per °C shift for the 1H resonances of labile, saturable imidazole-NHs or water co-ligand, respectively.222 This temperature dependent spin crossover behavior could potentially be utilized in MR thermometry applications to aid in minimally invasive thermal therapy targeted at solid tumors.
Transition metal complexes as biochemically responsive paraSHIFT agents.
Metal ion redox has also been utilized as an activation mechanism for paraSHIFT agents. For example, it was shown that H2O2 mediated oxidation of high-spin Co2+-NODACF3 to low-spin Co3+-NODACF3 by H2O2 triggers a 4 ppm chemical shift of the -C19F3 resonance, Fig 19.223 The chelates Co2+-NODA-C(CF3)3 and Co2+-MSCI-C(CF3)3 offer a 3-fold increase in 19F payload and interestingly achieve a nearly 10 ppm 19F chemical shift upon oxidation by H2O2 and H2O2/peroxidase, respectively.224–225
Figure 19.

Redox active transition metal complexes complexes studied as biochemically responsive 19F paraSHIFT agents, Fe-Py3OH undergoes low-spin to high-spin in response to hydroxypyridine deprotonation.
Cu2+/Cu1+ redox has been used to trigger 19F signal turn on in response to biochemical reduction. In this regard, the hypoxia specific positron emission tomography (PET) tracer 64Cu2+-ATSM, which is selectively reduced to Cu+-ATSM within hypoxic cells,226 has been adapted as an 19F chemical shift agent for MRI, Fig 19. The Cu+ complex undergoes facile dissociation compared to Cu2+-ATSM, resulting in cellular retention of Cu in hypoxic tissues. In PET scans, hypoxic regions appear as positron emitter “hot spots” during late time points after washout of unreacted Cu2+-ATSM.227 The 19F MR tracer Cu2+-ATSM-F3 is detected via 19F signal turn on under conditions of hypoxia. The 19F resonances of Cu2+-ATSM are not MR visible due to strong relaxation properties of Cu2+, which results in extreme 19F line broadening, but reduction to Cu+ results in 19F signal turn on. NMR studies performed on MCF-7 cells incubated with Cu2+-ATSM-CF3 demonstrated a 19F turn-on effect that was specific to hypoxic conditions.228 The sensitivity and cell-permeability of Cu2+-ATSM derived 19F agents was improved by increasing 19F payload and lipophilicity, Fig 19.229 A Cu2+ reduction approach was applied to the 19F labelled complexes Cu2+-LRF1 and Cu2+-LRF2, Fig 19, which are reduced from the Cu2+ to Cu+ oxidation state in the presence of L-cysteine resulting in 19F signal turn on.230
Biochemically triggered changes in d-electron spin configuration can also effect profound changes in 19F chemical shift. For example. Deprotonation of the 3,5-dimethyl-4-hydroxypyridine donor groups (pKa 6 at 37 °C) in 19F labelled Fe2+ complex Fe-PY3OH, Fig 19, trigger a switch from low-spin to high-spin Fe2+, accompanied by a 13.5 ppm shift in the 19F resonance per pH unit.
Summary and Outlook.
Contrast enhanced MRI is an indispensable tool for contemporary diagnostic medicine as well as non-clinical and pre-clinical biomedical research. Contrast agent design has traditionally centered around lanthanide complexes, but recent concerns over GBCA toxicity have inspired chemists to consider paramagnetic transition metal complexes in the context of MRI contrast. Simultaneously, increasingly personalized advances in patient care will require imaging that delivers increasingly specific cellular and molecular level information. Reaction-based manipulation of transition metal paramagnetism, enables T1-weighted signal modulation that exceeds what is possible using Gd-based relaxation agents, and offers a powerful mechanism by which to turn CEST and chemical shift effects “off” and “on”. The field of MRI contrast agents offers a number of exciting opportunities for inorganic chemists interested in applying transition metal chemistry to biomedical imaging research.
ACKNOWLEDGMENT
C.P.I. acknowledges research support from Ministerio de Economía y Competitivad (CTQ2016–76756-P). E.M.G acknowledges research support from the National Heart Lung and Blood Institute (K25HL128899) and the National Institute of Diabetes and Digestive and Kidney Diseases (R01120663).
AUTHOR BIOS
Abhishek Gupta completed his B.Sc (Hons I) in medical nanotechnology in 2012 and graduated with a PhD in 2016 from Western Sydney University (WSU) and the Commonwealth Scientific and Industrial Research Organisation, Australia. He is currently working as a postdoctoral research fellow at WSU and Ingham Institute (Liverpool Hospital), Australia, where he is developing responsive self-assembled nanoparticulate contrast agents for integrated MRI-linear accelerator systems. His current research interests also lie in the development of Gd-free MRI contrast agents and the advancement of the theory and applications of NMR, MRI and field-cycling relaxometry.
Peter Caravan is Professor of Radiology at Harvard Medical School and Co-Director of the Institute for Innovation in Imaging at Massachusetts General Hospital. A native of Bay Roberts, Newfoundland, he received a B.Sc.(Hons) from Acadia University and a Ph.D. in Chemistry from the University of British Columbia working with Chris Orvig. After post-doctoral work with André Merbach at the Université de Lausanne, he joined Epix Medical, a specialty biopharma focused on targeted MRI contrast agents, before joining the faculty of Harvard Medical School and A. A. Martinos Center for Biomedical Imaging at Massachusetts General Hospital in 2007. He has a longstanding interest in the chemistry, biophysics, and application of contrast agents.
William S. Price received his BSc(Hons), PhD and DSc degrees from the University of Sydney in 1986, 1990 and 2012, respectively. After postdoctoral study at the Institute of Atomic and Molecular Science in Taipei, Taiwan and the National Institute of Material and Chemical Research in Tsukuba, Japan he joined the Water Research Institute in Tsukuba, Japan in 1995 and became Chief Scientist in 1996. In 2000 he went for a year at the Royal Institute of Technology (KTH) with Prof. Peter Stilbs. In 2001 he returned to Japan as Professor of Chemistry at Tokyo Metropolitan University. At the end of 2003 he returned to Australia and is currently Professor of Medical Imaging Physics at Western Sydney University. His interests focus on the development and application of NMR techniques (pulsed gradient spin-echo (PGSE) NMR, NMR relaxation and MRI) to the study of molecular dynamics in chemical and biochemical systems. He has more than 190 peer reviewed publications.
Carlos Platas Iglesias graduated in Chemistry at the University of Santiago de Compostela and obtained a Ph.D. at the University of A Coruña in 1999. After working as a postdoctoral researcher at the University of Lausanne (Switzerland) and Delft University of Technology (The Netherlands) he returned to A Coruña, were he currently holds a position as Associate Professor of Inorganic Chemistry. His research interests are related to the application of coordination chemistry principles to design metal complexes with predetermined stability, kinetic, optical or magnetic properties, including contrast agents for Magnetic Resonance Imaging.
Eric M. Gale graduated with a bachelor’s degree in chemistry from Rutgers University in 2006 and received his PhD in chemistry from the University of Georgia in 2012 under the mentorship Todd Harrop. He trained as a postdoc under the mentorship Peter Caravan from 2012–2015. Eric is currently an Assistant Professor in Radiology at Massachusetts General Hospital and Harvard Medical School, where he applies chemistry to solve problems related to radiology and biomedical imaging. A major focus of his current research involves design, physicochemical characterization and pre-clinical evaluation of transition metal complexes as biochemically responsive MRI contrast agents.
Footnotes
Disclosures
P. C. and E. M. G. are founders and hold equity in Reveal Pharmaceuticals, a company working to commercialize a Mn-based MRI contrast agent.
REFERENCES
- 1.Wahsner J; Gale EM; Rodriguez-Rodriguez A; Caravan P, Chemistry of MRI Contrast Agents: Current Challenges and New Frontiers. Chem. Rev 2019, 119 (2), 957–1057. [DOI] [PMC free article] [PubMed] [Google Scholar]
- 2.Moon M; Cornfield D; Weinreb J, Dynamic Contrast-Enhanced Breast MR Imaging. Magn. Reson. Imaging Clin. N. Am 2009, (17), 2. [DOI] [PubMed] [Google Scholar]
- 3.Essig M; Dinkel J; Gutierrez JE, Use of Contrast Media in Neuroimaging. Magn. Reson. Imaging Clin. N. Am 2012, 20, 633–648. [DOI] [PubMed] [Google Scholar]
- 4.Yang S; Law M; Zagzag D; Wu HH; Cha S, Dynamic Contrast-Enhanced Perfusion MR Imaging Measurements of Endothelial Permeability: Differentiation between Atypical and Typical Meningiomas. Am. J. Neuroradiol 2003, 24, 1554–1559. [PMC free article] [PubMed] [Google Scholar]
- 5.Choi JY; Lee JM; Sirlin CB, CT and MR Imaging Diagnosis and Staging of Hepatocellular Carcinoma: Part I. Development, Growth, and Spread: Key Pathologic and Imaging Aspects. Radiology 2014, 272 (3), 634–653. [DOI] [PMC free article] [PubMed] [Google Scholar]
- 6.Essig M; Anzalone N; Combs SE; Dorfler A; Lee S-K; Picozzi P; Rovira A; Weller M; Law M, MR Imaging of Neoplastic Central Nervous System Lesions: Review and Recommendations for Current Practice. Am. J. Neuroradiol 2012, 33 (5), 803–817. [DOI] [PMC free article] [PubMed] [Google Scholar]
- 7.Kim SY; Cho N; Shin SU; Lee HB; Han W; Kwon BR; Kim SY; Lee SH; Chang JM; Moon WK, Contrast-enhanced MRI after neoadjuvant chemotherapy of breast cancer: lesion-to background parenchymal signal enhancement ratio for discriminating pathological complete response from minimal residual tumou. Eur. Radiol 2018, 28 (7), 2986–1995. [DOI] [PubMed] [Google Scholar]
- 8.Gale EM; Caravan P; Rao AG; McDonald RJ; Winfeld M; Fleck RJ; Gee MS, Gadolinium-based contrast agents in pediatric magnetic resonance imaging. Pediatr Radiol 2017, 47 (5), 507–521. [DOI] [PubMed] [Google Scholar]
- 9.European Medicine Agency https://www.ema.europa.eu/en/documents/press-release/emas-final-opinion-confirms-restrictions-use-linear-gadolinium-agents-body-scans_en.pdf. (accessed 26 June 2019).
- 10.Burai L; Toth E; Seibig S; Scopelliti R; Merbach AE, High-pressure NMR kinetics, part 95 - Solution and solid-state characterization of Eu-II chelates: A possible route towards redox responsive MRI contrast agents. Chemistry-a European Journal 2000, 6 (20), 3761–3770. [DOI] [PubMed] [Google Scholar]
- 11.Gamage NDH; Mei YJ; Garcia J; Allen MJ, Oxidatively Stable, Aqueous Europium(II) Complexes through Steric and Electronic Manipulation of Cryptand Coordination Chemistry. Angew. Chem.-Int. Edit 2010, 49 (47), 8923–8925. [DOI] [PMC free article] [PubMed] [Google Scholar]
- 12.Lauffer RB, Paramagnetic metal complexes as water proton relaxation agents for NMR imaging: theory and design. Chem. Rev 1987, 87 (5), 901–927. [Google Scholar]
- 13.Grobner T; Prischl FC, Gadolinium and nephrogenic systemic fibrosis. Kidney Int 2007, 72 (3), 260–264. [DOI] [PubMed] [Google Scholar]
- 14.Marckmann P; Skov L; Rossen K; Dupont A; Damholt MB; Heaf JG; Thomsen HS, Nephrogenic systemic fibrosis: suspected causative role of gadodiamide used for contrast-enhanced magnetic resonance imaging. J. Am. Soc. Nephrol 2006, 17 (9), 2359–2362. [DOI] [PubMed] [Google Scholar]
- 15.Kanda T; Fukusato T; Matsuda M; Toyoda K; Oba H; Kotoku J; Haruyama T; Kitajima K; Furui S, Gadolinium-based contrast agent accumulates in the brain even in subjects without severe renal dysfunction: evaluation of autopsy brain specimens with inductively coupled plasma mass spectroscopy. Radiology 2015, 276 (1), 228–232. [DOI] [PubMed] [Google Scholar]
- 16.Layne KA; Dargan PI; Archer JRH; Wood DM, Gadolinium deposition and the potential for toxicological sequelae – A literature review of issues surrounding gadolinium-based contrast agents. British J. Clin. Pharmacol 2018, 84 (11), 2522–2534. [DOI] [PMC free article] [PubMed] [Google Scholar]
- 17.Bao W; Jia H; Finnema S; Cai Z; Carson RE; Huang YH, PET Imaging for Early Detection of Alzheimer’s Disease: From Pathologic to Physiologic Biomarkers. PET Clin 2017, 12 (3), 329–350. [DOI] [PubMed] [Google Scholar]
- 18.Hammes J; Bischof GN; Drzezga A, Molecular imaging in early diagnosis, differential diagnosis and follow-up of patients with neurodegenerative diseases. Clin. Transl. Imaging 2017, 5, 465–471. [Google Scholar]
- 19.Bauckneht M; Capitanio S; Raffa S; Roccatagliata L; Pardini M; Lapucci C; Marini C; Sambuceti G; Inglese M; Gallo P; Cecchin D; Nobili F; Morbelli S, Molecular imaging of multiple sclerosis: from the clinical demand to novel radiotracers. EJNMMI Radiopharm. Chem 2019, 4, 6. [DOI] [PMC free article] [PubMed] [Google Scholar]
- 20.Lindner JR; Sinusas A, Molecular imaging in cardiovascular disease: Which methods, which diseases? J Nucl Cardiol 2013, 20 (6), 990–1001. [DOI] [PMC free article] [PubMed] [Google Scholar]
- 21.Jeraj R; Bradshaw T; Simoncic U, Molecular Imaging to Plan Radiotherapy and Evaluate Its Efficacy. J. Nucl. Med 2015, 56, 1752–1765. [DOI] [PubMed] [Google Scholar]
- 22.Shah K; Jacobs A; Breakefield XO; Weissleder R, Molecular imaging of gene therapy for cancer. Gene Therapy 2004, 11, 1175–1187. [DOI] [PubMed] [Google Scholar]
- 23.Shukla AK; Kumar U, Positron emission tomography: An overview. J. Med. Phys 2006, 31 (1), 13–21. [DOI] [PMC free article] [PubMed] [Google Scholar]
- 24.Moses WM, Fundamental Limits of Spatial Resolution in PET. Nucl. Instrum. Methods Phys. Res. A 2011, 648, S236–S240. [DOI] [PMC free article] [PubMed] [Google Scholar]
- 25.Edelman RR; Hesselink JR; Zlatkin MB; Crues JV III, Clinical Magneic Resonance Imaging - Volume 3 Elsevier Health: St. Louis, 2006. [Google Scholar]
- 26.Caravan P, Strategies for increasing the sensitivity of gadolinium based MRI contrast agents. Chemical Society Reviews 2006, 35 (6), 512–523. [DOI] [PubMed] [Google Scholar]
- 27.Botta M; Carniato F; Esteban-Gomez D; Platas-Iglesias C; Tei L, Mn(II) compounds as an alternative to Gd-based MRI probes. Future Med. Chem 2019, 11 (12), 1461–1483. [DOI] [PubMed] [Google Scholar]
- 28.Aime S; Botta M; Esteban-Gomez D; Platas-Iglesias C, Characterisation of magnetic resonance imagine (MRI) contrast agents using NMR relaxometry. Mol. Phys 2019, 117 (7–8), 898–909. [Google Scholar]
- 29.Li H; Meade TJ, Molecular Magnetic Resonance Imaging with Gd(III)-Based Contrast Agents: Challenges and Key Advances. J. Am. Chem. Soc 2019, 141 (43), 17025–17041. [DOI] [PMC free article] [PubMed] [Google Scholar]
- 30.Heffern MC; Matosziuk LM; Meade TJ, Lanthanide Probes for Bioresponsive Imaging. Chemical Reviews 2014, 114, 4496–4539. [DOI] [PMC free article] [PubMed] [Google Scholar]
- 31.Pellico J; Ellis CM; David JJ, Nanoparticle-Based Paramagnetic Contrast Agents for Magnetic Resonance Imaging. Contrast Media & Molecular Imaging 2019, 2019 (1845637), 1–13. [DOI] [PMC free article] [PubMed] [Google Scholar]
- 32.Estelrich J; Sanchez-Martin MJ; Busquts MA, Nanoparticles in magnetic resonance imaging: from simple to dual contrast agents. Int. J. Nanomed 10 (1727–1741), 1727. [DOI] [PMC free article] [PubMed] [Google Scholar]
- 33.J., D.-L.; Łazarczyk A; Hałubiec P; Szafrański O; Kamas K; Karewicz A, Superparamagnetic Iron Oxide Nanoparticles-Current and Prospective Medical Applications. Materials 2019, 12 (4), E617. [DOI] [PMC free article] [PubMed] [Google Scholar]
- 34.Grobner T, Gadolinium – a specific trigger for the development of nephrogenic fibrosing dermopathy and nephrogenic systemic fibrosis? Nephrol. Dial. Transplant 2006, 21 (4), 1104–1108. [DOI] [PubMed] [Google Scholar]
- 35.Committee, A., Gadolinium-Based Contrast Agents and Nephrogenic Systemic Fibrosis FDA Briefing Document 2009.
- 36.Bennett CL; Qureshi ZP; Sartor AO; Norris LB; Murday A; Xirasagar S; Thomsen HS, Gadolinium-induced nephrogenic systemic fibrosis: the rise and fall of an iatrogenic disease. Clin. Kidney J 2012, 5 (1), 82–88. [DOI] [PMC free article] [PubMed] [Google Scholar]
- 37.Solomon RJ; Natarajan MK; Doucet S; Sharma SK; Staniloae CS; Katholi RE; Gelormini JL; Labinaz M; Moreyra AE, Cardiac angiography in renally impaired patients (CARE) study: a randomized double-blind trial of contrast-induced nephropathy in patients with chronic kidney disease. Circulation 2007, 115 (25), 3189–3196. [DOI] [PubMed] [Google Scholar]
- 38.Persson PB; Hansell P; Liss P, Pathophysiology of contrast medium-induced nephropathy. Kidney Int 2005, 68 (1), 14–22. [DOI] [PubMed] [Google Scholar]
- 39.United States Renal Data System, 2016 USRDS Annual Data Report Volume 1: Chronic Kidney Disease in the United States National Institutes of Health, National Institue of Diabetes Digestive and Kidney Diseases: Bethesda, MD, 2016. [Google Scholar]
- 40.United States Renal Data System, 2016 USRDS Annual Data Report Volume 2: End-Stage Renal Disease in the United States National Institues of Health, National Instutide of Diabetes Digestive and Kidney Diseases: Bethesda, MD, 2016. [Google Scholar]
- 41.Kanda T; Kawaguchi H, Hyperintense dentate nucleas and globus pallidus on unenhanced T1-weighted MR images are associated with gadolinium-based contrast media. Neuroradiology 2013, 55, 1268–1269. [Google Scholar]
- 42.Kanda T; ishii K; Kawaguchi H; Kitajima K; Takenaka D, High signal intensity in the dentate nucleus and globus pallidus on unenhanced T1-weighted MR images: relationship with increasing cumulative dose of a gadolinium-based contrast material. Radiology 2014, 270, 834–841. [DOI] [PubMed] [Google Scholar]
- 43.Kanda T; Osawa M; Oba H; Toyoda K; Kotoku J; Haruyama T, High signal intensity in dentate nucleus on unenhanced T1-weighted MR images: association with linear versus macrocyclic gadolinium chelate administration. Radiology 2015, 275, 803–809. [DOI] [PubMed] [Google Scholar]
- 44.US Food and Drugs Administration https://www.fda.gov/drugs/drug-safety-and-availability/fda-drug-safety-communication-fda-warns-gadolinium-based-contrast-agents-gbcas-are-retained-body. (accessed 26 June 2019).
- 45.Kanda T, The new restrictions on the use of linear gadolinium-based contrast agents in Japan. Magn. Reson. Med. Sci 2019, 18 (1), 1–3. [DOI] [PMC free article] [PubMed] [Google Scholar]
- 46.Australian Therapeutic Good Administration https://www.tga.gov.au/alert/gadolinium-based-contrast-agents-mri-scans. (accessed 26 June 2019).
- 47.Semelka RC; Ramalho J; Vakharia A; AlObaidy M; Burke LM; Jay M; Ramalho M, Gadolinium deposition disease: Initial description of a disease that has been around for a while. Magn Reson Imaging 2016, 34 (10), 1383–1390. [DOI] [PubMed] [Google Scholar]
- 48.Semelka RC; Commander C; Jay M; Burke LMB; Ramalho M, Presumed Gadolinium Toxicity in Subjects With Normal Renal Function: A Report of 4 Cases. Invest Radiol 2016, 51 (10), 661–665. [DOI] [PubMed] [Google Scholar]
- 49.Semelka RC; Ramalho M; Jay M; Hickey L; Hickey J, Intravenous Calcium-/Zinc-Diethylene Triamine Penta-Acetic Acid in Patients With Presumed Gadolinium Deposition Disease: A Preliminary Report on 25 Patients. Invest. Radiol 2018, 53 (6), 373–379. [DOI] [PubMed] [Google Scholar]
- 50.Chandra T; Pukenas B; Mohan S; Melhem E, Contrast-Enhanced Magnetic Resonance Angiography. Magn. Reson. Imaging Clin. N. Am 2012, 20, 687–698. [DOI] [PubMed] [Google Scholar]
- 51.Jackson A; O’Connor JPB; Parker GJM; Jayson GC, Imaging Tumor Vascular Heterogeneity and Angiogenesis using Dynamic Contrast-Enhanced Magnetic Resonance Imaging. Clin. Cancer Res 2007, 13 (12), 3449–3459. [DOI] [PubMed] [Google Scholar]
- 52.Khouli RH; Macura KJ; Jacobs MA; Khalil TH; Kamel IR; Dwyer A; Bluemke DA, Dynamic Contrast-Enhanced MRI of the Breast: Quantitative Method for Kinetic Curve Type Assessment. Am. J. Roentgenol 2009, 193 (4), W295–W300. [DOI] [PMC free article] [PubMed] [Google Scholar]
- 53.Vander Elst L; Sessoye A; Laurent S; Muller RN, Can the Theoretical Fitting of the Proton-Nuclear-Magnetic-Relaxation-Dispersion (Proton NMRD) Curves of Paramagnetic Complexes Be Improved by Independent Measurements of their Self-Diffusion Coefficients? Helv. Chim. Acta 2005, 88 (3), 574–587. [Google Scholar]
- 54.Kálmán FK; Woods M; Caravan P; Jurek P; Spiller M; Tircsó G; Király R; Brücher E; Sherry AD, Potentiometric and Relaxometric Properties of a Gadolinium-Based MRI Contrast Agent for Sensing Tissue pH. Inorg. Chem 2007, 46 (13), 5260–5270. [DOI] [PMC free article] [PubMed] [Google Scholar]
- 55.Elhabiri M; Abada S; Sy M; Nonat A; Choquet P; Esteban-Gomez D; Cassino C; Platas-Iglesias C; Botta M; J., C. L., Importance of Outer-Sphere and Aggregation Phenomena in the Relaxation Properties of Phosphonated Gadolinium Complexes with Potential Applications as MRI Contrast Agents. Chem. Eur. J 2015, 21 (17), 6535–6546. [DOI] [PubMed] [Google Scholar]
- 56.Swift TJ; Connick RE, NMR-Relaxation Mechanisms of O17 in Aqueous Solutions of Paramagnetic Cations and the LIfetime of Water Molecules in the First Coordination Sphere. J. Chem. Phys 1962, 37 (2), 307–320. [Google Scholar]
- 57.Gale EM; Zhu J; Caravan P, Direct measurement of the Mn(II) hydration state in metal complexes and metalloproteins through 17O NMR line widths. J Am Chem Soc 2013, 135 (49), 18600–8. [DOI] [PMC free article] [PubMed] [Google Scholar]
- 58.Peters JA; Geraldes CFGC, A Semi-Empirical Method for the Estimation of the Hydration Number of Mn(II)-Complexes. Inorganics 2018, 6, 116. [Google Scholar]
- 59.Esteban-Gomez D; Cassino C; Botta M; Platas-Iglesias C, 17O and 1H relaxometric and DFT study of hyperfine coupling constants in [Mn(H2O)6]2+. RSC Advances 2014, 4 (14), 7094–7103. [Google Scholar]
- 60.Caravan P; Farrar CT; Frullano L; Uppal R, Influence of molecular parameters and increasing magnetic field strength on relaxivity of gadolinium- and manganese-based T1-contrast agents. Contrast Media. Mol. Imag 2009, (4), 89–100. [DOI] [PMC free article] [PubMed] [Google Scholar]
- 61.Helm L, Optimization of gadolinium-based MRI contrast agents for high magnetic-field applications. Future Med. Chem 2010, 2 (3), 385. [DOI] [PubMed] [Google Scholar]
- 62.Rummeny EJ; Torres CG; Kurdziel JC; Nilsen G; OpdeBeeck B; Lundby B, MnDPDP for MR imaging of the liver - Results of an independent image evaluation of the European phase III studies. Acta Radiol 1997, 38 (4), 638–642. [DOI] [PubMed] [Google Scholar]
- 63.Toft KG; Hustvedt SO; Grant D; Martinsen I; Gordon PB; Friisk GA; Korsmo ÅJ; Skotland T, Metabolism and pharmacokinetics of MnDPDP in man. Acta Radiol 1997, 38 (5), 677–689. [DOI] [PubMed] [Google Scholar]
- 64.Gallez B; Bacic G; Swartz HM, Evidence for the dissociation of the hepatobiliary MRI contrast agent Mn-DPDP. Magn. Reson. Med 1996, 35 (1), 14–19. [DOI] [PubMed] [Google Scholar]
- 65.Vogl TJ; Hamm B; Schnell B; McMahon C; Branding G; LIssner J; Wolf K-J, Mn-DPDP enhancement patterns of hepatocellular lesions on MR images. J. Magn. Res. Imag 1993, 3 (1), 51–58. [DOI] [PubMed] [Google Scholar]
- 66.Hu TC-C; Pautler RG; MacGowan GA; Koretsky AP, Manganese‐enhanced MRI of mouse heart during changes in inotropy. Magn. Reson. Med 2001, 46 (5), 884–890. [DOI] [PubMed] [Google Scholar]
- 67.Leoni L; Dhyani AH; La Riviere P; Vogt S; Lai B; Roman BB, β‐Cell subcellular localization of glucose‐stimulated Mn uptake by X‐ray fluorescence microscopy: implications for pancreatic MRI. Contrast Media & Molecular Imaging 2011, 6 (6), 474–481. [DOI] [PMC free article] [PubMed] [Google Scholar]
- 68.Storey P; Danias PG; Post M; Li W; Seoane PR; Harnish PP; Edelman RR; Prasad PV, Preliminary Evaluation of EVP 1001–1: A New Cardiac-Specific Magnetic Resonance Contrast Agent with Kinetics Suitable for Steady-State Imaging of the Ischemic Heart. Invest. Radiol 2003, 38 (10), 642–652. [DOI] [PubMed] [Google Scholar]
- 69.Wolf GL; Baum L, ardiovascular toxicity and tissue proton T1 response to manganese injection in the dog and rabbit. AJR Am J Roentgenol 1983, 141 (1), 193–197. [DOI] [PubMed] [Google Scholar]
- 70.Yanaga T; Holland WC, Effect of manganese on transmembrane potential and contractility of atrial muscle. Am. J. Physiol 1969, 217 (5), 1280–1285. [DOI] [PubMed] [Google Scholar]
- 71.Eriksson P-O; Aaltonen E; Petoral RM Jr.; Lauritzson P; Miyazaki H; Pietras K; Mansson S; Hansson L; Leander P; Axelsson O, Novel Nano-Sized MR Contrast Agent Mediates Strong Tumor Contrast Enhancement in an Oncogene-Driven Breast Cancer Model. PLOS one 2014, 9 (10), e107762. [DOI] [PMC free article] [PubMed] [Google Scholar]
- 72.Gianolio E; Bäckström S; Petoral RM Jr.; Olsson A; Aime S; Axelsson O, Characterization of a Manganese-Containing Nanoparticle as an MRI Contrast Agent. European Journal of Inorganic Chemistry 2019, 2019 (13), 1759–1766. [Google Scholar]
- 73.Pujales-Paradela R; Carniato F; Esteban-Gomez D; Botta M; Platas-Iglesias C, Controlling water exchange rates in potential Mn2+-based MRI agents derived from NO2A2−. Dalton Trans 2019, 48 (12), 3962–3972. [DOI] [PubMed] [Google Scholar]
- 74.Maigut J; Meier R; Zahl A; van Eldik R, Effect of chelate dynamics on water exchange reactions of paramagnetic aminopolycarboxylate complexes. Inorg. Chem 2008, 47 (13), 5702–5719. [DOI] [PubMed] [Google Scholar]
- 75.Maigut J; Meier R; Zahl A; van Eldik R, Triggering Water Exchange Mechanisms via Chelate Architecture. Shielding of Transition Metal Centers by Aminopolycarboxylate Spectator Ligands. J. Am. Chem. Soc 2008, 130, 14556–14569. [DOI] [PubMed] [Google Scholar]
- 76.Drahoš B; Lukeš I; Tóth E, Mn(II) complexes as potential contrast agents for MRI. Eur. J. Inorg. Chem 2012, 2012 (12), 1975–1986. [Google Scholar]
- 77.Forgacs A; Tei L; Baranyai Z; Esteban-Gomez D; Platas-Iglesias C; Botta M, Optimising the relaxivities of Mn2+ complexes by targeting human serum albumin (HSA). Dalton Trans 2017, 46 (26), 8494–8504. [DOI] [PubMed] [Google Scholar]
- 78.Botar R; Molnar E; Trencsenyi G; Kiss J; Kalman F; Tircsó G, Stable and inert Mn(II)-based and pH responsive contrast agents. J Am Chem Soc 2020, ASAP, 10.1021/jacs.9b09407. [DOI] [PubMed] [Google Scholar]
- 79.Gale EM; Atanasova I; Blasi F; Ay I; Caravan P, A Manganese Alternative to Gadolinium for MRI Contrast. J. Am. Chem. Soc 2015, 137 (49), 15548–15557. [DOI] [PMC free article] [PubMed] [Google Scholar]
- 80.Laurent S; Vander Elst L; Henoumon C; Muller RN, How to Measure the transmetallation of a gadolinium complex. Contrast Media. Mol. Imag 2010, 5, 305–308. [DOI] [PubMed] [Google Scholar]
- 81.Laurent S; Elst LV; Copoix F; Muller RN, Stability of MRI paramagnetic contrast media: a proton relaxometric protocol for transmetallation assessment. Invest Radiol 2001, 36 (2), 115–22. [DOI] [PubMed] [Google Scholar]
- 82.Kálmán FK; Tircsó G, Kinetic inertness of the Mn complexes formed with AAZTA and some open-chain EDTA derivatives. Inorg. Chem 2012, 51 (19), 10065–10067. [DOI] [PubMed] [Google Scholar]
- 83.Drahoš B; Kotek J; Císařová I; Hermann P; Helm L; Lukeš I; Tóth E, Mn2+ complexes with 12-member pyridine based macrocycles bearing carboxylate or phosphonate pendant arm: crystallographic, thermodynamic, kinetic, redox and 1H/ 17O relaxation studies. Inorg. Chem 2011, 50 (24), 12785–12801. [DOI] [PubMed] [Google Scholar]
- 84.Drahoš B; Kotek J; Hermann P; Lukeš I; Tóth E, Mn2+ complexes with pyridine containing 15-membered macrocycles: thermodynamic, kinetic, crystallographic and 1H/ 17O relaxation studies. Inorg. Chem 2010, 49 (7), 3224–3238. [DOI] [PubMed] [Google Scholar]
- 85.Sarka L; Burai L; Brucher E, The Rates of the Exchange Reactions between [Gd(DTPA)]2ÿ and the Endogenous Ions Cu2‡ and Zn2‡: A Kinetic Model for the Prediction of the In Vivo Stability of [Gd(DTPA)]2ÿ, Used as a Contrast Agent in Magnetic Resonance Imaging. Chem. Eur. J 2000, 6 (4), 719–724. [DOI] [PubMed] [Google Scholar]
- 86.Wang J; Wang H; Ramsay IA; Erstad DJ; Fuchs BC; Tanabe KK; Caravan P; Gale EM, Manganese-Based Contrast Agents for Magnetic Resonance Imaging of Liver Tumors: Structure-Activity Relationships and Lead Candidate Evaluation. J. Med. Chem 2018, 61 (19), 8811–8824. [DOI] [PMC free article] [PubMed] [Google Scholar]
- 87.Rohrer M; Bauer H; Mintorovitch J; Requardt M; Weinmann H-J, Comparison of magnetic properties of MRI contrast media solutions at different magnetic field strengths. Invest. Radiol 2005, 40 (11), 715–724. [DOI] [PubMed] [Google Scholar]
- 88.Gale EM; Wey HY; Ramsay I; Yen YF; Sosnovik D; Caravan P, A Manganese-Based Alternative to Gadolinium: Contrast Enhanced MR Angiography, Pharmacokinetics, and Metabolism. Radiology 2018, 286 (3), 865–872. [DOI] [PMC free article] [PubMed] [Google Scholar]
- 89.Erstad DJ; Ramsay IA; Jordan VC; Sojoodi M; Fuchs BC; Tanabe KK; Caravan P; Gale EM, Tumor Contrast Enhancement and Whole-Body Elimination of the Manganese-Based Magnetic Resonance Imaging Contrast Agent Mn-PyC3A. Invest. Radiol 2019, 54 (11), 697–703. [DOI] [PMC free article] [PubMed] [Google Scholar]
- 90.Islam MK; Kim S; Kim H-K; Kim Y-H; Lee Y-L; Choi G; Baek AR; Sung BK; Kim M; Cho AE; Kang H; Lee G-H; Choi SH; Lee T; Park J-A; Chang Y, Synthesis and Evaluation of Manganese(II)-Based Ethylenediaminetetraacetic Acid−Ethoxybenzyl Conjugate as a Highly Stable Hepatobiliary Magnetic Resonance Imaging Contrast Agent. Bioconjugate Chem 2018, 29 (11), 3614–3625. [DOI] [PubMed] [Google Scholar]
- 91.Islam MK; Kim S; Kim HK; Park S; Lee GH; Kang HJ; Jung JC; Park JS; Kim TJ; Chan Y, Manganese Complex of Ethylenediaminetetraacetic Acid (EDTA)-Benzothiazole Aniline (BTA) Conjugate as a Potential Liver-Targeting MRI Contrast Agent. Journal of Medicinal Chemistry 2017, 60 (7), 2993–3001. [DOI] [PubMed] [Google Scholar]
- 92.Koenig SH; Brown RD III; Spiller M, The Anamolous Relaxivity of Mn3+(TPPS4). Magn. Reson. Med 1987, 4, 252–260. [DOI] [PubMed] [Google Scholar]
- 93.Ogan M; Revel D; Brasch R, Metalloporphyrin Contrast Enhancement of Tumors in Magnetic Resonance Imaging A Study of Human Carcinoma, Lymphoma, and Fibrosarcoma in Mice. Invest Radiol 1987, 22 (10), 822–828. [DOI] [PubMed] [Google Scholar]
- 94.Furmanski P; Longley C, Metalloporphyrin Enhancement of Magnetic Resonance Imaging of Human Tumor Xenografts in Nude Mice. Cancer Research 1988, 48 (16), 4604–4610. [PubMed] [Google Scholar]
- 95.Fiel RJ; Musser DA; Mark EH; Mazurchuk R; Alletto JJ, A comparative study of manganese meso-sulfonatophenyl porphyrins: contrast-enhancing agents for tumors. Magn Reson Imaging 1990, 8 (3), 255–9. [DOI] [PubMed] [Google Scholar]
- 96.Schmiedl UP; Nelson JA; Robinson DH; Michalson A; Starr F; Frenzel T; Ebert W; Schumanngiampieri G, PHARMACEUTICAL PROPERTIES, BIODISTRIBUTION, AND IMAGING CHARACTERISTICS OF MANGANESE-MESOPORPHYRIN - A POTENTIAL HEPATOBILIARY CONTRAST AGENT FOR MAGNETIC-RESONANCE-IMAGING. Investigative Radiology 1993, 28 (10), 925–932. [DOI] [PubMed] [Google Scholar]
- 97.Schmiedl UP; Nelson JA; Starr FL; Schmidt R, HEPATIC CONTRAST-ENHANCING PROPERTIES OF MANGANESE-MESOPORPHYRIN AND MANGANESE-TPPS4 - A COMPARATIVE MAGNETIC-RESONANCE-IMAGING STUDY IN RATS. Investigative Radiology 1992, 27 (7), 536–542. [DOI] [PubMed] [Google Scholar]
- 98.Cheng W; Haedicke IE; Nofiele J; Martinez F; Beera K; Scholl TJ; Cheng H-LM; Zhang X. a., Complementary Strategies for Developing Gd-Free High-Field T1 MRI Contrast Agents Based on Mn(III) Porphyrins. J. Med. Chem 2014, 57, 516–520. [DOI] [PubMed] [Google Scholar]
- 99.Cheng W; Ganesh T; Martinez F; Lam J; Yoon H; Macgregor RB; Scholl TJ; Cheng H-LM; Zhang X. a., Binding of a dimeric manganese porphyrin to serum albumin: towards a gadolinium-free blood-pool T 1 MRI contrast agent. JBIC Journal of Biological Inorganic Chemistry 2014, 19 (2), 229–235. [DOI] [PubMed] [Google Scholar]
- 100.Cheng HLM; Haedicke IE; Cheng WR; Nofiele JT; Zhang XA, Gadolinium-Free T-1 Contrast Agents for MRI: Tunable Pharmacokinetics of a New Class of Manganese Porphyrins. Journal of Magnetic Resonance Imaging 2014, 40 (6), 1474–1480. [DOI] [PubMed] [Google Scholar]
- 101.Nofiele JT; Haedicke IE; Zhu YLK; Zhang X.-a.; Cheng H-LM, Gadolinium-Free Extracellular MR Contrast Agent for Tumor Imaging. J. Magn. Res. Imag 2015, 41 (2), 397–402. [DOI] [PubMed] [Google Scholar]
- 102.Lyon RC; Faustino PJ; Cohen JS; Katz A; Mornex F; Colcher D; Baglin C; Koenig SH, Tissue Distribution and Stability of Metalloporhyrin MRI Contrast Agents. Magn. Reson. Med 1987, 4 (1), 24–33. [DOI] [PubMed] [Google Scholar]
- 103.Barandov A; Bartelle BB; Williamson CG; Loucks ES; Lippard SJ; Jasanoff A, Sensing intracellular calcium ions using a manganese-based MRI contrast agent. Nature. Commun 2019, 10 (1). [DOI] [PMC free article] [PubMed] [Google Scholar]
- 104.Barandov A; Bartelle BB; Gonzalez BA; White WL; Lippard SJ; Jasanoff A, Membrane-Permeable Mn(III) Complexes for Molecular Magnetic Resonance Imaging of Intracellular Targets. J. Am. Chem. Soc 2016, 138 (17), 5483–5486. [DOI] [PMC free article] [PubMed] [Google Scholar]
- 105.Fraga CG, Relevance, essentiality and toxicity of trace elements in human health. Molecular Aspects of Medicine 2005, 26 (4), 235–244. [DOI] [PubMed] [Google Scholar]
- 106.Bloch J; Navon G, A nuclear magnetic resonance relaxation study of iron(III) EDTA in aqueous solution. J. Inorg. Nucl. Chem 1980, 42 (5), 693–699. [Google Scholar]
- 107.Jenkins BG; Armstrong E; Lauffer RB, SITE-SPECIFIC WATER PROTON RELAXATION ENHANCEMENT OF IRON(III) CHELATES NONCOVALENTLY BOUND TO HUMAN SERUM-ALBUMIN. Magn.Reson.Med 1991, 17 (1), 164–178. [DOI] [PubMed] [Google Scholar]
- 108.Mizuno M; Funahashi S; Nakasuka N; Tanaka M, Water Exchange of the (o-Phenylene-N,N,N’N’-tetraaceto)ferrate(III) Complex in Aqueous Solution As Studied by Variable-Temperature, -Pressure, and -Frequency Oxygen-17 NMR Techniques. Inorg. Chem 1991, 30 (7), 1550–1553. [Google Scholar]
- 109.Brausam A; Maigut J; Meier R; Szilagyi PA; Buschmann H-J; Massa W; Homannay Z; van Eldik R, Detailed Spectroscopic, Thermodynamic, and Kinetic Studies on the Protolytic Equilibria of FeIIIcydta and the Activation of Hydrogen Peroxide. Inorg. Chem 2009, 48 (16), 7864–7884. [DOI] [PubMed] [Google Scholar]
- 110.Wang H; Clavijo Jordan V; Ramsay IA; Sojoodi M; Fuchs BC; Tanabe KK; Caravan P; Gale EM, Molecular Magnetic Resonance Imaging Using a Redox-Active Iron Complex. J. Am. Chem. Soc 2019, 141 (14), 5916–5925. [DOI] [PMC free article] [PubMed] [Google Scholar]
- 111.Snyder EM; Asik D; Abozeid S; Burgio A; Bateman G; Turowski SG; Spernyak JA; Morrow JR, A Class of Fe III Macrocyclic Complexes With Alcohol Donor Groups as Effective T1 MRI Contrast Agents. Angew. Chem. Int. Ed 2020, 59 (6), 2414–2419. [DOI] [PMC free article] [PubMed] [Google Scholar]
- 112.Tsitovich PB; Gendron F; Nazarenko AY; Livesay BN; Lopez AP; Shores MP; Autschbach J; Morrow JR, Low-Spin Fe(III) Macrocyclic Complexes of Imidazole-Appended 1,4,7-Triazacyclononane as Paramagnetic Probes. Inorg. Chem 2018, 57 (14), 8364–8374. [DOI] [PubMed] [Google Scholar]
- 113.Fornasiero D; Bellen JC; Baker RJ; Chatterton BE, Paramagnetic complexes of manganese (II), iron (III), and gadolinium (III) as contrast agents for magnetic resonance imaging. The influence of stability constants on the biodistribution of radioactive aminopolycarboxylate complexes. Investigative radiology 1987, 22 (4), 322–327. [DOI] [PubMed] [Google Scholar]
- 114.Kálmán FK; Tircsó G, Kinetic inertness of the Mn2+ complexes formed with AAZTA and some open-chain EDTA derivatives. Inorganic Chemistry 2012, 51 (19), 10065–10067. [DOI] [PubMed] [Google Scholar]
- 115.Lauffer RB, Paramagnetic metal complexes as water proton relaxation agents for NMR imaging: theory and design. Chem. Rev 1987, 87, 901–927. [Google Scholar]
- 116.Lauffer RB; Greif WL; Stark DD; Vincent AC; Saini S; Wedeen VJ; Brady TJ, Iron-EHPG as an hepatobilliary MR contrast agent: initial imaging and biodistribution studies. J. Comput. Assist. Tomogr 1985, 9 (3), 431–438. [DOI] [PubMed] [Google Scholar]
- 117.Boehm-Sturm P; Haeckel A; Hauptmann R; Mueller S; Kuhl CK; Schellenberger EA, Low-Molecular-Weight Iron Chelates May Be an Alternative to Gadolinium-based Contrast Agents for T1-weighted Contrast-enhanced MR Imaging. Radiology 2018, 286 (2), 537–546. [DOI] [PubMed] [Google Scholar]
- 118.Wu B; Warnock G; Zaiss M; Lin C; Chen M; Zhou Z; Mu L; Nanz D; Tuura R; Delso G, An overview of CEST MRI for non-MR physicists. EJNMMI Physics 2016, 3, 19. [DOI] [PMC free article] [PubMed] [Google Scholar]
- 119.Vinogradov E; Sherry AD; Lenkinski RE, CEST: From basic principles to applications, challenges and opportunities. Journal of Magnetic Resonance 2013, 229, 155–172. [DOI] [PMC free article] [PubMed] [Google Scholar]
- 120.Zijl P. v.; Yadav N, Chemical exchange saturation transfer (CEST): what is in a name and what isn’t? Magn.Reson.Med 2011, 65, 927–948. [DOI] [PMC free article] [PubMed] [Google Scholar]
- 121.Zhang SR; Merritt M; Woessner DE; Lenkinski RE; Sherry AD, PARACEST agents: Modulating MRI contrast via water proton exchange. Accounts Chem. Res 2003, 36 (10), 783–790. [DOI] [PubMed] [Google Scholar]
- 122.Anemone A; Consolino L; Longo DL, MRI-CEST assessment of tumour perfusion using X-ray iodinated agents: comparison with a conventional Gd-based agent. European Radiology 2017, 27 (5), 2170–2179. [DOI] [PubMed] [Google Scholar]
- 123.Aime S; Calabi L; Biondi L; De Miranda M; Ghelli S; Paleari L; Rebaudengo C; Terreno E, Iopamidol: Exploring the potential use of a well-established X-ray contrast agent for MRI. Magn.Reson.Med 2005, 53 (4), 830–834. [DOI] [PubMed] [Google Scholar]
- 124.Henkelman RM; Stanisz GJ; Graham SJ, Magnetization transfer in MRI: a review. NMR Biomed 2001, 14 (2), 57–64. [DOI] [PubMed] [Google Scholar]
- 125.Woods M; Woessner DE; Sherry AD, Paramagnetic lanthanide complexes as PARACEST agents for medical imaging. Chemical Society reviews 2006, 35, 500–11. [DOI] [PMC free article] [PubMed] [Google Scholar]
- 126.Le Fur M; Rotile NJ; Correcher C; Clavijo Jordan V; Ross AW; Catana C; Caravan P, Yttrium-86 Is a Positron Emitting Surrogate of Gadolinium for Noninvasive Quantification of Whole-Body Distribution of Gadolinium-Based Contrast Agents. Angew. Chem. Int. Ed 2020, 59 (4), 1474–1478. [DOI] [PMC free article] [PubMed] [Google Scholar]
- 127.Burns PJ; Cox JM; Morrow JR, Imidazole-appended macrocyclic complexes of Fe(II), Co(II), and Ni(II) as paraCEST agents. Inorganic Chemistry 2017, 56 (8), 4545–4554. [DOI] [PubMed] [Google Scholar]
- 128.Dorazio SJ; Morrow JR, Iron(II) complexes containing octadentate tetraazamacrocycles as paraCEST magnetic resonance imaging contrast agents. Inorganic Chemistry 2012, 51 (14), 7448–7450. [DOI] [PubMed] [Google Scholar]
- 129.Dorazio SJ; Tsitovich PB; Siters KE; Spernyak JA; Morrow JR, Iron(II) PARACEST MRI Contrast Agents. Journal of the American Chemical Society 2011, 133 (36), 14154–14156. [DOI] [PMC free article] [PubMed] [Google Scholar]
- 130.Tsitovich PB; Morrow JR, Macrocyclic ligands for Fe(II) paraCEST and chemical shift MRI contrast agents. Inorganica Chimica Acta 2012, 393, 3–11. [Google Scholar]
- 131.Tsitovich PB; Cox JM; Spernyak JA; Morrow JR, Gear Up for a pH Shift: A Responsive Iron(II) 2-Amino-6-picolyl-Appended Macrocyclic paraCEST Agent That Protonates at a Pendent Group. Inorganic Chemistry 2016, 55 (22), 12001–12010. [DOI] [PMC free article] [PubMed] [Google Scholar]
- 132.Olatunde AO; Bond CJ; Dorazio SJ; Cox JM; Benedict JB; Daddario MD; Spernyak JA; Morrow JR, Six, Seven or Eight Coordinate Fe-II, Co-II or Ni-II Complexes of Amide-Appended Tetraazamacrocycles for ParaCEST Thermometry. Chemistry-a European Journal 2015, 21 (50), 18290–18300. [DOI] [PMC free article] [PubMed] [Google Scholar]
- 133.Olatunde AO; Cox JM; Daddario MD; Spernyak JA; Benedict JB; Morrow JR, Seven-coordinate CoII, FeII and six-coordinate NiII amide-appended macrocyclic complexes as paracest agents in biological media. Inorganic Chemistry 2014, 53 (16), 8311–8321. [DOI] [PMC free article] [PubMed] [Google Scholar]
- 134.Abozeid SM; Snyder EM; Lopez AP; Steuerwald CM; Sylvester E; Ibrahim KM; Zaky RR; Abou-El-Nadar HM; Morrow JR, Nickel(II) complexes as paramagnetic shift and paraCEST agents. European Journal of Inorganic Chemistry 2018, 2018 (18), 1902–1908. [Google Scholar]
- 135.Dorazio SJ; Olatunde AO; Spernyak JA; Morrow JR, CoCEST: cobalt(II) amide-appended paraCEST MRI contrast agents. Chem. Commun 2013, 49 (85), 10025–10027. [DOI] [PMC free article] [PubMed] [Google Scholar]
- 136.Abozeid SM; Snyder EM; Tittiris TY; Steuerwald CM; Nazarenko AY; Morrow JR, Inner-sphere and outer-sphere water interactions in Co(II) paraCEST agents. Inorganic Chemistry 2018, 57 (4), 2085–2095. [DOI] [PubMed] [Google Scholar]
- 137.Thorarinsdottir AE; Tatro SM; Harris TD, Electronic Effects of Ligand Substitution in a Family of CoII2 PARACEST pH Probes. Inorg. Chem 2018, 57 (17), 11252–11263. [DOI] [PubMed] [Google Scholar]
- 138.Du K; Harris TD, A Cu-2(II) Paramagnetic Chemical Exchange Saturation Transfer Contrast Agent Enabled by Magnetic Exchange Coupling. Journal of the American Chemical Society 2016, 138 (25), 7804–7807. [DOI] [PubMed] [Google Scholar]
- 139.Murthy NN; Karlin KK; Bertini I; Luchinat C, NMR and Electronic Relaxation in Paramagnetic Dicopper(II) Compounds. J. Am. Chem. Soc 1997, 119 (9), 2156–2162. [Google Scholar]
- 140.Paech D; Schuenke P; Koehler C; Windschuh J; Mundiyanapurath S; Bickelhaupt S; Bonekamp D; Baumer P; Bachert P; Ladd ME; Bendszus M; Wick W; Unterberg A; Schlemmer HP; Zaiss M; Radbruch A, T1 rho- weighted Dynamic Glucose-enhanced MR Imaging in the Human Brain. Radiology 2017, 285 (3), 914–922. [DOI] [PubMed] [Google Scholar]
- 141.Anemone A; Consolino L; Arena F; Capozza M; Longo DL, Imaging tumor acidosis: a survey of the available techniques for mapping in vivo tumor pH. Cancer and Metastasis Reviews 2019, 38 (1–2), 25–49. [DOI] [PMC free article] [PubMed] [Google Scholar]
- 142.Muller-Lutz A; Khalil N; Schmitt B; Jellus V; Pentang G; Oeltzschner G; Antoch G; Lanzman RS; Wittsack H-J, Pilot study of Iopamidol-based quantitative pH imaging on a clinical 3T MR scanner. Magn. Reson. Mater. Phys 2014, 27 (6), 477–485. [DOI] [PubMed] [Google Scholar]
- 143.Jones KM; Randtke EA; Yoshimaru ES; Howison CM; Chalasani P; Klein RR; Chambers SK; Kuo PH; Pagel MD, Clinical Translation of Tumor Acidosis Measurements with AcidoCEST MRI. Mol. Imaging Biol 2017, 19 (4), 617–625. [DOI] [PMC free article] [PubMed] [Google Scholar]
- 144.Delli Castelli D; Ferrauto G; Cutrin JC; Terreno E; Aime S, In vivo maps of extracellular pH in murine melanoma by CEST–MRI. Magn.Reson.Med 2014, 71 (1), 326–332. [DOI] [PubMed] [Google Scholar]
- 145.Ferrauto G; Di Gregorio E; Auboiroux V; Petit M; Berger F; Aime S; Lahrech CEST -MRI for glioma pH quantification in mouse model: Validation by immunohistochemistry. NMR Biomed 2018, 31 (11), e4005. [DOI] [PubMed] [Google Scholar]
- 146.Coman D; Huang Y; Rao JU; De Feyter HM; Rothman DL; Juchem C; Hyder F, Imaging the intratumoral-peritumoral extracellular pH gradient of gliomas. NMR Biomed 2016, 29 (3), 309–319. [DOI] [PMC free article] [PubMed] [Google Scholar]
- 147.Yoo B; Sheth VR; Howison CM; Douglas MJK; Pineda CT; Maine EA; Baker AF; Pagel MD, Detection of in vivo enzyme activity with CatalyCEST MRI. Magn.Reson.Med 2014, 71 (3), 1221–1230. [DOI] [PMC free article] [PubMed] [Google Scholar]
- 148.Yoo B; Raam MS; Rosenblum RM; Pagel MD, Enzyme-responsive PARACEST MRI contrast agents: a new biomedical imaging approach for studies of the proteasome. Contrast Media & Molecular Imaging 2007, 2 (4), 189–198. [DOI] [PubMed] [Google Scholar]
- 149.Yoo B; Pagel MD, A PARACEST MRI Contrast Agent To Detect Enzyme Activity. Journal of the American Chemical Society 2006, 128 (43), 14032–14033. [DOI] [PubMed] [Google Scholar]
- 150.Suchy M; Ta R; Li AX; Wojciechowski F; Pasternak SH; Bartha R; Hudson RHE, A paramagnetic chemical exchange-based MRI probe metabolized by cathepsin D: design, synthesis and cellular uptake studies. Organic & Biomolecular Chemistry 2010, 8 (11), 2560–2566. [DOI] [PubMed] [Google Scholar]
- 151.Chauvin T; Durand P; Bernier M; Meudal H; Doan B-T; Noury F; Badet B; Beloeil J-C; Tóth É, Detection of Enzymatic Activity by PARACEST MRI: A General Approach to Target a Large Variety of Enzymes. Angewandte Chemie International Edition 2008, 47 (23), 4370–4372. [DOI] [PubMed] [Google Scholar]
- 152.Daryaei I; Jones KM; Pagel MD, Detection of DT-diaphorase Enzyme with a ParaCEST MRI Contrast Agent. Chemistry – A European Journal 2017, 23 (27), 6514–6517. [DOI] [PMC free article] [PubMed] [Google Scholar]
- 153.Li Y; Sheth VR; Liu G; Pagel MD, A self-calibrating PARACEST MRI contrast agent that detects esterase enzyme activity. Contrast Media & Molecular Imaging 2011, 6 (4), 219–228. [DOI] [PMC free article] [PubMed] [Google Scholar]
- 154.Coman D; de Graaf RA; Rothman DL; Hyder F, In vivo three-dimensional molecular imaging with Biosensor Imaging of Redundant Deviation in Shifts (BIRDS) at high spatiotemporal resolution. NMR in Biomedicine 2013, 26 (11), 1589–1595. [DOI] [PMC free article] [PubMed] [Google Scholar]
- 155.Schmidt R; Nippe N; Strobel K; Masthoff M; Reifschneider O; Castelli DD; Höltke C; Aime S; Karst U; Sunderkötter C; Bremer C; Faber C, Highly shifted proton MR imaging: Cell tracking by using direct detection of paramagnetic compounds. Radiology 2014, 272 (3), 785–795. [DOI] [PubMed] [Google Scholar]
- 156.Srivastava K; Weitz EA; Peterson KL; Marjanska M; Pierre VC, Fe- and Ln-DOTAm-F12 Are Effective Paramagnetic Fluorine Contrast\ Agents for MRI in Water and Blood. Inorg. Chem 2017, 56 (3), 1546–1557. [DOI] [PubMed] [Google Scholar]
- 157.Tsitovich PB; Tittiris TY; Cox JM; Benedict JB; Morrow JR, Fe(ii) and Co(ii) N-methylated CYCLEN complexes as paraSHIFT agents with large temperature dependent shifts. Dalton Transactions 2018, 47 (3), 916–924. [DOI] [PubMed] [Google Scholar]
- 158.Tsitovich PB; Cox JM; Benedict JB; Morrow JR, Six-coordinate Iron(II) and Cobalt(II) paraSHIFT Agents for Measuring Temperature by Magnetic Resonance Spectroscopy. Inorganic Chemistry 2016, 55 (2), 700–716. [DOI] [PMC free article] [PubMed] [Google Scholar]
- 159.O’Neill ES; Kolanowski JL; Bonnitcha PD; New EJ, A cobalt(II) complex with unique paraSHIFT responses to anions. Chem. Commun 2017, 53 (25), 3571–3574. [DOI] [PubMed] [Google Scholar]
- 160.Pujales-Paradela R; Savić T; Brandariz I; Pérez-Lourido P; Angelovski G; Esteban-Gómez D; Platas-Iglesias C, Reinforced Ni(II)-cyclam derivatives as dual 1H/19F MRI probes. Chem. Commun 2019, 55 (28), 4115–4118. [DOI] [PubMed] [Google Scholar]
- 161.Srivastava K; Ferrauto G; Young VG Jr.; Aime S; Pierre VC, Eight-Coordinate, Stable Fe(II) Complex as a Dual 19F and CEST Contrast Agent for Ratiometric pH Imaging. Inorg. Chem 2017, 56 (20), 12206–12213. [DOI] [PubMed] [Google Scholar]
- 162.Bleany B, Nuclear Magnetic Resonance Shifts in Solution Due to Lanthanide Ions. J. Magn. Res 1972, 8 (1), 91–100. [Google Scholar]
- 163.Xie D; Yu M; Kadakia RT; Que EL, 19F Magnetic Resonance Activity-Based Sensing Using Paramagnetic Metals. Acc. Chem. Res 2020, 53 (1), 2–10. [DOI] [PubMed] [Google Scholar]
- 164.Khurana A; Chapelin F; Xu HY; Acevedo JR; Molinolo A; Nguyen Q; Ahrens ET, Visualization of macrophage recruitment in head and neck carcinoma model using fluorine-19 magnetic resonance imaging. Magn.Reson.Med 2018, 79 (4), 1972–1980. [DOI] [PMC free article] [PubMed] [Google Scholar]
- 165.Zhong J; Narsinh K; Morel PA; Xu HY; Ahrens ET, In Vivo Quantification of Inflammation in Experimental Autoimmune Encephalomyelitis Rats Using Fluorine-19 Magnetic Resonance Imaging Reveals Immune Cell Recruitment outside the Nervous System. Plos One 2015, 10 (10), 13. [DOI] [PMC free article] [PubMed] [Google Scholar]
- 166.Ahrens ET; Helfer BM; O’Hanlon CF; Schirda C, Clinical Cell Therapy Imaging Using a Perfluorocarbon Tracer and Fluorine-19 MRI. Magn.Reson.Med 2014, 72 (6), 1696–+. [DOI] [PMC free article] [PubMed] [Google Scholar]
- 167.Ruiz-Cabello J; Barnett BP; Bottomley PA; Bulte JWM, Fluorine (19F) MRS and MRI in biomedicine. NMR in Biomedicine 2011, 24 (2), 114–129. [DOI] [PMC free article] [PubMed] [Google Scholar]
- 168.Barnett BP; Ruiz-Cabello J; Hota P; Ouwerkerk R; Shamblott MJ; Lauzon C; Walczak P; Gilson WD; Chacko VP; Kraitchman DL; Arepally A; Bulte JWM, Use of perfluorocarbon nanoparticles for non-invasive multimodal cell tracking of human pancreatic islets. Contrast Media & Molecular Imaging 2011, 6 (4), 251–259. [DOI] [PMC free article] [PubMed] [Google Scholar]
- 169.de Vries IJM; Lesterhuis WJ; Barentsz JO; Verdijk P; van Krieken JH; Boerman OC; Oyen WJG; Bonenkamp JJ; Boezeman JB; Adema GJ; Bulte JWM; Scheenen TWJ; Punt CJA; Heerschap A; Figdor CG, Magnetic resonance tracking of dendritic cells in melanoma patients for monitoring of cellular therapy. Nat. Biotechnol 2005, 23 (11), 1407–1413. [DOI] [PubMed] [Google Scholar]
- 170.Jahromi AH; Wang C; Adams SR; Zhu W; Narsinh K; Xu H; Gray DL; Tsien RY; Ahrens ET, Fluorous-Soluble Metal Chelate for Sensitive Fluorine-19 Magnetic Resonance Imaging Nanoemulsion Probes. ACS Nano 2018, 13 (1), 143–151. [DOI] [PMC free article] [PubMed] [Google Scholar]
- 171.Harvey P; Blamire AM; Wilson JI; Finney K-LNA; Funk AM; Senanayake PK; Parker D, Moving the goal posts: enhancing the sensitivity of PARASHIFT proton magnetic resonance imaging and spectroscopy. Chem. Sci 2013, 4 (11), 4251–4258. [Google Scholar]
- 172.Hekmatyar SK; Hopewell P; Pakin SK; Babsky A; Bansal N, Noninvasive MR thermometry using paramagnetic lanthanide complexes of 1,4,7,10‐tetraazacyclodoecane‐α,α′,α″,α‴‐tetramethyl‐1,4,7,10‐tetraacetic acid (DOTMA4–). Magn.Reson.Med 2005, 53 (2), 294–303. [DOI] [PubMed] [Google Scholar]
- 173.Overoye-Chan K; Koerner S; Looby RJ; Kolodziej AF; Zech SG; Deng Q; Chasse JM; McMurry TJ; Caravan P, EP-2104R: a fibrin-specific gadolinium-Based MRI contrast agent for detection of thrombus. J Am Chem Soc 2008, 130 (18), 6025–39. [DOI] [PubMed] [Google Scholar]
- 174.Caravan P; Das B; Dumas S; Epstein FH; Helm PA; Jacques V; Koerner S; Kolodziej A; Shen L; Sun WC; Zhang Z, Collagen-targeted MRI contrast agent for molecular imaging of fibrosis. Angew Chem Int Ed Engl 2007, 46 (43), 8171–3. [DOI] [PubMed] [Google Scholar]
- 175.Uppal R; Medarova Z; Farrar CT; Dai G; Moore A; Caravan P, Molecular imaging of fibrin in a breast cancer xenograft mouse model. Invest Radiol 2012, 47 (10), 553–8. [DOI] [PMC free article] [PubMed] [Google Scholar]
- 176.Uppal R; Catana C; Ay I; Benner T; Sorensen AG; Caravan P, Bimodal thrombus imaging: simultaneous PET/MR imaging with a fibrin-targeted dual PET/MR probe--feasibility study in rat model. Radiology 2011, 258 (3), 812–20. [DOI] [PMC free article] [PubMed] [Google Scholar]
- 177.Uppal R; Ay I; Dai G; Kim YR; Sorensen AG; Caravan P, Molecular MRI of intracranial thrombus in a rat ischemic stroke model. Stroke 2010, 41 (6), 1271–7. [DOI] [PMC free article] [PubMed] [Google Scholar]
- 178.Farrar CT; Gale EM; Kennan R; Ramsay I; Masia R; Arora G; Looby K; Wei L; Kalpathy-Cramer J; Bunzel MM; Zhang C; Zhu Y; Akiyama TE; Klimas M; Pinto S; Diyabalanage H; Tanabe KK; Humblet V; Fuchs BC; Caravan P, CM-101: Type I Collagen-targeted MR Imaging Probe for Detection of Liver Fibrosis. Radiology 2018, doi: 10.1148/radiol.2017170595. [DOI] [PMC free article] [PubMed]
- 179.Fuchs BC; Wang H; Yang Y; Wei L; Polasek M; Schuhle DT; Lauwers GY; Parkar A; Sinskey AJ; Tanabe KK; Caravan P, Molecular MRI of collagen to diagnose and stage liver fibrosis. Journal of Hepatology 2013, 59 (5), 992–8. [DOI] [PMC free article] [PubMed] [Google Scholar]
- 180.Polasek M; Fuchs BC; Uppal R; Schuhle DT; Alford JK; Loving GS; Yamada S; Wei L; Lauwers GY; Guimaraes AR; Tanabe KK; Caravan P, Molecular MR imaging of liver fibrosis: a feasibility study using rat and mouse models. J Hepatol 2012, 57 (3), 549–55. [DOI] [PMC free article] [PubMed] [Google Scholar]
- 181.Botnar RM; Wiethoff AJ; Ebersberger U; Lacerda S; Blume U; Warley A; Jansen CHP; Onthank DC; Cesati RR; Rezavi R; Marber MS; Hamm B; Schaeffter T; Robinson SP; Makowsi MR, In Vivo Assessment of Aortic Aneurysm Wall Integrity Using Elastin-Specific Molecular Magnetic Resonance Imaging. Circ. Cardiovasc. Imaging 2015, 7 (4), 679–689. [DOI] [PubMed] [Google Scholar]
- 182.Protti A; Lavin B; Dong X; Lorrio S; Robinson S; Onthank DC; Shah AM; Botnar RM, Assessment of Myocardial Remodeling Using an Elastin/ Tropoelastin Specific Agent with High Field Magnetic Resonance Imaging (MRI). J. Am. Heart Assoc 2015, 4 (8), e001851. [DOI] [PMC free article] [PubMed] [Google Scholar]
- 183.Phinikaridou A; Andia ME; Indermuehle A; Onthank DC; Cesati RR; Smith A; Robinson SP; Saha P; Botnar RM, Vascular Remodeling and Plaque Vulnerability in a Rabbit Model of Atherosclerosis: Comparison of Delayed Enhancement MR Imaging with an Elastin-specific Contrast Agent and Unenhanced Black-Blood MR Imaging. Radiology 2014, 271 (2), 390–399. [DOI] [PubMed] [Google Scholar]
- 184.Wildgruber M; Bielicki I; Aichler M; Kosanke K; Feuchtinger A; Settles M; Onthank DC; Cesati RR; Robinson SP; Huber AM; Rummeny EJ; Walch AK; Botnar RM, Assessment of Myocardial Infarction and Postinfarction Scar Remodeling With an Elastin-Specific Magnetic Resonance Agent. 7 2014, 2 (321–329), 321. [DOI] [PubMed] [Google Scholar]
- 185.Spuentrup E; Botnar RM; Wiethoff AJ; Ibrahim T; Kelle S; Katoh M; Ozgun M; Nagel E; Vymazal J; Graham PB; Günther RW; Maintz D, MR imaging of thrombi using EP-2104R, a fibrin-specific contrast agent: initial results in patients. Eur. Radiol 2008, 18 (9), 1995–2005. [DOI] [PubMed] [Google Scholar]
- 186.Mastarone DJ; Harrison VSR; Eckermann AL; Parigi G; Luchinat C; Meade TJ, A Modular System for the Synthesis of Multiplexed Magnetic Resonance Probes. Journal of the American Chemical Society 2011, 133 (14), 5329–5337. [DOI] [PMC free article] [PubMed] [Google Scholar]
- 187.Zhang S; Wu K; Sherry AD, A Novel pH-Sensitive MRI Contrast Agent. Angew. Chem., Int. Ed 1999, 38 (21), 3192–3194. [PubMed] [Google Scholar]
- 188.Lowe MP; Parker D; Reany O; Aime S; Botta M; Castellano G; Gianolio E; Pagliarin R, pH-Dependent Modulation of Relaxivity and Luminescence in Macrocyclic Gadolinium and Europium Complexes Based on Reversible Intramolecular Sulfonamide Ligation. J. Am. Chem. Soc 2001, 123 (31), 7601–7609. [DOI] [PubMed] [Google Scholar]
- 189.Esqueda AC; López JA; Andreu-de-Riqure G; Alvarado-Monzón JC; Ratnakar SJ; Lubag AJM; Sherry AD; De León-Rodríguez LM, A New Gadolinium-Based MRI Zinc Sensor. J. Am. Chem. Soc 2009, 131, 11387–11391. [DOI] [PMC free article] [PubMed] [Google Scholar]
- 190.Oukhatar F; Meme S; Meme W; Szeremeta F; Logothetis NK; Angelovski G; Toth E, MRI Sensing of Neurotransmitters with a Crown Ether Appended Gd3+ Complex. ACS Chem. Neurosci 2015, 6 (2), 219–225. [DOI] [PubMed] [Google Scholar]
- 191.MacRenaris KW; Ma Z; Krueger RL; Carney CE; Meade TJ, Cell-Permeable Esterase-Activated Ca(II)-Sensitive MRI Contrast Agent. Bioconjugate Chemistry 2016, 27 (2), 465–473. [DOI] [PMC free article] [PubMed] [Google Scholar]
- 192.Major JL; Bolteau RM; Meade TJ, Mechanisms of ZnII-Activated Contrast Agents. Inorg. Chem 2008, 47 (22), 10788–10795. [DOI] [PMC free article] [PubMed] [Google Scholar]
- 193.Kadjane P; Platas-Iglesias C; Boehm-Sturm P; Truffault V; Hagberg GE; Hoehn M; Logothetis NK; Angelovski G, Dual-Frequency Calcium-Responsive MRI Agents. Chem. Eur. J 2014, 20 (24), 7351–7362. [DOI] [PubMed] [Google Scholar]
- 194.Regueiro-Figueroa M; Gunduz S; Patinec V; Logothetis NK; Esteban-Gomez D; Tripier R; Angelovski G, Gd3+-based Magnetic Resonance imaging Contrast Agent Responsive to Zn2+. Inorg. Chem 2015, 54 (21). [DOI] [PubMed] [Google Scholar]
- 195.Tu C; Nagao R; Louie AY, Multimodal Magnetic-Resonance/Optical-Imaging Contrast Agent Sensitive to NADH. Angew. Chem. Int. Ed 2009, 48, 6547–6551. [DOI] [PMC free article] [PubMed] [Google Scholar]
- 196.Carrera C; Digilio G; Baroni S; Burgio D; Consol S; Fedeli F; Longo D; Mortillaro A; Aime S, Synthesis and characterization of a Gd(iii) based contrast agent responsive to thiol containing compounds. Dalton Transactions 2007, (43), 4980–4987. [DOI] [PubMed] [Google Scholar]
- 197.Louie AY; Hüber MM; Ahrens ET; Rothbächer U; Moats R; Jacobs RE; Fraser SE; Meade TJ, In Vivo Visualization of Gene Expression Using Magentic Resonance Imaging. Nat. Biotechnol 2000, 18, 321–325. [DOI] [PubMed] [Google Scholar]
- 198.Moats RA; Fraser SE; Meade TJ, A “Smart” Magnetic Resonance Imaging Agent That Reports on Specific Enzymatic Activity. Angew. Chem. Int. Ed 1997, 36 (7), 726–727. [Google Scholar]
- 199.Lilley LM; Kamper S; Caldwell M; Chia ZK; Ballweg D; Vistain L; Krimmel J; Mills TA; MacRenaris K; Lee P; Water EA; Meade TJ, Self-Immolative Activation of β-Galactosidase-Responsive Probes for In Vivo MR Imaging in Mouse Models. Angew. Chem. Int. Ed 2020, 59 (1), 388–394. [DOI] [PMC free article] [PubMed] [Google Scholar]
- 200.Rodríguez E; Nilges M; Weissleder R; Chen JW, Activatable Magnetic Resonance Imaging Agents for Myeloperoxidase Sensing: Mechanism of Activation, Stability, and Toxicity. J. Am. Chem. Soc 2010, 132, 168–177. [DOI] [PMC free article] [PubMed] [Google Scholar]
- 201.Nejadnik H; Ye D; Lenkov OD; Donig JS; Martin JE; Castillo R; Derugin N; Sennino B; Rao J; Daldrup-Link H, Magnetic Resonance Imaging of Stem Cell Apoptosis in Arthritic Joints with a Caspase Activatable Contrast Agent. ACS Nano 2015, 9 (2), 1150–1160. [DOI] [PMC free article] [PubMed] [Google Scholar]
- 202.Mizukami S; Takikawa R; Sugihara F; Hori Y; Tochio H; Wälchi M; Shirakawa M; Kikuchi K, Paramagnetic Relaxation-Based 19F MRI Probe To Detect Protease Activity. J. Am. Chem. Soc 2008, 130, 794–795. [DOI] [PubMed] [Google Scholar]
- 203.Garcia-Martin ML; Martinez GV; Raghunand N; Sherry AD; Zhang S; Gillies RJ, High resolution pHe imaging of rat glioma using pH-dependent relaxivity. Magn.Reson.Med 2006, 55 (2), 309–315. [DOI] [PubMed] [Google Scholar]
- 204.Raghunand N; Howison C; Sherry AD; Zhang S; Gillies RJ, Renal and systemic pH imaging by contrast-enhanced MRI. Magn.Reson.Med 2003, 49 (2), 249–257. [DOI] [PubMed] [Google Scholar]
- 205.Clavijo Jordan MV; Lo S-T; Chen S; Preihs C; Chirayil S; Zhang S; Kapur P; Li W-H; De Leon-Rodriguez LM; Lubag AJM; Rofsky NM; Sherry AD, Zinc-sensitive MRI contrast agent detects differential release of Zn(II) ions from the healthy vs. malignant mouse prostate. Proceedings of the National Academy of Sciences 2016, 113 (37), E5464–E5471. [DOI] [PMC free article] [PubMed] [Google Scholar]
- 206.Lubag AJM; De Leon-Rodriguez LM; Burgess SC; Sherry AD, Noninvasive MRI of β-cell function using a Zn2+-responsive contrast agent. Proceedings of the National Academy of Sciences 2011, 108 (45), 18400–18405. [DOI] [PMC free article] [PubMed] [Google Scholar]
- 207.Su HS; Nahrendorf M; Panizzi P; Breckwoldt MO; Rodriguez E; Iwamoto Y; Aikawa E; Weissleder R; Chen JW, Vasculitis: Molecular Imaging by Targeting the Infl ammatory Enzyme Myeloperoxidase. Radiology 2012, 262 (1), 181–190. [DOI] [PMC free article] [PubMed] [Google Scholar]
- 208.Kleijn A; Chen JW; Buhrman JS; Wojtkiewicz GR; Iwamoto Y; Lamfers ML; Stemmer-Rachamimov AO; Rabkin SD; Weissleder R; Martuza RL; Fulci G, Distinguishing Inflammation from Tumor and Peritumoral Edema by Myeloperoxidase Magnetic Resonance Imaging. Clin. Cancer Res 2011, 17 (13), 4484–4493. [DOI] [PMC free article] [PubMed] [Google Scholar]
- 209.Nahrendorf M; Sosnovik D; Chen JW; Panizzi P; Figueiredo J-L; Aikawa E; Libby P; Swirski FK; Weissleder R, Activatable Magnetic Resonance Imaging Agent Reports Myeloperoxidase Activity in Healing Infarcts and Noninvasively Detects the Antiinflammatory Effects of Atorvastatin on Ischemia-Reperfusion Injury. Circulation 2008, 117, 1153–1169. [DOI] [PMC free article] [PubMed] [Google Scholar]
- 210.Breckwoldt MO; Chen JW; Stangenberg L; Aikawa E; Rodriguez E; Qiu S; Moskowitz MA; Weissleder R, Tracking the inflammatory response in stroke in vivo by sensing the enzyme myeloperoxidase. Proc. Natl. Acad. Sci., U.S.A 2008, 105 (47), 18584–18589. [DOI] [PMC free article] [PubMed] [Google Scholar]
- 211.Aime S; Botta M; Gianolio E; Terreno E, A p(O2)-Responsive MRI Contrast Agent Based on the Redox Switch of Manganese(ii/iii) ±Porphyrin Complexes. Angew. Chem. Int. Ed 2000, 39 (4), 747–750. [DOI] [PubMed] [Google Scholar]
- 212.Frost AE; Freedman HH; Westerback SJ; Martell AE, Chelating Tendencies of N,N’-Ethylenebis- [2-(0-hydroxyphenyl) ]-glycine. J. Am. Chem. Soc 1958, 80 (3), 530–536. [Google Scholar]
- 213.Gale EM; Mukherjee S; Liu C; Loving GS; Caravan P, Structure-redox-relaxivity relationships for redox responsive manganese-based magnetic resonance imaging probes. Inorg Chem 2014, 53 (19), 10748–61. [DOI] [PMC free article] [PubMed] [Google Scholar]
- 214.Loving GS; Mukherjee S; Caravan P, Redox-activated manganese-based MR contrast agent. J Am Chem Soc 2013, 135 (12), 4620–3. [DOI] [PMC free article] [PubMed] [Google Scholar]
- 215.Bihari S; Smith PA; Parsons S; Sadler PJ, Stereoisomers of Mn(III) compelxes of ethylenbis[(o-hydroxyphenyl)glycine]. Inorg. Chim. Acta 2001, 331, 310–317. [Google Scholar]
- 216.Yu M; Beyers RJ; Gorden JD; Cross JN; Goldsmith CR, A Magnetic Resonance Imaging Contrast Agent Capable of Detecting Hydrogen Peroxide. Inorganic Chemistry 2012, 51 (17), 9153–9155. [DOI] [PubMed] [Google Scholar]
- 217.Gale EM; Jones CM; Ramsay I; Farrar CT; Caravan P, A Janus Chelator Enables Biochemically Responsive MRI Contrast with Exceptional Dynamic Range. J Am Chem Soc 2016, 138 (49), 15861–15864. [DOI] [PMC free article] [PubMed] [Google Scholar]
- 218.Gore JC; Kang YS; Schulz RJ, Measurement of radiation dose distributions by nuclear magnetic resonance (NMR) imaging. Phys. Med. Biol 1984, 29 (10), 1189–1197. [DOI] [PubMed] [Google Scholar]
- 219.Ding S-P; J.-C., L.; Jin, C., A mouse model of severe acute pancreatitis induced with caerulein and lipopolysaccharide. World J. Gastroenterol 2003, 9 (3), 584–589. [DOI] [PMC free article] [PubMed] [Google Scholar]
- 220.Tsitovich PB; Spernyak JA; Morrow JR, A redox-activated MRI Contrast Agent that Switches between Paramagnetic and Diamagnetic States. Angew. Chem. Int. Ed 2013, 52, 13997–14000. [DOI] [PMC free article] [PubMed] [Google Scholar]
- 221.Du K; Waters EA; Harris TD, Ratiometric quantitation of redox status with a molecular Fe-2 magnetic resonance probe. Chem. Sci 2017, 8 (6), 4424–4430. [DOI] [PMC free article] [PubMed] [Google Scholar]
- 222.Jeon I-R; Park JG; Haney CR; Harris TD, Spin crossover iron(II) complexes as PARACEST MRI thermometers. Chem. Sci 2014, 5 (6), 2461–2465. [Google Scholar]
- 223.Yu M; Xie D; Phan KP; Enriquez JS; Luci JJ; Que EL, A CoII complex for 19F MRI-based detection of reactive oxygen species. Chem. Commun 2016, 52 (96), 13885–13888. [DOI] [PubMed] [Google Scholar]
- 224.Yu M; Bouley BS; Xie D; Enriquez JS; Que EL, 19F PARASHIFT Probes for Magnetic Resonance Detection of H2O2 and Peroxidase Activity. J Am Chem Soc 2018, 130 (33), 10546–10552. [DOI] [PubMed] [Google Scholar]
- 225.Jose CG; Jacob RH; Gardner GE, Alternative cutting methods and dry aging reduce the shear force of hot boned beef striploin in Bos indicus cattle. Meat Sci 2020, 163, 108036. [DOI] [PubMed] [Google Scholar]
- 226.Dearling JLJ; Packard AB, Some thoughts on the mechanism of cellular trapping of Cu(II)-ATSM. Nucl. Med. Biol 2010, 37 (3), 237–243. [DOI] [PubMed] [Google Scholar]
- 227.Lapi SE; Lewis JS; Dehdashti F, Evaluation of Hypoxia with Cu-ATSM. Semin. Nucl. Med 2015, 45 (2), 177–185. [DOI] [PMC free article] [PubMed] [Google Scholar]
- 228.Xue D; King TL; Banerjee A; Kohli V; Que EL, Exploiting Copper Redox for 19F Magnetic Resonance-Based Detection of Cellular Hypoxia. J. Am. Chem. Soc 2016, 138 (9), 2937–2940. [DOI] [PubMed] [Google Scholar]
- 229.Xie D; Kim S; Kohli V; Banerjee A; Yu M; Enriquez JS; Luci JJ; Que EL, Hypoxia-Bioresponsive 19F MRI Probes with Improved Redox Properties and Biocompatibility. Inorg. Chem 2017, 56 (11), 6429–6437. [DOI] [PubMed] [Google Scholar]
- 230.Enriquez JS; Yu M; Bouley BS; Xie D; Que EL, Copper(II) complexes for cysteine detection using 19F magnetic resonance. Dalton Trans 2018, 47 (42), 15024–15030. [DOI] [PMC free article] [PubMed] [Google Scholar]
- 231.Aime S; Anelli PL; Botta M; Brocchetta M; Canton S; Fedeli F; Gianolio E; Terreno E, Relaxometric evaluation of novel manganese(II) complexes for application as contrast agents in magnetic resonance imaging. J. Biol. Inorg. Chem 2002, 7 (1–2), 58–67. [DOI] [PubMed] [Google Scholar]
- 232.Troughton JS; Greenfield MT; Greenwood JM; Dumas S; Wiethoff AJ; Wang J; Spiller M; McMurry TJ; Caravan P, Synthesis and evaluation of a high relaxivity manganese(II)-based MRI contrast agent. Inorg Chem 2004, 43 (20), 6313–23. [DOI] [PubMed] [Google Scholar]
- 233.Paradela-Pujales R; Carniato F; Uzal-Varela R; Brandariz I; Iglesias E; Platas-Iglesias C; Botta M; Esteban-Gomez D, A pentadentate member of the picolinate family for Mn(II) complexation and an amphiphilic derivative. Dalton Trans 2019, 48 (2), 696–710. [DOI] [PubMed] [Google Scholar]
- 234.Forgacs A; Paradela-Pujales R; Regueiro-Figueroa M; Valencia L; Esteban-Gomez D; Botta M; Platas-Iglesias C, Developing the family of picolinate ligands for Mn2+ complexation. Dalton Trans 2017, 46 (5), 1546–1558. [DOI] [PubMed] [Google Scholar]
- 235.Regueiro-Figueroa M; Rolla GA; Esteban-Gomez D; De Blas A; Rodriguez-Blas T; Botta M; Platas-Iglesias C, High Relaxivity Mn2+-Based MRI Contrast Agents. Chem. Eur. J 2014, 20 (52), 17300–17305. [DOI] [PubMed] [Google Scholar]
- 236.Zhu J; Gale EM; Atanasova I; Rietz TA; Caravan P, Hexameric Mn(II) dendrimer as MRI contrast agent. Chemistry 2014, 20 (44), 14507–13. [DOI] [PMC free article] [PubMed] [Google Scholar]
- 237.Forgacs A; Regueiro-Figueroa M; Barriada JL; Esteban-Gomez D; de Blas A; Rodrigues-Blas T; Botta M; Platas-Iglesias C, Mono‐, Bi‐, and Trinuclear Bis-Hydrated Mn2+ Complexes as Potential MRI Contrast Agents. Inorg. Chem 2015, 54 (19), 9576–9587. [DOI] [PubMed] [Google Scholar]
- 238.Rolla GA; Platas-Iglesias C; Botta M; Tei L; Helm L, 1H and 17O NMR relaxometric and computational study on macrocyclic Mn(II) complexes. Inorg. Chem 2013, 52 (6), 3268–3279. [DOI] [PubMed] [Google Scholar]
- 239.Patinec V; Rolla GA; Botta M; Tripier R; Esteban-Gomez D; Platas-Iglesias C, Hyperfine Coupling Constants on Inner-Sphere Water Molecules of a Triazacyclononane based Mn(II) Complex and Related Systems Relevant as MRI Contrast Agents. Inorg. Chem 2013, 52 (19), 11173–11184. [DOI] [PubMed] [Google Scholar]
- 240.Phukan B; Mukherjee C; Goswami U; Sarmah A; Mukherjee S; Sahoo SK; Moi SC, A New Bis(aquated) High Relaxivity Mn(II) Complex as an Alternative to Gd(III)-Based MRI Contrast Agent. Inorg. Chem 2018, 57 (5). [DOI] [PubMed] [Google Scholar]
- 241.Bianchi A; Calabi L; Giorgi C; Losi P; Mariani P; Palano D; Paoli P; Rossi P; Valtancoli B, Thermodynamic and structural aspects of manganese(II) complexes with polyaminopolycarboxylic ligands based upon 1,4,7,10- tetraazacyclododecane (cyclen). Crystal structure of dimeric [MnL]2–2CH3OH containing the new ligand 1,4,7,10-tetraaza- cyclododecane-1,4-diacetate. J. Chem. Soc. Dalton Trans 2001, (6), 917–922. [Google Scholar]
- 242.Laurent S; Vander Elst L; Copoix F; Muller RN, Stability of MRI Paramagnetic Contrast Media: A Proton Relaxometric Protocol for Transmetallation Assessment. Invest. Radiol 2001, 36, 115–122. [DOI] [PubMed] [Google Scholar]
- 243.Pota K; Garda Z; Kalman FK; Barriada JL; Esteban-Gomez D; Platas-Iglesias C; Toth I; Brucher E; Tircsó G, Taking the next step toward inert Mn2+ complexes of open-chain ligands: the case of the rigid PhDTA ligand. New J. Chem 2018, 42, 8001–8011. [Google Scholar]
- 244.Longo DL; Michelotti F; Consolino L; Bardini P; Digilio G; Xiao G; Sun PZ; Aime S, In Vitro and In Vivo Assessment of Nonionic Iodinated Radiographic Molecules as Chemical Exchange Saturation Transfer Magnetic Resonance Imaging Tumor Perfusion Agents. Invest. Radiol 2016, 51 (3), 155–162. [DOI] [PubMed] [Google Scholar]
- 245.Delli Castelli D; Terreno E; Aime S, YbIII-HPDO3A: A Dual pH- and Temperature-Responsive CEST Agent. Angewandte Chemie International Edition 2011, 50 (8), 1798–1800. [DOI] [PubMed] [Google Scholar]
- 246.Aime S; Barge A; Delli Castelli D; Fedeli F; Mortillaro A; Nielsen FU; Terreno E, Paramagnetic Lanthanide(III) complexes as pH-sensitive chemical exchange saturation transfer (CEST) contrast agents for MRI applications. Magn.Reson.Med 2002, 47 (4), 639–648. [DOI] [PubMed] [Google Scholar]
- 247.Mani T; Opina ACL; Zhao P; Evbuomwan OM; Milburn N; Tircsó G; Kumas C; Sherry AD, The stereochemistry of amide side chains containing carboxyl groups influences water exchange rates in EuDOTA-tetraamide complexes. J. Biol. Inorg. Chem 2014, 19 (2), 161–171. [DOI] [PMC free article] [PubMed] [Google Scholar]
- 248.Dorazio SJ; Olatunde AO; Tsitovich PB; Morrow JR, Comparison of divalent transition metal ion paraCEST MRI contrast agents. J. Biol. Inorg. Chem 2014, 19, 191–205. [DOI] [PMC free article] [PubMed] [Google Scholar]
- 249.Olatunde AO; Dorazio SJ; Spernyak JA; Morrow JR, The NiCEST Approach: Nickel(II) ParaCEST MRI Contrast Agents. Journal of the American Chemical Society 2012, 134 (45), 18503–18505. [DOI] [PubMed] [Google Scholar]
- 250.Caneda-Martínez L; Valencia L; Fernández-Pérez I; Regueiro-Figueroa M; Angelovski G; Brandariz I; Esteban-Gómez D; Platas-Iglesias C, Toward inert paramagnetic Ni(II)-based chemical exchange saturation transfer MRI agents. Dalton Transactions 2017, 46 (43), 15095–15106. [DOI] [PubMed] [Google Scholar]
- 251.Senanayake PK; Rogers NJ; Finney K-LNA; Harvey P; Funk AM; Wilson JI; O’Hogain D; Maxwell R; Parker D; Blamire AM, A new paramagnetically shifted imaging probe for MRI. Magn.Reson.Med 2017, 77 (3), 1307–1317. [DOI] [PMC free article] [PubMed] [Google Scholar]
- 252.Martins AF; Clavijo Jordan V; Bochner F; Chirayil S; Paranawithana N; Zhang S; Lo S-T; Wen X; Zhao P; Neeman M; Sherry AD, Imaging Insulin Secretion from Mouse Pancreas by MRI Is Improved by Use of a Zinc Responsive MRI Sensor with Lower Affinity for Zn2+ Ions. J. Am. Chem. Soc 2018, 140 (50), 17456–17464. [DOI] [PMC free article] [PubMed] [Google Scholar]