Abstract
Blood and its cellular components are irradiated by ionizing radiation before transfusion to prevent the proliferation of viable T lymphocytes which cause transfusion associated-graft versus host disease. The immunodeficient patients undergoing chemotherapy for various malignancies are at risk of this disease. The international guidelines for blood transfusion recommend a minimum radiation exposure of 25 Gray (Gy) to the midplane of the blood bag, while a minimum dose of 15 Gy and a maximum dose of 50 Gy should be given to each portion of the blood bag. Therefore, precise dosimetry of the blood irradiator is essential to ensure the adequate irradiation of the blood components. The paper presents the fabrication of diacetylene-based colorimetric film dosimeters for the verification of irradiated doses. The diacetylene analogues are synthesized by tailoring them with different amide-based headgroups followed by their coating to develop colorimetric film dosimeters. Among all the synthesized diacetylene analogues, aminofluorene-substituted diacetylene exhibits the most significant color transition from white to blue color at a minimum γ radiation dose of 5 Gy. The quantitative study of color change is performed by the digitization of the scanned images of film dosimeters. The digital image processing of the developed film dosimeters facilitates rapid dose measurement which enables their facile implementation and promising application in routine blood irradiator dosimetry.
Introduction
Cancer patients undergoing chemotherapy for the treatment of various malignancies are given blood or blood components transfusion.1−3 Because of their immune deficiency and treatment with aggressive immunosuppressive agents these patients are at a high risk of developing transfusion associated-graft versus host disease (TA-GvHD). TA-GvHD is a rare complication of transfusion with a high mortality rate that results from the engraftment of the residual T-lymphocytes present in cellular blood components.4−6 Currently, the only accepted methodology to inhibit TA-GvHD is prophylactic irradiation of whole blood and its cellular components by ionizing radiation like γ and X-rays.1,7−9 Irradiation of blood bags is performed by using free-standing, dedicated blood irradiators that emit γ rays or X-rays. The irradiation of blood cellular components by ionizing radiation inactivates proliferative T lymphocytes while leaving platelets, granulocytes, erythrocytes, and other blood components functional and viable, which in turn abrogates TA-GvHD. The blood bags are typically placed inside the blood irradiator in a cylindrical canister that is positioned on a rotating turntable (Figure S1). Although the role of turntable rotation is to maximize uniform radiation dose exposure over the entire blood bag placed inside the canister but the irregular shape of the blood bag and the geometry of the radiation field can cause an inevitable possibility of inhomogeneous radiation exposure. According to the recommendations of World Health Organization (WHO) and American Association of Blood Banks (AABB),10,11 a dose of 25 Gray (Gy) should be given to the central area of the blood bag with no portion of the bag receiving less than 15 Gy or more than 50 Gy. Based on these guidelines, the regular verification of dose and dose distribution throughout the canister of the blood irradiators must be conducted with a suitable dosimeter to avoid over or under radiation exposure of the blood bags. The radiation doses must be measured with dosimeters that can be placed throughout the canister under routine irradiation conditions with blood bags or equivalent medium. Till date, dosimetry of blood irradiators using various commercially available dosimeters like thermoluminescent dosimeters, diode detectors, and gel-based dosimeters has been reported.7,12−14 However, these dosimeters prove to be cumbersome and labor-intensive as compared to films that can be cut into any size and pasted on the blood bags to measure the absorbed radiation doses. The ease of handling of the films allows the possibility of obtaining relative radiation dose profiles along the different axes of the cylindrical geometry of the blood irradiator canister. Therefore, film dosimetry is relatively simple, efficient, and less time-consuming. The commercially available Gafchromic film15,16 (International Specialty Products, Inc., Wayne, NJ) has also been used for this purpose but it has several limitations like UV sensitivity, temperature sensitivity, and post irradiation instability. Also, its high cost restricts its use in routine dosimetry practice in the blood irradiator.17−26 In this context, we have attempted to develop novel diacetylene (DA)-based colorimetric film dosimeters for the measurement of radiation dose and dose distribution in blood irradiation.
Conjugated systems like DAs are a promising class of colorimetric materials.27 The highly ordered backbones of DAs with the potential to customize the side groups make them suitable for numerous applications.28 Upon exposure to radiation, they undergo topochemical polymerization reaction resulting in the formation of polydiacetylenes (PDAs). The existence of extensively delocalized π-electron networks and conformational restrictions present along the main chain causes a distinct color change because of various stimuli.29 There are specific geometrical parameters and optimal packing orientation of the DA monomers, which are responsible for the successful topochemical polymerization.30 The interactions between the head groups and side chains prominently influence the overall conformation of the DA, thus causing optical changes. Therefore, the optical and colorimetric properties of DAs can be altered to a great extent by the introduction of various side groups.31,32
The stimulus-induced color transitions in DA derivatives have been extensively investigated for the development of a variety of sensors.33,34 However, the development of amide DA film dosimeters for blood irradiation has not been explored yet. Accordingly, the rationale of our work was to design a novel amide-modified DA-based film dosimeter viable for routine blood dosimetry. Particularly, amide containing headgroups were chosen because of the presence of an extra lone pair which is responsible for the enhanced hydrogen bonding, which leads to improved radiation response of the DA monomers. The results of the role of amide head groups on the radiation-induced color transitions helped in the choice of a suitable amide-substituted DA monomer for the development of a potential film dosimeter for blood irradiator. The quantitative study of color transition was performed by using a high-resolution scanner. A comparative analysis of the radiation sensitivity of various amide terminated DA derivatives was done by studying their optical density (OD) and intensity profiles obtained by image digitization of the scanned images by developing a color quantification algorithm in MATLAB software. Measurement of the OD of all the exposed films in a single scan enabled efficient dosimetry applications. The objective of this work was to synthesize amide-substituted DA derivatives and then to employ them as a coating for the preparation of films which exhibit an unprecedented high colorimetric response to blood irradiation doses from 5 to 50 Gy. The effect of pre- and post-irradiation storage conditions on the developed film dosimeters was also investigated.
Results and Discussion
Synthesis of DA Monomers
The commercially available DA monomer 10,12-pentacosadiynoic acid (PCDA) was chosen as the base molecule. The high reactivity of the carboxylic acid head group present in PCDA allows the substitution by various side groups. The DA monomers 1–4 (Figure 1A) used in this study were synthesized by a single-step conversion of DA carboxylic acids into amides (Figure 1B).
Figure 1.
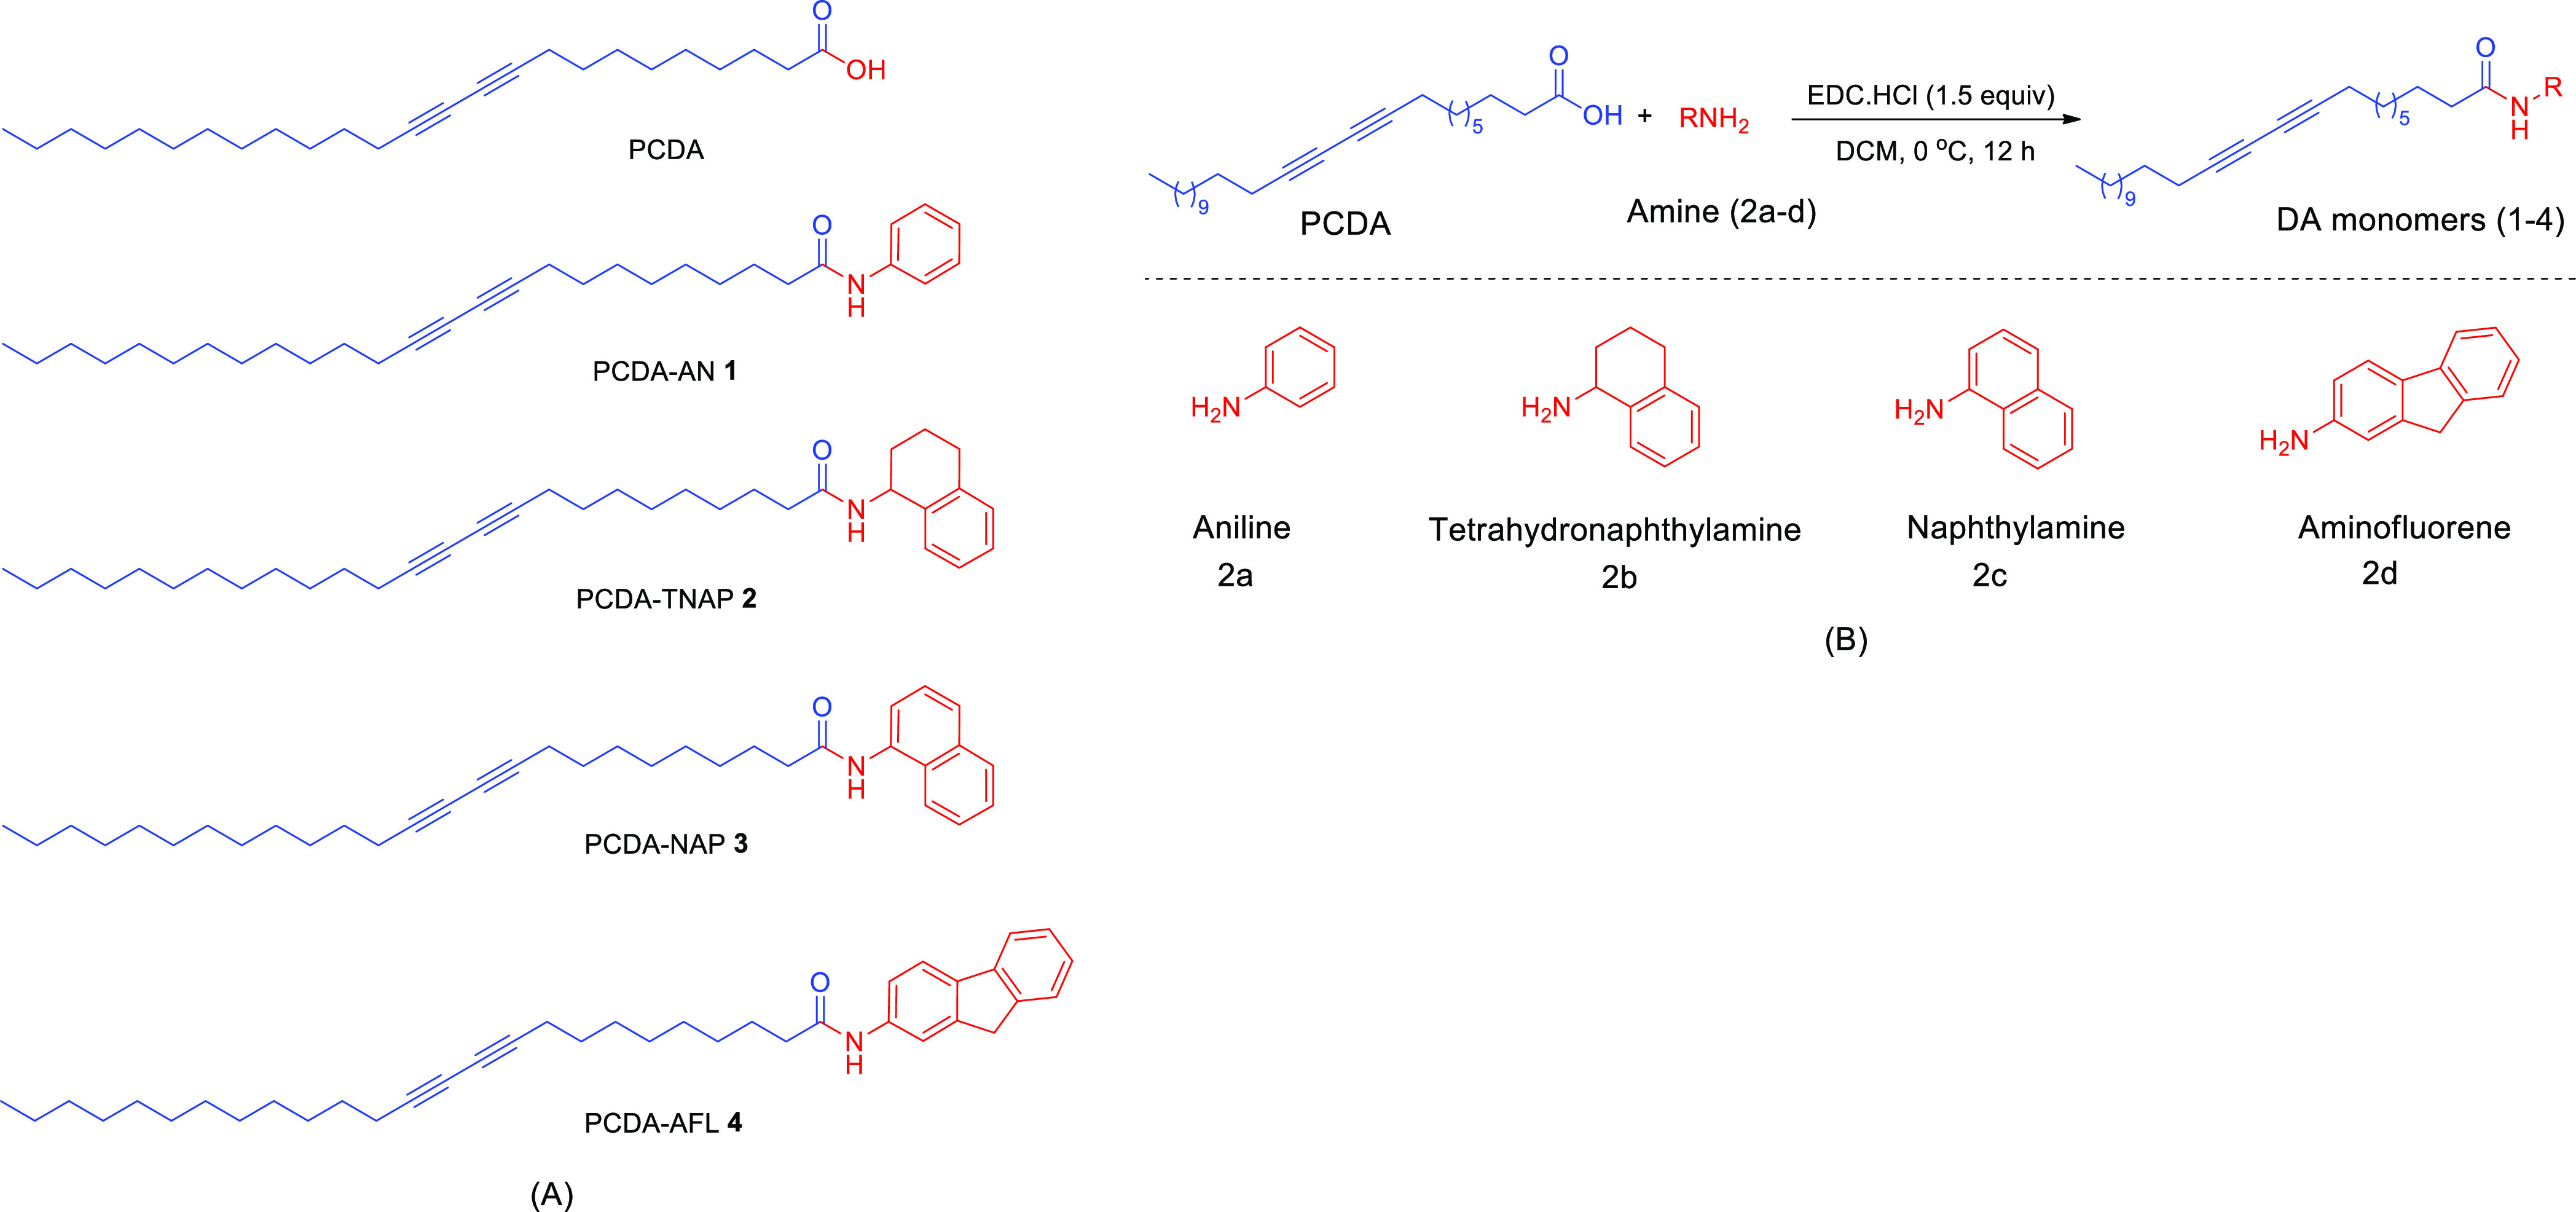
(A) Structures of the synthesized DA monomers (1–4) investigated for colorimetric film dosimetry. (B) Reaction scheme for the synthesis of amine-substituted DA monomers.
The amides were prepared by treating the carboxylic acid of DA with ethyldimethylaminopropylcarbodiimide hydrochloride (EDC·HCl) to activate it, followed by the addition of amide.35 The overall reaction led to the formation of the amide linkage. The influence of bulky amide headgroups on the radiation sensitivity was studied by substituting PCDA with aromatic and aliphatic amide groups. PCDA functionalized with aniline (PCDA-AN 1), tetrahydronaphthylamine (PCDA-TNAP 2), and naphthylamine (PCDA-NAP 3) groups were synthesized to compare their colorimetric response toward radiation doses. Aminofluorene (PCDA-AFL 4)-functionalized DA compound was synthesized to probe how extended aromatic interactions and hydrogen bonding influence the radiation sensitivity. Spectroscopic data of synthesized monomers are as follows:
N-Phenylpentacosa-10,12-diynamide (PCDA-AN 1)
The product was obtained as a white solid (50% yield); mp 65–67 °C; 1H NMR (400 MHz, CDCl3): δ 7.47–7.52 (m, 3H), 7.24 (t, J = 7.6 Hz, 2H), 7.03 (t, J = 7.3 Hz, 1H), 2.29 (t, J = 7.6 Hz, 2H), 2.18 (t, J = 6.9 Hz, 4H), 1.61–1.69 (m, 2H), 1.41–1.49 (m, 4H), 1.20–1.31 (m, 26H), 0.83 (t, J = 6.6 Hz, 3H); 13C NMR (100 MHz, CDCl3): δ 171.78, 138.15, 129.00, 124.21, 119.96, 77.74, 77.58, 65.43, 65.35, 37.80, 32.01, 29.73, 29.58, 29.45, 29.28, 29.20, 28.99, 28.96, 28.84, 28.45, 28.36, 25.71, 22.79, 19.28, 19.27, 14.23; IR: 3309, 2915, 2846, 1697, 1033 cm–1; HRMS (ESI-TOF): [M + H]+ calcd for C31H48NO, 450.3730; found, 450.3731.
N-(1,2,3,4-Tetrahydronaphthalen-1-yl)pentacosa-10,12-diynamide (PCDA-TNAP 2)
The product was obtained as a white solid (80% yield); mp 60–61 °C; 1H NMR (400 MHz, CDCl3): δ 8.46 (s, 2H), 7.12 (d, J = 5.5 Hz, 2H), 6.54 (t, J = 5.2 Hz, 1H), 4.37 (d, J = 6.0 Hz, 2H), 2.16–2.22 (m, 6H), 1.57–1.64 (m, 2H), 1.38–1.47 (m, 4H), 1.18–1.38 (m, 31H), 0.83 (t, J = 6.9 Hz, 3H); 13C NMR (100 MHz, CDCl3): δ 173.53, 149.91, 147.91, 122.35, 77.69, 77.49, 65.42, 65.30, 60.45, 42.27, 36.56, 31.97, 29.98, 29.69, 29.53, 29.40, 29.29, 29.19, 29.15, 28.96, 28.92, 28.79, 28.41, 28.34, 25.74, 22.74, 19.24, 14.18; IR: 3301, 2922, 1725, 1256 cm–1; HRMS (ESI-TOF): [M + H]+ calcd for C35H55NO, 504.4200; found, 504.4171.
N-(Naphthalen-1-yl)pentacosa-10,12-diynamide (PCDA-NAP 3)
The product was obtained as a white solid (80% yield); mp 83–84 °C; 1H NMR (400 MHz, CDCl3): δ 7.80 (s, 4H), 7.65 (d, J = 8.0 Hz, 1H), 7.37–7.46 (m, 3H), 2.41 (t, J = 7.1 Hz, 2H), 2.20–2.23 (m, 5H), 1.71 (d, J = 6.5 Hz, 2H), 1.49 (t, J = 7.0 Hz, 4H), 1.30 (d, J = 40.7 Hz, 25H), 0.85–0.89 (m, 3H); 13C NMR (100 MHz, CDCl3): δ 172.34, 134.17, 132.47, 128.72, 127.54, 126.23, 125.99, 125.89, 125.73, 121.47, 121.02, 77.73, 77.57, 77.48, 77.16, 76.85, 65.45, 65.37, 37.53, 32.02, 29.74, 29.59, 29.45, 29.34, 29.29, 29.20, 29.02, 28.96, 28.86, 28.46, 28.39, 25.91, 22.80, 19.29, 14.24; IR: 3314, 2926, 2848, 1728, 1247, 1087 cm–1; HRMS (ESI-TOF): [M + H]+ calcd for C35H50NO, 500.3887; found, 500.3884.
N-(9H-Fluoren-2-yl)pentacosa-10,12-diynamide (PCDA-AFL 4)
The product was obtained as a white solid (80% yield); mp 85–86 °C; 1H NMR (400 MHz, CDCl3): δ 7.91 (s, 1H), 7.69 (t, J = 8.2 Hz, 2H), 7.50 (d, J = 7.4 Hz, 1H), 7.35 (d, J = 6.7 Hz, 2H), 7.24–7.27 (m, 2H), 3.87 (s, 2H), 2.32–2.38 (m, 2H), 2.21–2.24 (m, 5H), 1.70–1.77 (m, 2H), 1.57–1.64 (m, 1H), 1.46–1.51 (m, 4H), 1.24–1.35 (m, 24H), 0.87 (t, J = 6.8 Hz, 3H); 13C NMR (100 MHz, CDCl3): δ 171.30, 144.57, 143.25, 141.41, 138.11, 136.68, 126.84, 126.36, 125.06, 120.16, 119.58, 118.53, 116.88, 77.74, 77.57, 77.42, 77.11, 76.79, 65.44, 65.30, 37.97, 37.12, 32.01, 29.72, 29.57, 29.44, 29.28, 29.19, 29.08, 28.95, 28.83, 28.44, 28.36, 25.71, 22.78, 19.28, 14.22; IR: 3311, 2922, 1735, 1240 cm–1; HRMS (ESI-TOF): [M + H]+ calcd for C38H52NO, 538.4043; found, 538.4058.
Morphology of the Particles
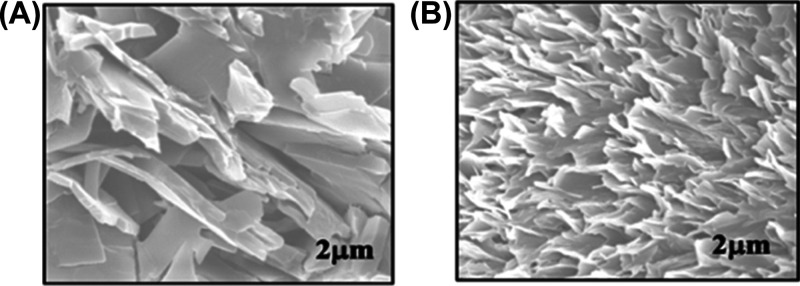
Figure 2A,B shows the morphology of PCDA-AFL 4 acquired by field electron scanning electron microscopy (FESEM) before and after radiation-induced polymerization, respectively. Figure 2A shows embedded structures in a multilayered morphology, which can be ascribed to the strong headgroup interactions caused by the hydrogen bonding with π–π aromatic interactions. After radiation-induced polymerization (Figure 2B), uniformly spread intercalated flake-like structures can be noticed. Although there is no significant change in the morphology of DA monomers post irradiation, an increase in the population of particles is noticed which may be attributed to the advancement of monomers toward each other for the formation of the long PDA chain. From the FESEM images, it can be inferred that the size of the PCDA-AFL polymers lies in the range of several micrometers.
Figure 2.
(A) Morphology of PCDA-AFL 4 before radiation exposure. (B) Morphology of PCDA-AFL 4 after radiation exposure.
Fabrication of the DA-Based Film Dosimeter
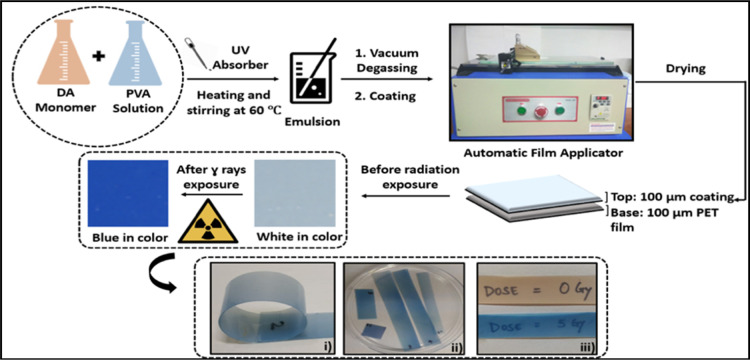
The incorporation of synthesized DA monomers in the form of films allows immediate radiation dosimetric applications. The synthesized DA monomers were introduced in polyvinyl alcohol (PVA) solution to prepare an emulsion, which was later coated to obtain thick and sturdy film dosimeters. The inert nature of the PVA matrix does not interfere with the radiation-induced conformational changes in the guest DA monomers, and hence provides a good binder solution for the film preparation. A Tinuvin P-based UV absorber was added to protect the emulsion from pre-irradiation polymerization because of the environmental light.36 Because the variation in the thickness of the films may result in the change in the absorbance and hence radiation response, thus, it is essential to obtain a highly uniform thickness film for precise radiation dose measurement.37,38 Therefore, instead of conventional film preparation techniques like spin-coating, Langmuir–Blodgett film deposition, and solvent casting method, an automatic film applicator with variable thickness were used for coating DA-based films.33 Using an automatic film applicator, the DA-embedded PVA emulsion was uniformly coated on a transparent polyethylene terephthalate (PET) sheet. The semi-transparent nature of the obtained films is most suitable to distinctly identify the appearance of light and dark shades of blue coloration upon exposure to low and high radiation doses. A 200 μm thick, flexible yet self-standing film with a 100 μm top coating of DA-based emulsion on a 100 μm PET sheet was prepared which enabled easy handling during dosimetry. With the perspective of blood irradiator dosimetry applications, several film dosimeters of different sizes can be pasted on the blood bags in various axes and analyzed simultaneously. Figure 3 represents the experimental procedure and properties like flexibility and transparency of the prepared film dosimeters.
Figure 3.
Pictorial representation of the experimental conditions for the preparation of DA–PVA emulsion followed by coating it using an automatic film applicator unit for uniform thickness (i) flexible nature of the developed film dosimeters which can take the irregular shape of the blood bags, (ii) developed film dosimeters can be easily cut in to any shape and pasted on the blood bags with cello tape, and (iii) transparent nature of the films is shown by writing the doses on a paper placed beneath the films.
Colorimetric Response to Radiation Doses
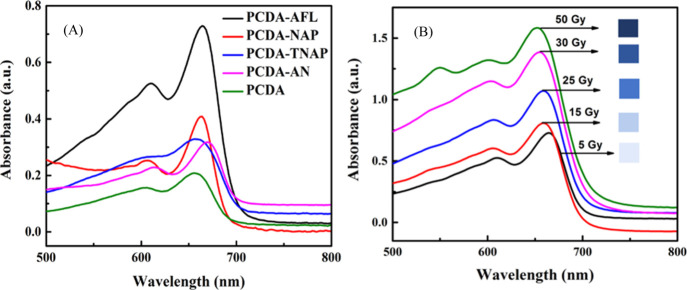
The radiation-induced polymerization of the DA-based film dosimeter resulted in the formation of blue colored PDAs which displayed an increase in the intensity of blue color with the radiation doses. The UV–visible (UV–vis) absorption spectra were acquired to study the presence of various absorbance peaks and their evolution with the increase in radiation doses. Figure 4A shows the UV–vis absorption spectra of PCDA and synthesized DA monomers 1–4 after exposure to 5 Gy γ radiation dose. It is evident from the spectra that PCDA-AFL 4 is most sensitive to radiation and displays maximum absorbance at a low dose of 5 Gy. The visible absorption spectra represent the sensitivity order of PCDA-AFL 4 > PCDA-NAP 3 > PCDA-TNAP 2 > PCDA-AN 1 > PCDA. It can be noticed that after exposure γ radiation PCDA-AFL 4 and PCDA-NAP 3 show significant absorbance in the blue region unlike PCDA and PCDA-AN 1 in which color transition becomes observable only at higher doses. It can be elucidated that the DAs having different side groups display variation in the extent of polymerization and hence colorimetric sensitivity to radiation dose. It is presumed that the shift in the main absorbance peak in spectra is contributed by the conformational change of the DA backbone from planar to nonplanar. This shift can also be attributed to the change in the effective conjugation length of the PDAs.39 However, the maximum absorption wavelength (λmax) in all of them remains similar (650–660 nm), which suggests that the basic mechanism of radiation-induced color transition with respect to the DA main chain is irrespective of the side groups and remains the same. Figure 4B shows the absorption spectra of the film dosimeters prepared with PCDA-AFL 4 at various radiation doses ranging from 0 to 50 Gy which are used in blood irradiation. A maximum absorption wavelength (λmax) at 660 nm can be seen with a shoulder peak at 600 nm. The absorbance peak at 660 nm is associated with the blue color of the amide dosimeter. The appearance of intense blue color upon exposure to γ-radiation is because of the electron delocalization within the conjugated backbone. Previous studies suggest that the colorless to blue color transition is attributed to the changes in orientation, conformation, and packing caused by the propagation of PDA chains.44 However, the exact detailed mechanism of color transition has not been fully determined yet.40
Figure 4.
(A) Visible spectra of DA-based film dosimeters. (B) Visible spectroscopic monitoring of PCDA-AFL 4 film dosimeter upon exposure to different γ radiation doses along with the photographs showing the progression of blue coloration with increasing radiation dose.
A minor peak at ∼550 nm in the 50 Gy absorbance spectrum is also observed, which is attributed to the red phase of the PDA. The absorbance peak observed at 600 nm in the spectra is because of an intermediate form between the red and blue phases of the PDA. The absorbance spectra observations confirm the presence of two main chromatic phases of PDA, that is, the blue phase, which is observed immediately after the radiation-induced topochemical polymerization of the amide-substituted DA monomers and a red phase which results after irradiation to high radiation doses. It can be noticed from the spectra that as the radiation doses increase, there is a concomitant increase in the absorbance peak of blue color at 660 nm. These spectral changes corroborate with the visual observation as shown in the inset photographic images.
Influence of Amide Headgroups on Radiation Sensitivity
In order to allow DA units to polymerize, a specific molecular arrangement is required to meet the criteria for topochemical reactions.40 It is found that the incorporation of substituent pendant groups to the DA unit can promote polymerization.41 The ordering, orientation, and packing of the side chains induce stress to the DA backbone which markedly influences the optical, electronic, and various physical properties. In our study, various colorimetric compounds were synthesized by choosing PCDA as the basic moiety and altering its carboxylic acid group by various amide-based head groups.
As compared to pristine PCDA, all the developed amide dosimeters exhibited better visual blue coloration upon exposure to radiation. This is supposedly because of the intramolecular hydrogen bonding of the amide hydrogen and carbonyl groups of the carboxylic moiety. The hydrogen bonding tends to form an expanded π-surface which further extends the π–π stacking in amide dosimeters.42 Moreover, the existence of strong intermolecular hydrogen bonding in the amide-substituted PCDA is useful for the ordered self-assembly of DA, which is essential for topochemical polymerization and leads to enhanced colorimetric radiation response. The improvement in the radiation response from PCDA-AN 1 and PCDA-TNAP 2 can be seen because of an increase in the number of rings. Further, in PCDA-NAP 3 two aromatic rings were introduced, the enhanced aromaticity and conjugation increase the π–π stacking of amide dosimeters, which results in significant blue coloration upon exposure to radiation. The substitution of a bulkier, three-ring system as a pendant group in PCDA-AFL 4 exhibits the most significant coloration among all the developed film dosimeters at 5 Gy radiation dose exposure. Thus, it can be proposed that the degree of aromatic interactions, conjugation and hydrogen bonding of the head groups can have a pronounceable effect on the radiation-induced polymerization of the DA chains which leads to chromatic transitions.34
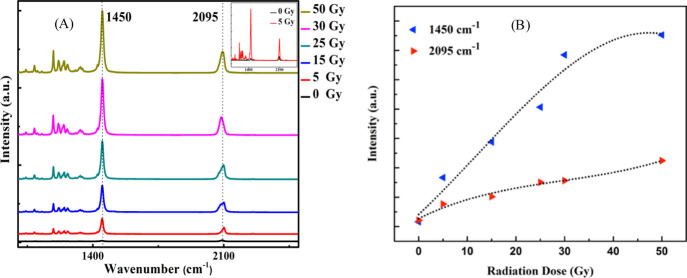
Raman spectra of the PCDA-AFL 4 film dosimeter was analyzed to identify the presence of various bonds and monitor their progression with the increase in radiation doses. The presence of peaks at 2095 and 1450 cm–1 are attributed to the characteristic conjugated alkyne-alkene bands of C≡C and C=C, respectively43 (Figure 5A). It is evident that with the increase in the radiation doses no major shift in the peak position has been observed but a significant escalation in the intensity of C=C and C≡C bond intensity peaks can be noticed. Figure 5B shows the change in the peak intensity as a function of radiation doses, it can be seen that after radiation exposure the C=C bond intensity is notably more than the C≡C bond intensity, which implies that with increasing doses, one of the C≡C bond in the monomer cleavages and cross-links with another monomer via C=C bonds. It can be proposed that because of the radiation exposure the amide-substituted DA molecule undergoes 1,4 addition polymerization of the conjugated triple bonds which gives rise to PDA units cumulated with double bonds. Depending upon the radiation dose, these PDA units undergo cross-linking through C=C bonds by forming repeating units.
Figure 5.
(A) Raman spectra of the PCDA-AFL 4 film dosimeter upon exposure to γ radiation doses. (B) Progression of Raman signal corresponding to C=C (1450 cm–1) and C≡C bonds (2095 cm–1) in the PCDA-AFL film dosimeter.
Digital Colorimetric Analysis for Film Dosimetry
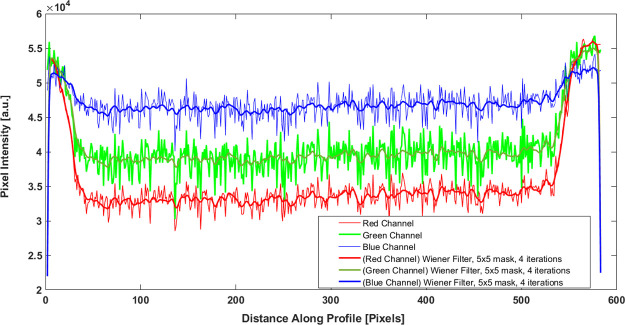
In digital colorimetric analysis (DCA), quantification of the colorimetric dose response of the developed dosimeter was done by two-dimensional OD measurement using a high-resolution Epson 10000XL flatbed scanner. With the increase in the radiation dose, the blue color of the film intensifies. Hence, OD is the most preferred measurement quantity.44 DCA was carried out by scanning the indigenously developed film dosimeters separately in each channel, that is, red (R), green (G), and blue (B) thereby extracting the RGB channel values for each pixel within the dosimeters in the scanned images. The effect of background light was subtracted by taking a white background, also the background noises from the scanner bed and the uncoated film were subtracted. Figure 6 shows the post irradiation intensity profile of the developed film dosimeter in terms of pixel values of red, blue, and green channels. It confirms the homogenous dose distribution across the surface of the film dosimeter. A Wiener filter, which is a MATLAB tool, was applied to remove the additive noise and blurring.45 Because the absorption spectrum of the radiochromic film exhibits maximum peak in the red region of the visible spectrum, thus, the red channel of the scanner was chosen to monitor the changes in OD.
Figure 6.
Intensity profile of the PCDA-AFL 4 film dosimeter post irradiation in red, blue, and green channels.
A MATLAB code was written to evaluate the changes in the amount of coloration because of radiation exposure by calculating the net OD for all the samples from the pixel values. Figure 7 represents the variation in OD of the developed film dosimeters with radiation doses and the data were fitted by using second degree polynomial. The uncertainty in OD measurement defined as the standard deviation of the mean value of OD was evaluated by the statistical analysis of a series of measurements.46 The mean and standard deviation were computed over a set of averaged measured intensities over the entire surface of 10 unexposed and exposed films read 5 times each. The statistical uncertainty in OD was obtained to be 1.4%.
Figure 7.
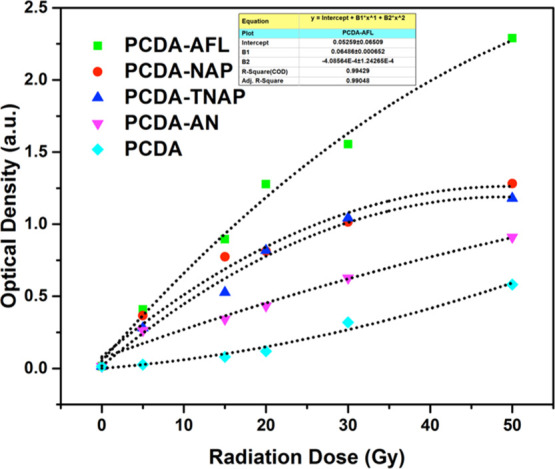
DCA using a high-resolution Epson scanner.
Reproducibility and Uniformity of the Amide Film Dosimeter
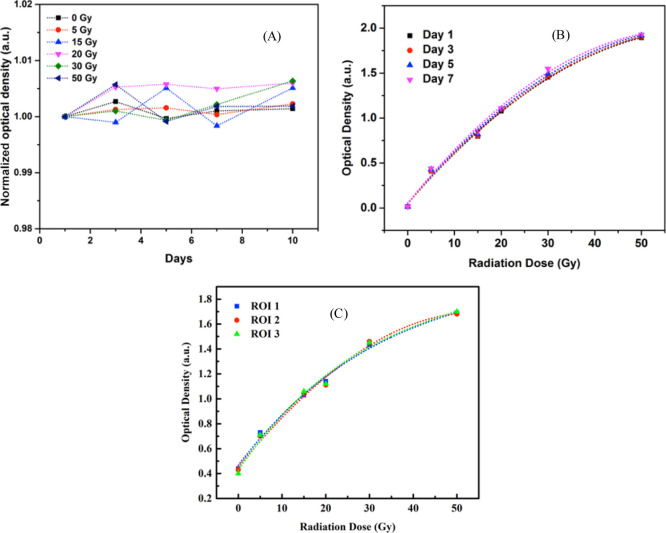
The PCDA-AFL 4 amide film dosimeters were scanned on different days to investigate the film reproducibility. Five sets of films comprising film pieces were irradiated with selected known doses and scanned over a period of 10 days. The mean OD for the film dosimeters was obtained and normalized with respect to the OD of the first day. Figure 8A shows the results for the film reproducibility. It can be seen that the film response changes very slightly with time with an average darkening of 0.2 ± 0.059% (1 standard deviation) after 10 days. The study shows that the amide film dosimeters exhibit stable and reproducible response over a period of 10 days.
Figure 8.
(A) Reproducibility of PCDA-AFL film dosimeters. (B) Dose response curve of the PCDA-AFL film dosimeter obtained on different days. (C) Dose response curve obtained at three different ROIs on the PCDA-AFL films.
The quantification of the doses from OD acquired by the high-resolution flatbed scanner is fast, cost effective, and practically more feasible in a clinical setup.47 However, it is important to study the reproducibility of this method in the developed amide dosimeters. The reproducibility of the DCA was investigated by repeatedly scanning film pieces irradiated at 0, 5, 15, 20, 30, and 50 Gy on different days: after 1, 3, 5, and 7 days. All the films were positioned at the center of the scanner in a reproducible manner by using a cut-out template. The template was useful in minimizing the nonuniform response of the measurement because of the inconsistent positioning of the films. The settings of the scanner were maintained the same on all days. Figure 8B shows the dose response curve obtained on different days. The average variation for all the measurements performed on different days was 1.18%.
Uniformity of the films plays an important role in obtaining a consistent dose response over the complete surface of the films. Therefore, the uniformity of the films was investigated by comparing the dose response measured at 3 different regions of interest (ROIs) on different locations on a single piece of the film. The ROIs were taken in the central area of the film to avoid the artifacts from the edges of the films. The physical deformities in the film were also avoided. The OD was measured using the GretagMacbeth densitometer. An average variation of 1.53% was obtained at 3 different ROIs (Figure 8C), which indicates that there is limited variation in scatter and dose sensitivity.
Storage Conditions for the Amide Dosimeters
The effect of pre-irradiation and post-irradiation storage conditions on the developed films was monitored by measuring L, a, and b values of the films stored under different conditions.48 To establish the effect of temperature and room light, three sets of films were taken in a Petri dish, one set of films was stored at room temperature (RT) in normal room light, the second set was kept in an oven at 50 °C in the dark and the third set was kept in a refrigerator at 4 °C. Figure 9 shows the variation in L (degree of lightness or darkness) values in all three sets measured at different time intervals pre- and post-irradiation. It can be seen that the L values of the pre- and post-exposed films stored at RT and at 4 °C remained essentially unchanged during the whole period of observation. The L values of the film dosimeters stored at 50 °C changed about 2%. The thermal reactivity of the amide derivatives of the DA monomer can be responsible for the slight decrease in L values before irradiation. It can be concluded that the developed film dosimeters have a long shelf life both pre- and post-exposure in normal environmental conditions and hence can be easily stored without the requirement of any special storage conditions.
Figure 9.
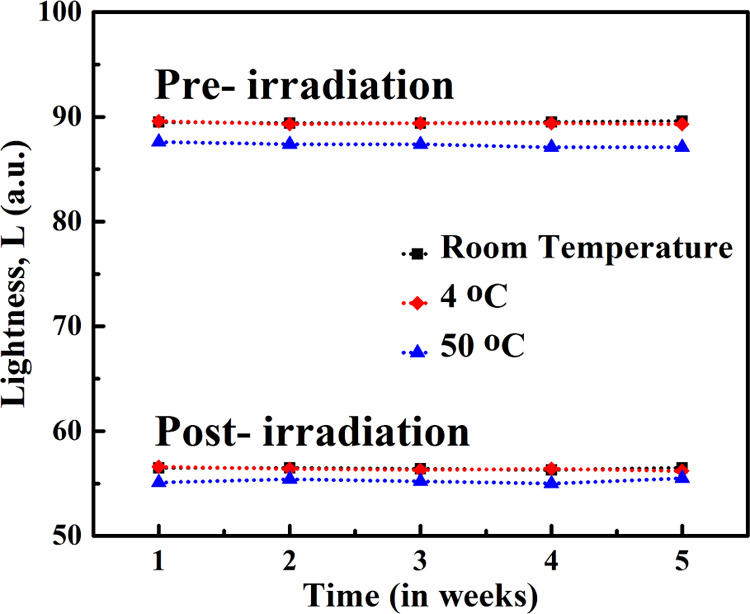
Pre- and post-irradiation L values of the PCDA-AFL 4 film dosimeter at different storage conditions.
Conclusions
The DA-based colorimetric film dosimeter developed in this work enables visual detection and measurement of low to high range of radiation doses used in blood irradiation. By leveraging the ability of DA to undergo radiation-induced polymerization which leads to chromatic transitions, a series of amide-functionalized DA compounds were synthesized and later used to prepare films. The effect of variation of the bulky amide head group on the radiation sensitivity was studied. It was found that the aminofluorene-substituted DA monomer exhibited significant color transition upon exposure to 5 Gy γ radiation and the color intensity increased till 50 Gy. Using the developed film dosimeter, the measurement of radiation of doses can be simply made by quantifying the color transition from white to different intensities of blue coloration in terms of OD. The amount of coloration was quantified by digital image processing using MATLAB code. In a routine dosimetry situation, this could be an easy tool to investigate if the blood bags are adequately irradiated to the recommended doses. The developed film dosimeters exhibit a long shelf life under normal storage conditions. They can be cut into any size and pasted on the blood bags to record the absolute doses and relative dose distribution at the different planes, which can be useful for the time-to-time quality assurance of the blood irradiator.
Experimental Section
Materials and Instruments
PCDA was purchased from Sigma-Aldrich and 1-ethyl-3-(3-dimethylaminopropyl)carbodiimide hydrochloride (EDC·HCl) was purchased from TCI Chemicals. 1H NMR (400 MHz) and 13C NMR (100 MHz) spectra were recorded in CDCl3. Chemical shifts for protons and carbons are reported in ppm from tetramethylsilane and referenced to the carbon resonance of the solvent. The differential UV–vis absorption spectra of the film dosimeters were recorded using a PerkinElmer Lambda 1050 spectrophotometer equipped with a 150 mm integrating sphere with 8° reflectance. The spot size of a spectrophotometer was 0.4 cm wide and 1.2 cm high for a 3 cm × 3 cm film sample. FESEM images of DA monomers studied here obtained on Carl Zeiss (GeminiSEM 500). Freshly prepared compounds were deposited on silicon wafers. Samples were sputter-coated on Quorum pure Au target, sputter time was 60 s and sputter current was 60 mA. A Horiba LabRam HR revolution Raman spectrometer with 785 nm laser 50 mW power was used to record the Raman spectra of the developed film dosimeters. The acquisition time was 2 s. High-resolution mass spectra were recorded on a Applied Biosystems QSTAR Elite Hybrid (QqTOF) LC/MS/MS system with an electrospray mass spectrometer using positive electrospray ionization mode (ESI+). The L, a, and b values of the film dosimeters were measured using NCS Colourpin 11 color reader. It was connected to the mobile phone through Bluetooth and an online app was downloaded to read the color values of the films on a mobile phone. The Fourier transform infrared spectra of the film dosimeters were obtained from a Thermo Scientific spectrometer in attenuated total reflection mode.
Preparation of DA Monomers (1–4)
In an oven-dried round bottom flask, PCDA 1.0 equiv in dichloromethane (DCM) was added dropwise in a solution of EDC·HCl 1.5 equiv in DCM at 0 °C. After 30 min, the substituted amine 1.0 equiv was added to the reaction mixture. The resulting reaction mixture was run at RT overnight. The progression of the reaction was monitored by thin-layer chromatography analysis; after the complete consumption of the starting material. The reaction mixture was diluted with DCM (10 mL) and water (15 mL). The layers were separated, and the organic layer was washed with brine solution and dried over sodium sulfate (Na2SO4). The organic layer was concentrated under reduced pressure. The crude material so obtained was purified by column chromatography on silica gel (100–200) (hexane/ethyl acetate; 70/30).
Fabrication of the DA Monomer Film Dosimeter
A 5% PVA solution in distilled water was prepared. The synthesized DA monomer dissolved in ethyl acetate was added to the PVA solution in a 1:1 ratio. The solution was stirred and heated at 60 °C for 3 h to form a turbid emulsion. A Tinuvin P-based UV absorber (0.1%) was added. The emulsion was coated on a transparent sheet using an automatic film applicator and left for drying overnight at RT. The obtained film dosimeters were cut to pieces as per the requirement. The thickness of the dried layer of the obtained films was 100 μm.
Irradiation with Blood Irradiator
The irradiation was performed by Gammacell 3000 Elan, blood irradiator (Best Theratronics Ltd., Ontario, Canada). It contains one sealed 137Cs radiation source with a nominal activity of 53.7 TBq (1450 Ci) inside a steel-encased lead shield with a dose rate of 5 Gy/min at the canister midplane.
Digital Colorimetric Analysis
All the samples were scanned by using an Epson 10000XL flatbed scanner in reflective mode. The images were digitalized in 48 bits RGB format at a resolution of 72 dpi and saved in uncompressed TIFF format. The image processing was performed using an open-source program written in MATLAB 7.4. The analysis was performed in the red channel component of the image.
Acknowledgments
The authors acknowledge the facilities and support provided by All India Institute of Medical Sciences and University of Delhi.
Supporting Information Available
The Supporting Information is available free of charge at https://pubs.acs.org/doi/10.1021/acsomega.0c06184.
1H NMR, 13C NMR, and HRMS spectra of DA monomers (PDF)
Author Contributions
∥ S.V. and G.N. have contributed equally to this work.
This work has been financially supported by the Indian Council of Medical Research (ICMR 5/3/8/346/2018-ITR).
The authors declare no competing financial interest.
Supplementary Material
References
- Pritchard A. E.; Shaz B. H. Survey of irradiation practice for the prevention of Transfusion-Associated Graft-versus-Host Disease. Arch. Pathol. Lab. Med. 2016, 140, 1092–1097. 10.5858/arpa.2015-0167-cp. [DOI] [PubMed] [Google Scholar]
- Kessinger A.; Armitage J. O.; Klassen L. W.; Landmark J. D.; Hayes J. M.; Larsen A. E.; Purtilo D. T. Graft versus host disease following transfusion of normal blood products to patients with malignancies. J. Surg. Oncol. 1987, 36, 206–209. 10.1002/jso.2930360311. [DOI] [PubMed] [Google Scholar]
- Challis M.; Marrin C.; Vaughan R. S.; Goringe A. Who requires irradiated blood products?: Correspondence. Anaesthesia 2011, 66, 620–621. 10.1111/j.1365-2044.2011.06746.x. [DOI] [PubMed] [Google Scholar]
- Kopolovic I.; Ostro J.; Tsubota H.; Lin Y.; Cserti-Gazdewich C. M.; Messner H. A.; Keir A. K.; DenHollander N.; Dzik W. S.; Callum J. A systematic review of transfusion-associated graft-versus-host disease. Blood 2015, 126, 406–414. 10.1182/blood-2015-01-620872. [DOI] [PubMed] [Google Scholar]
- Lowenthal R.; Challis D.; Griffiths A.; Chappell R.; Goulder P. Transfusion-associated graft-versus-host disease: report of an occurrence following the administration of irradiated blood. Transfusion 1993, 33, 524–529. 10.1046/j.1537-2995.1993.33693296818.x. [DOI] [PubMed] [Google Scholar]
- Schroeder M. L. Transfusion-associated graft-versus-host disease. Br. J. Haematol. 2002, 117, 275–287. 10.1046/j.1365-2141.2002.03450.x. [DOI] [PubMed] [Google Scholar]
- Bahar B.; Tormey C. A. Prevention of Transfusion-Associated Graft-Versus-Host Disease with blood product irradiation: The Past, Present, and Future. Arch. Pathol. Lab. Med. 2018, 142, 662–667. 10.5858/arpa.2016-0620-rs. [DOI] [PubMed] [Google Scholar]
- Leitman S. Dose, dosimetry, and quality improvement of irradiated blood components. Transfusion 1993, 33, 447–449. 10.1046/j.1537-2995.1993.33693296804.x. [DOI] [PubMed] [Google Scholar]
- Masterson M. E.; Febo R. Pretransfusion blood irradiation: Clinical rationale and dosimetric considerations. Med. Phys. 1992, 19, 649–657. 10.1118/1.596809. [DOI] [PubMed] [Google Scholar]
- Asai T.; Inaba S.; Ohto H.; Osada K.; Suzuki G.; Takahashi K.; Tadokoro K.; Minami M. Guidelines for irradiation of blood and blood components to prevent post-transfusion graft-vs.-host disease in Japan. Transfus. Med. 2000, 10, 315–320. 10.1046/j.1365-3148.2000.00264.x. [DOI] [PubMed] [Google Scholar]
- Treleaven J.; Gennery A.; Marsh J.; Norfolk D.; Page L.; Parker A.; Saran F.; Thurston J.; Webb D. Guidelines on the use of irradiated blood components prepared by the British Committee for Standards in Haematology blood transfusion task force. Br. J. Haematol. 2011, 152, 35–51. 10.1111/j.1365-2141.2010.08444.x. [DOI] [PubMed] [Google Scholar]
- Mohammadyari P.; Zehtabian M.; Sina S.; Tavasoli A. R.; Faghihi R. Dosimetry of gamma chamber blood irradiator using PAGAT gel dosimeter and Monte Carlo simulations. J. Appl. Clin. Med. Phys. 2014, 15, 317–330. 10.1120/jacmp.v15i1.3952. [DOI] [PMC free article] [PubMed] [Google Scholar]
- Butson M. J.; Yu P. K. N.; Cheung T.; Carolan M. G.; Quach K. Y.; Arnold A.; Metcalfe P. E. Dosimetry of blood irradiation with radiochromic film. Transfus. Med. 1999, 9, 205–208. 10.1046/j.1365-3148.1999.00200.x. [DOI] [PubMed] [Google Scholar]
- Moriyama S.; Kurihara K.; Yokokawa N.; Satake M.; Juji T. Evaluation of absorbed dose-distribution in the X-ray or gamma-irradiator for blood products. Yakugaku Zasshi 2001, 121, 283–288. 10.1248/yakushi.121.283. [DOI] [PubMed] [Google Scholar]
- Soliman K.; Adili M.; Alrushoud A. Radiation dose verification of an X-ray based blood irradiator using EBT3 radiochromic films calibrated using Gamma Knife machine. Rep. Pract. Oncol. Radiother. 2019, 24, 369–374. 10.1016/j.rpor.2019.05.006. [DOI] [PMC free article] [PubMed] [Google Scholar]
- Vandana S.; Shaiju V. S.; Sharma S. D.; Mhatre S.; Shinde S.; Chourasiya G.; Mayya Y. S. Dosimetry of gamma chamber blood irradiator using Gafchromic EBT film. Appl. Radiat. Isot. 2011, 69, 130–135. 10.1016/j.apradiso.2010.08.018. [DOI] [PubMed] [Google Scholar]
- Andrés C.; del Castillo A.; Tortosa R.; Alonso D.; Barquero R. A comprehensive study of the Gafchromic EBT2 radiochromic film. A comparison with EBT. Med. Phys. 2010, 37, 6271–6278. 10.1118/1.3512792. [DOI] [PubMed] [Google Scholar]
- Zeidan O. A.; Stephenson S. A. L.; Meeks S. L.; Wagner T. H.; Willoughby T. R.; Kupelian P. A.; Langen K. M. Characterization and use of EBT radiochromic film for IMRT dose verification. Med. Phys. 2006, 33, 4064–4072. 10.1118/1.2360012. [DOI] [PubMed] [Google Scholar]
- Chiu-Tsao S.-T.; Ho Y.; Shankar R.; Wang L.; Harrison L. B. Energy dependence of response of new high sensitivity radiochromic films for megavoltage and kilovoltage radiation energies. Med. Phys. 2005, 32, 3350–3354. 10.1118/1.2065467. [DOI] [PubMed] [Google Scholar]
- Saur S.; Frengen J. GafChromic EBT film dosimetry with flatbed CCD scanner: a novel background correction method and full dose uncertainty analysis. Med. Phys. 2008, 35, 3094–3101. 10.1118/1.2938522. [DOI] [PubMed] [Google Scholar]
- Hartmann B.; Martišíková M.; Jäkel O. Homogeneity of Gafchromic EBT2 film. Med. Phys. 2010, 37, 1753–1756. 10.1118/1.3368601. [DOI] [PubMed] [Google Scholar]
- Lynch B. D.; Kozelka J.; Ranade M. K.; Li J. G.; Simon W. E.; Dempsey J. F. Important considerations for radiochromic film dosimetry with flatbed CCD scanners and EBT Gafchromic film. Med. Phys. 2006, 33, 4551–4556. 10.1118/1.2370505. [DOI] [PubMed] [Google Scholar]
- Rink A.; Lewis D. F.; Varma S.; Vitkin I. A.; Jaffray D. A. Temperature and hydration effects on absorbance spectra and radiation sensitivity of a radiochromic medium. Med. Phys. 2008, 35, 4545–4555. 10.1118/1.2975483. [DOI] [PMC free article] [PubMed] [Google Scholar]
- Cheung T.; Butson M. J.; Yu P. K. Use of multiple layers of Gafchromic film to increase sensitivity. Phys. Med. Biol. 2001, 46, 235–240. 10.1088/0031-9155/46/10/401. [DOI] [PubMed] [Google Scholar]
- Odero D. O.; Gluckman G. R.; Welsh K.; Wlodarczyk R. A.; Reinstein L. E. The use of an inexpensive red acetate filter to improve the sensitivity of GafChromic dosimetry. Med. Phys. 2001, 28, 1446–1448. 10.1118/1.1382605. [DOI] [PubMed] [Google Scholar]
- Butson M. J.; Cheung T.; Yu P. K. N. Scanning orientation effects on Gafchromic EBT film dosimetry. Australas. Phys. Eng. Sci. Med. 2006, 29, 281–284. 10.1007/bf03178579. [DOI] [PubMed] [Google Scholar]
- Okada S.; Peng S.; Spevak W.; Charych D. Color and chromism of polydiacetylene vesicles. Acc. Chem. Res. 1998, 31, 229–239. 10.1021/ar970063v. [DOI] [Google Scholar]
- Mittal A.; Gopishankar N.; Koleda J.; Verma A. K.; Kumar P. Development and characterization of urethane substituted diacetylene based radiochromic films for medical radiation dosimetry. Radiat. Phys. Chem. 2020, 177, 109119. 10.1016/j.radphyschem.2020.109119. [DOI] [Google Scholar]
- Cheng Q.; Yamamoto M.; Stevens R. C. Amino acid terminated polydiacetylene lipid microstructures: morphology and chromatic transition. Langmuir 2000, 16, 5333–5342. 10.1021/la9916169. [DOI] [Google Scholar]
- Sarkar A.; Okada S.; Matsuzawa H.; Matsuda H.; Nakanishi H. Novel polydiacetylenes for optical materials: beyond the conventional polydiacetylenes. J. Mater. Chem. 2000, 10, 819–828. 10.1039/a907438d. [DOI] [Google Scholar]
- Chance R. R.; Patel G. N.; Witt J. D. Thermal effects on the optical properties of single crystals and solution-cast films of urethane substituted polydiacetylenes. J. Chem. Phys. 1979, 71, 206–211. 10.1063/1.438117. [DOI] [Google Scholar]
- Bloor D.; Chance R. R.. Polydiacetylenes: Synthesis, Structure and Electronic Properties; Springer Science & Business Media, 2013. [Google Scholar]
- Yoon B.; Lee S.; Kim J.-M. Recent conceptual and technological advances in polydiacetylene-based supramolecular chemosensors. Chem. Soc. Rev. 2009, 38, 1958–1968. 10.1039/b819539k. [DOI] [PubMed] [Google Scholar]
- Qian X.; Städler B. Recent developments in polydiacetylene based sensors. Chem. Mater. 2019, 31, 1196–1222. 10.1021/acs.chemmater.8b05185. [DOI] [Google Scholar]
- Han N.; Woo H. J.; Kim S. E.; Jung S.; Shin M. J.; Kim M.; Shin J. S. Systemized organic functional group controls in polydiacetylenes and their effects on color changes. J. Appl. Polym. Sci. 2017, 134, 45011. 10.1002/app.45011. [DOI] [Google Scholar]
- Abdel-Fattah A. A.; Soliman Y. S. Performance improvement of pentacosadiynoic acid label dosimeter for radiation processing technology. Radiat. Phys. Chem. 2017, 141, 66–72. 10.1016/j.radphyschem.2017.06.006. [DOI] [Google Scholar]
- Khachonkham S.; Dreindl R.; Heilemann G.; Lechner W.; Fuchs H.; Palmans H.; Georg D.; Kuess P. Characteristic of EBT-XD and EBT3 radiochromic film dosimetry for photon and proton beams. Phys. Med. Biol. 2018, 63, 065007. 10.1088/1361-6560/aab1ee. [DOI] [PubMed] [Google Scholar]
- Swinehart D. F. The beer lambert law. J. Chem. Educ. 1962, 39, 333. 10.1021/ed039p333. [DOI] [Google Scholar]
- Reppy M. A.; Pindzola B. A. Biosensing with polydiacetylene materials: structures, optical properties and applications. Chem. Commun. 2007, 42, 4317–4338. 10.1039/b703691d. [DOI] [PubMed] [Google Scholar]
- Kuzmany H.; Kürti J. The physical meaning of the conjugation length in polymers. Synth. Met. 1987, 21, 95–102. 10.1016/0379-6779(87)90071-3. [DOI] [Google Scholar]
- Kew S. J.; Hall E. A. H. Structural effect of polymerisation and dehydration on bolaamphiphilic polydiacetylene assemblies. J. Mater. Chem. 2006, 16, 2039–2047. 10.1039/b600931j. [DOI] [Google Scholar]
- Gómez P.; Georgakopoulos S.; Cerón J. P.; Da Silva I.; Más-Montoya M.; Pérez J.; Tárraga A.; Curiel D. Hydrogen-bonded azaphenacene: a strategy for the organization of π-conjugated materials. J. Mater. Chem. C 2018, 6, 3968–3975. 10.1039/c8tc00840j. [DOI] [Google Scholar]
- Patlolla A.; Zunino J.; Frenkel A. I.; Iqbal Z. Thermochromism in polydiacetylene-metal oxide nanocomposites. J. Mater. Chem. 2012, 22, 7028. 10.1039/c2jm16175c. [DOI] [Google Scholar]
- Devic S.; Seuntjens J.; Sham E.; Podgorsak E. B.; Schmidtlein C. R.; Kirov A. S.; Soares C. G. Precise radiochromic film dosimetry using a flat-bed document scanner. Med. Phys. 2005, 32, 2245–2253. 10.1118/1.1929253. [DOI] [PubMed] [Google Scholar]
- Poularikas A. D.; Ramadan Z. M.. Adaptive Filtering Primer with MATLAB; CRC Press, 2017. [Google Scholar]
- Menegotti L.; Delana A.; Martignano A. Radiochromic film dosimetry with flatbed scanners: A fast and accurate method for dose calibration and uniformity correction with single film exposure: Radiochromic film fast and accurate correction method. Med. Phys. 2008, 35, 3078–3085. 10.1118/1.2936334. [DOI] [PubMed] [Google Scholar]
- Izewska J.; Rajan G.. Radiation Dosimeters in Radiation Oncology Physics: A Handbook for Teachers and Students; International Atomic Energy Agency, 2005; pp 71–99. [Google Scholar]
- Schanda J.Colorimetry: Understanding the CIE System; John Wiley & Sons, 2007. [Google Scholar]
Associated Data
This section collects any data citations, data availability statements, or supplementary materials included in this article.


