Abstract
In multistep continuous flow chemistry, studying complex reaction mixtures in real time is a significant challenge, but provides an opportunity to enhance reaction understanding and control. We report the integration of four complementary process analytical technology tools (NMR, UV/Vis, IR and UHPLC) in the multistep synthesis of an active pharmaceutical ingredient, mesalazine. This synthetic route exploits flow processing for nitration, high temperature hydrolysis and hydrogenation reactions, as well as three inline separations. Advanced data analysis models were developed (indirect hard modeling, deep learning and partial least squares regression), to quantify the desired products, intermediates and impurities in real time, at multiple points along the synthetic pathway. The capabilities of the system have been demonstrated by operating both steady state and dynamic experiments and represents a significant step forward in data‐driven continuous flow synthesis.
Keywords: flow chemistry, multistep synthesis, process analytical technologies, process control, real-time analysis
Process analytical technologies hold tremendous promise in multistep continuous flow synthesis. Here, four orthogonal real‐time analytical tools are employed in a three step synthesis, with phase separations. Advanced data processing techniques, such as indirect hard modeling and deep learning, facilitate quantification of up to 9 process components. These analytical capabilities are demonstrated for both steady state and dynamic experiments.

Introduction
Continuous flow processing is now widely accepted as a disruptive technology in the synthesis of active pharmaceutical ingredients (APIs) as well as other fine and commodity chemicals. [1] This processing method has proven particularly useful in multiple synthetic transformations in sequence, known as multistep flow synthesis. This approach has been utilized to synthesize a number of APIs, often providing significant improvements in processing time, safety and yield. [2] As the chemical industries move towards increased digitization in development and manufacturing, establishing data‐rich multistep synthesis is of prime importance. [3]
Process analytical technology (PAT) [4] now plays an increasingly central role in continuous flow processing, [5] enabling real‐time reaction monitoring for a range of applications, such as self‐optimization, [6] reaction kinetic analysis, [7] dynamic experimentation, [8] online chiral analysis [9] and process control. [10] Furthermore, there is clear support from regulatory agencies within the pharmaceutical industry for the incorporation of PAT in continuous manufacturing processes to ensure a high standard of safety and product quality. [11]
Until now, such instruments have relied on rather simplistic data processing to determine reaction progress, or relative product distribution (i.e. % content). However, using more powerful data processing techniques, the concentration of products and impurities can be precisely discerned, which substantially improves process control. This is especially important where intermediate workup/separation steps are concerned and for complex reaction mixtures with numerous overlapping species.
The combination of multistep flow synthesis with multiple PAT tools is an area in which surprisingly little progress has been made, although it has the potential to substantially enhance process control, optimization and reaction understanding. A recent report from our laboratories detailed the basic use of three separate PAT tools in an organometallic reaction, facilitating monitoring of each process step individually. [12]
Here we report an integrated reaction and analysis platform, monitored and controlled by a single computer program. The implemented PAT strategy employs three different advanced data processing methods and is capable of quantifying numerous species (including intermediates and impurities) at different points along the process. Furthermore, the developed system communicates with all process peripherals (PAT tools, pumps, sensors, thermostats, mass flow controllers etc.). The capabilities of this system were exemplified in the multistep flow synthesis of mesalazine (5‐ASA), a commonly prescribed drug for treating Crohn's disease and colitis. [13] To our knowledge, such a level of PAT integration in a multistep synthesis has not been previously reported, and leads toward a strong level of process understanding and control.
Results and Discussion
The proposed synthetic route (Figure 1 a) begins from 2‐chlorobenzoic acid (2ClBA), which is nitrated (hazardous chemistry) [1] to provide 5‐nitro‐2‐chlorobenzoic acid (5N‐2ClBA) as the major isomer. The aryl chloride is then displaced by hydroxide at around 200 °C (extreme process windows), [14] yielding 5‐nitrosalicylic acid (5‐NSA). A final hydrogenation step using catalytic static mixers (CSMs, [15] gas‐liquid chemistry) [16] furnishes the API, mesalazine (5‐ASA).
Figure 1.
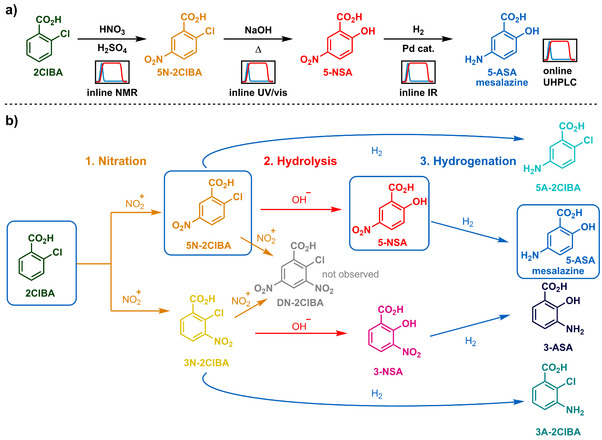
a) The proposed synthetic route for the synthesis of mesalazine (5‐ASA) from 2‐chlorobenzoic acid (2ClBA), via a 3‐step synthetic process. Each step will be analyzed in real‐time using a different PAT tool, as well as a final analysis by UHPLC. b) Impurity map, showing the main expected impurities in this multistep process. Intermediates along the desired reaction pathway are depicted in boxes.
Each step of the synthesis is monitored by a different analytical technique, to capitalize on the advantages provided by each. The nitration is monitored by NMR, the hydrolysis by UV/Vis and hydrogenation is monitored by IR. A final quantification is provided by UHPLC. The flow process must integrate a quench of the nitrating mixture, along with two phase separations, facilitating an acid‐base extraction before the subsequent hydrolysis step. The expected impurities in this sequence, owing to incomplete conversion, or overreaction (Figure 1 b) have been considered for analysis and quantification after each reaction step.
Nitration and Acid/Base Extraction
The first step in the synthetic route is the nitration of 2ClBA. Although nitration reactions are a prime example of hazardous chemistry benefiting from continuous flow processing, there are relatively few where these are employed in multistep sequences. [17] This may be due to the large amount of water necessary to dilute the strongly acidic reaction medium, which consequently requires a phase separation. Such a separation would normally be performed using a gravity separation, or counter‐current extraction. [18] However, for a small scale lab process, these techniques are impracticable, due to their relatively large volumes. Instead, we opted to employ membrane separation as a simple, small volume separation solution. [19]
Initial work was conducted using the highly reactive salicylic acid, but this gave poor regioselectivity and significant overreaction was observed. [20] To combat this issue, we replaced the starting material with 2ClBA and added a hydrolysis (Figure 1 a). Due to the high viscosity of the sulfuric acid solvent and relatively low flow rates (≈1 mL min−1 combined) a split‐and‐recombine type mixer (Ehrfeld, Cascade mixer) was utilized to achieve sufficient mixing for effective reaction (Figure 2 a). [21]
Figure 2.
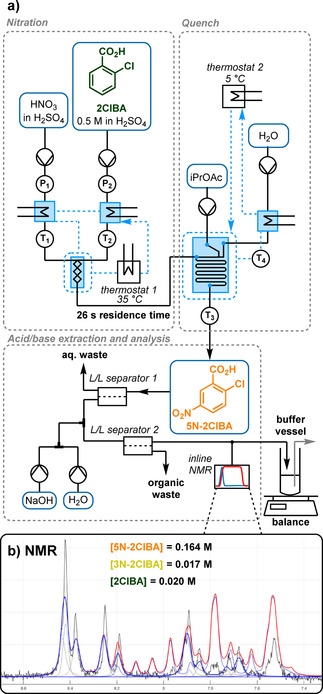
a) The nitration reaction step, followed by aqueous quench and acid/base extraction using membrane separators. T and P represent temperature and pressure sensors, respectively. b) An example process NMR spectrum showing: the recorded low field spectrum (black), the 5N‐2ClBA model (dark blue), the IHM component mixture model (red), with its component individual peaks (gray). Note that the model in this representation is not fitted to the actual NMR spectrum, so that the two can be distinguished more clearly.
Following the reaction itself, a quench/extraction was performed by combining the reaction stream with a premixed water/isopropyl acetate (iPrOAc) stream. To control the exothermic dilution of sulfuric acid and ensure efficient extraction, this was performed in a microstructured reactor (Ehrfeld, FlowPlate, L/L process plate), optimized for biphasic mixing. [22] Since the dilution of sulfuric acid at this point is critical for a safe quench and effective phase separation, a ratio of water to sulfuric acid was maintained above 5.5 (by volume) during optimization and long term processing.
To determine the ideal operating space for the nitration reaction, a detailed study was carried out examining the effect of flow rate, temperature and HNO3 stoichiometry. Although overnitration (producing DN‐2ClBA, Figure 1 b) was not observed, valuable knowledge around regioselectivity was obtained. An operating range for complete 2ClBA conversion, but <15 % 3N‐2ClBA was defined, around the experimental point: 26 s residence time, 35 °C, 1.6 equivalents HNO3. Furthermore, the reaction progress over time was examined, clearly showing the fast rate of reaction between 3.4 s and 20.6 s residence time, at three different temperatures.
Since the hydrolysis step requires basic conditions, an acid/base extraction was implemented using two membrane‐based separators (Zaiput, SEP‐10). First, the acidic aqueous layer was separated from the iPrOAc layer, which contained the organic products. This organic stream was then mixed with sodium hydroxide to deprotonate the carboxylic acid moieties and allow extraction back into the aqueous layer. A second membrane unit was used to isolate the basic aqueous phase for the subsequent hydrolysis.
This nitration and acid/base extraction sequence was analyzed using inline NMR (Magritek, Spinsolve Ultra 43 MHz), generating a 1H NMR spectrum every 12 s. Because of numerous overlapping peaks, simple peak integration was not feasible, so an indirect hard model (IHM) approach to quantification was used (Figure 2 b). [23] This approach fits Gaussian/Lorentzian peaks to the NMR signals to build a chemometric model, which permits flexibility for small changes in peak positions and shapes (S‐PACT, PEAXACT software). The resulting model facilitated accurate component quantification from process spectra (see Supporting Information for details).
By this approach, we quantified the concentrations of the three reaction species at this point (2ClBA, 5N‐2ClBA and 3N‐2ClBA), with an uncertainty of just 2.4, 3.3 and 3.8 mM for the starting material 2ClBA, desired product 5N‐2ClBA and regioisomer 3N‐2ClBA, respectively (error of validation, see Supporting Information for details). The combined analyte concentration at this point was ≈200 mM, so these values represent an excellent model for quantifying the major species. Under normal operation, the concentrations of 2ClBA and 3N‐2ClBA are far lower (in the region of 10–20 mM, Figure 2 b), but the models certainly remain accurate enough to monitor trends and process deviations. Due to occasional spikes in the data (thought to be caused by gas bubbles) a data filter was applied, which removed values outside of a 5 standard deviation range, based on the previous five data points.
Using the NMR data, it was also possible to quantify the hydroxide ion concentration. A linear relationship between hydroxide ion concentration and the chemical shift of the water peak was found (using isopropyl acetate as a reference point, see Supporting Information for details). During an early long run experiment (first two reaction steps, see Supporting Information), a lower‐than‐expected concentration of hydroxide reached the second reaction step. This was attributed to the carry‐over of acid from the first separation, leading to partial neutralization.
Using this calibration, the quantity of acid leaching through the separator could be estimated, by taking the difference between the expected and observed concentration of NaOH (note that this also had to be corrected for substrate concentrations, due to their carboxylic acid moieties). The quantity of H2SO4 dissolved in iPrOAc and carried through the separator was estimated to be in the range of 0.3 M, but varied depending on the flow rates and reaction conditions used (Figure 3). In response to this discrepancy, the input concentration of NaOH can be controlled in real time (whilst maintaining a constant flow rate) by the two pumps positioned after L/L separator 1 (Figure 2 a). It should be noted that some retention of iPrOAc at L/L separator 2 was also observed and quantified by the same IHM.
Figure 3.
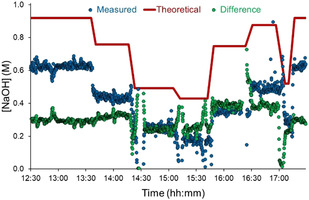
The determination of hydroxide concentration by NMR, at various different flow rates. The measured concentration is shown in blue points, whilst the theoretical (expected) concentration is shown as a red line. The difference between the two is represented in green.
Hydrolysis
In order to install the necessary hydroxyl group, hydrolysis of the aryl chloride intermediate 5N‐2ClBA was performed in a stainless steel coil at up to 210 °C. This facilitated complete conversion in residence times as short as 5 min. To operate at this temperature, the reactor required pressurization, where previously no back pressure was applied. To solve this, two separate pressure zones were set up by using a buffer (or holdup) vessel to feed an HPLC pump (Figure 4 a).
Figure 4.
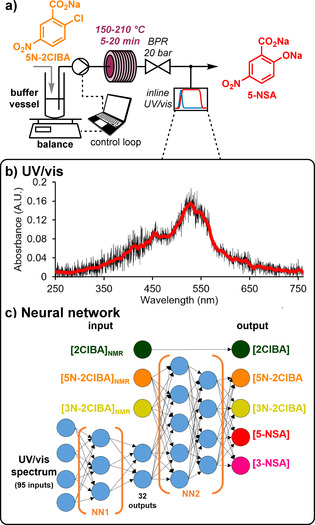
a) The hydrolysis step, using a heated coil reactor. The reactor output is analyzed by UV/Vis. b) Example UV/Vis spectrum, which shows no distinct spectral features for individual species quantification. c) The composed neural networks, which take the UV/Vis spectrum and input concentrations (determined by NMR in the previous step), to provide concentrations of the five reaction components.
To take varying flow rates in the overall process into account, this buffer vessel was positioned on a balance. The balance and HPLC pump were integrated in a control loop, which adjusted the pump flow rate to maintain the mass of process medium in the buffer vessel at 4 g. Due to the varying flow rates, different residence times were experienced in the hydrolysis step. Accordingly, a detailed time course study was carried out to ensure that quantitative conversion of 5N‐2ClBA to the desired 5‐NSA would be achieved, even at shorter residence times. To build up a detailed operating window, temperature and equivalents of NaOH were also varied (see Supporting Information).
At the hydrolysis reactor outlet, the extent of conversion was monitored by using UV/vis spectrometry. In order to avoid compatibility issues with the pressurized and high pH reaction medium, a home‐made flow cell was constructed. The probe was positioned in contact with the polymer tubing containing the reaction stream (0.8 mm inner diameter) held within a 4‐way connector (see Supporting Information). Due to the high absorbance of this reaction mixture, a reflectance probe was used, since standard absorbance measurements were saturated.
The spectra collected at this point, every 2 s, showed relatively little in the way of spectral features (Figure 4 b), therefore it was decided to implement a neural network (NN) to quantify analytes (Figure 4 c). [24] To our knowledge, the use of deep learning with real‐time PAT data for organic synthesis in continuous flow has not been previously described, [25] but holds significant promise, particularly when amalgamated with knowledge from other instruments. The developed NNs functioned by combining the last recorded UV/Vis spectrum with previously measured NMR data to determine the analyte concentrations at this point. In order to simplify the NN input, the UV/Vis spectrum was reduced from 2048 data points to 95, by averaging every 20 values (roughly 5–6 nm). This was then processed by NN1, resulting in 32 outputs. These were combined with concentrations previously measured at the NMR, for interpretation by NN2.
NMR results were smoothed using a Savitzky–Golay filter (window of 25 spectra with 3rd order polynomial treatment) and fed forward by the difference in residence time between the two instruments (≈20 min). 2ClBA was not observed to undergo any reaction in the hydrolysis step, so its previously measured concentration was simply read out as the current concentration. The other two concentrations from the NMR were fed into NN2, along with the UV/Vis spectrum (represented by 32 data points), which provided concentrations of all four remaining species.
The NNs were scripted in python (v3.7), using Keras application programming interface (based on TensorFlow 2.0). Training was done using data obtained by ramping the temperature of the hydrolysis reactor from 20 to 210 °C, to provide 0–100 % conversion of the input material (≈35 000 spectra). These training spectra were augmented with compound mixture spectra (≈8000 spectra) and selected steady state levels from pre‐existing process data (≈6000 spectra). The “Adam” optimizer was used and 25 % of the data was removed to use as a validation subset. Resulting error statistics were very low (e.g. desired product 5‐NSA=2.8 mM), but it should be noted that these values will also be impacted by errors propagated from the NMR quantification model. Due to the frequency of UV/Vis measurements (every 2 s), fast data processing was required to provide satisfcatory real‐time data. The NN concentration predictions required only 1.4 ms to process a single spectrum (or 36 μs per spectrum to process a 1000 spectrum batch).
Hydrogenation
The final synthetic transformation is the reduction of the installed nitro group to its corresponding amine (Figure 5 a). Nitro reductions have become a routine reaction for continuous flow operation, generally using a packed bed reactor. [26] However, recent advances in 3D printing and coating technologies have introduced catalytically‐coated static mixers (CSMs) as a viable alternative. [15] This approach simplifies scale‐up, since issues concerning particle sizing, channeling and pressure drop can be obviated. For this multistep process, the hydrogenation was carried out using a reactor with rectangular channels (Ehrfeld, Miprowa), equipped with bespoke Pd electroplated CSMs.
Figure 5.
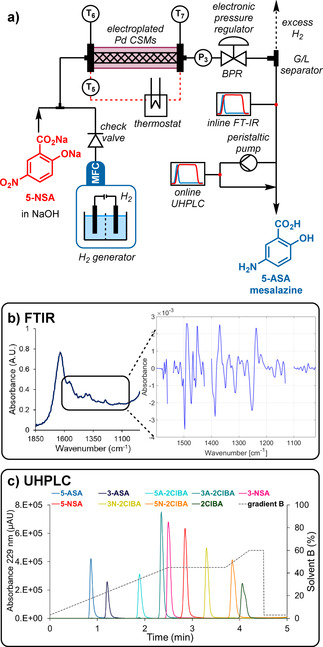
The reaction and analytics setup used for the hydrogenation. a) Detailed reaction setup schematic (P and T=pressure and temperature sensors). b) Representative infrared spectrum used for species quantification with a PLS model. The region considered is highlighted, with the insert showing the pretreated spectrum fed into the model. c) A demonstration of the species separation achieved in the developed online UHPLC method. The solvent gradient is plotted as a dotted line (gray). Note: an additional 2.5 min is allowed (not shown) for equilibration, prior to the next injection.
Hydrogen gas was supplied by a commercial H2 generator with an integrated mass flow controller (Thales Nano, H‐Genie) and the pressure was controlled by a back pressure regulator (Equilibar, Zero Flow) linked to a pressurized nitrogen supply, with automated electronic regulation (Bronkhorst, EL‐PRESS). This setup facilitated reaction optimization, including automated adjustment of gas and liquid flow rates, system pressure and temperature. A study was also carried out for this reaction step, to provide a clear view of the influence of each reaction parameter and develop a robust operating space.
This study simply examined the conversion of 5‐NSA to 5‐ASA, under the assumption that the observed factor influences could be applied to other nitro compounds present in a telescoped process mixture. Aside from residence time, temperature (40–80 °C examined) was found to have the most significant influence, followed by the flow rate of H2 (25–75 mL N min−1 examined). Pressure (6–12 bar examined) was also found to significantly increase reaction rate, and numerous parameter interactions were also identified. It was extrapolated from this data that, when working at 80 °C and 12 bar pressure, all nitro species present in the reaction stream would be quantitatively reduced to their corresponding anilines (in particular, the desired reaction pathway: 5‐NSA to 5‐ASA).
In order to provide real‐time quantification of this step, a simple gas‐liquid separator was constructed (see Supporting Information), and connected to an IR probe (Mettler Toledo, ReactIR 15). Here, a spectrum was acquired every 15 s and the data was processed using a partial least squares (PLS) regression model (Figure 5 b). [20] This model was selected instead of an IHM in this case, due to better performance, but was also set up and processed in real time using PEAXACT software.
The models were validated using 10 separate averaged spectra from process data. Here, the errors were found to be low, considering the difficulty of quantification. The main product 5‐ASA was evaluated to have a validation error of 7.7 mM, which is <5 % of the expected 180 mM concentration in the process stream. The models for other analytes provided validation errors of between 1.4 and 15.4 mM, implying overall excellent quantification accuracy. Furthermore, the variation between measurements was found to be very low, so no additional filter/averaging of the data was required. This set of PLS models provided useful concentration predictions for all nine of the examined species.
To achieve a detailed overview of the final reaction composition after the multistep procedure, online ultra‐high performance liquid chromatography (UHPLC, Shimadzu, Nexera X2) was incorporated, using a 10 nL sample injector (Vici, Cheminert Nanovolume). A fast gradient‐based method was developed, which allowed an injection every 7.5 min (Figure 5 c). Despite this short analysis time, all nine of the identified process components could be separated, allowing precise quantification. Again, all nine components were calibrated simultaneously, using seven injection mixtures of different concentration levels.
Telescoped Process: Steady State Operation
As discussed for each of the PAT instruments individually, their placement in the multistep process has been thoroughly planned. NMR can distinguish the different regioisomers arising from the nitration reaction, as well as analyzing the separations, based on chemical shifts due to varying pH. UV/Vis takes advantage of colored product formation in the hydrolysis step, whilst inline IR distinguishes well between amino and nitro groups. Each of these techniques has a fast sampling time (NMR=10 s, UV/Vis=2 s, IR=15 s), so provide good resolution of the process data. UHPLC is positioned at the end of the process, to deliver a precise quantification of all process species every 7.5 min.
After optimization of the individual reaction steps, these were brought together to run as a telescoped process (Figure 6). Integration of all component parts within the same operational system was key to the smooth operation and management of this multistep process and its acquired data. This was achieved using open platform communication unified architecture (OPC UA), a modern industry standard for inter‐platform equipment communication. By this protocol, all pumps, probes, thermostats and other equipment were actively monitored and controlled through a single supervisory control and data acquisition (SCADA) software (Evon, XAMControl). Achieving this with equipment from numerous different suppliers represents a significant challenge, due to the lack of unified communication protocols and documentation. However, this also allowed real‐time readouts of concentrations from the PAT tools, using the developed chemometric models. It should be noted that UHPLC and UV/Vis results were delivered by a direct connection to the computer rather than OPC UA, with report file monitoring for new results (UHPLC) or a direct connection to the SCADA software (UV/Vis).
Figure 6.
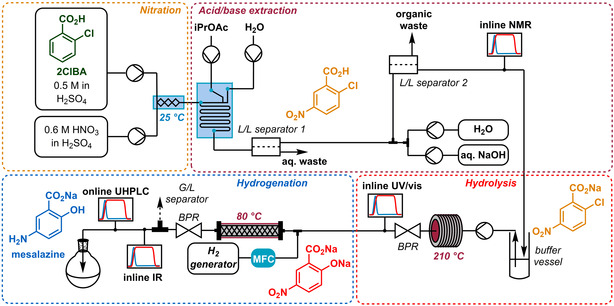
The multistep, multi‐PAT reaction setup towards the API mesalazine, 5‐ASA. For a more detailed overview, see Supporting Information.
To demonstrate the multistep process, a long run experiment under the optimized conditions was carried out for 3.5 h of steady state operation (Figure 7). The startup period in this case was of particular interest, since it demonstrates the distribution of the species as they progress through the system and reach each of the respective PAT instruments (Figure 7 a). Steady state concentration was reached at the NMR after 22 min, UV/Vis after 38 min and IR after 54 min. The use of analytical instruments with fast scan rates allow this characterization to be carried out in a straightforward manner, whilst preserving the reaction media viscosity and separation properties, since a different tracer reagent is not necessary.
Figure 7.
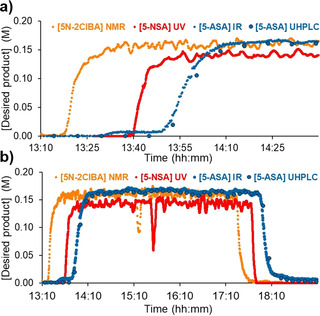
The steady state operation of the telescoped process. Note: for clarity, only the major species at each PAT tool is shown. a) An expanded section showing the process startup, to focus on the relative residence times and concentration gradients at each PAT tool. b) An overall view of the telescoped process. Note: the NMR shim was lost at 15:14, resulting in the observed concentration drop by both NMR and UV/Vis analysis.
Another important aspect is the relative gradient of concentration increase at each point during the startup, which can be taken as a measure of flow dispersion. It would be expected that this gradient would become increasingly shallow as the time within the system increases, due to a broadening residence time distribution. The buffer vessel before the hydrolysis was of key concern here, but owing to the intentionally small holdup volume (≈4 mL), this appears to have had a minimal effect. This is evidenced by the comparable concentration gradients for the NMR, UV/Vis and IR analyses. This relatively narrow distribution (i.e. good overall plug flow character) implies that the effect of parameter alterations should proliferate through the system quickly, without delay caused by excessive dead volume.
Once steady state was reached, processing was stable for the entire period, aside from a loss of NMR shim at 15:14 (Figure 7), which was observed by a drop in [5N‐2ClBA] at the NMR. This could quickly be resolved by using a 6‐port valve setup to inject a separate shim sample, resulting in recovery of steady state analysis within 6 min, without interfering with the process stream (15:14–15:20, Figure 7, see Supporting Information for details of 6‐port valve setup). Because the UV/Vis NN takes inputs from the NMR, this meant that the deviation was also observed in this instrument. However, the process stream would not erroneously be diverted to waste, since the disturbance was not observed by IR or UHPLC.
The steady state operation in this long run resulted in average [5‐ASA] of 0.166 mM and average flow rate of 1.073 mL min−1, synthesizing 1.6 g h−1 of the desired 5‐ASA product (mesalazine). This corresponds to 79 % assay yield over three steps, based on input 2ClBA. Extrapolating to longer term operation, this would provide 38.4 g per day in this lab scale system (total volume ≈55 mL). It is envisaged that a larger scale system could be established in a facile manner, based on the rigorous reaction development performed here.
Telescoped Process: Dynamic Operation
To demonstrate the synergy between different PAT tools and their predictive power towards rapidly detecting and monitoring process deviations, dynamic experimentation was carried out. This was performed by varying the temperature of each reaction, within the ranges explored in the respective studies for each individual reaction step, and then monitoring the response of the system. The temperature ranges for the individual steps were as follows: 0–35 °C for nitration, 150–210 °C for hydrolysis and 40–80 °C for hydrogenation. The reactor temperature ramps were introduced separately, inducing changes in conversion and/or selectivity (Figure 8).
Figure 8.
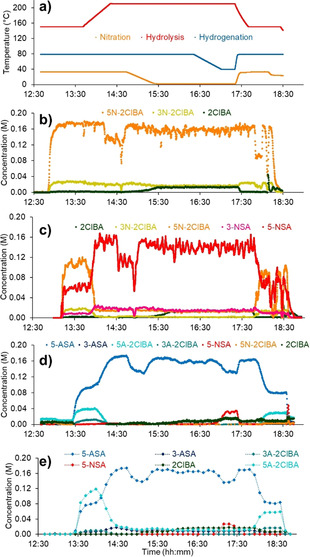
Summary of data from dynamic experiment, where temperatures of different reaction steps were varied. a) Temperature traces from the reactor, showing when changes were introduced. b) Inline NMR data, quantified by an indirect hard model. c) Inline UV/Vis data, quantified by a neural network. d) Inline IR data, quantified by a partial least squares regression model. e) Online UHPLC data, quantified by peak integration.
Initially, a low temperature was set for the hydrolysis reaction (until 13:40), resulting in incomplete conversion and elevated [5A‐2ClBA], observed by UV/Vis, IR and UHPLC. At this point, one limitation of the IR PLS model is visible, since [5A‐2ClBA] is estimated to be 40 mM, but online UHPLC analysis reveals concentration between 80–120 mM in the same region. Nevertheless, the correct trend is observed, which would allow correction of the reaction conditions, towards 5‐ASA, in a timely manner.
Prior to the decrease in nitration temperature, at 14:10 (Figure 8), a problem with L/L separator 1 was observed, characterized by a decrease in [5N‐2ClBA] at the NMR. The quantification of concentration at this point, rather than relative product distribution, allowed the problem to be identified and solved quickly, by replacing the separator. This minimized the disruption caused, resulting in a drop of [5‐ASA] at the UHPLC by ≈40 mM for around 30 min.
At 14:45, the nitration temperature was decreased, resulting in incomplete conversion, with ≈12–18 mM 2ClBA remaining in the reaction mixture. This persisted through the process and was successfully quantified by all four PAT tools. Before increasing the nitration temperature to its original value, the hydrogenation temperature was also decreased (at 16:20). The effect was observed as an increase in nitro species, 5‐NSA, which was successfully detected at ≈30 mM by both UHPLC and IR analyses. These results demonstrate the utility of a multi‐PAT approach for dynamic experimentation in a multistep system.
Conclusion
In summary, we have designed a fully integrated multistep reaction and real‐time analysis platform, controlled within a single software system. The platform was used to synthesize the API mesalazine in a fully controlled and robust manner, over three synthetic steps and three phase separations, with a throughput of 1.6 g h−1. The use of four real‐time analytical tools was augmented by advanced data processing techniques. Synergy between multiple PAT instruments proved to be powerful in two ways. Firstly, UHPLC quantification, was used to add process data at steady state to training data sets for other PAT chemometric models. Additionally, as demonstrated with NN processing (for UV/Vis), analysis methods can be developed which take previous measurements into account, in a feed‐forward mechanism. Ongoing work in our labs will further capitalize on these developments in self‐optimization and model‐predictive control applications.
Conflict of interest
The authors declare no conflict of interest.
Supporting information
As a service to our authors and readers, this journal provides supporting information supplied by the authors. Such materials are peer reviewed and may be re‐organized for online delivery, but are not copy‐edited or typeset. Technical support issues arising from supporting information (other than missing files) should be addressed to the authors.
Supplementary
Acknowledgements
This work was funded by the Austrian Research Promotion Agency FFG No. 871458, within the program “Produktion der Zukunft”. The INFRA FLOW project (Zukunftsfonds Steiermark No. 9003) is funded by the State of Styria (Styrian Funding Agency SFG). The CCFLOW Project (Austrian Research Promotion Agency FFG No. 862766) is funded through the Austrian COMET Program by the Austrian Federal Ministry of Transport, Innovation and Technology (BMVIT), the Austrian Federal Ministry for Digital and Economic Affairs (BMDW), and by the State of Styria (Styrian Funding Agency SFG). The authors would like to thank Dr. Clemens Minnich and Dr. Simon Kern (S‐PACT) for software and chemometric model support, Dr. Stefan Kowarik (University of Graz) for assistance with neural networks and Mr Bernd Stein (HiTec Zang) for LabManager connectivity support.
P. Sagmeister, R. Lebl, I. Castillo, J. Rehrl, J. Kruisz, M. Sipek, M. Horn, S. Sacher, D. Cantillo, J. D. Williams, C. O. Kappe, Angew. Chem. Int. Ed. 2021, 60, 8139.
A previous version of this manuscript has been deposited on a preprint server (https://doi.org/10.26434/chemrxiv.13299488.v1).
Contributor Information
Dr. Jason D. Williams, Email: jason.williams@rcpe.at.
Prof. Dr. C. Oliver Kappe, Email: oliver.kappe@uni-graz.at.
References
- 1.For reviews of flow chemistry for API synthesis, see:
- 1a. Plutschack M. B., Pieber B., Gilmore K., Seeberger P. H., Chem. Rev. 2017, 117, 11796–11893; [DOI] [PubMed] [Google Scholar]
- 1b. Porta R., Benaglia M., Puglisi A., Org. Process Res. Dev. 2016, 20, 2–25; [Google Scholar]
- 1c. Gutmann B., Cantillo D., Kappe C. O., Angew. Chem. Int. Ed. 2015, 54, 6688–6728; [DOI] [PubMed] [Google Scholar]; Angew. Chem. 2015, 127, 6788–6832; [Google Scholar]
- 1d. Gérardy R., Emmanuel N., Toupy T., Kassin V. E., Tshibalonza N. N., Schmitz M., Monbaliu J. C. M., Eur. J. Org. Chem. 2018, 2301–2351; [Google Scholar]
- 1e. Kobayashi S., Chem. Asian J. 2016, 11, 425–436; [DOI] [PMC free article] [PubMed] [Google Scholar]
- 1f. Baumann M., Baxendale I. R., Beilstein J. Org. Chem. 2015, 11, 1194–1219. [DOI] [PMC free article] [PubMed] [Google Scholar]
- 2.For reviews of multistep flow synthesis, see:
- 2a. Bloemendal V. R. L. J., Janssen M. A. C. H., van Hest J. C. M., Rutjes F. P. J. T., React. Chem. Eng. 2020, 5, 1186–1197; [Google Scholar]
- 2b. Fülöp Z., Szemesi P., Bana P., Éles J., Greiner I., React. Chem. Eng. 2020, 5, 1527–1555; [Google Scholar]
- 2c. Jiao J., Nie W., Yu T., Yang F., Zhang Q., Aihemaiti F., Yang T., Liu X., Wang J., Li P., Chem. Eur. J. 2020, 10.1002/chem.202004477; [DOI] [PubMed] [Google Scholar]
- 2d. Britton J., Raston C. L., Chem. Soc. Rev. 2017, 46, 1250–1271; [DOI] [PubMed] [Google Scholar]
- 2e. Webb D., Jamison T. F., Chem. Sci. 2010, 1, 675–680; [Google Scholar]
- 2f. Pieber B., Gilmore K., Seeberger P. H., J. Flow Chem. 2017, 7, 129–136. [Google Scholar]
- 3.For selected examples of integrated multistep flow systems, see:
- 3a. Adamo A., Beingessner R. L., Behnam M., Chen J., Jamison T. F., Jensen K. F., Monbaliu J. C. M., Myerson A. S., Revalor E. M., Snead D. R., Stelzer T., Weeranoppanant N., Wong S. Y., Zhang P., Science 2016, 352, 61–67; [DOI] [PubMed] [Google Scholar]
- 3b. Coley C. W., Thomas D. A., Lummiss J. A. M., Jaworski J. N., Breen C. P., Schultz V., Hart T., Fishman J. S., Rogers L., Gao H., Hicklin R. W., Plehiers P. P., Byington J., Piotti J. S., Green W. H., Jamison T. F., Jensen K. F., Science 2019, 365, eaax1566; [DOI] [PubMed] [Google Scholar]
- 3c. Bédard A., Adamo A., Aroh K. C., Russell M. G., Bedermann A. A., Torosian J., Yue B., Jensen K. F., Jamison T. F., Science 2018, 361, 1220–1225; [DOI] [PubMed] [Google Scholar]
- 3d. Chatterjee S., Guidi M., Seeberger P. H., Gilmore K., Nature 2020, 579, 379–384; [DOI] [PubMed] [Google Scholar]
- 3e. Steiner S., Wolf J., Glatzel S., Andreou A., Granda J. M., Keenan G., Hinkley T., Aragon-Camarasa G., Kitson P. J., Angelone D., Cronin L., Science 2019, 363, eaav2211. [DOI] [PubMed] [Google Scholar]
- 4. Workman J., Lavine B., Chrisman R., Koch M., Anal. Chem. 2011, 83, 4557–4578. [DOI] [PubMed] [Google Scholar]
- 5.For reviews of PAT in continuous flow, see:
- 5a. Reizman B. J., Jensen K. F., Acc. Chem. Res. 2016, 49, 1786–1796; [DOI] [PubMed] [Google Scholar]
- 5b. Fitzpatrick D. E., Battilocchio C., Ley S. V., ACS Cent. Sci. 2016, 2, 131–138; [DOI] [PMC free article] [PubMed] [Google Scholar]
- 5c. Bordawekar S., Chanda A., Daly A. M., Garrett A. W., Higgins J. P., LaPack M. A., Maloney T. D., Morgado J., Mukherjee S., Orr J. D., et al., Org. Process Res. Dev. 2015, 19, 1174–1185; [Google Scholar]
- 5d. Eifert T., Eisen K., Maiwald M., Herwig C., Anal. Bioanal. Chem. 2020, 412, 2037–2045; [DOI] [PMC free article] [PubMed] [Google Scholar]
- 5e. Eisen K., Eifert T., Herwig C., Maiwald M., Anal. Bioanal. Chem. 2020, 412, 2027–2035; [DOI] [PMC free article] [PubMed] [Google Scholar]
- 5f. Price G. A., Mallik D., Organ M. G., J. Flow Chem. 2017, 7, 82–86; [Google Scholar]
- 5g. Ley S. V., Fitzpatrick D. E., Ingham R. J., Myers R. M., Angew. Chem. Int. Ed. 2015, 54, 3449–3464; [DOI] [PubMed] [Google Scholar]; Angew. Chem. 2015, 127, 3514–3530; [Google Scholar]
- 5h. Haven J. J., Junkers T., Eur. J. Org. Chem. 2017, 6474–6482. [Google Scholar]
- 6.
- 6a. Sans V., Cronin L., Chem. Soc. Rev. 2016, 45, 2032–2043; [DOI] [PMC free article] [PubMed] [Google Scholar]
- 6b. Clayton A. D., Manson J. A., Taylor C. J., Chamberlain T. W., Taylor B. A., Clemens G., Bourne R. A., React. Chem. Eng. 2019, 4, 1545–1554; [Google Scholar]
- 6c. Mateos C., Nieves-Remacha M. J., Rincón J. A., React. Chem. Eng. 2019, 4, 1536–1544; [Google Scholar]
- 6d. Rubens M., Vrijsen J. H., Laun J., Junkers T., Angew. Chem. Int. Ed. 2019, 58, 3183–3187; [DOI] [PubMed] [Google Scholar]; Angew. Chem. 2019, 131, 3215–3219; [Google Scholar]
- 6e. Rubens M., Van Herck J., Junkers T., ACS Macro Lett. 2019, 8, 1437–1441. [DOI] [PubMed] [Google Scholar]
- 7.
- 7a. Duan X., Tu J., Teixeira A. R., Sang L., Jensen K. F., Zhang J., React. Chem. Eng. 2020, 5, 1751–1758; [Google Scholar]
- 7b. Pankajakshan A., Quaglio M., Galvanin F., Gavriilidis A., React. Chem. Eng. 2019, 4, 1623–1636. [Google Scholar]
- 8.
- 8a. Moore J. S., Jensen K. F., Angew. Chem. Int. Ed. 2014, 53, 470–473; [DOI] [PubMed] [Google Scholar]; Angew. Chem. 2014, 126, 480–483; [Google Scholar]
- 8b. Wyvratt B. M., McMullen J. P., Grosser S. T., React. Chem. Eng. 2019, 4, 1637–1645; [Google Scholar]
- 8c. Hone C. A., Holmes N., Akien G. R., Bourne R. A., Muller F. L., React. Chem. Eng. 2017, 2, 103–108. [DOI] [PMC free article] [PubMed] [Google Scholar]
- 9. Organ M. G., Kwak J. S., Bizarri N., Sharif S., Mallik D., Zhang W., Chem. Eur. J. 2020, 26, 15505–15508. [DOI] [PubMed] [Google Scholar]
- 10.
- 10a. Ingham R. J., Battilocchio C., Fitzpatrick D. E., Sliwinski E., Hawkins J. M., Ley S. V., Angew. Chem. Int. Ed. 2015, 54, 144–148; [DOI] [PMC free article] [PubMed] [Google Scholar]; Angew. Chem. 2015, 127, 146–150; [Google Scholar]
- 10b. Fitzpatrick D. E., Ley S. V., Tetrahedron 2018, 74, 3087–3100. [Google Scholar]
- 11.
- 11a. Lee S. L., O'Connor T. F., Yang X., Cruz C. N., Chatterjee S., Madurawe R. D., Moore C. M. V., Yu L. X., Woodcock J., J. Pharm. Innov. 2015, 10, 191–199; [Google Scholar]
- 11b. Testa C. J., Hu C., Shvedova K., Wu W., Sayin R., Casati F., Halkude B. S., Hermant P., Shen D. E., Ramnath A., Su Q., Born S. C., Takizawa B., Chattopadhyay S., O'Connor T. F., Yang X., Ramanujam S., Mascia S., Org. Process Res. Dev. 2020, 24, 2874–2889; [Google Scholar]
- 11c. Nasr M. M., Krumme M., Matsuda Y., Trout B. L., Badman C., Mascia S., Cooney C. L., Jensen K. D., Florence A., Johnston C., Konstantinov K., Lee S. L., J. Pharm. Sci. 2017, 106, 3199–3206; [DOI] [PubMed] [Google Scholar]
- 11d. Mesbah A., Paulson J. A., Lakerveld R., Braatz R. D., Org. Process Res. Dev. 2017, 21, 844–854. [Google Scholar]
- 12. Sagmeister P., Williams J. D., Hone C. A., Kappe C. O., React. Chem. Eng. 2019, 4, 1571–1578. [Google Scholar]
- 13.
- 13a. Vijaya Lakshmi C., Katari N. K., Jonnalagadda S. B., Green Process. Synth. 2019, 8, 320–323; [Google Scholar]
- 13b. Thomsen O. Ø., Cortot A., Jewell D., Wright J. P., Winter T., Veloso F. T., Vatn M., Persson T., Pettersson E., N. Engl. J. Med. 1998, 339, 370–374. [DOI] [PubMed] [Google Scholar]
- 14.
- 14a. Hessel V., Kralisch D., Kockmann N., Noël T., Wang Q., ChemSusChem 2013, 6, 746–789; [DOI] [PubMed] [Google Scholar]
- 14b. Hessel V., Kralisch D., Kockmann N., Novel Process Windows: Innovative Gates to Intensified and Sustainable Chemical Processes, Wiley-VCH, Weinheim, 2014. [Google Scholar]
- 15.
- 15a. Lebl R., Zhu Y., Ng D., Hornung C. H., Cantillo D., Kappe C. O., Catal. Today 2020, 10.1016/j.cattod.2020.07.046; [DOI] [Google Scholar]
- 15b. Avril A., Hornung C. H., Urban A., Fraser D., Horne M., Veder J. P., Tsanaktsidis J., Rodopoulos T., Henry C., Gunasegaram D. R., React. Chem. Eng. 2017, 2, 180–188; [Google Scholar]
- 15c. Gardiner J., Nguyen X., Genet C., Horne M. D., Hornung C. H., Tsanaktsidis J., Org. Process Res. Dev. 2018, 22, 1448–1452; [Google Scholar]
- 15d. Hornung C. H., Nguyen X., Carafa A., Gardiner J., Urban A., Fraser D., Horne M. D., Gunasegaram D. R., Tsanaktsidis J., Org. Process Res. Dev. 2017, 21, 1311–1319. [Google Scholar]
- 16.
- 16a. Mallia C. J., Baxendale I. R., Org. Process Res. Dev. 2016, 20, 327–360; [Google Scholar]
- 16b. Hone C. A., Roberge D. M., Kappe C. O., ChemSusChem 2017, 10, 32–41; [DOI] [PubMed] [Google Scholar]
- 16c. Gemoets H. P. L., Su Y., Shang M., Hessel V., Luque R., Noël T., Chem. Soc. Rev. 2016, 45, 83–117. [DOI] [PubMed] [Google Scholar]
- 17.
- 17a. Cantillo D., Damm M., Dallinger D., Bauser M., Berger M., Kappe C. O., Org. Process Res. Dev. 2014, 18, 1360–1366; [Google Scholar]
- 17b. Cantillo D., Wolf B., Goetz R., Kappe C. O., Org. Process Res. Dev. 2017, 21, 125–132; [Google Scholar]
- 17c. Sharma Y., Nikam A. V., Kulkarni A. A., Org. Process Res. Dev. 2019, 23, 170–176; [Google Scholar]
- 17d. Köckinger M., Wyler B., Aellig C., Roberge D. M., Hone C. A., Kappe C. O., Org. Process Res. Dev. 2020, 24, 2217–2227. [Google Scholar]
- 18. Hohmann L., Kurt S. K., Soboll S., Kockmann N., J. Flow Chem. 2016, 6, 181–190. [Google Scholar]
- 19.For selected publications using membrane-based separators, see:
- 19a. Adamo A., Heider P. L., Weeranoppanant N., Jensen K. F., Ind. Eng. Chem. Res. 2013, 52, 10802–10808; [Google Scholar]
- 19b. Dai C., Snead D. R., Zhang P., Jamison T. F., J. Flow Chem. 2015, 5, 133–138; [Google Scholar]
- 19c. Lebl R., Murray T., Adamo A., Cantillo D., Kappe C. O., ACS Sustainable Chem. Eng. 2019, 7, 20088–20096; [Google Scholar]
- 19d. Harvie A. J., Herrington J. O., Demello J. C., React. Chem. Eng. 2019, 4, 1579–1588; [Google Scholar]
- 19e. Peeva L., Da Silva Burgal J., Heckenast Z., Brazy F., Cazenave F., Livingston A., Angew. Chem. Int. Ed. 2016, 55, 13576–13579; [DOI] [PMC free article] [PubMed] [Google Scholar]; Angew. Chem. 2016, 128, 13774–13777; [Google Scholar]
- 19f. Jeong G. Y., Singh A. K., Kim M. G., Gyak K. W., Ryu U. J., Choi K. M., Kim D. P., Nat. Commun. 2018, 9, 3968; [DOI] [PMC free article] [PubMed] [Google Scholar]
- 19g. Maurya R. A., Min K. I., Kim D. P., Green Chem. 2014, 16, 116–120. See also, references [3a–c]. [Google Scholar]
- 20. Sagmeister P., Poms J., Williams J. D., Kappe C. O., React. Chem. Eng. 2020, 5, 677–684. [Google Scholar]
- 21. Holvey C. P., Roberge D. M., Gottsponer M., Kockmann N., Macchi A., Chem. Eng. Process. 2011, 50, 1069–1075. [Google Scholar]
- 22. Mielke E., Roberge D. M., Macchi A., J. Flow Chem. 2016, 6, 279–287. [Google Scholar]
- 23.
- 23a. Kern S., Meyer K., Guhl S., Gräßer P., Paul A., King R., Maiwald M., Anal. Bioanal. Chem. 2018, 410, 3349–3360; [DOI] [PubMed] [Google Scholar]
- 23b. Kern S., Wander L., Meyer K., Guhl S., Mukkula A. R. G., Holtkamp M., Salge M., Fleischer C., Weber N., King R., Engell S., Paul A., Pereira Remelhe M., Maiwald M., Anal. Bioanal. Chem. 2019, 411, 3037–3046. [DOI] [PMC free article] [PubMed] [Google Scholar]
- 24.
- 24a. Long J. R., Gregoriou V. G., Gemperline P. J., Anal. Chem. 1990, 62, 1791–1797; [Google Scholar]
- 24b. Despagne F., Luc Massart D., Analyst 1998, 123, 157–178; [DOI] [PubMed] [Google Scholar]
- 24c. Gasteiger J., Zupan J., Angew. Chem. Int. Ed. Engl. 1993, 32, 503–527; [Google Scholar]; Angew. Chem. 1993, 105, 510–536. [Google Scholar]
- 25.To our knowledge, there is only a single recent report of neural network processing for data generated by PAT in flow: Kern S., Liehr S., Wander L., Bornemann-Pfeiffer M., Müller S., Maiwald M., Kowarik S., Anal. Bioanal. Chem. 2020, 412, 4447–4459. [DOI] [PMC free article] [PubMed] [Google Scholar]
- 26.For selected examples, see:
- 26a. Fabry D. C., Heddrich S., Sugiono E., Liauw M. A., Rueping M., React. Chem. Eng. 2019, 4, 1486–1491; [Google Scholar]
- 26b. Fernandez-Puertas E., Robinson A. J., Robinson H., Sathiyalingam S., Stubbs H., Edwards L. J., Org. Process Res. Dev. 2020, 24, 2147–2156; [Google Scholar]
- 26c. Carangio A., Edwards L. J., Fernandez-Puertas E., Hayes J. F., Kucharski M. M., Rutherford G. W., Wheelhouse K. M. P., Williams G. D., Org. Process Res. Dev. 2020, 24, 1909–1915; [Google Scholar]
- 26d. Ouchi T., Battilocchio C., Hawkins J. M., Ley S. V., Org. Process Res. Dev. 2014, 18, 1560–1566. [Google Scholar]
Associated Data
This section collects any data citations, data availability statements, or supplementary materials included in this article.
Supplementary Materials
As a service to our authors and readers, this journal provides supporting information supplied by the authors. Such materials are peer reviewed and may be re‐organized for online delivery, but are not copy‐edited or typeset. Technical support issues arising from supporting information (other than missing files) should be addressed to the authors.
Supplementary


