Summary
Our knowledge of copy number evolution during the expansion of primary breast tumors is limited1,2. To investigate this process, we developed a single cell, single-molecule DNA sequencing method and performed copy number analysis of 16,178 single cells from 8 triple-negative breast cancers (TNBCs) and 4 cell lines. Our data shows that breast tumors and cell lines are comprised of a large milieu of subclones (7–22) that are organized into a few (3–5) major superclones. Evolutionary analysis suggests that after clonal TP53 mutations, multiple LOH events and genome doubling, there was a period of transient genomic instability followed by ongoing copy number evolution during the primary tumor expansion. By subcloning single daughter cells in culture, we show that tumor cells re-diversify their genomes and do not retain isogenic properties. These data show that TNBCs continue to evolve chromosome aberrations and maintain a reservoir of subclonal diversity during primary tumor growth.
Aneuploidy is a salient feature of human breast cancers and is particularly prevalent in triple-negative breast cancer (TNBC) patients that harbor TP53 mutations3,4. While the underlying molecular mechanisms of aneuploidy have been elucidated in model systems5, our knowledge of when and how chromosomal rearrangements emerge in human patients and are maintained during the growth of primary tumors remains limited. A long-standing paradigm for tumor progression is that mutations and chromosomal aberrations accumulate gradually and sequentially over time, leading to more malignant stages of cancer6. However, an alternative model is Punctuated Copy Number Evolution (PCNE), in which many chromosomal rearrangements are acquired together in short bursts of genomic instability early in tumor evolution7–10,11,12. Evidence for this model has been reported in breast tumors7,9, colon cancers10 and prostate cancers8 and may be common in many human cancer types13.
An unresolved question is whether there is also ongoing copy number evolution after the initial burst of genome instability1,7,14. In our previous work we found that PCNE is common in TNBC patients7, but were unable to ascertain whether copy number profiles continued to evolve after the initial catastrophic event, when tumor cells undergo clonal expansions. Resolving these models has been difficult due to the limited number of cells that could be sequenced, as well as extensive technical noise in first-generation single cell DNA sequencing (scDNA-seq) technologies9. Here we report on a significant technical advance that allowed us to sequence thousands of single cells and address fundamental questions regarding the natural history of chromosome evolution in TNBC patients.
Results
Single-molecule Single Cell Sequencing
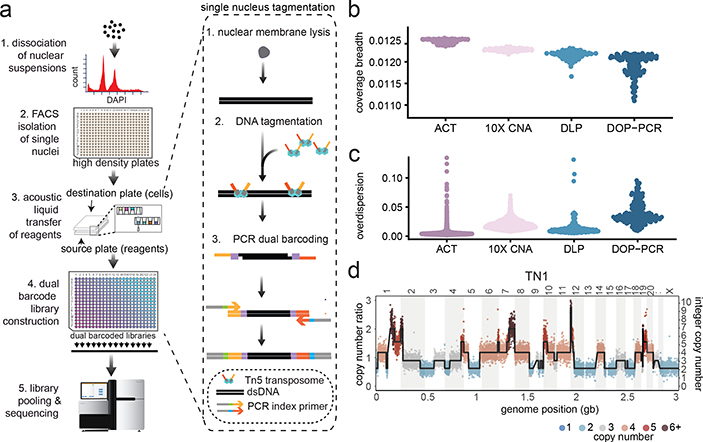
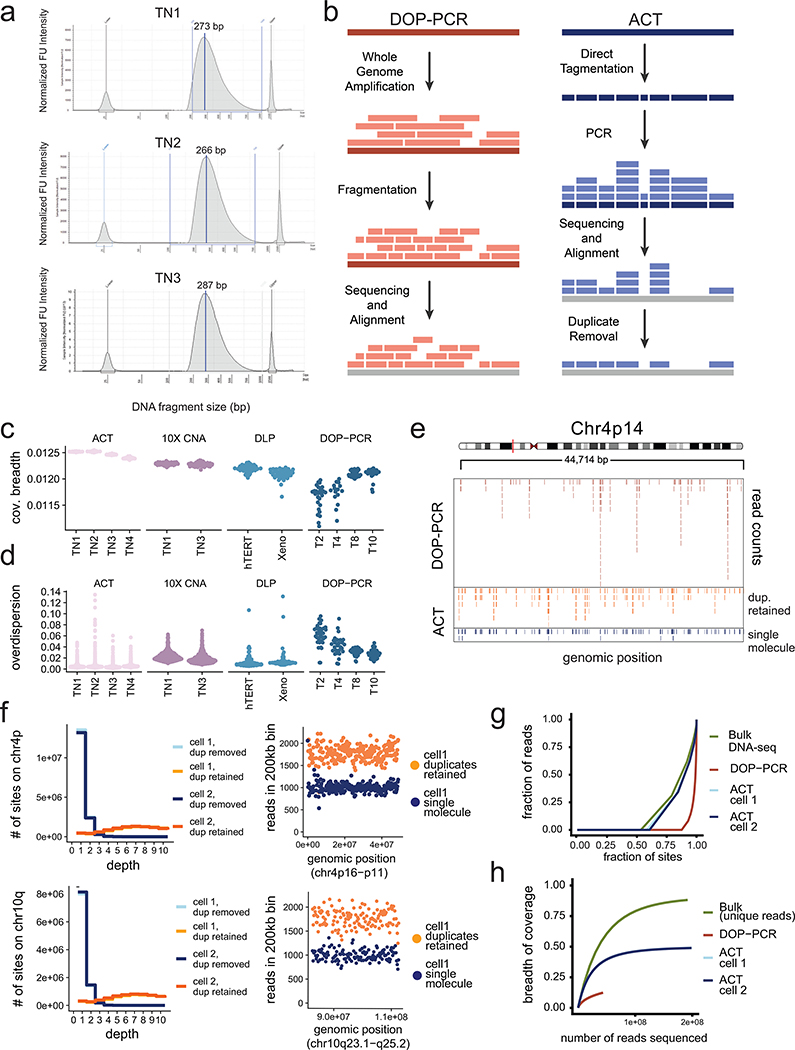
We developed a method called Acoustic Cell Tagmentation (ACT) that combines fluorescence-activated cell sorting (FACS) of single nuclei, tagmentation, and Acoustic Liquid Transfer (ALT) technology to perform high-throughput scDNA-seq at single-molecule resolution (Fig. 1a). To perform ACT, nuclear suspensions are prepared from fresh or frozen tissues and stained with DAPI for flow-sorting into high-density (N=384) plates. The isolated nuclei undergo a three-step amplification chemistry, which involves: 1) nuclear lysis, 2) direct tagmentation of genomic DNA using a Tn5 transposase to add universal adapters, and 3) PCR to incorporate dual barcodes for cell library multiplexing. The chemistry steps are robotically automated and the Tn5 enzyme is scaled down (1:20) to nanoliter volumes using ALT15. This approach generates barcoded single cell DNA libraries with a mean size of 312 bp that are pooled together for next-generation sequencing (NGS) (Extended Data Fig. 1a). ACT has several advantages over first-generation scDNA-seq methods9 that rely on whole genome amplification (WGA) steps, including reduced experimental steps and timeframe (~3 hours compared to 3 days), increased cell throughput, and the ability to measure single-molecule DNA information by positional barcoding (Extended Data Fig. 1b).
Figure 1 – ACT Method and Technical Performance.
(a) Experimental steps to perform Acoustic Cell Tagmentation involve the dissociation of nuclei from tissues, isolation of single nuclei into high density 384-well plates by FACS, acoustic liquid transfer of tagmentation reagents, PCR addition of dual barcodes and pooling of single cell libraries for multiplexed sequencing. (b) Breadth of coverage for sparse scDNA-seq data from four different methods, including ACT, DLP, 10X Genomics CNV and DOP-PCR using N = 100 sampled cells. (c) Overdispersion of bin counts in sparse scDNA-seq data from ACT, DLP, 10X Genomics CNV and DOP-PCR using N=100 sampled cells. (d) Copy number ratio and integer segmentation plots for a single cell from TN1.
Technical Properties of Single Cell Data
The technical performance of ACT was evaluated by comparing sparse data (~1M reads per cell) to three other scDNA-seq methods, including a microdroplet platform (10X Genomics CNV), two datasets previously generated using the direct library preparation (DLP) method16 and data from a first-generation scDNA-seq method (DOP-PCR)9,17. We evaluated the coverage breadth and technical noise by overdispersion, which showed that ACT achieved a significant improvement (p-value < 0.05, Kruskal-Wallis test) over the three other methods (Fig 1b–c, Extended Data Fig. 1c–d, Extended Methods). To further evaluate the coverage performance of ACT data, we sequenced two SK-BR-3 breast cancer cells at high depth (8.28X and 7.72X). To avoid the influence of copy number changes on coverage, we restricted our analysis to two diploid regions on chr4p and 10q (Extended Data Fig. 1e–f). We compared the read counts of genomic bins, in which the duplicate molecules were retained or removed by positional barcoding, revealing an increase in uniformity in the single molecule data and at most one to two reads for most genomic regions, while the duplicate-retained data had higher (8X) mean coverage depths (Extended Data Fig. 1f). From this data, we estimated that 97% of the reads were resolved to a single molecule depth of 1 or 2. Lorenz curves showed that the coverage uniformity of the ACT single cells (Gini Coefficient, G=0.728, 0.678, respectively) is similar to bulk DNA sequencing data (G=0.678) and is more uniform than DOP-PCR data (G=0.957) (Extended Data Fig. 1g). The physical coverage of the two SK-BR-3 cell libraries showed saturation near 50% of the genome (Extended Data Fig. 1h). Finally, we observed that the genomic bin count data (220kb resolution) is distributed closely to the integer copy number segments, as exemplified in a representative cell from the TN1 tumor (Fig. 1d). These findings led us to conclude that ACT represents a technical improvement over existing scDNA-seq methods.
Copy Number Substructure of Tumors
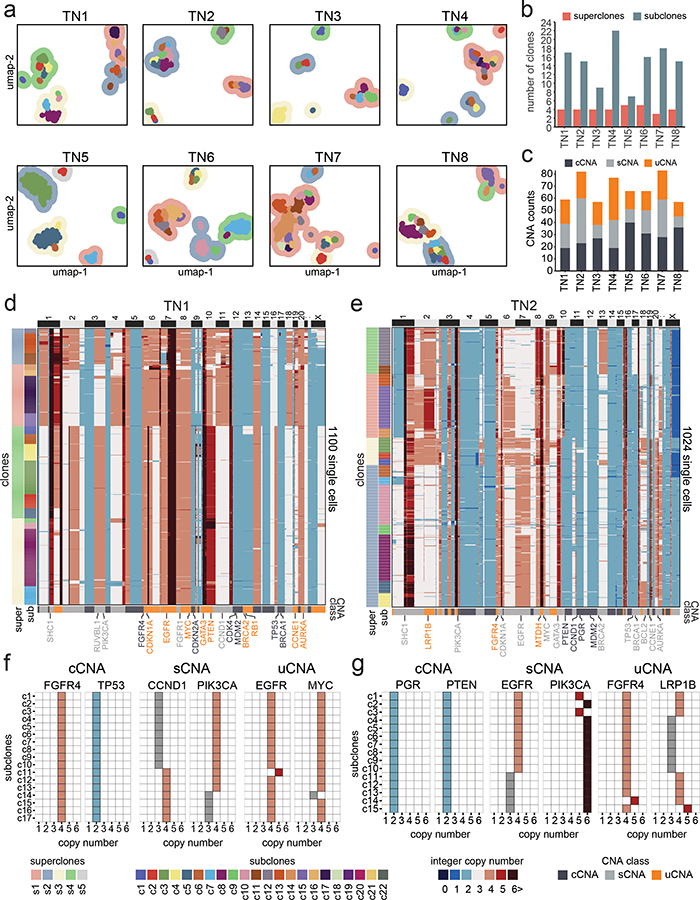
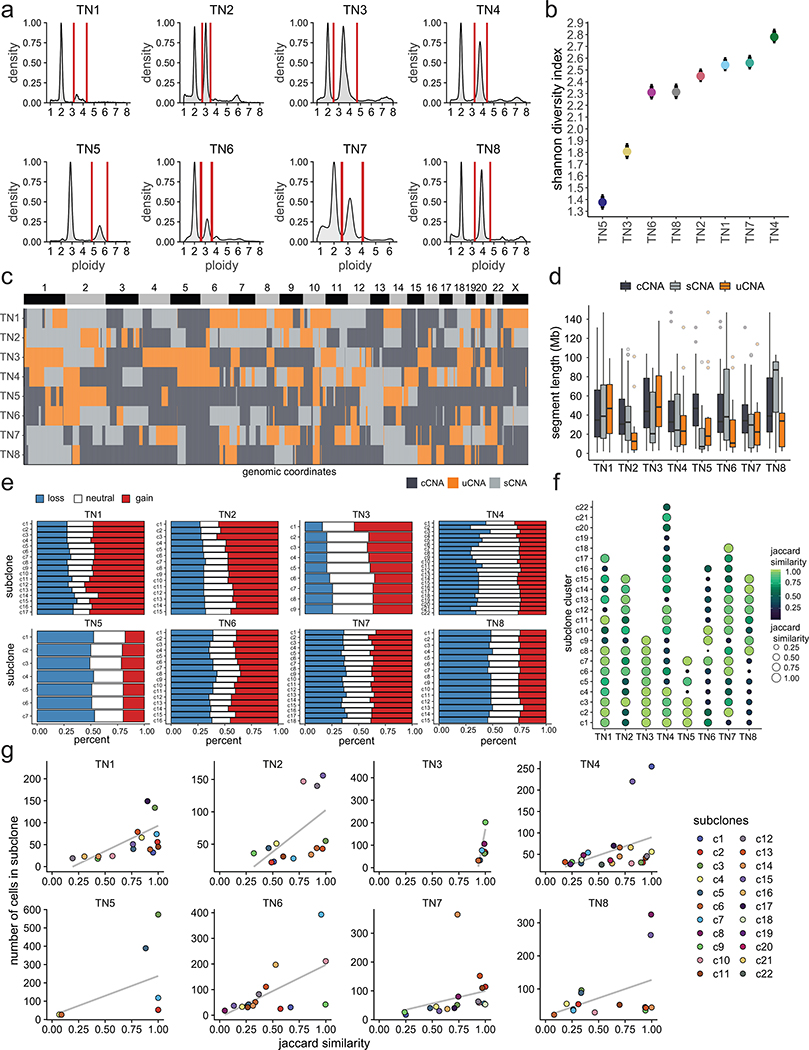
We applied ACT to sequence 9,765 cells from 8 TNBC tumors, including one chemotherapy-treated ductal-carcinoma-in-situ (DCIS) sample (TN1), three untreated invasive ductal carcinoma (IDC) tumors (TN2, TN6, TN7), and four untreated synchronous DCIS-IDC samples (TN3-TN5, TN8) (Supplementary Table 1). Nuclear suspensions were generated from frozen tissues and flow-sorted by ploidy distributions ranging from 2.65–3.95N, suggesting that WGD events had likely occurred in all tumors (Extended Data Fig. 2a, Supplementary Table 1). Clustering of the ACT data identified 7–22 subclones (c1-c22) that were organized into 3–5 superclones (s1-s5) across the 8 tumors (Fig. 2a–b). We define ‘subclones’ as clusters of cells that share highly similar copy number profiles, representing a clonal expansion from a single genotype, and ‘superclones’ as a higher-order organization of subclone groups that share a subset of CNA events. TN3 and TN5 showed the lowest number of subclones, while the remaining tumors had higher subclone numbers and genomic diversity indices (Fig 2b, Extended Data Fig. 2b).
Figure 2 – Clonal Substructure of Eight Triple-Negative Breast Tumors.
(a) High-dimensional UMAP clustering of single cell copy number data from 8 triple-negative breast tumors, where contour colors represent superclones and colored points represent subclones. (b) Number of superclones and subclones detected in each tumor. (c) Number of clonal, subclonal and unique CNAs detected in each tumor. (d-e) Clustered heatmaps of single cell copy number profiles for TN1 (n=1100 cells) and TN2 (n=1024 cells). (f-g) Integer copy number states of selected breast cancer genes for each subclone according to clonal, subclonal and unique CNA classes.
We define Copy Number Aberrations (CNAs) as segments of the genome in which two sets of chromosome breakpoints have increased or decreased integer copy number values relative to the ground state or ‘neutral’ copy number that corresponds to the mean DNA ploidy of the tumor (Methods). CNA analysis identified three major classes based on the frequency of the subclones in the population of tumor cells: 1) clonal CNAs (cCNAs) that were shared by all subclones, 2) subclonal CNAs (sCNAs) that occurred in a subset of the tumor cells and were present in two or more subclones, and 3) unique CNAs (uCNAs) that had exclusive copy number states or breakpoints in one subclone (Methods). Importantly, the uCNAs represent a subclass of sCNAs with a unique copy number state at a given segment identified in only one subclone. The CNA classes varied across the tumors, with TN5 having the highest number of cCNA events and TN4 having the highest uCNAs counts (Fig. 2c). Most of the genomic regions of subclonal CNAs were not shared across patients and the three CNA classes had similar genomic size distributions, with the exceptions of TN2 and TN5 (Extended Data Fig. 2c–d). Furthermore, the fraction of cells with CNA gains, losses and copy neutral (ground state) events showed variation across the subclones in each tumor (Extended Data Fig. 2e).
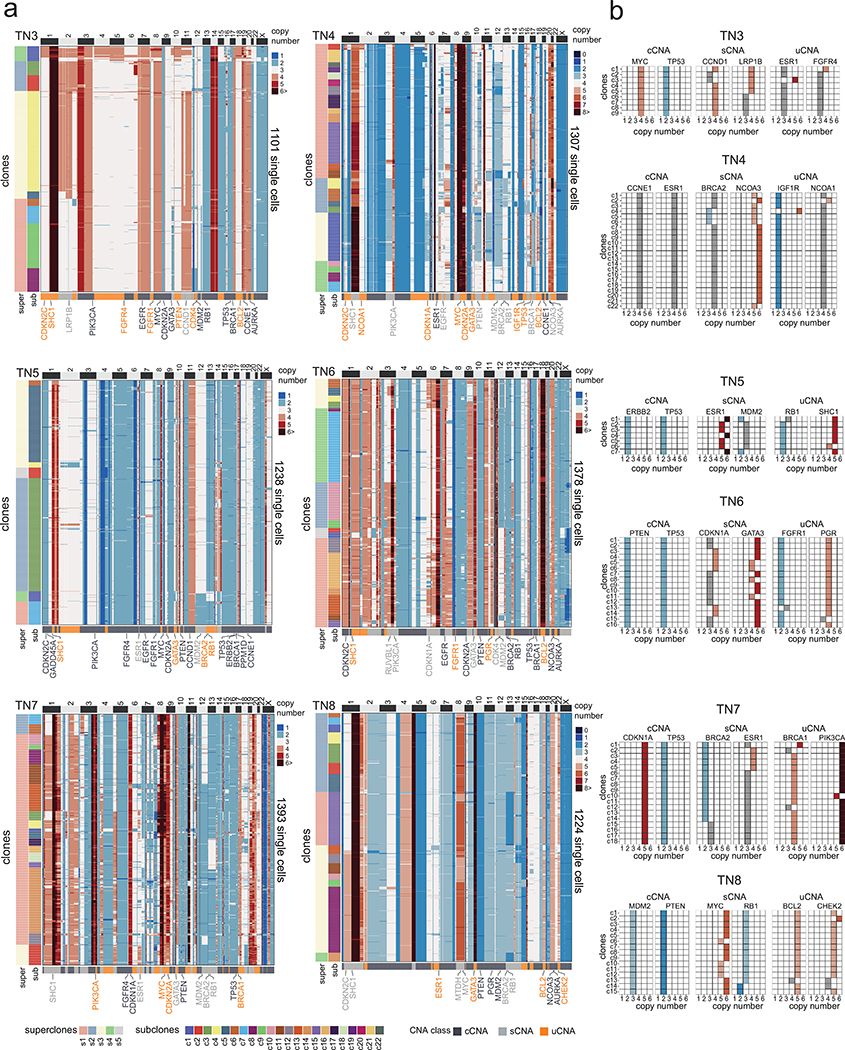
In patient TN1, the single cell data revealed 17 subclones that were organized into 4 superclones (Fig. 2d). The superclones were distinguished by 20 sCNAs, while the subclones were distinguished by 20 uCNAs, of which many events intersected breast cancer genes (Fig. 2f). In patient TN2, the ACT data identified 15 subclones that were organized into 4 superclones (Fig. 2e). The superclones were distinguished by 37 sCNAs, while the subclones were distinguished by 22 uCNAs and intersected several breast cancer genes (Fig. 2g). Similarly, the 6 other TNBC tumors harbored a large (7–22) number of subclones that were organized into a few (3–5) major superclones (Extended Data Fig. 3).
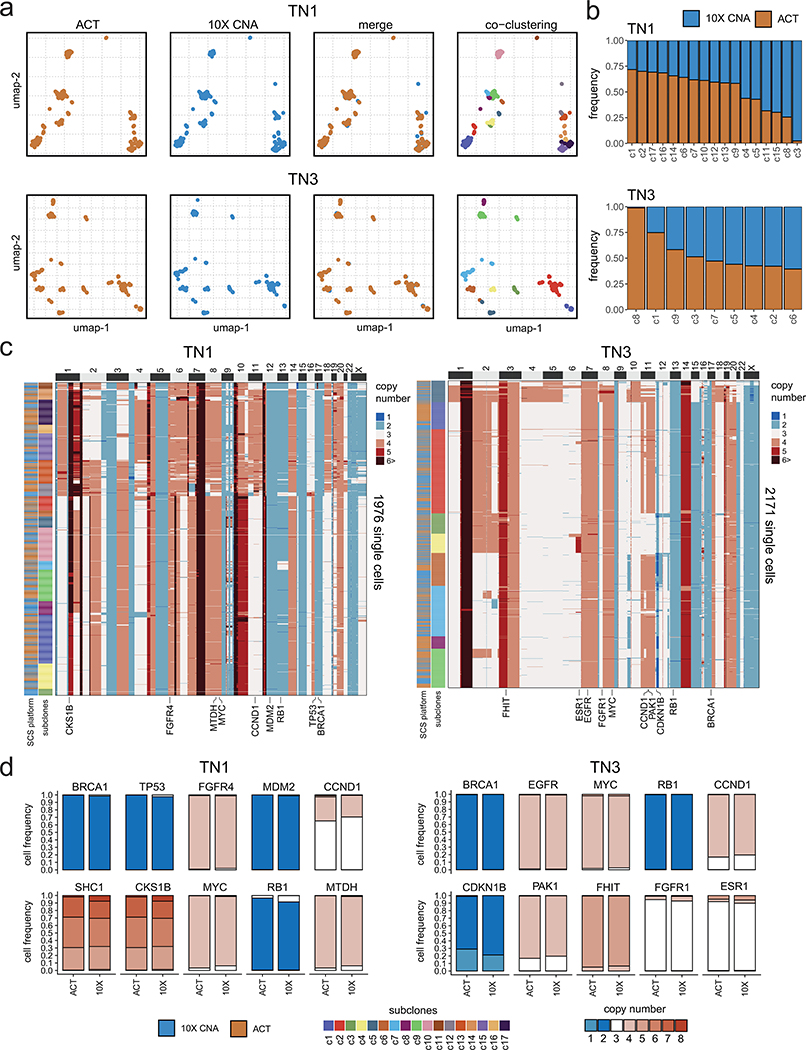
To assess the robustness of subclone clustering, we performed bootstrapping, which showed that most clusters were stable (mean 0.702 ± 0.15 SD, Jaccard similarity) (Extended Data Fig. 2f). This data further revealed a relationship between the stability of a cluster and the number of cells (Extended Data Fig. 2g). To orthogonally validate the clonal substructure, we performed scDNA-seq of 1,946 cells from two tumors using a different platform (10X Genomics CNV, Methods). The 10X data validated our ACT copy number state distributions and showed that all subclones were composed of a mixture of cells from both platforms, suggesting a high concordance across the orthogonal technologies, despite some variation in the clonal frequencies (Extended Data Fig. 4, Methods).
Clonal Lineages During Evolution
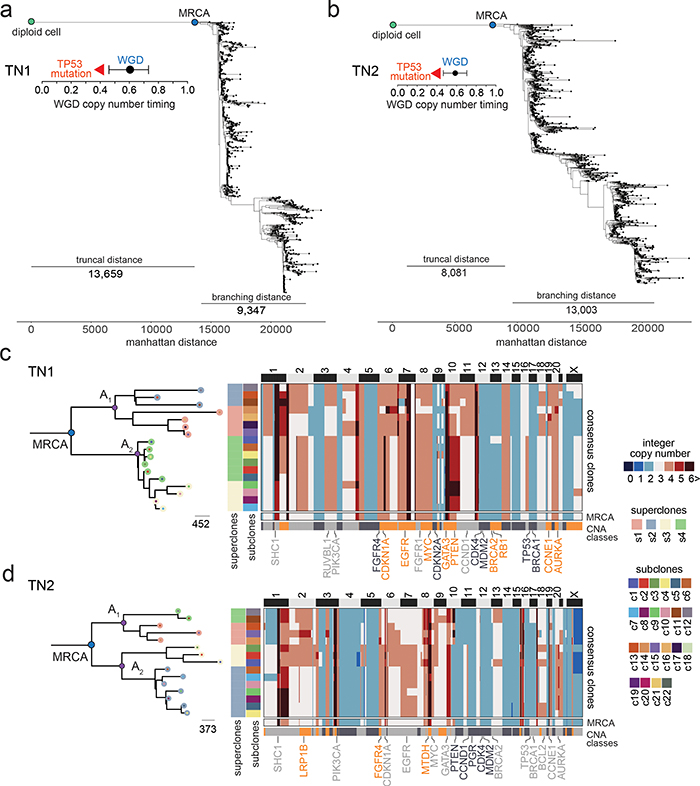
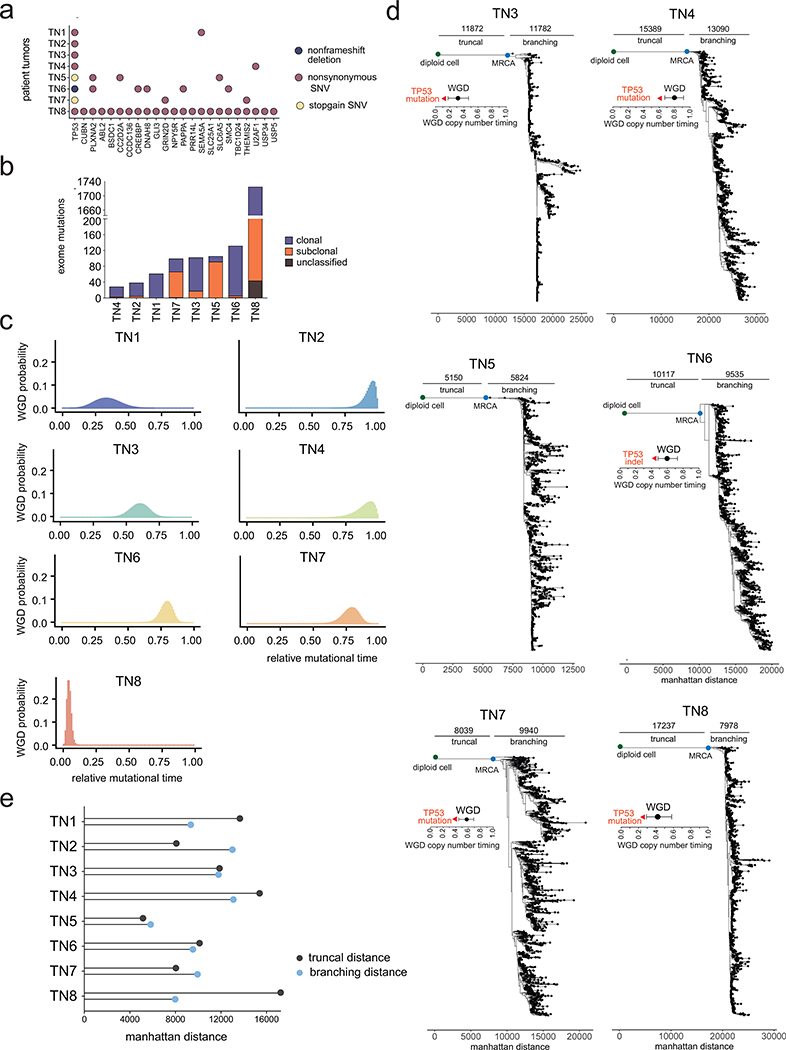
We next reconstructed the evolution of CNAs prior to the expansion of the primary tumor mass. Exome sequencing was performed on 8 tumors (107X mean depth) and matched normal tissues (76.3X mean depth) which showed a median of 102 somatic mutations, including TP53 driver mutations in all tumors (Fig. 3a–b, Extended Data Fig. 5a, Supplementary Table 2, Methods). To infer the evolutionary history of the tumors up to the most recent common ancestor (MRCA), we classified mutations as either clonal or non-clonal (Extended Data Fig. 5b, Methods). We then selected clonal mutations and copy number changes to reconstruct which events occurred before vs. after WGD in 7 tumors (Methods). The resulting data showed that TP53 mutations occurred consistently before WGD in 7 tumors and that WGD occurred late in mutational time in most (5/7) patients (Extended Data Fig. 5c).
Figure 3 – Evolutionary Analysis of Clonal Lineages in TNBC Patients.
(a-b) Minimum evolution trees of single cell copy number data for TN1 and TN2, with annotations indicating the time of the WGD events and confidence intervals, as well as the timing of TP53 mutations (c-d) Minimum evolution trees after the MRCA generated using consensus CNA profiles of subclones for TN1 and TN2 and rooted by a neutral node to the MRCA, with common ancestors (A1, A2) in the left panels. Right panels show consensus copy number profile heatmaps of subclones, where the bottom rows represent the inferred MRCA profile and different CNA classes.
To investigate tumor evolution after the MRCA, we used the ACT data to infer phylogenetic trees (Fig. 3a–b, Extended Data Fig. 5d). While, as expected, a large number of CNAs were clonal7, the resulting trees further revealed branching lineages with large distances after the MRCA. Notably, the branching distances from the MRCA to the extant node (mean 11,193 ± 4,106 SD) were similar to the truncal distances from the root diploid node to the MRCA (mean 10,063 ± 2,504 SD, p = 0.52, two-sided t-test), suggesting ongoing copy number evolution after the MRCA in all 8 tumors (Extended Data Fig. 5e).
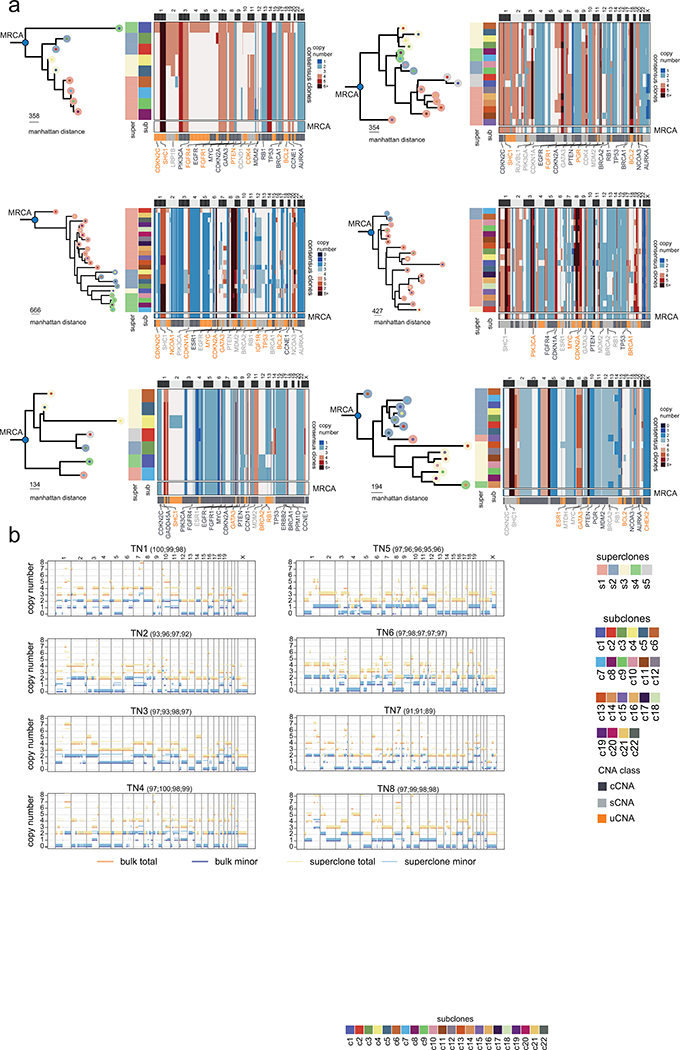
We then performed a more detailed analysis of the branching phylogenies after the MRCA by computing consensus CNA profiles of the subclones to construct balanced minimum evolution trees (Fig. 3c–d, Extended Data Fig. 6a). In TN1, the MRCA underwent an initial lineage split leading to two ancestral clones (A1, A2) that further diverged into four clades corresponding to the 4 superclones that split into 17 distinct subclones (Fig. 3c). Similar branching phylogenies were observed after the MRCA in the 7 other patients (Fig. 3d, Extended Data Fig. 6a). Additionally, we merged single cell data by superclone groups and computed allele-specific copy number, which showed that most LOH regions were consistent with the bulk exome data (median 96.1% region overlap), suggesting that they occurred prior to the MRCA (Extended Data Fig. 6b, Methods). On average of 41.21 % of the genome (range 18.1% - 59.8%) showed LOH events in the 8 patients. Collectively, these data show a large number of sCNA and uCNAs that were acquired after the MRCA, continuing to diversify the clonal genotypes during the expansion of the primary tumor mass.
Mathematical Modeling of Evolution
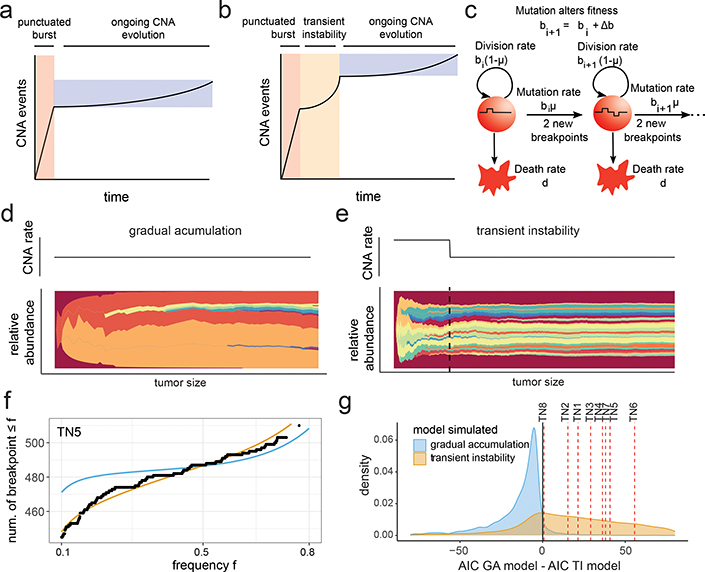
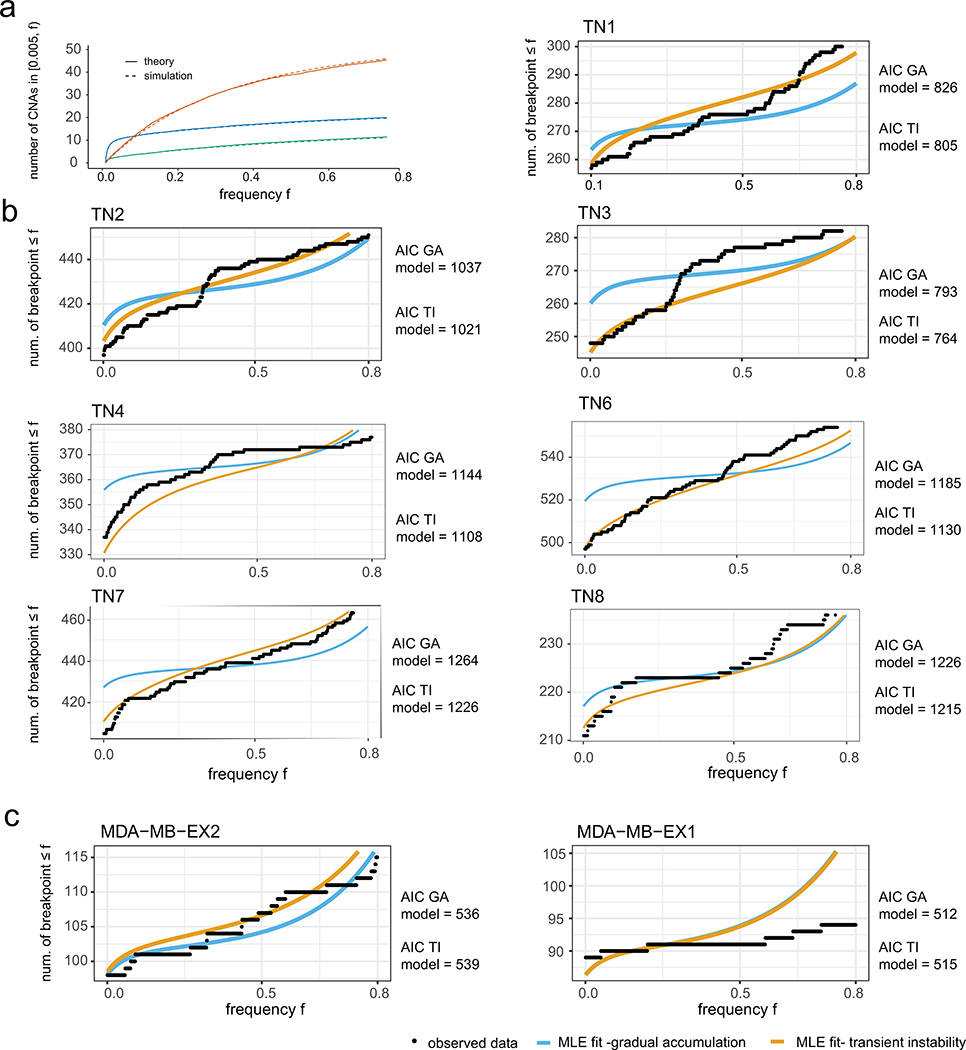
We next aimed to quantitatively investigate two alternative models of genomic evolution – a model in which the PCNE event is followed by the gradual accumulation of CNAs at a constant baseline rate, and a model in which the PCNE event leads to a transient period of elevated genomic instability, followed by a return to gradual evolution at a constant baseline rate (Fig. 4a–b). To describe the accumulation of chromosomal breakpoints, we used a stochastic branching process model (Fig. 4c, Supplementary Methods). To model transient instability, we considered the CNA rate to be elevated until the tumor exceeds a threshold size, after which the rate decreases to a baseline value (Fig. 4d–e). The alternative, gradual model assumes that the CNA rate remains at the baseline value. All else equal, transient instability would lead to an enrichment of high-frequency breakpoints (i.e. in many cells). To investigate these scenarios, we derived formulas for the number of breakpoints expected to be present at a given frequency for both cases (Extended Data Fig. 7a, Methods, Supplementary Methods). We then embedded these formulas into a likelihood framework incorporating breakpoint detection errors, which allowed for a quantitative assessment of which scenario provides a superior fit to the ACT data. We used the AICs obtained under each scenario as a summary statistic, which we validated on simulated data, and was observed to be conservative for calling transient instability. Applying our method to the 8 TNBCs tumors, we obtained a lower AIC for the transient instability model for all 8 cases, suggesting that an early elevated CNA rate is more likely (Fig. 4f–g, Extended Data Fig. 7b). These results indicate that a transient period of elevated genomic instability early in tumorigenesis explains the patient data better than a gradual evolution model.
Figure 4 – Mathematical Modeling of Transient Instability After Punctuated Copy Number Evolution.
Representations of CNA accumulation under (a) gradual evolution after punctuated instability, or (b) transient instability after the punctuated burst. (c) Schematic of the branching model for the chromosome breakpoint accumulation that incorporates cell fitness and cell birth/death rates; replicating cells acquire heritable breakpoints in their copy number profiles with a probability that depends on the tumor size in the transient instability scenario, or is constant under gradual evolution. (d-e) Muller plots of clonal frequencies obtained from (d) stochastic simulations of the gradual accumulation model, and (e) the transient instability model. (f) Maximum likelihood fits for the chromosome breakpoint frequency spectra obtained for TN5 under both scenarios. (g) Difference of AICs for the transient instability and gradual accumulation models from simulated data from a large parameter range; difference of AICs obtained from the single cell patient data shown in red lines.
Copy Number Substructure of Cell Lines
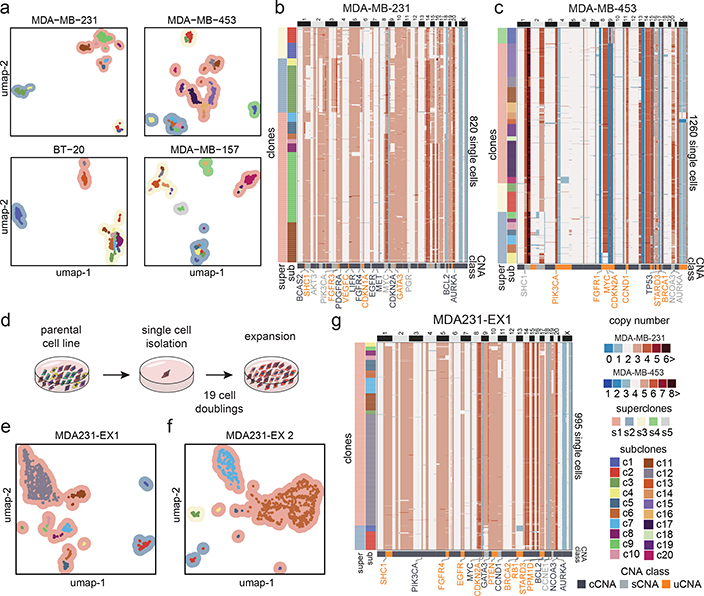
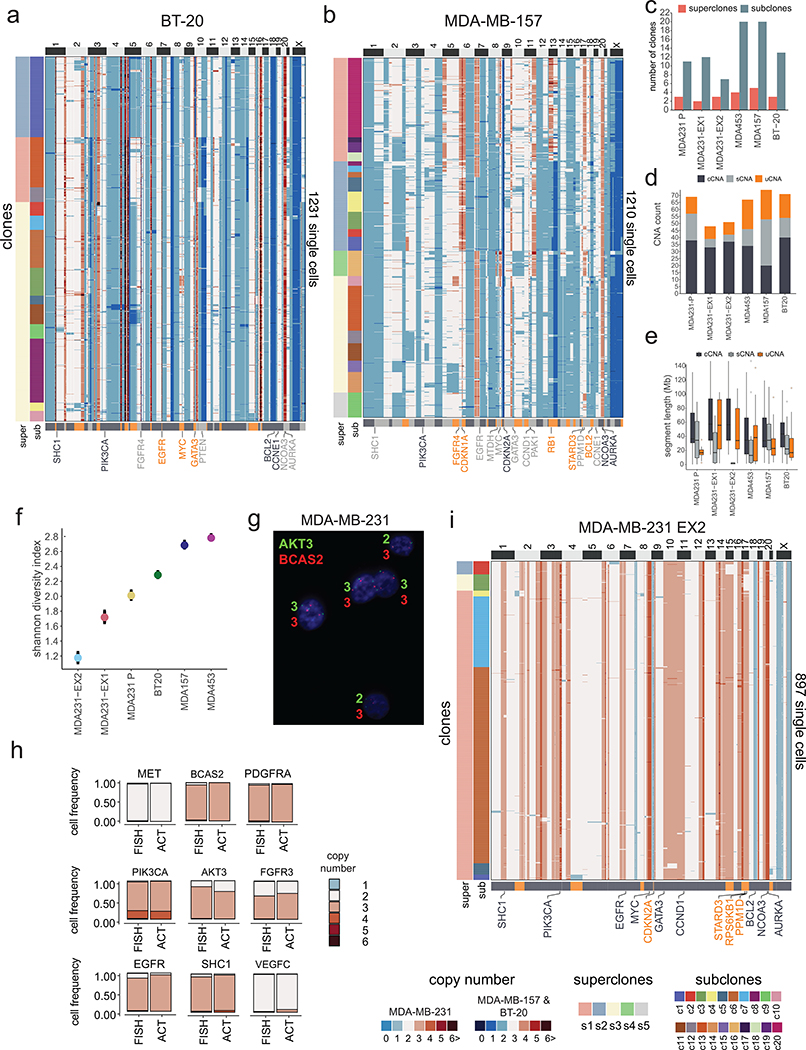
We next investigated whether the extensive copy number diversity observed in human TNBC tumors also existed in TNBC cell lines. Four TNBC cell lines with TP53 mutations and aneuploid karyotypes18 (MDA-MB-231, BT-20, MDA-MB-157 and MDA-MB-453) were selected and ACT was applied to sequence a total of 6,413 cells, after which clustering was used to delineate their clonal substructure (Fig. 5a, Extended Data Fig. 8a–b). Similar to the primary tumors, the four cell lines showed 11–20 subclones, organized into 3–5 superclones (Fig. 5b–c, Extended Data Fig. 8a–c). Furthermore, the Shannon diversity indices and frequencies of cCNAs (47.3%), sCNAs (27.4%) and uCNAs (25.3%) events were in a similar range to the TNBC tumors, as were the segment size distributions (Extended Data Fig. 8d–f). To validate the subclonal copy number states, we designed probes to target 9 breast cancer genes in MDA-MB-231 and performed DNA-FISH to quantify the copy number values for a similar number of cells (N=1,000) that were sequenced by ACT, confirming the clonality of all CNA events detected (Extended Data Fig. 8g–h, Methods). Collectively, our data suggest that these cell lines are representative of the copy number substructure of human TNBC tumors.
Figure 5 – Clonal Substructure of TNBC Cell Lines and Single Cell Expansions.
(a) UMAP and clustering of single cell copy number data from four TNBC cell lines, including MDA-MB-231 (n = 820 cells), MDA-MB-453 (n = 1260 cells), BT-20 (n = 1231 cells) and MDA-MB-157 (n = 1210 cells), in which contour colors represent superclones and colored points represent subclones. (b-c) Clustered heatmaps of ACT data from the MDA-MB-231 and MDA-MB-453 cell lines (d) Schematic of subcloning experiments for expanding single daughter cells from the parental MDA-MB-231 cell line. (e-f) High-dimensional UMAP clustering of single cell copy number data from two expanded daughter cell populations after 20 cell doublings. (g) Clustered heatmaps of ACT data from the EX1 expanded cells from MDA-MB-231, with CNA classes indicated below.
Estimating Copy Number Evolution Rates
To estimate the rate of CNA evolution, we physically subcloned and expanded two single daughter cells (MDA231-EX1, MDA231-EX2) from the MDA-MB-231 parental cell line for 19 cell doublings and measured the number of de novo CNA events that were acquired (Fig. 5d, Methods). This data showed that the two expanded daughter cells re-diversified their genomes into 7–12 subclones in the time it took a single cell to fill a 10cm culture plate (Fig. 5e–f). During the two expansions, 5 sCNAs and 9 uCNAs were acquired in MDA231-EX1, while 6 sCNAs and 9 uCNAs were acquired in MDA231-EX2 (Fig. 5g, Extended Data Fig. 8d,i). In contrast to the parental TNBC cell lines, the new expansions showed fewer sCNA events compared to cCNAs and uCNAs (Extended Data Fig. 8d). We used the chromosome breakpoint data from the expanded cells to estimate the de novo CNA rate per cell division19, and obtained an average rate of 0.242 CNAs per cell division (0.235, 95% CI 0.189, 0.288 for EX1 and 0.249, 95% CI 0.204, 0.3 for EX2) (Methods). Our mathematical modeling framework showed that, in contrast to the primary tumors, a gradual model was more likely to explain the data from both cell line expansions (Extended Data Fig. 7c). These data show that single cancer cells do not maintain a stable clonal genotype after expansion, even during a relatively short time frame.
Impact of Subclonal CNAs on Gene Dosage
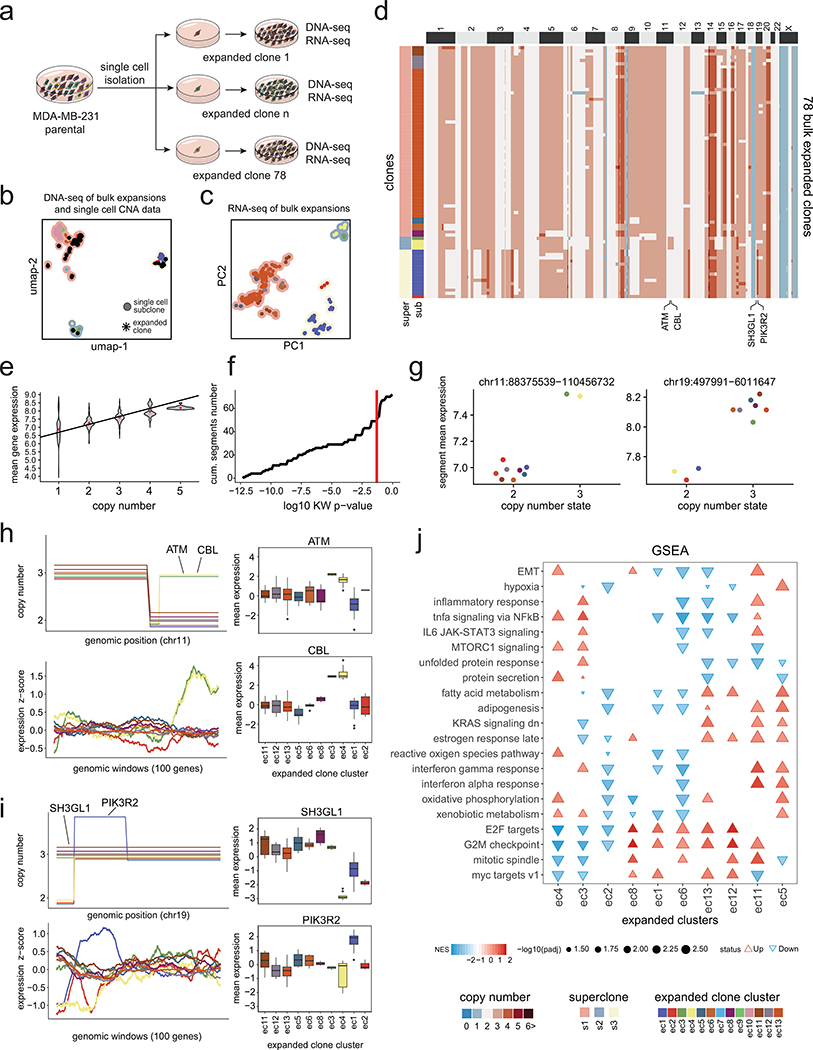
We further investigated whether the subclonal CNAs resulted in gene dosage effects that impacted gene expression levels by expanding 78 single daughter cells (e1-e78) from MDA-MB-231 for 19 generations and performed matched bulk DNA-seq and RNA-seq (Extended Data Fig. 9a, Methods). By co-clustering the bulk DNA-seq data with the ACT data (820 cells), we found that 10/13 of the subclones in the parental MDA-MB-231 cell line were reflected in the expansions, which we refer to as expanded clusters (Extended Data Fig. 9b–d). PCA analysis of the expanded clone bulk RNA-seq data alone revealed groups of expansions that corresponded to the superclone genotypes (Extended Data Fig. 9c). A global analysis of CNA events across the entire genome showed that copy number states in MDA-MB-231 were significantly correlated (R2 = 0.45, p-value < 2.2e-16) with gene expression levels (Extended Data Fig. 9e, Methods). Similarly, when this analysis was restricted to subclonal regions, we found that 68% of chromosome segments were significantly associated with expression changes (p-value < 0.05, Kruskal-Wallis test), as exemplified in selected CNA regions (Extended Data Fig. 9f–g). We further investigated the impact of subclonal CNAs across larger chromosomal regions, which showed that 100-gene expression windows tracked well with subclonal copy number changes and impacted the expression of many cancer genes (Extended Data Fig. 9h–i, Methods). Beyond the localized effects of gene dosage, the subclonal CNA events also had a broader impact on the expression of many genes in pathways and cancer hallmark signatures20 across the entire genome (Extended Data Fig. 9j).
Discussion
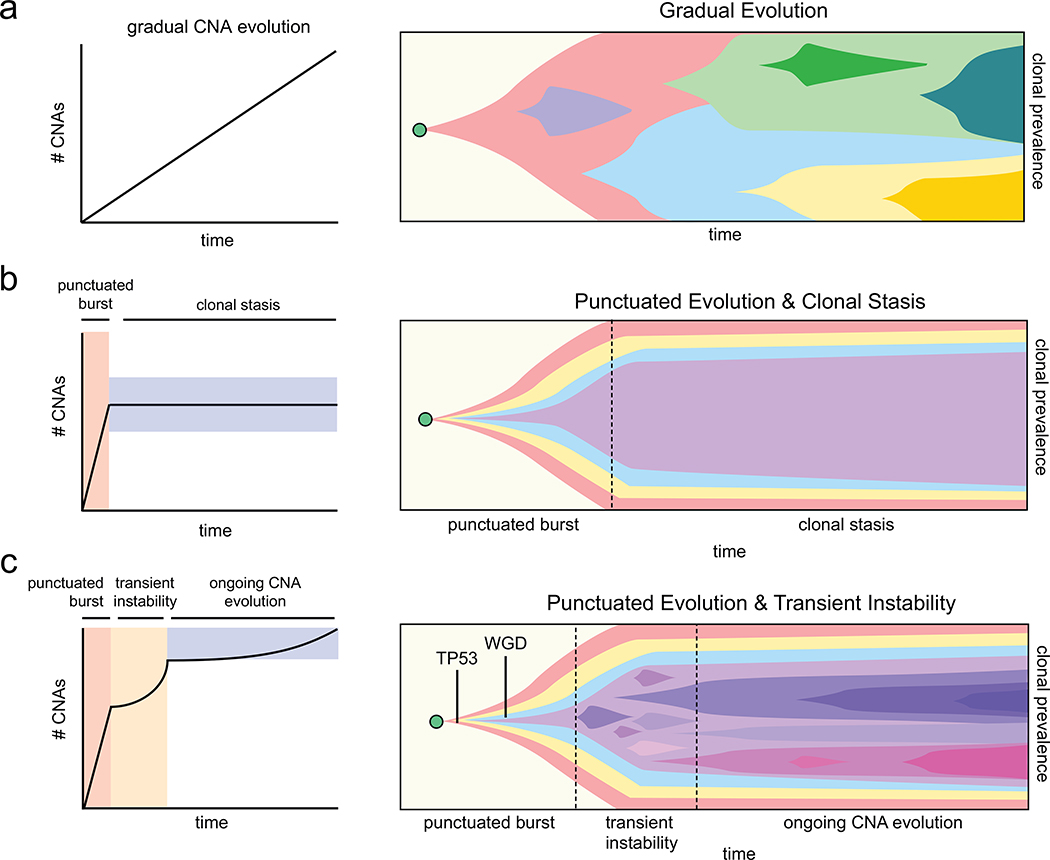
Our data shows that the copy number substructure of human TNBC tumors consists of a large milieu of subclones (7–22) that are organized into a few major superclones (3–5) and share a common evolutionary lineage. While the number of superclones is consistent with previous studies of breast cancer7,9,21, the number of subclones vastly exceeds prior estimates. Our study extends previous findings of TNBC evolution7 by showing that TP53 mutations, genome doubling and extensive LOH are important early evolutionary events that occurred prior to the MRCA. Our data further shows that after the MRCA, a period of transient instability generates a large number of subclones before transitioning to a basal rate of ongoing copy number evolution that persists during the expansion of the primary tumor mass. These data suggest that while there may be some stabilizing selection22, the tumor cells continue to explore the fitness landscape during the growth and expansion of the primary tumor. Based on our new data, we propose a revised model for TNBC evolution after PCNE (Extended Data Fig. 10).
By sequencing DNA and RNA from the same expanded subclones, we showed that the subclonal CNAs can impact gene expression, consistent with bulk CNA and RNA data across many human cancers23. By expanding single daughter cells in vitro, we show that cancer cells can quickly rediversify their genomes at a rate of ~1 new CNA per 4 cell divisions. Our results are consistent with a previous study that reported extensive copy number and mutational evolution during the passaging and subcloning of cancer cell lines24. These data serve as an important warning for the research community, namely that isogenic subcloning, a widely used procedure in molecular biology25, can still result in heterogeneous cell populations when used in downstream functional assays.
ACT represents a major technical improvement over first generation scDNA-seq methods9,26. A few other studies have also implemented tagmentation-based approaches to perform scDNA-seq, including two lower-throughput methods using microfluidic chips (~100 cells)16,27, and one high-throughput method that was scaled up using a nanowell system28. Another study developed a combinatorial indexing approach that uses tagmentation and is highly scalable but has limited genomic resolution29. Other work has developed a WGA-based approach on a microdroplet platform (10X Genomics CNV) that is scalable but does not achieve single-molecule resolution. Compared to these methods, ACT represents an improvement in technical performance and is cost-efficient.
A notable limitation to our study is that the number of subclones we detected is an ‘operational definition’ and is dependent on the total number of cells that are sequenced, therefore likely representing an underestimate of clonal diversity. Finally, we postulate that PCNE and subclonal reservoirs may not be unique to TNBC patients and may exist in other solid tumors, particularly in aneuploid cancers that harbor TP53 mutations. Beyond cancer, we expect that ACT will have broad applications for investigating aneuploidy in diverse fields of biology and biomedicine.
METHODS SECTION
Patient Samples
The 8 breast tumor samples were obtained as frozen de-identified samples from the MD Anderson Breast Tissue Bank under an IRB approved protocol. All patients were consented to have their tissue used for research studies. The triple-negative status of the tumor samples was determined by IHC for estrogen receptor (<1%) and progesterone receptor (<1%), and FISH analysis of the Her2 amplification using the CEP-17 centromere control probe (ratio of Her2/CEP17 < 2.2). TN1 was classified as ductal-carcinoma-in-situ (DCIS) by histopathology, while all other samples were invasive ductal carcinomas or synchronous DCIS-IDC (Supplementary Table1). Most of the tumor samples were untreated, with the exception of TN1 which was treated with Adriamycin Cyclophosphamide (AC) prior to the collection of the tissue sample. Approximately 0.5 × 0.5 × 0.5 cm of total tissue was used in each experiment, combining macrodissected pieces from multiple sectors in each tumor. More information on the tumor sizes, grades and histopathology are provided in Supplementary Table 1.
Cancer Cell Line Samples
The TNBC breast cancer cell lines were obtained from the Characterized Cell Line Core (CCLC) Facility at the University of Texas MD Anderson Cancer Center, Houston, TX. The cell line identities were confirmed by RFLP analysis and sparse WGS sequencing to determine copy number profiles. All cell lines tested negative for mycoplasm contamination prior to running the experiments.
Generation of Expanded Subclonal Cell Lines
Expanded clones from a parental MDA-MB-231 (80% confluency) were isolated by FACS sorting (BD Melody) into 96 well flat-bottom culture plates containing 100 ul of cell culture media, followed by visual confirmation by light microscopy after 0 and 24 hours. Wells with multiple cells or doublets were eliminated, while wells with confirmed single cells were used for subsequent expansions. The single cells were propagated until ~ 80% confluency in a 10cm dish, after which the cells were used for single cell DNA sequencing or bulk DNA and RNA sequencing.
Isolation of Single Nuclei by FACS
Nuclear suspensions from frozen tumor tissue were prepared using an NST-DAPI lysis buffer as previously described9,31. Suspensions were filtered through a 40μm mesh and single nuclei were flow-sorted (BD FACSMelody, BD FACS AriaII or Beckman MoFlo Astrios). The DAPI intensity was used to set gates on aneuploid cells populations for all tumors. Single nuclei from TN5 were sorted from the aneuploid G2M peak. Single nuclei were then deposited into individual wells of 384 well plates (Eppendorf# 951020702). The sorting instrument alignment was assessed under a microscope prior to each experiment to ensure single nuclei were accurately deposited into the center of each well using a film-bottom 384 well plate (Greiner# 781091). After flow sorting, plates were spun at 1500xg for 4 min, sealed and stored at −20°C until ready for ACT processing. Bulk nuclei were FACS sorted into LoBind tubes (Eppendorf# 022431021) for 10X Genomics CNV or exome capture reactions.
Acoustic Cell Tagmentation Procedure
FACS sorted 384 well plates were spun at 1500xg for > 4min. The Echo525 system (Labcyte) was used to dispense tagmentation reagents (Illumina# FC-131–1096) at nanoliter scale, with plate and liquid types detailed in the following steps. Thorough mixing and spinning of each plate after every dispense and incubation period is crucial to maximizing assay performance. Nuclei were lysed in 200nl (384PP_SPHigh) of freshly prepared Tx Lysis buffer [Protease (1.36AU/ml) diluted 1:9 in 5% Tween 20, 0.5% Triton X-100 and 30mM Tris pH 8.0]. Lysis thermocycler settings were programmed as: 55°C 10 min, 75°C 15 min, 4°C ∞, Lid = 80°C, vol = 1μl. After lysis, 600nl of tagmentation reaction mixture (TD:ATM 2:1, 384PP-Plus_GPSA) was dispensed. The ACT reaction settings on the Thermocycler were: 55°C 5 min, 4°C ∞, Lid =60°C, vol = 1μl. The ACT reaction was neutralized with 200nl (384PP_SPHigh) of NT buffer for 5 min RT. Final PCR reaction included 1.11uM N7XX (5’-CAAGCAGAAGACGGCATACGAGATXXXXXXXXGTCTCGTGGGCTCGG-3’) and S5XX (5’-AATGATACGGCGACCACCGAGATCTACACXXXXXXXXTCGTCGGCAGCGTC-3’) primers (384PP_AQBP) in 2X HiFi HotStart Ready Mix (Roche# KK2602, 6RES_GPSA). Dual barcode sequences in primers are denoted by “XXXXXXXX.” Unique dual barcode combinations for each 384 well were achieved by dispensing sixteen unique N7XX barcodes across each row and 24 unique S5XX barcodes across each column (Supplementary Table 2). The PCR reaction was performed using the following conditions: 72°C 3 min, 98°C 30sec, (98°C 10sec, 63°C 30sec, 72°C 30sec)x15–18cycles, 72°C 5 min, 4°C ∞, Lid =105°C, vol = 6μl. ACT performance was evaluated by Qubit fluorometer and TapeStation (Agilent) from selected cell libraries. Final libraries were pooled together and purified with 1.8X AMPURE XP beads. The final libraries were sequenced at 50 or 76 single-read cycles with dual barcodes on the Illumina HiSeq4000 system.
10X Genomics CNV Single Cell Sequencing
Nuclear suspensions were stained with NST-DAPI and FACS sorted. The DAPI intensity was used to set gates on aneuploid cells populations (see ‘Isolation of Single Nuclei by FACS’). The resulting aneuploid nuclei suspensions were used as input material for the Chromium (10X Genomics CNV) single-cell DNA cell bead kit (Cat# 1000056) as described in the user guide with a target capture of 1000 cells using chromium single-cell chips C and D (Cat# 1000022 and Cat# 1000042, respectively). DNA libraries were prepared using chromium single-cell DNA library & gel bead kit (Cat# 1000040) and were sequenced at 200 cycles on the NovaSeq6000 S1 flowcell (Illumina).
Fluorescence in situ hybridization (FISH)
MDA-MB-231 cells were cultured until 80% confluency in a 10 cm dish and transferred to 15 ml conical tubes and centrifuged at 1500 rpm for 7 min. Cells were subjected to hypotonic treatment (0.075 M KCl) for 20 min at room temperature and fixed in methanol and acetic acid mixture (3:1 v/v) for 15 min, washed three times with the fixative and air-dried. DNA fluorescence in situ (DNA-FISH) hybridization was performed on the above cytological preparations using SHC1–20-GR, EGFR-20-GR, VEGFC-20-GR, PIK3CA-20-GR, AKT3–20-GR, FGFR3–20-GR, MET-20-OR, PDGFRA-20-OR, BCAS2–20-OR probes. (Empire Genomics, Buffalo, NY, USA). Slides were hybridized with the FISH probes according to the manufacturer’s instructions (Empire Genomics) with slight modifications. Briefly, 2 μl of each of the two probes were mixed with 6 μl of the in situ hybridization buffer. The probe was applied on the slide and covered with a glass coverslip (22X22 mm) and sealed with rubber cement. The slides were then denatured at 72–73°C using Thermobrite system (Abbott Laboratories, Illinois, USA) and incubated at 37°C overnight. The slides were then washed using 2XSSC 45–70°C for 1–2 mins, counterstained with DAPI and analyzed using Nikon 80i microscope using the green and orange fluorescent channels. The copy number states of each probe were counted across 1000 cells and multiple imaging fields for each experiment.
Bulk DNA-Seq and RNA-Seq of MDA-MB-231
Expanded subclones from MDA-MB-231 were cultured until ~ 80% confluency in a 10cm dish plate and split into triplicates with . From each triplicate, a portion of cells was separated for DNA copy number analysis and a second portion was used for RNA extraction using TRIzol™ (Fisher Cat# 15596–018) from the same plates. Genomic DNA was isolated from each expanded subclone with the QIAamp DNA Blood Mini Kit (Qiagen Cat# 51106). Recovered DNA was sonicated to 250bp using the S220 acoustic sonicator (Covaris) and libraries for each sample were prepared with the Kapa HyperPrep Kit (Roche Cat# KK8504) and NEXTflex-96 barcodes (Bioo Scientific). The NEBNext® Ultra™ RNA library prep kit for Illumina® with poly(A) mRNA magnetic isolation module (NEB Cat# E7530 and 7490) was used for the bulk RNA libraries according to the manufacturer’s instructions. Protocol was modified to include the NEXTflex-96 barcodes with 14 PCR cycles. DNA-seq and RNA-seq libraries were sequenced on 76 paired-end cycles on the Illumina HiSeq4000 platform.
Bulk DNA exome capture
Genomic DNA from FACS sorted aneuploid tumor nuclei (see ‘Isolation of Single Nuclei by FACS’) was isolated using Qiagen DNA blood mini kit (Cat#51106) and matched normal tissue genomic DNA was isolated using Qiagen DNA micro kit (Cat#56304). Recovered DNA was sonicated to 250bp using the S220 acoustic sonicator (Covaris) and libraries for each sample were prepared with the Kapa HyperPrep Kit (Roche Cat# KK8504) and NEXTflex-96 barcodes (Bioo Scientific), purified with 0.8X AMPure XP beads and amplified by PCR following manufacturer instructions. Exome libraries were captured with SeqCap EZ Exome V2 kit following manufacturer’s instructions (Roche Cat# 05860482001) and sequenced with 100 Paired-end kits on HiSeq4000 or NextSeq2000 300 cycles kit (Illumina).
Inference of DNA Copy Number
Sequencing reads were demultiplexed into single-cell FASTQ files allowing 1 mismatch of the 8 bp barcode. FASTQ files were aligned to hg19 (NCBS build 36) using bowtie2 (v2.2.6)32 and converted from SAM to BAM files with SAMtools (v1.2)33. Positional barcoding was performed by marking fragments with equal start position as PCR duplicates and removed from subsequent analysis to obtain single-molecule data. Copy number profiles were inferred with the variable binning pipeline as previously described in7. Briefly, aligned reads were counted in variable bins averaging 220kb. Bin counts were normalized for GC content with lowess regression and bin-wise ratios were calculated by computing the ratio of bin counts to the sample mean bin count. Segmentation was performed with circular binary segmentation (alpha = 0.0001 and undo.prune = 0.05) from R Bioconductor DNACopy package34. MergeLevels was applied to join adjacent segments with non-significantly differences in segmented ratios. Cells with excessive noise were excluded according to the following criterias: 1) removal of cells with bin counts that were 2 standard deviations below the mean, 2) removal of cells with large breakpoint counts that were 2 standard deviations above the mean, and 3) removal of outliers using density-based spatial clustering R package ‘dbscan’ (v1.1–5)35 (minPts = 5, bucketSize = 10, k = 5, eps parameter was determined by the elbow method from the k-nearest neighbors distance matrix).
Calculation of Technical Metrics
Gini coefficient for high-depth sequencing of single-cells from SK-BR-3 for ACT, DOP-PCR and bulk sample was calculated as follows. Let xi be the set of depths observed and let ni be the number of sites with depth xi, with si = . Single cell coverage breadth was calculated from duplicates removed BAM files. We sampled 100 sparse single-cell sequencing data from BAM files from each scDNA-seq method, ACT (TN1-TN4), 10X-CNA, DOP-PCR36 and DLP16, and downsampled to 800k reads trimmed to 50 bases to match the lowest read length and depth across all samples. Coverage from all sites was calculated using bedtools (v.2.26.0) genomeCoverageBed37. Overdispersion was calculated by the index of dispersion of bincounts, i.e. the variance over mean, normalized by the mean bincounts for each single-cell. Let ϕ be the overdispersion parameter, b be the mean bincounts, and iod the index of dispersion, .
Multi-Sample Segmentation and Integer Copy Number Estimation
We used R bioconductor package ‘copynumber’ (v1.26) function ‘multipcf’ (gamma = 30)38 to perform joint segmentation and determine common break points for all single cells on the bincount matrices with an added pseudocount of 5, followed by ‘MergeLevels’ to join adjacent segments with non-significant differences in segmented ratios. Average tumor ploidy was calculated with DAPI fluorescence values from FACS sorting data. The first peak from the DAPI fluorescence histogram was assumed to be normal (2N) diploid stromal cells. The ratio of the mean DAPI fluorescence from the gated aneuploid population over the mean DAPI fluorescence of the 2N population was multiplied by 2, resulting in the average tumor ploidy, i.e, ground state. Segment ratios from joint segmentation were multiplied by the FACS derived average tumor ploidy and rounded to the nearest.
Clustering of Superclones and Subclones
Integer single-cell copy number data from multi-sample segmentation was embedded into two dimensions using UMAP28,39 with R package ‘uwot’ (v.0.1.8, min dist = 0, n neighbors = 40, seed = 55 for TNBC tumors and n neighbors = 25, seed = 206 for cell-lines, distance = “manhattan”). To identify superclones, the resulting embedding was used to create a shared nearest neighbor graph (SNN) with R Bioconductor package ‘scran’ (v1.14.6)40. For each superclone SNN graph, different k values were used (TN1=45, TN2=63, TN3 = 65, TN4 = 75, TN5 = 41, TN6=51, TN7 = 35, TN8 = 43, MDA-MB-231 = 93, MDA-EX1=55, MDA-EX2=17, BT-20 =55, MDA-MB-453=65, MDA-MB-157=75), the connected components of the SNN graph were identified using R package ‘igraph’ (v1.2.5)41 and classified as superclones. To identify subclones the umap embedding was used as input for the clustering algorithm hdbscan (minPts = 17 for TNBC tumors and 15 for cell lines) from R package ‘dbscan’ (v1.1–5)28,42. Hdbscan is an outlier aware clustering algorithm, since extensive filtering of the dataset was applied prior to clustering (see ‘Inference of DNA Copy Number’), any cell classified as an outlier was inferred to the same cluster group to its closest, non-outlier, nearest neighbor according to Euclidean distance. Subclones were further organized with hierarchical clustering (manhattan distance, ward.D2 linkage), further substructures identified by hierarchical clustering were not considered additional subclones. Jaccard similarity for clusters was computed by bootstrap with R package ‘fpc’ (v2.2–7) with mean jaccard similarities being reported. Heatmaps were plotted with R package ComplexHeatmap (v2.2.0)43. Clonal structure on heatmaps was organized according to the clonal lineage from the subclonal consensus copy number profiles (see ‘Calculating Consensus Copy Number Profiles Of Subclones’ and ‘Phylogenetic Reconstruction of Single Cell and Clonal Lineage Trees’).
Co-clustering of ACT and 10X Genomics CNV Single Cell Data
ACT and 10X genomics single-cell CNV resulting bincounts were merged and co-segmented with multipcf (gamma = 30) (see ‘Multi-Sample Segmentation and Integer Copy Number Estimation’), followed by MergeLevels to join adjacent segments with non-significant differences in segmented ratios. Segment ratios were scaled by tumor FACS inferred ploidy and rounded to the nearest integer. Co-clustering of ACT and 10X genomics single-cell CNV datasets was performed as previously described with hdbscan and parameters adjusted to match the original number of subclonal populations from ACT clustering (seed = 55, n neighbors = 40, minPts = 35, 80 for TN1 and TN3, respectively) (see ‘Clustering of Superclones And Subclones From Single Cell Copy Number Data’).
Calculating Consensus Copy Number Profiles of Superclones and Subclones
For each tumor sample, the integer copy number consensus profiles were calculated by taking the median of the ith segment of all single cells assigned to the same superclone or subclone, the ploidy was scaled by the average tumor ploidy derived by FACS and rounded to the nearest integer value.
Inference of Most Recent Common Ancestral Profile
The consensus profile of each superclone (see ‘Calculating Consensus Copy Number Profiles Of Subclones and Superclones’) was used to derive the most recent common ancestral (MRCA). For every segment, we selected the CN value amongst the consensus CN values from each superclone which is closest (L1 norm) to the average tumor ploidy as the ancestral segment.
Classification of Clonal, Subclonal and Unique CNA Segments
Clonal (cCNAs) and subclonal (sCNAs) segments were identified from the subclonal consensus matrices. sCNAs were further classified into unique CNAs (uCNAs) if 1 subclone presented at least 1 distinct copy number event compared to all others, formally:
Let ni be the frequency of subclones CNAi is in.
Let N be the total number of consensus subclones for the sample.
Clonal CNA (cCNA) are defined as ni = 1
Subclonal CNA (sCNA) are defined as 1/N < ni < 1
Unique CNA (uCNA) are defined as ni = 1/N
Construction of CNA Breakpoint Spectrums
To construct a frequency spectrum of CNAs using breakpoint frequencies across all single-cells we performed segmentation with R package ‘Piet’ (GFL) (v0.1.0)44 (rho1 = 0, rho2 = 0, rho3 = 70, obj_c = 10^−10, max_iter = 1^5). A matrix of log ratios from the variable binning copy number pipeline (see ‘Inference of DNA copy number’) and bin-wise variance estimation where, let x(i) be the log ratio bin count at bin i, the variance estimate is , was used as input for GFL. GFL returns piecewise constant curves with discontinuities across breakpoints. To account for discontinuities, we built interval estimates at intersecting breakpoints and constructed a graph to verify overlap across genomic positions over all single cells. Discontinuities higher than 10 bins were discarded and connected components were obtained from the resulting graph. Breakpoints that did not reach a ratio difference ≥ 0.6 between the median of two adjacent segments were not counted. Accuracy of resultant breakpoint frequency calls were assessed by simulation (Supplementary Methods). Resulting segments were ploidy scaled by the average FACS derived ploidy and rounded to the nearest integer values. Finally, we counted the frequency of each chromosome breakpoint across all cells from the sample resulting in a frequency spectrum.
Calculation of Subclonal Diversity Indexes
For each tumor sample we calculated the proportion (p) of cells that belong to a distinct subclone. Diversity was calculated as Shannon Index: Dc = with 95% confidence intervals calculated by bootstrapping (B = 3000).
Phylogenetic Reconstruction of Single Cell and Clonal Lineage Trees
Pairwise distances of single cells were calculated using Manhattan distance to obtain a distance matrix for each tumor. Phylogenetic inference for single cell trees and consensus trees were performed with the balanced minimum evolution algorithm45 from R package ape (v5.3)46. Root diploid nodes for phylogenetic inference were constructed from simulated variable binning profiles in which bins presented an integer copy number equal to 2. Distances were calculated from the diploid root to the most recent common ancestral (MRCA) and from the MRCA to the terminal aneuploid node. Terminal aneuploid node was defined by the largest branch length from the MRCA on the aneuploid subtree. Consensus phylogenetic trees were rooted from simulated variable binning profiles equal to the integer average tumor ploidy (see supplementary table 1, ‘ploidy’). Root nodes from consensus phylogenetic trees were removed for visualization purposes. Trees were plotted using R package ggtree (v2.0.3)47.
Mathematical Modeling of CNA Evolution
A branching process model for the accumulation of chromosomal breakpoints was used, in which a tumor cell can replicate, die, or replicate such that one of the daughter cells acquires two new breakpoints in its copy number profile and its ability to replicate is altered according to a fitness distribution. Under a reduced fitness distribution considering neutral and lethal aberrations only, we derived formulas for the expected number of breakpoints present at a given frequency, which were used in a likelihood analysis to determine whether an elevated breakpoint rate early in tumor growth provided a superior explanation of the data. Full details are given in Supplementary Methods – Mathematical Modeling.
Estimation of Cell Doubling Rates
The expanded subclones were grown from a single-cell (I) to a 90% confluent 10cm cell culture dish. MDA-MB-231 EX1 and EX2 remained in culture for 26 days (t), reaching a final number of ~ 5.86×10⁵ cells (F). Doubling time of the expanded subclones was calculated as: and number of generations (G) of cell divisions in each expanded population of cells was determined by .
Estimation of the De Novo Copy Number Rates
Estimation of de novo copy number rates was carried out with intra-arm breakpoints, and do not include arm level events (see ‘Construction of CNA breakpoint spectrums’). We assume exponential expansions and no cell death. For expansion i let the number of cells sequenced be n(i). Then an analytic formula, which contains the CNA rate as a prefactor, for the number of CNAs expected in the frequency range [2/n(i), 0.5) - E[nCNA(i)] - can be obtained (Supplementary Methods). Assuming each new CNA leads to two new breakpoints, we adopt the statistical model that the number of breakpoints at frequencies [2/n(i), 0.5) is Poisson distributed with parameter 2*E[nCNA(i)]. Further, we include that the probability of not observing a breakpoint present in y cells, which based on simulated data we approximated as 0.57*exp(− y*7.5*10−4) (the estimated rates decrease by a factor of ~2 without this assumption). For each expansion the observed number of breakpoints in the frequency range [2/n(i), 0.5) is called with Piet as described in ‘Construction of the CNA breakpoint spectrum’. The point estimate for the CNA rate in each cell expansion is then calculated via maximum likelihood (Supplementary Methods, section 7) and the confidence intervals are based on the assumed Poisson distribution and obtained numerically.
Somatic Mutation Variant Calling
Sequencing reads from bulk tumor tissue and matched normal tissues were demultiplexed into FASTQ files allowing 1 mismatch out of the 8 bp barcode. FASTQ files were aligned to hg19 (NCBS build 36) using bowtie2 (v2.2.6)32, sorted and converted from SAM to BAM files with SAMtools (v1.2)33. Duplicates were marked with Picard tools (v2.20.4)48 BAM files were recalibrated for base quality scores using Genome Analysis Toolkit (GATK v4.1.3)49 Base Recalibrator. Somatic variants from tumor tissue were identified with MuTect250and filtered using GATK FilterMutectCalls. Bcftools (v1.11–3) was used to retain PASS variants. Additionally, variants with allele frequency higher than 0.05 in matched normal samples were excluded. Variants on bulk tissue required a minimum depth of 10X, 5X of the alternative allele and allele frequencies > 0.1. Variants < 1000 base pairs apart were excluded from the analysis. VCF analysis was performed with the help of the R package ‘vcfR’ (v.1.12.0)51. Variants were annotated with ANNOVAR52 and excluded if present in dbsnp129. Mutations were considered to have a damaging impact using SIFT53 and POLYPHEN254 prediction algorithms, in which mutations with SIFT scores < 0.05, and POLYPHEN2 scores > 0.85 were considered to be significant.
Allele-specific Copy Number with ASCAT on Exomes
We counted the reads with each genotype at the 1000-genome SNP positions55 in the normal and tumor exome sequencing data using alleleCounter (v.4.0.0). SNP positions overlapping the genomic ranges defined by {start-100} and end {end+100} target regions of the exome panel bed file (SeqCap EZ Exome v2, Roche Cat# 05860482001); SNP positions < 20X depth in the normal tissue were excluded.
From the read counts at those positions we derived the and as input to ASCAT. We ran ASCAT (v.2.5.2) on the BAF and LogR tracks56 .We refitted the profiles by selecting the local optima (i.e. the minima in the total distance to integer DNA copy numbers) corresponding to the tumor ploidy that best matched the FACS-derived ploidy.
Estimation of Whole Genome Doubling Timing
The timing of whole genome duplications in relative mutational time was determined by inferring the proportion of clonal SNVs present on two allelic copies p2. Clonal SNVs were identified by running DPClust57on its default settings to produce clustering estimates. SNVs assigned to clusters with a cancer cell fraction of between 0.9 and 1.1 were labelled as clonal.
A mixture model on the observed alternate reads from clonal SNVs described13and was used to calculate the probability distribution on p2. The mixture model was composed of two binomial distributions with frequencies and corresponding to mutations on one and two alleles respectively. A probability distribution on p2 was calculated for SNVs in segments with allele-specific copy number 2+0/2+2 and 2+1 separately. A probability distribution on p2 was calculated for SNVs in segments with allele-specific copy number 2+0/2+2 and 2+1 separately.
The distributions on p2 were then used to calculate a timing distribution for the whole genome doubling (WGD) in relative mutational time. In 2+0 and 2+2 copy number regions the whole genome doubling timing π is given by: and in 2+1 regions it is given by . A combined probability distribution on π was calculated from combining the estimates derived from the 2+0/2+2 and 2+1 segments.
TP53 Mutation Timing
The cluster profiles produced by DPClust were used in MutationTimeR13 to estimate the probability that each SNV was clonal or subclonal and whether it occurred before the WGD.
Calculation of CNA Ratios from Exome Data
The fraction of clonal copy number events that occurred before the WGD was calculated using the allele specific exome copy number. Adjacent segments with identical allele-specific copy number were first merged and segments smaller than 100kb were filtered. Clonal copy number events were selected by filtering out segments with a total copy number different to the ancestral total copy number. Maximum parsimony was used to infer the copy number event history that led to each segment. Given that a WGD occurred in a tumor, the smallest combination of gains and losses of parental alleles that result in the final copy number state is assumed to have transpired. The proportion of copy number events occurring before and after the WGD across all segments in a tumor sample was calculated from these route histories. Confidence intervals were calculated by bootstrapping the filtered segments.
Allele-specific Copy Number in Superclones and Agreement with Exome Bulk
To obtain parental-allele specific copy-number in the superclones we merged single cell BAM files according to their superclones (see ‘Clustering of Superclones And Subclones ‘) using Sambamba (v0.7.0), we then proceed in three steps: 1. Phasing of heterozygous SNPs to the major allele. First, we define heterozygous SNPs in the exome as those having at least 20 reads and a B-allele frequency (BAF) between [0.2, 0.8] in the matched normal sample. We then phase the genotype with the maximum of the two read counts to the major parental allele. Second, we pool read counts per genotype across all single cancer cells at the 1000-genome SNP positions. We identify heterozygous SNPs with allele counts for genotype A and B, cA and cB, with and . We then phase the genotypes with the maximum of the two read counts to the major allele. Finally, we pool the phased SNPs identified from the exome and the single cells. Although exome SNPs can in theory also be identified in the superclones, including SNPs from the matched normal exome ensures that enough SNPs are still covering regions with loss of heterozygosity that would be mistaken as homozygous in the single cells. 2. Maximum-likelihood estimate of the BAF of each copy-number segment. For each copy-number segments i, we model the read counts of the genotype phased to the major allele at each heterozygous SNP positions ki as a Binomial: , where ni is the total read count and pi is the BAF. We compute the likelihood across all N heterozygous SNP positions for BAF values and normalise the likelihoods to get a probability distribution over the BAF values. The BAF is taken as the maximum likelihood estimate and we also derive the [5%, 95%] confidence intervals. 3. Deriving parental-allele-specific copy number in superclones. For each copy-number segment and its inferred total copy-number nt, we derive the number of copies of the major allele as and the number of copies of the minor allele as
Analysis of Bulk DNA-Seq Copy Number Data
Bulk DNA-seq copy number data from the expanded subclones was processed with the variable binning copy number pipeline at a genomic resolution averaging 200kb as described in section ‘Inference of DNA Copy Number’ and segmented as described in the section ‘Multi-sample Segmentation and Integer Copy Number’
Analysis of Bulk RNA-Seq Expression Data
Transcript abundances for expanded clones triplicates were quantified by Salmon (v.0.14)58 with GENCODE transcript v3059 and options -l A −1 read1 −2 read2 -p 40 --validateMappings --seqBias --gcBias. Quantified transcripts were imported into R with ‘tximport’ (v 1.14)60. Expanded clones e7, e39 and e71 had one technical replicate excluded due to poor RNA quality. Genes with a read count of < 5 in 3 or more samples were excluded from the analysis. Samples were normalized for differences in sequencing depth by computing size factors and further variance stabilizing transformation with DESeq2 (v 1.26.0)61.
Integrated Analysis of DNA and RNA In Subclonal Regions
MDA-MB-231 DNA copy number data from single-cells of the parental cell line and from bulk expanded single daughter cells were jointly segmented and co-clustered as described in ‘Multi-sample Segmentation and Integer Copy Number Estimation’ (gamma = 20) and ‘Clustering of Superclones and Subclones’ (minPts = 14, n neighbors = 25, seed = 5, k superclones = 43). Briefly, segment ratio copy number profiles were embedded into two dimensions using UMAP followed by construction of an SNN graph. Matching DNA-RNA pairs from the bulk expanded single daughter cells dataset were assigned identities according to their subclonal classification from the DNA co-clustering results. The group of expanded single daughter cells belonging to the same subclone were designated as expanded clusters. Variance stabilized gene counts from RNA triplicates (see ‘Bulk DNA-Seq and RNA-Seq of MDA-MB-231’ and ‘Analysis of Bulk RNA-Seq expression data’) for each expanded single daughter cell were averaged and a gene-wise z-score was calculated. Gene-wise z-scores were further averaged according to their assigned expanded clusters. Genes were organized by their corresponding genomic positions and moving windows of 150 genes were calculated for each chromosome. DNA copy number profiles from the expanded clusters are shown by taking the mode of the ith segment from their profiles according to the co-clustering identities.
Gene Set Enrichment Analysis
Differential expression analysis was performed with DESeq2. Comparisons were made by contrasting each subclonal identity against all others. Fast Gene Set Enrichment Analysis was performed using R package ‘fgsea’ (nperm = 2000)62 with the msigdb h.all.v6.2.symbols cancer hallmark gene sets20. Gene sets that were not significant (p-value < 0.05) in at least 6 subclonal identities were excluded from the analysis. Gene set pathways and expanded clusters were clustered with hierarchical clustering (Euclidean distance, ward.D linkage).
Statistical Analysis
Statistical analysis was performed in the R software (v3.6.2)63with ‘base’ and ‘Rstatix’64 packages. Plots were generated with the R package ‘ggplot2’ (v3.2.1)65 SciPy (v.1.4.1)66 and pandas (v1.01)67
Extended Data
Extended Data Figure 1 – Technical Metrics and Performance of ACT.
(a) ACT single cell DNA library size distributions for TN1, TN2 and TN3 after pooling 384 cell libraries. (b) Schematic of using positional barcoding information to determine single-molecule information by tagmentation during ACT, compared to whole-genome amplification using DOP-PCR, where the original DNA fragmentation sites of single molecules cannot be resolved. (c) Breadth of coverage for sparse depth data from different scDNA-seq methods plotted by individual samples, using N=100 random cells per sample. (d) Overdispersion of bin counts for sparse depth data from different scDNA-seq methods plotted by individual samples, using N=100 random cells per sample. (e) Distribution of sequencing reads across a diploid region of chromosome 4p14 for a single SK-BR-3 cell sequenced by DOP-PCR compared to ACT, in which the PCR duplicates were retained or removed to obtain single-molecule data. (f) Distribution of sequencing reads across a diploid region of chromosome 4p (top panel) and 10q (bottom panel) for a single SK-BR-3 cell sequenced by DOP-PCR compared to ACT, with or without duplicate molecules retained. (g) Lorenz curves of coverage uniformity for ACT, DOP-PCR and one bulk DNA-seq data from SK-BR-3 single cells, downsampled to equal coverage depth. (h) Breadth of coverage as a function of pseudo-bulk reconstruction by combining multiple cells for ACT, DOP-PCR and bulk sequencing.
Extended Data Figure 2 – Molecular Properties of Subclonal Chromosome Aberrations.
(a) FACS profiles of DAPI-stained nuclei flow-sorted for ACT from eight TNBC patients showing ploidy distributions, with vertical red lines showing the sorting gates. (b) Shannon diversity indexes calculated from the single cell copy number data from each of the eight TNBC patients with 95% confidence intervals indicated. (c) Heatmap of the genomic regions of cCNAs, sCNAs and uCNAs across the eight tumor samples. (d) Distributions of the genomic segment sizes of clonal, subclonal and unique CNAs across the eight tumors. (e) Proportion of genome altered relative to the tumor ploidy classified as copy number losses in blue, neutral ground state copy number in white and gains in red. (f) Bootstrapping of subclone clusters showing the mean jaccard similarity for each subclone across the eight tumors. (g) Scatter plots of number of cells in each subclone cluster by mean jaccard similarity for each of the eight tumors.
Extended Data Figure 3 – Copy Number Substructure of Additional TNBC Patients.
(a) Clustered heatmaps of single cell copy number profiles for TN3 – TN8 with left annotation bars representing superclones and subclones, and bottom annotation bars representing different genomic regions of CNAs classes as well as annotations for selected breast cancer genes. (b) Matrix plots for TN3 – TN8 showing integer copy number states for selected breast cancer genes in regions of cCNAs, sCNAs and uCNAs across the different subclones in each tumor.
Extended Data Figure 4 – Validation of Clonal Substructure Using a Microdroplet Approach.
(a) Co-clustering of ACT and 10X Genomics copy number data for samples TN1 (n = 1976 cells) and TN3 (n = 2171 cells), showing subclones detected in the merged data sets. (b) Frequency of subclones detected on each platform in the merged datasets from 10X and ACT. (c) Clustered heatmaps of single cell copy number profiles for TN1 and TN3 with left annotation bars representing the scDNA-seq technology platform and the different subclones, with annotations for selected breast cancer genes indicated below (d) Barplots of copy number state frequencies of selected breast cancer genes for ACT and 10X CNV showing the proportion of copy number states for all cells separated by platform.
Extended Data Figure 5 – Whole Genome Doubling Estimates and Additional Copy Number Lineages.
(a) Exome mutation counts of each tumor indicating mutations that were classified as clonal or subclonal based on allele-specific copy number frequencies. (b) Most frequent exonic mutations in genes with significant SIFT (<0.05) and Polyphen2 (>0.85) scores. (c) Density plots showing the probability of genome doubling as a function of relative mutational time for 7 out of the 8 TNBC patients with sufficient number of truncal exome mutations (d) Minimum evolution trees of single cell copy number profiles using Manhattan distances for TN3-TN8, indicating the distance from the diploid root node to the most recent common ancestral (MRCA) and the distance from the MRCA to the terminal nodes. Annotations indicate the timing of genome doubling and timing of TP53 mutations prior to WGD in all of the tumors. (e) Summary of the truncal distances from the diploid root node to the MRCA and the branching distances from the MRCA to the last terminal node.
Extended Data Figure 6 -. Evolutionary Analysis of Clonal Lineages in additional TNBC Patients.
(a) Left panels show the minimum evolution trees after the MRCA generated using the consensus CNA profiles of subclones for TN3 – TN8 rooted by a neutral node to the MRCA and colored by superclones and subclones. Right panels show heatmaps of consensus subclones profiles, with annotations for the superclones and subclones on left annotation bars and bottom annotation bars showing different CNA classes, as well as selected breast cancer genes. The last row in the clustered heatmaps shows the inferred MRCA copy number profiles. (b) Genome-wide copy-number profiles of TNBC tumors with segments of the rounded total copy-number (orange) and the rounded number of copies of the minor allele (blue). Thick segments are ASCAT profiles from the exome bulk, while thinner segments are from the superclones with slight offset relative to integer values for visualization. For each superclone, in parentheses the percentage of the genomic region where both the minor and major allele copy numbers are the same as in the exome are shown, restricting to the genomic region where the total is also the same.
Extended Data Figure 7 – Chromosome Breakpoint Frequency Spectra of Additional Tumors.
(a) Comparison of the expected CNA frequency spectrum obtained from theory and simulation. Simulations include a flexible fitness distribution, while the theory considers neutral and lethal changes only. Different colors correspond to varying the increase in CNA rate during the transient instability phase, and the tumor size at which the instability subsides. Exact parameters given in the Supplementary Methods 1. (b) Maximum likelihood fits for the breakpoint frequency spectra obtained for TNBC tumors under models of gradual and transient instability after PCNE, parameter values for simulations and further details are provided in the Supplementary Methods. (c) Maximum likelihood fits for the breakpoint frequency spectra obtained from expanded clones of MDA-MB-231 under models of gradual and transient instability. Further details are provided in the Supplementary Methods.
Extended Data Figure 8 – Clonal Substructure of Additional TNBC Cell Lines and Single Cell Expansions.
(a-b) Clustered heatmaps of single cell copy number data from the BT-20 (n = 1231 cells) and MDA-MB-157 (n = 1210 cells) cell lines, in which left annotation bars represent superclones and subclones, while the bottom annotation bar represents different classes of CNA types (c) Number of superclones and subclones identified in the TNBC cell lines (d) Number of clonal, subclonal and unique CNAs detected in the 4 TNBC cell lines, as well as the two MDA-MB-231 expanded daughter cells. (e) Distributions of the genomic sizes of clonal, subclonal and unique CNAs across the 4 TNBC cell lines and the two MDA-MB-231 expanded daughter cell lines. (f) Shannon indexes calculated from the single cell copy number profiles from the 4 TNBC cell lines and the two expanded MDA-MB-231 daughter cells with 95% confidence intervals. (g) Microscopic field of DNA-FISH experiments of MDA-MB-231 using AKT3 and BCAS2 probes at 60X magnification. (h) Barplots showing the results of DNA-FISH copy number states counted across 1000 cells for each of the probes compared to the ACT data. (i) Clustered heatmap of single cell copy number data for MDA-MB-231 EX2 cell line expansion (n = 897 cells), in which left annotation bars represent superclones and subclones, while the bottom annotation bar represents different classes of CNA types.
Extended Data Figure 9 – DNA and RNA Analysis of Expanded Clones from MDA-MB-231.
(a) Schematic of physical single cell subcloning experiments of daughter cells to generate 78 expansions from the MDA-MB-231 parental cell line. (b) Co-clustering of the single cell copy number data from the parental MDA-MB-231 cell line (n = 820 cells) with the 78 expanded clone bulk DNA-seq copy number profiles. (c) PCA of bulk RNA-seq profiles of the 78 expanded daughter cell lines triplicates, with contour colors representing superclones and point color representing the subclone clusters from the genotypes of the single-cell and bulk DNA-Seq co-clustering. (d) Clustered heatmap of bulk DNA copy number profiles from the 78 expanded clones, with left annotation bars representing superclones and subclones, as determined by co-clustering with the parental single cell copy number data. (e) Mean gene expression levels of different copy number states for 78 expansions from the MDA-MB-231 parental cell line. (f) Cumulative number of subclonal segments as a function of Kruskal-Wallis test p-value, in which the red line denotes a p-value of 0.05. (g) Mean gene expression as a function of copy number segments with points representing expanded clusters for two subclonal CNAs on chr11 and chr19. (h-i) Consensus integer copy number profiles of the 10 expanded clone clusters on chromosome 11 (h) and chromosome 19 (i) shown in the upper panels with matched RNA-seq expression below using moving windows of 100 genes. Right panels show selected breast cancer genes in subclonal CNA regions and their corresponding box plots of RNA expression for each expanded cluster. (j) Cancer hallmark signatures with significant variability of normalized enrichment scores (NES) across the expanded clone clusters.
Extended Data Figure 10 – Models of Chromosome Evolution During Primary Tumor Expansion.
(a-c) Three models of chromosome evolution dynamics during the expansion of primary TNBC tumors, with schematic plots of chromosome accumulation over time in left panels and Muller plots of clonal frequencies in right panels. (a) Gradual model of copy number evolution, in which CNAs are acquired sequentially throughout tumor progression leading to the expansion of successive subclones over time (b) Punctuated copy number evolution model, in which an initial burst of instability generates a large number of CNAs and subclones that undergo stable expansions to form the primary tumor mass, with no (or few) new CNAs acquired after the initial burst (c) Model of punctuated evolution and transient instability, in which the early acquisition of TP53 mutations and genome doubling lead to a burst of genomic instability in which a large number of CNA events are acquired and subclones are generated. These events are followed by a period of transient instability and ongoing copy number evolution during the expansion of the primary tumor mass, which leads to the generation of additional subclones and genomic diversity.
Supplementary Material
Acknowledgements
This work was supported by grants to N.E.N. from the American Cancer Society (129098-RSG-16-092-01-TBG), the National Cancer Institute (R01CA240526, R01CA236864), the Emerson Collective Cancer Research Fund (144300-80-121457-19) and the CPRIT Single Cell Genomics Center (RP180684). N.E.N. is an AAAS Wachtel Scholar and AAAS Fellow. This study was supported by core facility grants (CA016672, CA016672) from NIH. This work was supported by the Dana–Farber Cancer Institute Physical Sciences Oncology Center (grant no. U54CA143798 to F.M.) and the DFCI Center for Cancer Evolution (to F.M.). T.B., M.T. and P.V.L. are supported by the Francis Crick Institute, Cancer Research UK (FC001202), the UK Medical Research Council (FC001202), and the Wellcome Trust (FC001202). P.V.L. is a Winton Group Leader in recognition of the Winton Charitable Foundation’s support towards the establishment of The Francis Crick Institute. T.B. is supported by a fellowship from the Boehringer Ingelheim Fonds. We thank Hongli Tang, Louis Ramagli, Erika Thompson, Sohrab Shah, Andrew McPherson, Naveen Ramesh, Awdhesh Kalia for their assistance on this project.
Footnotes
Competing interests
F.M. is the co-founder of an oncology company.
Ethics declarations
none to declare.
Data availability
The data from this study was deposited in NCBI Sequence Read Archive under accession number PRJNA629885.
References
- 1.Davis A, Gao R & Navin N Tumor evolution: Linear, branching, neutral or punctuated? Biochim Biophys Acta Rev Cancer 1867, 151–161, doi: 10.1016/j.bbcan.2017.01.003 (2017). [DOI] [PMC free article] [PubMed] [Google Scholar]
- 2.Burrell RA, McGranahan N, Bartek J & Swanton C The causes and consequences of genetic heterogeneity in cancer evolution. Nature 501, 338–345, doi: 10.1038/nature12625 (2013). [DOI] [PubMed] [Google Scholar]
- 3.Pfister K et al. Identification of Drivers of Aneuploidy in Breast Tumors. Cell Rep 23, 2758–2769, doi: 10.1016/j.celrep.2018.04.102 (2018). [DOI] [PMC free article] [PubMed] [Google Scholar]
- 4.Xu J, Huang L & Li J DNA aneuploidy and breast cancer: a meta-analysis of 141,163 cases. Oncotarget 7, 60218–60229, doi: 10.18632/oncotarget.11130 (2016). [DOI] [PMC free article] [PubMed] [Google Scholar]
- 5.Gordon DJ, Resio B & Pellman D Causes and consequences of aneuploidy in cancer. Nature reviews. Genetics 13, 189–203, doi: 10.1038/nrg3123 (2012). [DOI] [PubMed] [Google Scholar]
- 6.Fearon ER & Vogelstein B A genetic model for colorectal tumorigenesis. Cell 61, 759–767, doi:0092-8674(90)90186-I [pii] (1990). [DOI] [PubMed] [Google Scholar]
- 7.Gao R et al. Punctuated copy number evolution and clonal stasis in triple-negative breast cancer. Nature Genetics 48, 1119–1119 (2016). [DOI] [PMC free article] [PubMed] [Google Scholar]
- 8.Baca SC et al. Punctuated evolution of prostate cancer genomes. Cell 153, 666–677, doi: 10.1016/j.cell.2013.03.021 (2013). [DOI] [PMC free article] [PubMed] [Google Scholar]
- 9.Navin N et al. Tumour evolution inferred by single-cell sequencing. Nature 472, 90–94, doi: 10.1038/nature09807 (2011). [DOI] [PMC free article] [PubMed] [Google Scholar]
- 10.Cross W et al. The evolutionary landscape of colorectal tumorigenesis. Nat Ecol Evol 2, 1661–1672, doi: 10.1038/s41559-018-0642-z (2018). [DOI] [PMC free article] [PubMed] [Google Scholar]
- 11.Carter SL et al. Absolute quantification of somatic DNA alterations in human cancer. Nat Biotechnol 30, 413–421, doi: 10.1038/nbt.2203 (2012). [DOI] [PMC free article] [PubMed] [Google Scholar]
- 12.Zack TI et al. Pan-cancer patterns of somatic copy number alteration. Nat Genet 45, 1134–1140, doi: 10.1038/ng.2760 (2013). [DOI] [PMC free article] [PubMed] [Google Scholar]
- 13.Gerstung M et al. The evolutionary history of 2,658 cancers. Nature 578, 122–128, doi: 10.1038/s41586-019-1907-7 (2020). [DOI] [PMC free article] [PubMed] [Google Scholar]
- 14.Cross W, Graham TA & Wright NA New paradigms in clonal evolution: punctuated equilibrium in cancer. J Pathol 240, 126–136, doi: 10.1002/path.4757 (2016). [DOI] [PubMed] [Google Scholar]
- 15.Hadimioglu B, Stearns R & Ellson R Moving Liquids with Sound: The Physics of Acoustic Droplet Ejection for Robust Laboratory Automation in Life Sciences. J Lab Autom 21, 4–18, doi: 10.1177/2211068215615096 (2016). [DOI] [PubMed] [Google Scholar]
- 16.Zahn H et al. Scalable whole-genome single-cell library preparation without preamplification. Nat Methods 14, 167–173, doi: 10.1038/nmeth.4140 (2017). [DOI] [PubMed] [Google Scholar]
- 17.Gao R et al. Punctuated copy number evolution and clonal stasis in triple-negative breast cancer. Nat Genet, doi: 10.1038/ng.3641 (2016). [DOI] [PMC free article] [PubMed] [Google Scholar]
- 18.Chavez KJ, Garimella SV & Lipkowitz S Triple negative breast cancer cell lines: one tool in the search for better treatment of triple negative breast cancer. Breast Dis 32, 35–48, doi: 10.3233/BD-2010-0307 (2010). [DOI] [PMC free article] [PubMed] [Google Scholar]
- 19.Williams MJ, Werner B, Barnes CP, Graham TA & Sottoriva A Identification of neutral tumor evolution across cancer types. Nat Genet 48, 238–244, doi: 10.1038/ng.3489 (2016). [DOI] [PMC free article] [PubMed] [Google Scholar]
- 20.Liberzon A et al. The Molecular Signatures Database (MSigDB) hallmark gene set collection. Cell Syst 1, 417–425, doi: 10.1016/j.cels.2015.12.004 (2015). [DOI] [PMC free article] [PubMed] [Google Scholar]
- 21.Wang Y et al. Clonal evolution in breast cancer revealed by single nucleus genome sequencing. Nature 512, 155–160, doi: 10.1038/nature13600 (2014). [DOI] [PMC free article] [PubMed] [Google Scholar]
- 22.Cross W et al. Stabilising selection causes grossly altered but stable karyotypes in metastatic colorectal cancer. bioRxiv, 2020.2003.2026.007138, doi: 10.1101/2020.03.26.007138 (2020). [DOI] [Google Scholar]
- 23.Fehrmann RS et al. Gene expression analysis identifies global gene dosage sensitivity in cancer. Nat Genet 47, 115–125, doi: 10.1038/ng.3173 (2015). [DOI] [PubMed] [Google Scholar]
- 24.Ben-David U et al. Genetic and transcriptional evolution alters cancer cell line drug response. Nature 560, 325–330, doi: 10.1038/s41586-018-0409-3 (2018). [DOI] [PMC free article] [PubMed] [Google Scholar]
- 25.Greenfield EA Single-Cell Cloning of Hybridoma Cells by Limiting Dilution. Cold Spring Harb Protoc 2019, pdb prot103192, doi: 10.1101/pdb.prot103192 (2019). [DOI] [PubMed] [Google Scholar]
- 26.Zong C, Lu S, Chapman AR & Xie XS Genome-wide detection of single-nucleotide and copy-number variations of a single human cell. Science 338, 1622–1626, doi: 10.1126/science.1229164 (2012). [DOI] [PMC free article] [PubMed] [Google Scholar]
- 27.Xi L et al. New library construction method for single-cell genomes. PLoS One 12, e0181163, doi: 10.1371/journal.pone.0181163 (2017). [DOI] [PMC free article] [PubMed] [Google Scholar]
- 28.Laks E et al. Clonal Decomposition and DNA Replication States Defined by Scaled Single-Cell Genome Sequencing. Cell 179, 1207–1221 e1222, doi: 10.1016/j.cell.2019.10.026 (2019). [DOI] [PMC free article] [PubMed] [Google Scholar]
- 29.Vitak SA et al. Sequencing thousands of single-cell genomes with combinatorial indexing. Nat Methods 14, 302–308, doi: 10.1038/nmeth.4154 (2017). [DOI] [PMC free article] [PubMed] [Google Scholar]
Methods References
- 30.Baslan T et al. Genome-wide copy number analysis of single cells. Nat Protoc 7, 1024–1041, doi:nprot.2012.039 [pii] 10.1038/nprot.2012.039 (2012). [DOI] [PMC free article] [PubMed] [Google Scholar]
- 31.Langmead B & Salzberg SL Fast gapped-read alignment with Bowtie 2. Nat Methods 9, 357–359, doi: 10.1038/nmeth.1923 (2012). [DOI] [PMC free article] [PubMed] [Google Scholar]
- 32.Li H et al. The Sequence Alignment/Map format and SAMtools. Bioinformatics 25, 2078–2079, doi: 10.1093/bioinformatics/btp352 (2009). [DOI] [PMC free article] [PubMed] [Google Scholar]
- 33.Venkatraman ES & Olshen AB A faster circular binary segmentation algorithm for the analysis of array CGH data. Bioinformatics 23, 657–663, doi: 10.1093/bioinformatics/btl646 (2007). [DOI] [PubMed] [Google Scholar]
- 34.Hahsler M, Piekenbrock M & Doran D dbscan: Fast Density-Based Clustering with R. 2019 91, 30, doi: 10.18637/jss.v091.i01 (2019). [DOI] [Google Scholar]
- 35.Leung ML et al. Highly multiplexed targeted DNA sequencing from single nuclei. Nat Protoc 11, 214–235, doi: 10.1038/nprot.2016.005 (2016). [DOI] [PMC free article] [PubMed] [Google Scholar]
- 36.Quinlan AR & Hall IM BEDTools: a flexible suite of utilities for comparing genomic features. Bioinformatics 26, 841–842, doi:btq033 [pii] 10.1093/bioinformatics/btq033 (2010). [DOI] [PMC free article] [PubMed] [Google Scholar]
- 37.Nilsen G et al. Copynumber: Efficient algorithms for single- and multi-track copy number segmentation. BMC Genomics 13, 591, doi: 10.1186/1471-2164-13-591 (2012). [DOI] [PMC free article] [PubMed] [Google Scholar]
- 38.McInnes L, Healy J & Melville J. UMAP: Uniform Manifold Approximation and Projection for Dimension Reduction. arXiv (2018). [Google Scholar]
- 39.Lun AT, McCarthy DJ & Marioni JC A step-by-step workflow for low-level analysis of single-cell RNA-seq data with Bioconductor. F1000Res 5, 2122, doi: 10.12688/f1000research.9501.2 (2016). [DOI] [PMC free article] [PubMed] [Google Scholar]
- 40.Csardi G & Nepusz T The igraph software package for complex network research. InterJournal, Complex Systems 1695, 1–-9 (2006). [Google Scholar]
- 41.McInnes L, Astels JH,S,. hdbscan: Hierarchical density based clustering. Vol. volume 2 (2017). [Google Scholar]
- 42.Gu Z, Eils R & Schlesner M Complex heatmaps reveal patterns and correlations in multidimensional genomic data. Bioinformatics 32, 2847–2849, doi: 10.1093/bioinformatics/btw313 (2016). [DOI] [PubMed] [Google Scholar]
- 43.Zhang Z, Lange K & Sabatti C Reconstructing DNA copy number by joint segmentation of multiple sequences. BMC Bioinformatics 13, 205, doi: 10.1186/1471-2105-13-205 (2012). [DOI] [PMC free article] [PubMed] [Google Scholar]
- 44.Desper R & Gascuel O Fast and Accurate Phylogeny Reconstruction Algorithms Based on the Minimum-Evolution Principle. Journal of Computational Biology 9, 687–705, doi: 10.1089/106652702761034136 (2002). [DOI] [PubMed] [Google Scholar]
- 45.Paradis E & Schliep K ape 5.0: an environment for modern phylogenetics and evolutionary analyses in R. Bioinformatics 35, 526–528, doi: 10.1093/bioinformatics/bty633 (2018). [DOI] [PubMed] [Google Scholar]
- 46.Yu G, Smith DK, Zhu H, Guan Y & Lam TT-Y ggtree: an r package for visualization and annotation of phylogenetic trees with their covariates and other associated data. Methods in Ecology and Evolution 8, 28–36, doi: 10.1111/2041-210x.12628 (2017). [DOI] [Google Scholar]
- 47.Picard. http://picard.sourceforge.net/.
- 48.McKenna A et al. The Genome Analysis Toolkit: a MapReduce framework for analyzing next-generation DNA sequencing data. Genome Res 20, 1297–1303, doi:gr.107524.110 [pii] 10.1101/gr.107524.110 (2010). [DOI] [PMC free article] [PubMed] [Google Scholar]
- 49.Cibulskis K et al. Sensitive detection of somatic point mutations in impure and heterogeneous cancer samples. Nat Biotechnol 31, 213–219, doi: 10.1038/nbt.2514 (2013). [DOI] [PMC free article] [PubMed] [Google Scholar]
- 50.Knaus BJ & Grunwald NJ vcfr: a package to manipulate and visualize variant call format data in R. Mol Ecol Resour 17, 44–53, doi: 10.1111/1755-0998.12549 (2017). [DOI] [PubMed] [Google Scholar]
- 51.Wang K, Li M & Hakonarson H ANNOVAR: functional annotation of genetic variants from high-throughput sequencing data. Nucleic Acids Res 38, e164, doi:gkq603 [pii] 10.1093/nar/gkq603 (2010). [DOI] [PMC free article] [PubMed] [Google Scholar]
- 52.Ng PC & Henikoff S SIFT: Predicting amino acid changes that affect protein function. Nucleic Acids Res 31, 3812–3814 (2003). [DOI] [PMC free article] [PubMed] [Google Scholar]
- 53.Adzhubei I, Jordan DM & Sunyaev SR Predicting functional effect of human missense mutations using PolyPhen-2. Current protocols in human genetics / editorial board, Haines Jonathan L. ... [et al. ] Chapter 7, Unit7 20, doi: 10.1002/0471142905.hg0720s76 (2013). [DOI] [PMC free article] [PubMed] [Google Scholar]
- 54.Genomes Project, C. et al. A global reference for human genetic variation. Nature 526, 68–74, doi: 10.1038/nature15393 (2015). [DOI] [PMC free article] [PubMed] [Google Scholar]
- 55.Van Loo P et al. Allele-specific copy number analysis of tumors. Proc Natl Acad Sci U S A 107, 16910–16915, doi: 10.1073/pnas.1009843107 (2010). [DOI] [PMC free article] [PubMed] [Google Scholar]
- 56.Nik-Zainal S et al. The life history of 21 breast cancers. Cell 149, 994–1007, doi: 10.1016/j.cell.2012.04.023 (2012). [DOI] [PMC free article] [PubMed] [Google Scholar]
- 57.Patro R, Duggal G, Love MI, Irizarry RA & Kingsford C Salmon provides fast and bias-aware quantification of transcript expression. Nat Methods 14, 417–419, doi: 10.1038/nmeth.4197 (2017). [DOI] [PMC free article] [PubMed] [Google Scholar]
- 58.Frankish A et al. GENCODE reference annotation for the human and mouse genomes. Nucleic Acids Res 47, D766–d773, doi: 10.1093/nar/gky955 (2019). [DOI] [PMC free article] [PubMed] [Google Scholar]
- 59.Soneson C, Love M & Robinson M Differential analyses for RNA-seq: transcript-level estimates improve gene-level inferences [version 2; peer review: 2 approved]. F1000Research 4, doi: 10.12688/f1000research.7563.2 (2016). [DOI] [PMC free article] [PubMed] [Google Scholar]
- 60.Love MI, Huber W & Anders S Moderated estimation of fold change and dispersion for RNA-seq data with DESeq2. Genome Biology 15, 550, doi: 10.1186/s13059-014-0550-8 (2014). [DOI] [PMC free article] [PubMed] [Google Scholar]
- 61.Korotkevich G, Sukhov V & Sergushichev A Fast gene set enrichment analysis. bioRxiv, 060012, doi: 10.1101/060012 (2019). [DOI] [Google Scholar]
- 62.Team, R. C. R: A language and environment for statistical computing, < URL http://www.R-project.org/. > (2013).
- 63.Kassambara A rstatix: Pipe-Friendly Framework for Basic Statistical Tests, <. https://CRAN.R-project.org/package=rstatix > (2020). [Google Scholar]
- 64.H, W. ggplot2: Elegant Graphics for Data Analysis. Springer-Verlag; New York., <https://ggplot2.tidyverse.org. > (2016). [Google Scholar]
- 65.Virtanen P et al. SciPy 1.0: fundamental algorithms for scientific computing in Python. Nat Methods 17, 261–272, doi: 10.1038/s41592-019-0686-2 (2020). [DOI] [PMC free article] [PubMed] [Google Scholar]
- 66.McKinney S Data structures for statistical computing in python., Vol. Vol. 445 (2010). [Google Scholar]
Associated Data
This section collects any data citations, data availability statements, or supplementary materials included in this article.
Supplementary Materials
Data Availability Statement
The data from this study was deposited in NCBI Sequence Read Archive under accession number PRJNA629885.


