

Abstract
The understanding of how aging contributes to dementia remains obscure. To address this problem, a chemical biology approach was used employing CAD031, an Alzheimer’s disease (AD) drug candidate identified using a discovery platform based upon phenotypic screens that mimic toxicities associated with the aging brain. Since CAD031 has therapeutic efficacy when fed to old symptomatic transgenic AD mice, the chemical biology hypothesis is that it can be used to determine the molecular pathways associated with age-related disease by identifying those that are modified by the compound. Here we show that when CAD031 was fed to rapidly aging SAMP8 mice starting in the last quadrant of their lifespan, it reduced many of the changes in gene, protein, and small molecule expression associated with mitochondrial aging, maintaining mitochondria at the younger molecular phenotype. Network analysis integrating the metabolomics and transcription data followed by mechanistic validation showed that CAD031 targets acetyl-CoA and fatty acid metabolism via the AMPK/ACC1 pathway. Importantly, CAD031 extended the median lifespan of SAMP8 mice by about 30%. These data show that specific alterations in mitochondrial composition and metabolism highly correlate with aging, supporting the use AD drug candidates that limit physiological aging in the brain.
Electronic supplementary material
The online version of this article (10.1007/s11357-020-00238-5) contains supplementary material, which is available to authorized users.
Keywords: Aging, Dementia, Drugs, CAD031, Longevity
Introduction
While aging is rarely considered a drug target for dementias such as Alzheimer’s disease (AD), it is by far its greatest risk factor. However, AD drug discovery has largely focused on the amyloid pathway associated with the genetic forms found in familial Alzheimer’s disease (FAD) cases. In addition, preclinical testing of AD drug candidates is rarely done in old animals to examine their effect in the aging phenotype. Therefore, it is important to identify the physiological changes that are localized to the later stages of aging and understand how they respond to potential therapies for neurodegenerative diseases.
We have developed AD drug candidates based upon phenotypic screening assays that recapitulate toxicities associated with the aging brain, such as reduced energy metabolism, loss of trophic support, inflammation, and others (Prior et al. 2014). Three lead compounds have emerged from these studies that make mice look younger based upon behavioral, gene expression, and metabolic profiles when fed to mice at a young age. These include the synthetic curcumin derivative J147 (Chen et al. 2011; Currais et al. 2015), the rare flavone fisetin (Currais et al. 2018; Yousefzadeh et al. 2018), and the synthetic fisetin derivative, CMS121 (Currais et al. 2019; Chiruta et al. 2012). Because all three compounds extend lifespan in model organisms, and have therapeutic efficacy in multiple memory and AD models (Chen et al. 2011; Currais et al. 2015; Currais et al. 2018; Currais et al. 2019), they have been termed geroneuroprotectors (GNPs) (Schubert et al. 2018).
We recently synthesized a derivative of J147 called CAD031 (Fig. 1a) that is as effective as J147 in our phenotypic neuroprotective screening assays (Prior et al. 2016). When fed to APPswe/PSIΔE9 mice between 3 and 9 months, CAD031 prevents the major memory and behavioral deficits in these mice better than donepezil (Prior et al. 2016). In addition, it is able to normalize behavior to a more youthful level when fed to symptomatic 10-month-old APPswe/PSIΔE9 mice for 3 months (Prior et al. 2016; Goldberg et al. 2018; Daugherty et al. 2017)). Because CAD031 has therapeutic efficacy in age-dependent disease models, it was hypothesized that the compound may have an effect on the aging process itself. To test this possibility, we used rapidly aging senescence-accelerated prone 8 (SAMP8) mice that have about half the lifespan of normal mice and exhibit a progressive, age-associated decline in the brain and most other organ systems similar to humans (Currais et al. 2015; Morley et al. 2012; Cheng et al. 2014; Currais et al. 2012). As they age, SAMP8 mice develop an early deterioration in a number of pathophysiological alterations in the brain including increased oxidative stress, inflammation, vascular impairment, gliosis, Aβ accumulation and tau hyperphosphorylation. Since their median lifespan is less than 14 months, they are well suited for aging studies.
Fig. 1.
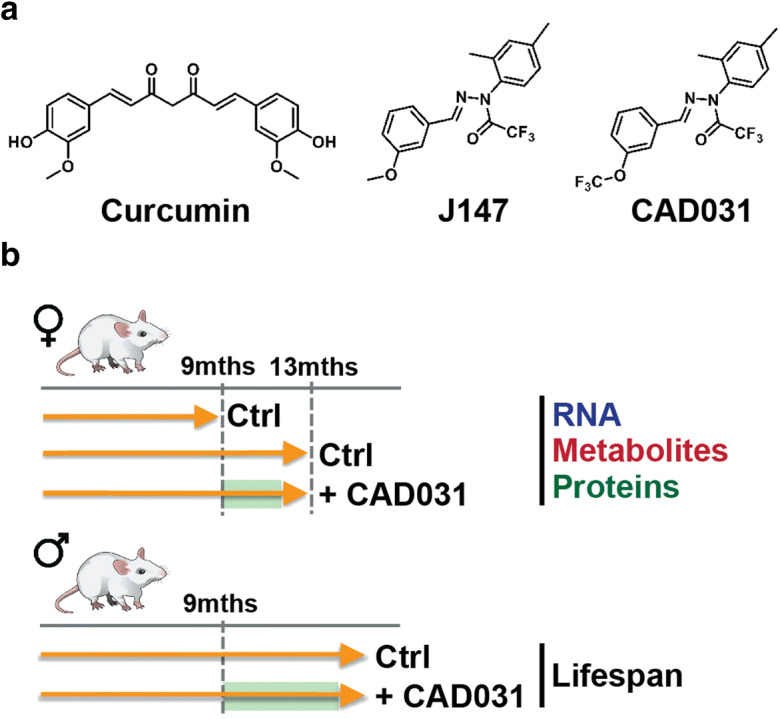
Experimental diagram. a Chemical structures of curcumin, J147, and CAD031. b 9-month-old littermate female and male SAMP8 mice were treated with J147 for biochemical analyses (RNA, metabolites and proteins) or lifespan studies, respectively
Here we show that when fed to very old SAMP8 mice, CAD031 shifts multiple molecular parameters of aging to a younger (9-month-old) phenotype. Its major physiological effect in the brain is the maintenance of mitochondrial stability. Bioinformatics analysis shows that acetyl-CoA is a critical molecule involved in the maintenance of mitochondria by CAD031, likely via the AMPK/ACC1 pathway. CAD031 also extends the median lifespan on SAMP8 mice when fed to very old animals. It is concluded that aging has a unique phenotypic signature in SAMP8 mice that demonstrates the relevance of acetyl-CoA and mitochondrial dysfunction to aging.
Results
In humans, most neurodegenerative diseases occur after the age of 65, the last quadrant of their lifespan (Rocca et al. 2011). To understand the relationship between aging and disease, it is imperative to determine the physiological changes that occur during old age and to identify compounds that reduce or inhibit these changes. SAMP8 mice recapitulate many, if not most, aspects of human aging (Currais et al. 2015; Morley et al. 2012; Cheng et al. 2014; Currais et al. 2012), and they have been used extensively by our laboratories to study the molecular aspects of aging and for AD drug discovery (Currais et al. 2015; Currais et al. 2018; Goldberg et al. 2018; Currais et al. 2012). Because CAD031 was developed on the basis of toxicities associated with aging and has the potential to affect aging, 9-month-old female and male littermate SAMP8 mice were fed with regular diet or with a diet with CAD031 (Fig. 1b). At 9 months of age, SAMP8 mice already present a strong aging phenotype (Currais et al. 2015; Morley et al. 2012; Cheng et al. 2014; Currais et al. 2012). Since women are at a higher risk than men of developing AD (Riedel et al. 2016), we used the female SAMP8 mice for the biochemical studies, while the males were allowed to age to study lifespan (Fig. 1). The effect of CAD031 in females was assessed in 13-month-old SAMP8 mice after 4 months of treatment. Age-related changes are hereafter defined by the comparison to 9-month-old SAMP8 mice. Because CAD031 extends lifespan in model organisms and reduces memory loss and AD pathology in both old symptomatic mice and young APPswe/PS1ΔE9 transgenic AD mice (Prior et al. 2016; Daugherty et al. 2017), the initial hypothesis to be tested is that a defined set of metabolic and gene transcription changes occur during the last quadrant of lifespan that are specifically affected by CAD031 and that they are related to the process of aging.
CAD031 prevents transcriptomic alterations in the brains of old SAMP8 mice
To identify the effect of CAD031 on the molecular physiology of old mice, we used an unbiased approach to examine the transcriptome of 9-month-old SAMP8 mice fed CAD031 for 4 months. Principle component analysis of hippocampal RNA expression from 9- and 13-month-old mice showed a distinct distribution between the two groups, indicating that aging has an effect on gene expression (Fig. 2a). Importantly, mice treated with CAD031 had a distribution in the two principal components closer to the 9-month-old mice, showing that drug treatment may reduce changes in gene transcription that occur with aging.
Fig. 2.

Aging of the hippocampal transcriptome in SAMP8 mice is significantly prevented by CAD031. a PCA of the top 10% most highly expressed genes in the hippocampus of 9 months, 13 months, 13 months+CAD031 SAMP8 mice. Cutoff was sum(log2(FPKM+5)) > =139 (top 10% most expressed genes; 2458 genes selected; n = 5–6/group). Ellipses show the 70% confidence interval. b Drift analysis of the whole transcriptome. Values are expressed as box-and-whisker plots. Brown-Forsythe test. n = 5–6/group. c Venn diagram illustrating shared and uniquely affected genes between the 9-month vs 13-month-old mice and 13 months vs 13 months+CAD031. n = 6/group. Correlation of gene expression is represented on the right side of the panel (units are -log(fold change)). Rev = quadrants representing changes in gene expression between the 9-month vs 13-month-old mice that were reversed by CAD031
These results were confirmed by transcriptional drift analysis, a method developed to characterize the aging process that is also based upon changes in gene expression over time in defined molecular pathways (Rangaraju et al. 2015a). Transcriptional drift is an evolutionarily conserved phenomenon in which the expression of genes changes in opposing directions within functional groups. These changes cause a transcriptome-wide loss in mRNA stoichiometry within a defined molecular pathway and loss of co-expression patterns in aging animals, as compared with young adults (Rangaraju et al. 2015a). The age-associated drift in gene expression was significantly suppressed by CAD031 during the 4-month treatment period (Fig. 2b). These data again show that CAD031 maintained a younger (9-month-old) phenotype in terms of gene expression when fed to old mice.
Four hundred eighty-five differentially expressed (DE) genes were found between 9 and 13-month-old mice and 479 DE genes between old mice and old mice fed CAD031 (Fig. 2c, Table S1). These data are presented in a Venn diagram that highlights 170 shared DE genes between 9 and 13 months and mice treated with CAD031 (Fig. 2c). These changes were then log transformed and plotted in a correlation graph, which shows that all of the DE genes that overlap between 9- and 13-month-old mice and treatment with CAD031 were prevented by CAD031 (middle set of Fig. 2c). In addition, the set of DE genes that do not overlap also exhibit age-dependent alterations in expression that follow that same pattern (Fig. 2c, far right and far left). No alterations on body weight were observed with the CAD031 diet (Fig. S1A). Altogether, these data show that CAD031 prevents transcriptional aging when fed to old SAMP8 mice.
CAD031 targets mitochondria
To determine the specific cellular processes that were impacted by CAD031, pathway analysis was done based upon the DE genes in 9- and 13-month-old mice as well as those altered by CAD031. Figure S2A shows that when 9 and 13 month are compared, the major pathways impacted are protein translation and oxidative phosphorylation, as are those affected by CAD031 (Fig. S2B). The majority of the genes in these pathways included nuclear genes that encode subunits of complexes of the mitochondrial electron transport chain that are altered by CAD031 (Fig. 3a). The same effect was seen within mitochondrial genes (Fig. 3b). Curiously, the expression of these genes went up between the ages of 9 and 13 months, and this increase was prevented by CAD031.
Fig. 3.

CAD031 maintains several parameters of mitochondrial metabolism that are altered with aging in SAMP8 mice. a Heatmap of the fold gene expression for 9 months/13 months, 13 months/13 months+CAD031, regarding the genes that are common to the KEGG pathways Parkinson’s disease, oxidative phosphorylation, Huntington’s disease, and Alzheimer’s disease. Most are associated with the mitochondrial ETC. The log2 fold-change is plotted in red–blue color scale with red indicating upregulation and blue indicating downregulation. ETC, electron transport chain complex; CI, complex I; CIII, complex III; CIV, complex IV; CV, complex V. b Heatmap of the fold gene expression for 9 months/13 months, 13 months/13 months+CAD031, regarding all genes from the mitochondrial DNA with detectable expression levels. Color key = log2FC. c Transcriptomic drift of genes that encode for all proteins known to be associated with the mitochondria (Mitocarta) and proteins associated with the ETC. Values are expressed as box-and-whisker plots. Brown-Forsythe test. n = 5–6/group. d RIPA-soluble fractions from hippocampal tissue of 9 months, 13 months, and 13 months+CAD031 SAMP8 mice were analyzed by Western blotting for the ETC markers NDUFB8 (CI), SDHB (CII), UQCRC2 (CIII), COX4 (CIV), MTCO1 (CIV), ATP5a (CV), and the mitochondrial protein VDAC. Quantifications were normalized to actin. One-way ANOVA followed by Tukey-Kramer post hoc test (n = 5/group). All data are mean ± SD
Transcriptomic drift analysis of the Mitocarta genes showed that CAD031 prevented age-associated drift of these genes as well as those associated with the electron transport chain (ETC) (Fig. 3c).
It was next asked if the transcriptional changes were reflected at the protein level. Significant changes in the related expression of proteins in the five ETC complexes were observed (Fig. 3d). When a protein from each complex was normalized to actin loading controls and then to the same protein in 9-month-old mice, there are significant changes in the expression of proteins in each complex. In all cases where there were significant changes, CAD031 maintained the proteins at the more youthful level.
It was next asked if an analysis of the effect of CAD031 on small molecule metabolism also was also related to mitochondrial function. To answer this question, we used untargeted metabolomic profiles of the cortex of CAD031 treated mice, assaying 496 small molecules (Table S2). A pathway enrichment analysis of the brain metabolites altered by CAD031 showed that the major pathway involved was associated with acylcarnitines (Fig. 4a). While the levels of acylcarnitines did not significantly change between 9 and 12 months, CAD031 significantly increased their abundance (Fig. 4b). Fatty acids, the substrate for β oxidation in mitochondria, are transported into mitochondria as (acyl) conjugates with carnitine, where the fatty acids are oxidized to produce acetyl-CoA. The acylcarnitines were also elevated by CAD031 in the plasma of the same female SAMP8 mice and in the brain and plasma of male SAMP8 and wildtype female C57Bl/6 mice (Fig. 4b). Altogether, these data show that mitochondrial physiology is severely altered with the aging SAMP8 phenotype and that CAD031 prevents those changes possibly by modulating mitochondrial metabolism.
Fig. 4.

Effects of CAD031 on brain and plasma metabolites. a Pathway enrichment analysis with cortex metabolites found altered in 13 months vs 13 months+CAD031 (Table S2). Enrichment scores were calculated as described in the Supplemental Materials and methods. Number of metabolites altered in a biological pathway and the total number of metabolites measured in that pathway (Altered/detected) are shown as a complement to the enrichment score. Fold change in the levels of different b acylcarnitines and c fatty acids in the brains and plasma of old female and male SAMP8 mice treated with CAD031 relative to old SAMP8 mice, and in wild-type female C57Bl/6 mice treated with CAD031 relative to untreated (from 10 months old for 3 months) (Table S3)(n = 6/group)
CAD031 activates the AMPK/ACC1 pathway
To understand the mechanistic roots of CAD031, network analysis was carried out by GAM integrating both the transcriptomic and the metabolomic data from the brains of SAMP8 mice. Analysis of the networks generated showed that acetyl-CoA is a central metabolite (Fig. S3A). To rule out the possibility of capturing acetyl-CoA in the network just by chance, random sampling of the transcriptomic and the metabolomics data was performed followed by network analysis, and confirmed the central role of acetyl-CoA in the experiments (random sampling p = 0.01).
To confirm the role of mitochondrial metabolism in the neuron’s response to CAD031, gene expression following a 24 h drug exposure of HT22 hippocampal nerve cells and rat primary cortical neurons was assayed, followed by GAM network analysis with the transcriptome only. In both cell types, acetyl-CoA was identified as a central metabolite regulated by CAD031 (Fig. S3B and C). The amount of acetyl-CoA activity was measured in these cells, and there was an increase in both with CAD031 after 24 h (Fig. 5 a and b).
Fig. 5.
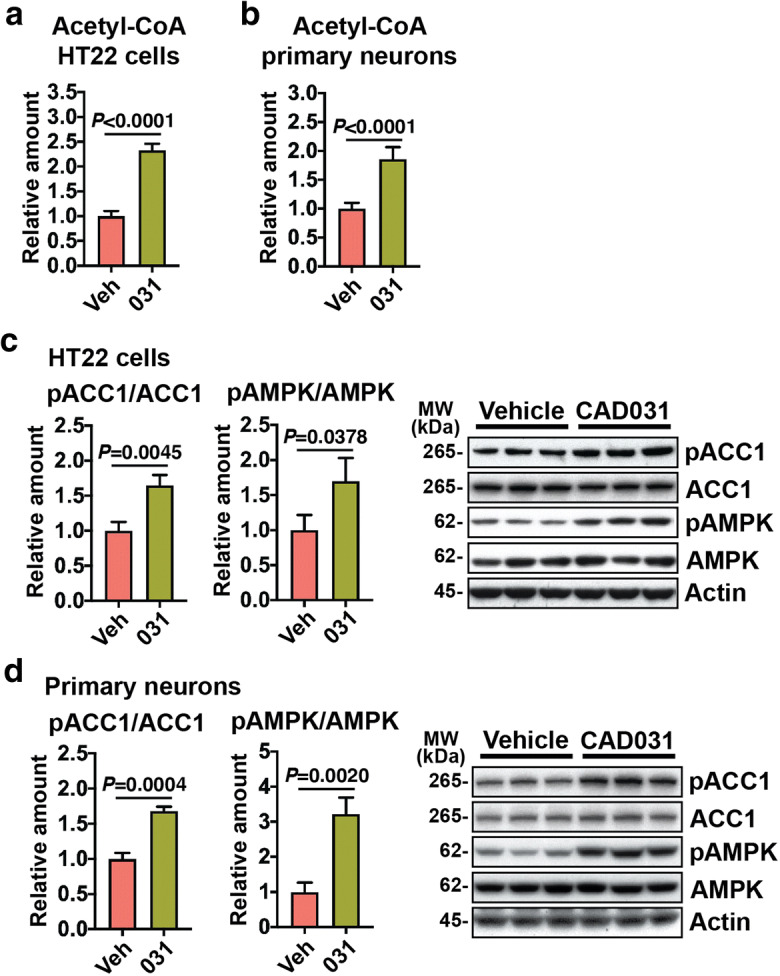
CD031 modulates acetyl-CoA metabolism via activation of the AMPK/ACC1 pathway. Total levels of acetyl-CoA in a HT22 nerve cells and b rat primary neurons treated with 1 μM of CAD031 for 24 h. One-way ANOVA followed by Tukey-Kramer post hoc test (n = 5/group). Phosphorylation of ACC1 and AMPK was assessed by Western blotting and normalized to levels of respective total protein in c HT22 nerve cells and d rat primary neurons treated with 1 μM of CAD031 for 4 h. One-way ANOVA followed by Tukey-Kramer post hoc test (n = 5/group)
We have recently demonstrated that J147 and CMS121 share a mechanism of action associated with increases in acetyl-CoA levels via the activation by phosphorylation of 5′ AMP-activated protein kinase (AMPK) and consequent inhibition by phosphorylation of acetyl-CoA carboxylase 1 (ACC1) (Currais et al. 2019). The flux of acetyl-CoA through ACC1 to malonyl-CoA is a major mechanism of acetyl-CoA catabolism and lipid biosynthesis, and inhibition of ACC1 leads to a buildup in acetyl-CoA (Currais et al. 2019). Similar to J147 and CMS121, CAD031 activated AMPK and inhibited ACC1 in both HT22 nerve cells as well as primary neurons (Fig. 5 c and d).
In addition, inhibition of ACC1 by CAD031 was accompanied by a decrease in free fatty acids in the brains and plasma of SAMP8 mice as well as wild-type C57Bl/6 mice (Fig. 4c). Thus, inhibition of ACC1 via AMPK activation can explain the increases in acetyl-CoA levels seen with CAD031.
CAD031 is a geroneuroprotector
Geroprotectors have been defined as compounds that slow the rate of aging and extend lifespan in model organisms (Moskalev et al. 2017). In doing so, they may reduce the incidence of old age-associated diseases such as AD. Using a drug discovery platform based upon phenotypic screening assays that recapitulate the toxicities associated with the aging brain, we have identified or synthesized a number of geroprotectors (Schubert et al. 2018). Because most defined geroprotectors are not brain penetrant, we have defined those that are neuroprotective and do get into the brain as geroneuroprotectors (GNPs). Since the initial criterion of a geroprotector is that it can extend lifespans of model organisms, we assayed this property in SAMP8 mice. Figure 6 shows that CAD031 increased the median lifespan of SAMP8 mice in 3.5 months (28%), without any effect on maximum lifespan. No alterations on body weight were observed with the CAD031 diet (Fig. S1B). Therefore, CAD031 is a bona fide GNP in that it extends median lifespan and reduces molecular aspects of aging when fed to very old mice.
Fig. 6.
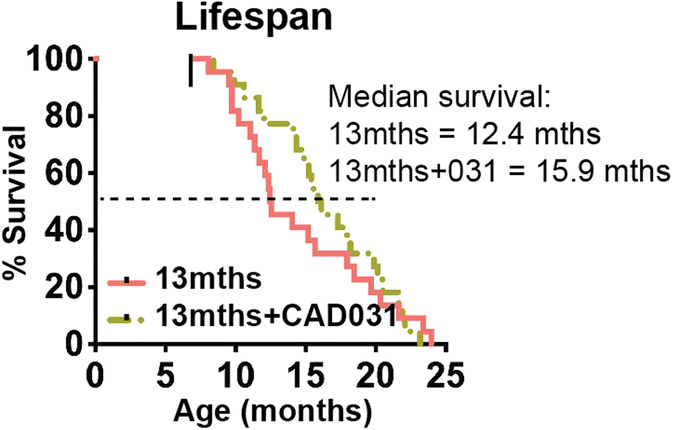
CAD031 extends median lifespan when fed to old SAMP8 mice. CAD031 was fed to male SAMP8 mice starting at 9 months of age. There was an increase of median lifespan by 3.5 months (28%) (n = 22/group)
Discussion
It is shown here that through the use of a compound that was developed on the basis of phenotypic screens that reflect toxicities associated with the aging brain and efficacy in mouse models of AD, it is possible to identify molecular pathways specifically associated with the aging phenotype that may be relevant to both aging and age-associated disease. Our data show that there are significant changes in brain gene expression and small molecule metabolism between 9 and 13 months of age in the hippocampus of SAMP8 mice that have a median lifespan of only 14 months. PCA analysis of the top 10% of expressed genes showed that the gene expression was more similar to the 9-month-old than the 13-month-old mice when the AD drug candidate CAD031 was fed to the mice. Pathway analysis indicated that most of the transcriptional changes associated with aging are mitochondrial, and that CAD031 maintains the expression of these genes at the level of the more youthful age. Metabolite analysis confirmed the gene expression data, showing that most significant changes modulated by CAD031 are associated with fatty acid metabolism that takes place in mitochondria. Finally, when CAD031 was fed to mice starting at 9 months of age, median lifespan was increased 28%.
Aging is the greatest risk factor for a variety of diseases and conditions such as AD and stroke. The expression of many mitochondrial genes is altered with age, and mutations in some of these genes can cause a variety of human mitochondrial diseases and are also implicated in age-associated disease (Park & Larsson 2011; Mustafa et al. 2020; Li et al. 2020). A decrease in mitochondrial function is universally associated with aging (Lopez-Otin et al. 2013), and more seriously effected in AD and other dementias (Currais et al. 2015) (Swerdlow et al. 2014; Yin et al. 2016). However, the maintenance of mitochondrial function has not been a target of AD drug discovery, which has largely focused on the amyloid pathway. In contrast, CAD031 was selected on the basis of old age-associated nerve cell toxicities, most of which associated with mitochondrial dysfunction (Prior et al. 2016). These involve oxidative stress (mitochondrial ROS production), ischemia (ATP loss), and inflammation (frequently a mitochondrial-mediated event). Therefore, it is not unexpected that the examination of the effect of CAD031 in aging mice finds that the maintenance of mitochondrial health is the primary affected pathway.
The conclusion is supported by a number of observations. RNAseq data followed by both KEGG pathway and transcriptional drift analyses show that mitochondrial gene expression is maintained in the more youthful state of 9-month-old mice by CAD031 when assayed at 13 months. Significant changes in the expression of several ETC proteins were also observed between 9 and 13 months, and again expressed as levels of 9-month-old mice following drug treatment. Acylcarnitines were elevated by CAD031. These compounds transport fatty acids into mitochondria where the fatty acid moiety is the substrate for β oxidation and energy production.
Genome-wide analysis of multiple species of animals shows that there are consistent patterns in changes in gene expression that occur within aging, and the top four of those are associated with the failure of mitochondrial maintenance over the lifetime of the animal (Yang et al. 2015; de Magalhaes et al. 2009). The first is the downregulation of mitochondrial genes. This could be associated with decreased mitochondria turnover, fewer mitochondria, or increased efficiency or stability of mitochondrial RNA. The second is increased inflammation that can be initiated by mitochondria. For example, mitochondrial DNA activates toll-like receptors and mitochondria produce ROS and formyl-peptide; both are pro-inflammatory. The third is ROS-dependent oxidative stress, and finally proteotoxicity.
In SAMP8 mice mitochondrial gene expression increases between 9 and 13 months of age, and CAD031 decreases their expression to the more youthful level. This result is the opposite of that predicted from the literature, where mitochondrial gene expression generally decreases with age (Swerdlow et al. 2014). A likely explanation is that the upregulation of these genes is a protective response to proteins that are being damaged and in need replacing in the older animals, while CAD031 stabilizes mitochondria and reduces the need for protein replacement. This conclusion is supported by the observation that the expression of ETC proteins changed with age, and CAD031 returned expression levels to that of 9-month-old animals. In contrast to most published material, our data are based upon a comparison within the last quadrant of lifespan in which the physiological parameters are quite different from either overall lifespan or AD vs. age matched controls. In the context of aging and drug discovery, the most critical factor is that CAD031 made both mitochondrial gene expression and ETC protein composition look younger. This is exceptionally important because deficits in mitochondrial metabolism are thought to play a key role in the cognitive dysfunction of AD patients.
Acetyl-CoA is a key metabolite that bridges glycolysis, fatty acid β-oxidation, fatty acid synthesis and the TCA cycle in the mitochondria. Its metabolism in the TCA cycle generates reducing potential that is used by the ETC. The increases in acetyl-CoA that we observed with CAD031 can be derived from several sources, including the acylcarnitines and the inhibition of ACC1 via its phosphorylation by AMPK. The availability of acetyl-CoA in the mitochondria for energy metabolism upon treatment with CAD031 may be responsible for the improvement in mitochondrial health as well as in other parameters of aging.
We have recently reported that two AD drug candidates, J147 and CMS121, also modulate acetyl-CoA metabolism and prevent mitochondrial deterioration with aging by activation of the AMPK/ACC1 pathway (Currais et al. 2019). We are working on the identification of the molecular target of CMS121, but we have already found that J147 targets the alpha subunit of ATP synthase, engaging a neuroprotective response via AMPK activation and also the inhibition of ACC1 (Goldberg et al., 2018). Since CAD031 is a derivative of J147, it is possible that it also targets the ATP synthase. Nonetheless, it is remarkable that CMS121, J147 and CAD031 all activate mechanisms that overlap at the level of mitochondrial metabolism, leading to the same phenotypic outcome in both AD transgenic and SAMP8 mice. This could be explained by the fact that the same cell-based screening platform was used to identify the three compounds. In fact, some of these assays are characterized by mitochondrial dysfunction (Prior et al. 2014). Importantly, the decreases in fatty acids in the blood plasma detected with the three compounds could serve as a biomarker for target engagement of the compounds in vivo.
In conclusion, using the AD drug candidate CAD031 in a chemical biology approach to identify molecular pathways associated with aging and disease, it is shown that the loss of brain mitochondrial homeostasis plays a primary role in brain aging. The underlying aging pathway identified by the use of CAD031 appears to be driven by the reduced activity of AMPK/ACC1. This is the same pathway that is engaged by the two structurally distinct AD drug candidates CMS121 and J147. Because mitochondrial dysfunction in this pathway is a hallmark of both old age and AD, our data support the search for geroneuroprotector drug candidates that preserve mitochondrial homeostasis and prevent the metabolic deficits in AD patients that occur with aging.
Methods
Study design
Nine-month-old female and male SAMP8 mice were fed with regular diet (LabDiet 5015, TestDiet, Richmond, IN) or were fed with CAD031 (CAD031 premixed in LabDiet by the company). At 9 months of age, SAMP8 mice already present a strong aging phenotype (Currais et al. 2015; Currais et al. 2012; Takeda 2009). The dose of CAD031 used was 200 ppm (~ 10 mg/kg/day), which previously was therapeutically effective in a transgenic mouse model of FAD (Prior et al. 2016; Daugherty et al. 2017). While the male mice were allowed to age in order to assess the effects of CAD031 on lifespan, the female SAMP8 mice were used for biochemical studies (Fig. 1). In the latter case, diet treatment lasted for 4 months until mice reached 13 months of age, when the mice were sacrificed for gene expression, small molecule metabolite and protein expression analysis. Any age-related changes are therefore defined by the comparison to 9-month-old SAMP8 mice. All mice were randomly assigned to experimental groups. A total of 12 female SAMP8 mice per group and 22 male SAMP8 mice per group were used. In addition, 6 wild-type female C57Bl/6 mice per group were used to assess the effects of CAD031 (from 10 to 13 months old) on brain and plasma metabolites. The number of mice per group was determined based on previous experiments (Currais et al. 2015; Currais et al. 2012) and was sufficient to attain statistical power for the metabolic and RNAseq studies.
Mice
The SAMP8 line was acquired from Harlan Laboratories (UK). Mouse body weights were measured regularly and no significant differences were found between the groups (Fig. S1). C57Bl/6 mice were purchased from the Jackson Laboratory. All experiments were performed in accordance with the US Public Health Service Guide for Care and Use of Laboratory Animals and protocols approved by the IACUC at the Salk Institute.
Tissue preparation
Mice were anesthetized with chloral hydrate (i.p. 350 mg/kg) and their blood collected by cardiac puncture into heparin-coated tubes. Blood plasma was isolated by centrifugation for 10 min at 2000 g. After perfusing with phosphate buffered saline (PBS), their brains were removed and dissected to collect cortex and hippocampus. Tissues were snap-frozen in liquid nitrogen, stored at − 80 °C and later prepared for Western blotting (WB), RNA extraction and metabolomic analysis as detailed below.
Cell culture
Primary cortical neurons were prepared from day 17 Sprague-Dawley rat embryos and used at 7 days in vitro (7 DIV) (Soucek et al. 2003). Cells were maintained in Neurobasal media supplemented with B27 (Invitrogen, Carlsbad, CA, USA). A total of 5 rats were used for this study. Mouse hippocampal HT22 cells (Davis & Maher 1994) were grown in high-glucose Dulbecco’s modified Eagle’s medium (DMEM) (Invitrogen, Carlsbad, CA, USA) supplemented with 10% fetal calf serum (FCS) (Hyclone, Logan, UT, USA).
Western blotting
Tissue or cell samples were homogenized in 10 volumes of RIPA lysis buffer (50 mM Tris, pH 7.5, 150 mM NaCl, 0.1% sodium dodecyl sulfate, 0.5% deoxycholate, and 1% NP40) containing a cocktail of protease and phosphatase inhibitors. Samples were sonicated (2 × 10 s) and centrifuged at > 20,000 g for 20 min at 4 °C. Protein concentrations in the cell extracts were determined using the BCA protein assay (Pierce, Rockford, IL, USA). For SDS-PAGE, 20 μg of protein was used. Western blots were carried out as described previously (Currais et al. 2015). Briefly, all samples were separated using 12% Criterion XT Precast Bis-Tris Gels (Bio-Rad, Hercules, CA, USA). Proteins were transferred to nitrocellulose membranes and the quality of protein measurement, electrophoresis and transfer checked by staining with Ponceau S (Sigma- Aldrich, St. Louis, MO, USA). Membranes were blocked with 5% skim milk in TBS-T (20 mM Tris buffer pH 7.5, 0.5 M NaCl, 0.1% Tween 20) for 1 h at room temperature and incubated overnight at 4 °C in the primary antibody diluted in 5% BSA in TBS/0.05% Tween 20. The primary antibodies HRP-conjugated rabbit anti-actin (#5125, 1/20,000), phospho-ACC1 (#3661, 1/2000), total ACC1 (#4190, 1/1000), phospho-AMPK (#2535, 1/ 1000), total AMPK (#2793, 1/1000), COX4 (#11967, 1/2000), and VDAC-1 (#4866, 1/2000) were from Cell Signaling Technology. Total OXPHOS (NDUFB8, SDHB, UQCRC2, MTCO1 and ATP5a, #110413, 1/1000) was from Abcam. Horseradish peroxidase-conjugated secondary’s goat anti-rabbit, goat anti-mouse or rabbit anti-goat (Biorad) diluted 1/5000 were also used.
Whole transcriptome analysis
RNA was isolated from tissues or cells using the RNeasy Plus Universal mini kit (Qiagen), according to the manufacturer’s protocol. Total RNA was quantified by Qubit Fluorometer and RNA integrity was assessed by Agilent TapeStation system. RNA-Seq libraries were prepared with 500 ng of RNA using the Illumina TruSeq Stranded mRNA Sample Prep Kit according to the manufacturer’s instructions. Briefly, poly-A RNA was selected using poly dT-beads. mRNA was then fragmented and reverse transcribed. cDNA was end-repaired, adenylated and ligated with Illumina adapters with indexes. Adapter-ligated cDNA was then amplified. Libraries were pooled and sequenced single-end 50 base-pair (bp) on the Illumina HiSeq 2500 platform. Sequencing reads were mapped to the mm10 mouse genome or rn6 rat genome using the spliced aligner STAR (2.5.1b) with default parameters (Dobin et al. 2013). Only uniquely aligned reads were considered for downstream analysis. Expression values were quantified using Homer (4.9.1, PMID: 20513432) by counting reads mapped across all gene exons of RefSeq genes and mitochondrial-encoded genes. The differential expression (DE) analysis was performed by edgeR (v3.16.1, (https://www.ncbi.nlm.nih.gov/pmc/articles/PMC3378882/) (McCarthy et al. 2012). Briefly, genes with counts per million greater than 1 for at least half of the samples were normalized by the default “TMM” method. The dispersion was estimated by the “estimateGLMTagwiseDisp” function. Genes with a false discovery rate (FDR) < 0.05 and an absolute log2 fold-change > 0.3 (about 1.23 fold-change) were identified as significantly differentially expressed. The data discussed in this publication have been deposited in NCBI’s Gene Expression Omnibus (Edgar et al. 2002) and are accessible through GEO Series accession number GSE108776.
Large-scale metabolome analysis
Sample preparation, metabolite measurement and analysis were conducted by Metabolon as previously done (Currais et al. 2015).
Transcriptome drift analysis
Transcriptional drift analysis was performed as previously described with the exception that we removed expressed genes below the 20th percentile. We further normalized all samples setting the overall mean transcriptional drift to 0 to avoid differences in sample counts that affect drift variance across samples (Rangaraju et al. 2015b).
Metabolic assays
Acetyl-CoA levels were determined in protein-free lysates of rat primary neurons or HT22 cells treated as indicated in the figure legends using a kit from Sigma (MAK039) according to the manufacturer’s instructions. The levels were normalized to the protein in the solubilized pellet using the BCA assay.
Bioinformatics and statistics
R package “gplots” (Warnes et al. 2016) was used to generate the heatmaps and MSEAs (Warnes et al. 2016). For the RNA and metabolic heatmaps, all values were mean-centered and divided by the SD of each variable (scaled Z-score). The heatmaps of RNA-Seq were z-scaled log2(FPKM+5). Hierarchical clustering of RNA expression was performed using Euclidean distances and the Ward2 algorithm. K-means clustering of RNA expression was performed using Euclidean distances on z-scaled log2(FPKM+5) of 20,261 expressed genes (at least one sample had greater than 0 FPKM).
PCA of the transcriptome data was performed on the log2(FPKM+5) values of the top 10% most expressed genes (cutoff: sum(log2(FPKM+5)) > =139; 2458 genes selected) by the R base function “prcomp” with data mean centered. The top 10% most expressed genes were used in order to reduce the noise due to sampling error. The ellipses showed the 70% confidence interval of a multivariate t-distribution of sample groups estimated by PC1 and PC2 data.
Pathway enrichment test of the transcriptome data was analyzed by DAVID Bioinformatics Resources v6.8 (Huang et al. 2009a; Huang et al. 2009b). The total number of expressed genes of each individual pair-wise comparisons was used as background for the enrichment test. The total number of genes on the mm10 genome was used as background when characterizing the 325 DE genes shared by 13 months Vs 13 months + CAD031 and 13 months Vs 13 months + CMS121.
Pathway enrichment analysis on metabolic pathways was conducted using the MetaboLync™ platform (Metabolon). Enrichment scores = (number of significant metabolites in pathway/total number of detected metabolites in pathway)/(total number of significant metabolites/total number of detected metabolites).
The metabolic network was reconstructed by GAM (Sergushichev et al. 2016) with input of the metabolome and/or the transcriptome dataset(s) and visualized by Cytoscape (Sergushichev et al. 2016; Shannon et al. 2003).
Random sampling: The dataset that contained the test statistics (p value and fold-change) between 13 months + CAD031 and 13 months was used for random sampling experiment. The Gene IDs and the Compound IDs were randomly shuffled 10 times (sampling without replacement) followed by the network analysis using the same parameters and cutoffs. The probability of observing acetyl-CoA in the resulted network was calculated as pnull. Random sampling p = pnull^na*(1-pnull)^nb (na = number of experiments that identified acetyl-CoA in the network; nb = number of experiments that did not identify acetyl-CoA in the network). In this experiment, pnull = 0.1 and random sampling p = 0.1^3. For the rat primary neuron transcriptome data, random sampling was performed using the same method with data generated from the comparison between CAD031 and control.
GraphPad Prism 6 was used for statistical analysis and exact P values are indicated (for P < 0.050).
Electronic supplementary material
Body weights. Body weights of (A) female SAMP8 mice (n = 12/group) and (B) male SAMP8 mice (n = 22/group) fed with control or CAD031 diets. (JPG 196 kb)
KEGG pathway analysis. Top KEGG pathways and respective enrichment scores associated with the (A) 485 genes with altered expression in 9 months vs 13 months SAMP8 mice and the (B) 479 genes with altered expression in 13 months vs 13 months old mice plus CAD031. (JPG 440 kb)
GAM network analysis. (A) Network analysis was carried out integrating both the transcriptomic and the metabolomic data obtained from the brains of 13 months vs 13 months+CAD031 SAMP8 mice. Nodes represent the metabolites; links represent the genes that encode the corresponding enzymes of the reactions (solid line) or trans-reaction (dashed line). Larger nodes represent lower p values. Red color indicates upregulation; green color indicates downregulation; blue color indicates missing data. Network analysis was also carried out with the whole transcriptomic data obtained from (B) HT22 nerve cells and (C) rat primary neurons treated with 1 μM of CAD031 for 24 h. Circles represent the metabolites and squares represent the genes that encode the corresponding enzymes of the reactions. Acetyl-CoA is identified in all graphs with a red circle. (JPG 765 kb)
List of the DE genes found in 9 vs 13 months old SAMP8 mice and 13 months vs 13 months+CAD031 female SAMP8 mice. (XLSX 271 kb)
List of all 496 metabolites quantified in the brain cortex of 9 months, 13 months and 13 months + CAD031 female SAMP8 mice. Fold changes and specific P values are indicated. One-way ANOVA (n = 6/group). (XLSX 66 kb)
List of acylcarnitines and fatty acids in the brain and plasma of male SAMP8 and female C57Bl6 mice. (XLSX 38 kb)
Acknowledgments
We thank Joseph Chambers, Maria Encizo, and Karen Suter for help with breeding and husbandry of mice.
Author contributions
Antonio Currais, conceptualization, data curation, formal analysis, supervision, investigation, methodology, writing-original draft, project administration, writing-review and editing; Ling Huang, data curation, formal analysis, validation, investigation, methodology, writing-review and editing; Michael Petrascheck, data curation, formal analysis, methodology, writing-review and editing; Pamela Maher, conceptualization, formal analysis, validation, investigation, writing-review and editing; David Schubert, conceptualization, supervision, writing-review and editing.
Funding information
This work was supported by the Shiley-Marcos Alzheimer’s Disease Research Center at University of California San Diego (AC), and grants from the NIH (RF1 AG054714) and the California Institute of Regenerative Medicine to PM and DS. The Razavi Newman Integrative Genomics and Bioinformatics Core Facility of the Salk Institute is funded by NIH-NCI CCSG: P30 014195, and the Helmsley Trust.
Compliance with ethical standards
Conflict of interest
The Salk Institute holds the patent for CAD031.
Footnotes
Publisher’s note
Springer Nature remains neutral with regard to jurisdictional claims in published maps and institutional affiliations.
Contributor Information
Antonio Currais, Email: acurrais@salk.edu.
David Schubert, Email: schubert@salk.edu.
References
- Chen Q, Prior M, Dargusch R, Roberts A, Riek R, Eichmann C, Chiruta C, Akaishi T, Abe K, Maher P, Schubert D. A novel neurotrophic drug for cognitive enhancement and Alzheimer's disease. PLoS One. 2011;6(12):e27865. doi: 10.1371/journal.pone.0027865. [DOI] [PMC free article] [PubMed] [Google Scholar]
- Cheng XR, Zhou WX, Zhang YX. The behavioral, pathological and therapeutic features of the senescence-accelerated mouse prone 8 strain as an Alzheimer’s disease animal model. Ageing Res Rev. 2014;13:13–37. doi: 10.1016/j.arr.2013.10.002. [DOI] [PubMed] [Google Scholar]
- Chiruta C, Schubert D, Dargusch R, Maher P. Chemical modification of the multitarget neuroprotective compound fisetin. J Med Chem. 2012;55(1):378–389. doi: 10.1021/jm2012563. [DOI] [PMC free article] [PubMed] [Google Scholar]
- Currais A, Prior M, Lo D, Jolivalt C, Schubert D, Maher P. Diabetes exacerbates amyloid and neurovascular pathology in aging-accelerated mice. Aging Cell. 2012;11(6):1017–1026. doi: 10.1111/acel.12002. [DOI] [PMC free article] [PubMed] [Google Scholar]
- Currais A, Goldberg J, Farrokhi C, Chang M, Prior M, Dargusch R, Daugherty D, Armando A, Quehenberger O, Maher P, Schubert D. A comprehensive multiomics approach toward understanding the relationship between aging and dementia. Aging (Albany NY) 2015;7(11):937–955. doi: 10.18632/aging.100838. [DOI] [PMC free article] [PubMed] [Google Scholar]
- Currais A, Farrokhi C, Dargusch R, Armando A, Quehenberger O, Schubert D, Maher P. Fisetin reduces the impact of aging on behavior and physiology in the rapidly aging SAMP8 mouse. J Gerontol A Biol Sci Med Sci. 2018;73(3):299–307. doi: 10.1093/gerona/glx104. [DOI] [PMC free article] [PubMed] [Google Scholar]
- Currais, A., et al., Elevating acetyl-CoA levels reduces aspects of brain aging. E-Life, 2019. 8: p. pii: 47866. 10.7554/eLife.47866. [Epub ahead of print]. [DOI] [PMC free article] [PubMed]
- Daugherty D, Goldberg J, Fischer W, Dargusch R, Maher P, Schubert D. A novel Alzheimer’s disease drug candidate targeting inflammation and fatty acid metabolism. Alzheimers Res Ther. 2017;9(1):50. doi: 10.1186/s13195-017-0277-3. [DOI] [PMC free article] [PubMed] [Google Scholar]
- Davis JB, Maher P. Protein kinase C activation inhibits glutamate-induced cytotoxicity in a neuronal cell line. Brain Res. 1994;652(1):169–173. doi: 10.1016/0006-8993(94)90334-4. [DOI] [PubMed] [Google Scholar]
- de Magalhaes JP, Curado J, Church GM. Meta-analysis of age-related gene expression profiles identifies common signatures of aging. Bioinformatics. 2009;25(7):875–881. doi: 10.1093/bioinformatics/btp073. [DOI] [PMC free article] [PubMed] [Google Scholar]
- Dobin A, Davis CA, Schlesinger F, Drenkow J, Zaleski C, Jha S, Batut P, Chaisson M, Gingeras TR. STAR: ultrafast universal RNA-seq aligner. Bioinformatics. 2013;29(1):15–21. doi: 10.1093/bioinformatics/bts635. [DOI] [PMC free article] [PubMed] [Google Scholar]
- Edgar R, Domrachev M, Lash AE. Gene expression omnibus: NCBI gene expression and hybridization array data repository. Nucleic Acids Res. 2002;30(1):207–210. doi: 10.1093/nar/30.1.207. [DOI] [PMC free article] [PubMed] [Google Scholar]
- Goldberg J, et al. The mitochondrial ATP synthase is a shared drug target among aging and dementia. Aging Cell. 2018;2:e12715. doi: 10.1111/acel.12715. [DOI] [PMC free article] [PubMed] [Google Scholar]
- Huang d W, Sherman BT, Lempicki RA. Systematic and integrative analysis of large gene lists using DAVID bioinformatics resources. Nat Protoc. 2009;4(1):44–57. doi: 10.1038/nprot.2008.211. [DOI] [PubMed] [Google Scholar]
- Huang d W, Sherman BT, Lempicki RA. Bioinformatics enrichment tools: paths toward the comprehensive functional analysis of large gene lists. Nucleic Acids Res. 2009;37(1):1–13. doi: 10.1093/nar/gkn923. [DOI] [PMC free article] [PubMed] [Google Scholar]
- Li H, Slone J, Huang T. The role of mitochondrial-related nuclear genes in age-related common disease. Mitochondrion. 2020;53:38–47. doi: 10.1016/j.mito.2020.04.012. [DOI] [PubMed] [Google Scholar]
- Lopez-Otin C, et al. The hallmarks of aging. Cell. 2013;153(6):1194–1217. doi: 10.1016/j.cell.2013.05.039. [DOI] [PMC free article] [PubMed] [Google Scholar]
- McCarthy DJ, Chen Y, Smyth GK. Differential expression analysis of multifactor RNA-Seq experiments with respect to biological variation. Nucleic Acids Res. 2012;40(10):4288–4297. doi: 10.1093/nar/gks042. [DOI] [PMC free article] [PubMed] [Google Scholar]
- Morley JE, Armbrecht HJ, Farr SA, Kumar VB. The senescence accelerated mouse (SAMP8) as a model for oxidative stress and Alzheimer’s disease. Biochim Biophys Acta. 2012;1822(5):650–656. doi: 10.1016/j.bbadis.2011.11.015. [DOI] [PubMed] [Google Scholar]
- Moskalev A, Chernyagina E, Kudryavtseva A, Shaposhnikov M. Geroprotectors: a unified concept and screening approaches. Aging Dis. 2017;8(3):354–363. doi: 10.14336/AD.2016.1022. [DOI] [PMC free article] [PubMed] [Google Scholar]
- Mustafa, M.F., et al., Pathogenic mitochondria DNA mutations: current detection tools and interventions. Genes (Basel), 2020. 11(2). [DOI] [PMC free article] [PubMed]
- Park CB, Larsson NG. Mitochondrial DNA mutations in disease and aging. J Cell Biol. 2011;193(5):809–818. doi: 10.1083/jcb.201010024. [DOI] [PMC free article] [PubMed] [Google Scholar]
- Prior M, Chiruta C, Currais A, Goldberg J, Ramsey J, Dargusch R, Maher PA, Schubert D. Back to the future with phenotypic screening. ACS Chem Neurosci. 2014;5(7):503–513. doi: 10.1021/cn500051h. [DOI] [PMC free article] [PubMed] [Google Scholar]
- Prior M, Goldberg J, Chiruta C, Farrokhi C, Kopynets M, Roberts AJ, Schubert D. Selecting for neurogenic potential as an alternative for Alzheimer’s disease drug discovery. Alzheimers Dement. 2016;12(6):678–686. doi: 10.1016/j.jalz.2016.03.016. [DOI] [PMC free article] [PubMed] [Google Scholar]
- Rangaraju S, et al. Suppression of transcriptional drift extends C. elegans lifespan by postponing the onset of mortality. Elife. 2015a;4. [DOI] [PMC free article] [PubMed]
- Rangaraju S, Solis GM, Thompson RC, Gomez-Amaro RL, Kurian L, Encalada SE, Niculescu AB, III, Salomon DR, Petrascheck M. Suppression of transcriptional drift extends C. elegans lifespan by postponing the onset of mortality. Elife. 2015;4:e08833. doi: 10.7554/eLife.08833. [DOI] [PMC free article] [PubMed] [Google Scholar]
- Riedel BC, Thompson PM, Brinton RD. Age, APOE and sex: triad of risk of Alzheimer’s disease. J Steroid Biochem Mol Biol. 2016;160:134–147. doi: 10.1016/j.jsbmb.2016.03.012. [DOI] [PMC free article] [PubMed] [Google Scholar]
- Rocca WA, Petersen RC, Knopman DS, Hebert LE, Evans DA, Hall KS, Gao S, Unverzagt FW, Langa KM, Larson EB, White LR. Trends in the incidence and prevalence of Alzheimer’s disease, dementia, and cognitive impairment in the United States. Alzheimers Dement. 2011;7(1):80–93. doi: 10.1016/j.jalz.2010.11.002. [DOI] [PMC free article] [PubMed] [Google Scholar]
- Schubert D, Currais A, Goldberg J, Finley K, Petrascheck M, Maher P. Geroneuroprotectors: effective geroprotectors for the brain. Trends Pharmacol Sci. 2018;39(12):1004–1007. doi: 10.1016/j.tips.2018.09.008. [DOI] [PMC free article] [PubMed] [Google Scholar]
- Sergushichev AA, Loboda AA, Jha AK, Vincent EE, Driggers EM, Jones RG, Pearce EJ, Artyomov MN. GAM: a web-service for integrated transcriptional and metabolic network analysis. Nucleic Acids Res. 2016;44(W1):W194–W200. doi: 10.1093/nar/gkw266. [DOI] [PMC free article] [PubMed] [Google Scholar]
- Shannon P, Markiel A, Ozier O, Baliga NS, Wang JT, Ramage D, Amin N, Schwikowski B, Ideker T. Cytoscape: a software environment for integrated models of biomolecular interaction networks. Genome Res. 2003;13(11):2498–2504. doi: 10.1101/gr.1239303. [DOI] [PMC free article] [PubMed] [Google Scholar]
- Soucek T, Cumming R, Dargusch R, Maher P, Schubert D. The regulation of glucose metabolism by HIF-1 mediates a neuroprotective response to amyloid beta peptide. Neuron. 2003;39(1):43–56. doi: 10.1016/S0896-6273(03)00367-2. [DOI] [PubMed] [Google Scholar]
- Swerdlow RH, Burns JM, Khan SM. The Alzheimer’s disease mitochondrial cascade hypothesis: progress and perspectives. Biochim Biophys Acta. 2014;1842(8):1219–1231. doi: 10.1016/j.bbadis.2013.09.010. [DOI] [PMC free article] [PubMed] [Google Scholar]
- Takeda T. Senescence-accelerated mouse (SAM) with special references to neurodegeneration models, SAMP8 and SAMP10 mice. Neurochem Res. 2009;34(4):639–659. doi: 10.1007/s11064-009-9922-y. [DOI] [PubMed] [Google Scholar]
- Warnes, G.R., et al. gplots: various SR programming tools for plotting data. (Version 3.0.1)https://CRAN.R-project.org/package=gplots 2016 [cited 2018 Nov 20]; Available from: Please use the canonical form https://CRAN.R-project.org/package=gplots to link to this page.
- Yang J, et al. Synchronized age-related gene expression changes across multiple tissues in human and the link to complex diseases. Sci Rep. 2015;5:15145. doi: 10.1038/srep15145. [DOI] [PMC free article] [PubMed] [Google Scholar]
- Yin F, Sancheti H, Liu Z, Cadenas E. Mitochondrial function in ageing: coordination with signalling and transcriptional pathways. J Physiol. 2016;594:2025–2042. doi: 10.1113/JP270541. [DOI] [PMC free article] [PubMed] [Google Scholar]
- Yousefzadeh MJ, Zhu Y, McGowan SJ, Angelini L, Fuhrmann-Stroissnigg H, Xu M, Ling YY, Melos KI, Pirtskhalava T, Inman CL, McGuckian C, Wade EA, Kato JI, Grassi D, Wentworth M, Burd CE, Arriaga EA, Ladiges WL, Tchkonia T, Kirkland JL, Robbins PD, Niedernhofer LJ. Fisetin is a senotherapeutic that extends health and lifespan. EBioMedicine. 2018;36:18–28. doi: 10.1016/j.ebiom.2018.09.015. [DOI] [PMC free article] [PubMed] [Google Scholar]
Associated Data
This section collects any data citations, data availability statements, or supplementary materials included in this article.
Supplementary Materials
Body weights. Body weights of (A) female SAMP8 mice (n = 12/group) and (B) male SAMP8 mice (n = 22/group) fed with control or CAD031 diets. (JPG 196 kb)
KEGG pathway analysis. Top KEGG pathways and respective enrichment scores associated with the (A) 485 genes with altered expression in 9 months vs 13 months SAMP8 mice and the (B) 479 genes with altered expression in 13 months vs 13 months old mice plus CAD031. (JPG 440 kb)
GAM network analysis. (A) Network analysis was carried out integrating both the transcriptomic and the metabolomic data obtained from the brains of 13 months vs 13 months+CAD031 SAMP8 mice. Nodes represent the metabolites; links represent the genes that encode the corresponding enzymes of the reactions (solid line) or trans-reaction (dashed line). Larger nodes represent lower p values. Red color indicates upregulation; green color indicates downregulation; blue color indicates missing data. Network analysis was also carried out with the whole transcriptomic data obtained from (B) HT22 nerve cells and (C) rat primary neurons treated with 1 μM of CAD031 for 24 h. Circles represent the metabolites and squares represent the genes that encode the corresponding enzymes of the reactions. Acetyl-CoA is identified in all graphs with a red circle. (JPG 765 kb)
List of the DE genes found in 9 vs 13 months old SAMP8 mice and 13 months vs 13 months+CAD031 female SAMP8 mice. (XLSX 271 kb)
List of all 496 metabolites quantified in the brain cortex of 9 months, 13 months and 13 months + CAD031 female SAMP8 mice. Fold changes and specific P values are indicated. One-way ANOVA (n = 6/group). (XLSX 66 kb)
List of acylcarnitines and fatty acids in the brain and plasma of male SAMP8 and female C57Bl6 mice. (XLSX 38 kb)