

Summary
Enhancers harbor binding motifs that recruit transcription factors (TFs) for gene activation. While cooperative binding of TFs at enhancers is known to be critical for transcriptional activation of a handful of developmental enhancers, the extent of TF cooperativity genome-wide is unknown. Here, we couple high-resolution nuclease footprinting with single-molecule methylation profiling to characterize TF cooperativity at active enhancers in the Drosophila genome. Enrichment of short MNase-protected DNA segments indicates that the majority of enhancers harbor two or more TF binding sites, and we uncover protected fragments that correspond to co-bound sites in thousands of enhancers. From the analysis of co-binding, we find that cooperativity dominates TF binding in vivo at a majority of active enhancers. Cooperativity is highest between sites spaced 50 bp apart, indicating that cooperativity occurs without apparent protein-protein interactions. Our findings suggest nucleosomes promoting cooperativity because co-binding may effectively clear nucleosomes and promote enhancer function.
eTOC Blurb
Rao et al. uncover transcription factor binding and cooperativity at functional enhancers genome-wide in Drosophila cells. Cooperativity occurs at distances that implies the absence of protein-protein interactions between the factors. Instead, cooperativity is driven by enhancer chromatin structure, pointing to how chromatin dynamics can regulate enhancer function.
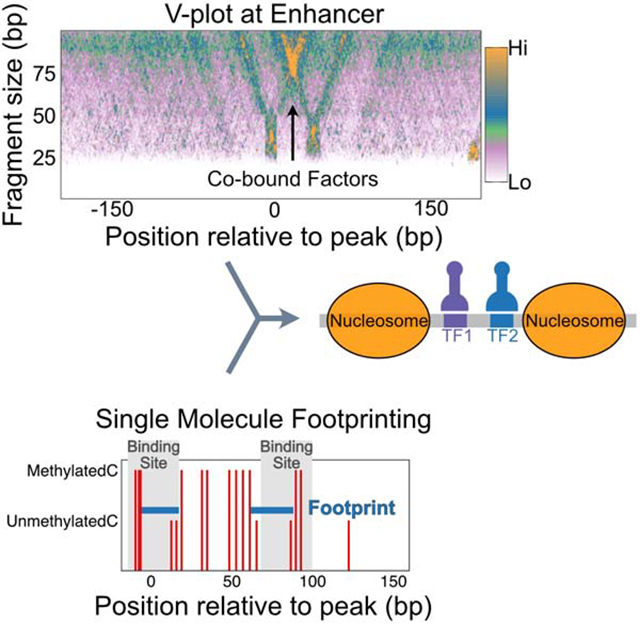
Graphical Abstract
Introduction
Cis-regulatory elements (CREs) or enhancers are DNA sequences that drive cell type-specific gene expression, developmental transitions, and cellular responses to external stimuli (Banerji et al., 1981; Dunipace et al., 2011; Lagha et al., 2012; Levine, 2010). In eukaryotes, CREs are usually ~500 bp in length with multiple binding sites for transcription factors (TFs). A fundamental question in gene regulation is: what is the role of multiple TF binding sites in driving enhancer function? First, multiple binding sites could increase genomic specificity of CREs, as single transcription factor binding sites (TFBS) are short and thus occur often by chance in large genomes, but multiple juxtaposed TF sites are less likely (Crocker et al., 2015; Ludwig et al., 2011). Second, multiple sites provide higher affinities than individual motifs (von Hippel and Berg, 1986). Third, multiple TFBSs at enhancers may be required to program cell type specificity with combinations of TFs (Lagha et al., 2012).
Additional reasons for juxtaposing multiple factor binding sites arise from considering that enhancers must function in chromatin. In the genomes of multicellular organisms, most enhancers are occluded by nucleosomes when not active (Schones et al., 2008), arguing that TF binding and not just the underlying sequence features are required to expose the DNA in the regulatory element. In a hierarchical model of enhancer function, binding of one initiating TF may displace nucleosomes and expose binding sites for other secondary TFs (Iwafuchi-Doi and Zaret, 2014). Alternatively, in a billboard model, multiple TFs may independently bind to an enhancer, and any one TF may keep the regulatory element nucleosome-free (Arnosti and Kulkarni, 2005; Reiter et al., 2017; Spitz and Furlong, 2012). Finally, in an enhanceosome model, protein-protein interactions between bound TFs may drive nucleosome displacement and enhancer function (Bintu et al., 2005; Joshi et al., 2007; Mann and Affolter, 1998). TF occupancy at enhancers differentiates these models for enhancer function; in hierarchical and billboard models, an initiating TF might spend more time bound at an enhancer, but with little co-binding with other factors. In contrast, in enhanceosome-like complexes, co-bound states will be frequently observed. To characterize TF occupancies across a genome, we need to be able to map TF binding at high resolution to distinguish independent and co-bound TFs.
Massively parallel reporter assays have now mapped the locations of thousands of enhancers in the genomes of defined cell types (Andersson and Sandelin, 2020; Arnold et al., 2013), setting the stage to characterize general rules for TF binding in regulatory elements. While traditional methods such as Chromatin Immuno Precipitation (ChIP) for mapping bound TFs have poor resolution and sensitivity, more recent chromatin profiling methods such as ChIP-exo (He et al., 2015; Rhee and Pugh, 2011), ORGANIC native-ChIP (Kasinathan et al., 2014) and CUT&RUN (Skene and Henikoff, 2017) now provide base-pair resolution. Additionally, DNase- and MNase-based methods can also be used to map TF footprints in vivo. While partial digestion with the endonuclease DNase primarily measures accessibility, limit digestion with the endo-exonuclease MNase produces DNA fragments protected from digestion by bound chromatin proteins (Henikoff et al., 2011; Hesselberth et al., 2009). These methods can be used to infer the accessibility and factor binding genome-wide.
Nuclease-based methods chew apart chromatin particles, losing information of what particle co-existed on a single chromatin strand. In contrast, mapping protein binding with exogenous DNA methyltransferases preserves DNA molecules and information on neighboring particles. One such method is dual-enzyme Single-Molecule Footprinting (dSMF) (Krebs et al., 2017), which uses both GpC and CpG DNA methyltransferases to methylate exposed DNA in vivo, thus identifying the positions of nucleosomes and bound TFs on a single molecule. The dSMF method also reveals states where neither TFs nor nucleosomes are bound, thus fully defining the occupancies of regulatory elements in the genome. Here, we combine high-resolution MNase-seq, ORGANIC ChIP, CUT&RUN, and dSMF to define TF binding events at enhancers in Drosophila S2 cells. We develop a method to map multiple TF binding at the same time using MNase-seq and CUT&RUN, inferring TF co-binding events. We measure the unbound state of an enhancer using dSMF, which enabled us to calculate cooperativity between co-binding TFs at enhancers. We find that co-binding correlates with nucleosome occupancy and stability, supporting models where TF cooperativity drives nucleosome displacement at active enhancers. Finally, the unexpectedly low occupancies of TFBS in the Drosophila genome imply that transient TF binding and slow replacement of nucleosomes drives enhancer function.
Results
Active enhancers are enriched for short, protected fragments from MNase
Limit treatment of chromatin with micrococcal nuclease (MNase) digests exposed DNA, producing fragments protected by histone octamers and by bound chromatin proteins (Henikoff et al., 2011). While histone-protected DNA is typically ~150 bp representing the length of DNA wrapped around a nucleosome, chromatin-bound TFs protect the DNA underneath their binding domains in the range of 10–50 bp lengths. Thus, short, protected fragments should report TF binding at regulatory elements throughout the genome. To examine TF binding at enhancers, we used Drosophila S2 cells, where thousands of enhancers have been functionally mapped by STARR-seq (Arnold et al., 2013). STARR-seq reports DNA segments that promote transcription on a transient plasmid, and some of the recovered sequences are not active in the endogenous chromosomal location. The set of putative active enhancers is defined as DNase-hypersensitive STARR-seq sites (Arnold et al., 2013). Active STARR-seq enhancers are also distinguished from closed enhancers by active histone modifications such as H3K27ac and silencing modifications such as H3K27me3 (Arnold et al., 2013) (Figure 1A, B).
Figure 1. Active enhancers are enriched for short MNase-protected DNA fragments.

A) Genome-wide enhancers (500 bp) in Drosophila melanogaster S2 cells identified by STARR-seq were classified into two clusters, active (n = 2,731) and closed (2,748) based on chromatin modifications (H3K27ac and H3K27me3 ChIP-seq data), DNase I hypersensitivity and enrichment (Log2) of MNase short (<50 bp) over nucleosomal (134–160 bp) protections. B) Enrichment of chromatin features at active and closed enhancers plotted relative to the primary MNase short protection peak. C) Examples from closed enhancer without any short MNase peak (top) and active enhancers demonstrating single (middle) and multiple (bottom) short MNase peaks. The gray background represents nucleosome occupancy and the red line plots enrichment of short MNase fragments. Peaks of the short fragment profile are indicated by gray arrows. Orange lines delineate borders of the STARR-seq enhancer. For the enhancer with a single prominent epeak, motif for CLAMP was identified (sequence in the inset). For enhancer with multiple peaks, Trl motifs were identified for the second (sequence in the left inset) and fourth (sequence in the right inset) peaks. D) Distribution of the number of MNase short protection peaks found at enhancers plotted with gray bars with a red line depicting the Gaussian fit. E) Distribution of distance between short MNase-protected peaks. F) Frequency of the top 20 motif families identified under short MNase peaks represented as a bar plot (top). The ratio of the frequency of occurrence of each motif family under short MNase peaks to their frequency of occurrence in the whole enhancer is plotted as a heatmap (bottom). Families with significant enrichment or depletion under MNase peaks are marked by an asterisk in the heatmap (p<0.05, hypergeometric test after multiple testing correction). See also Figure S1 and Table S1.
To determine if TF-protected fragments are detectable in active enhancers, we used sequencing data that is enriched for small fragments <100 bp by gel-isolation of MNase-digested chromatin (Ramachandran et al., 2017). We calculated a “short fragment” score as the log2 enrichment of DNA fragments <50 bp compared to nucleosome-sized fragments at 500 bp segments defined as enhancers in S2 cells by STARR-seq. We find that active enhancers are dramatically enriched for short, protected fragments, while closed enhancers are depleted (Figure 1A, B). We conclude that active enhancers are abundantly occupied by short, protected fragments, consistent with the binding of TFs in these regulatory elements.
Many active enhancers contain multiple bound TFs
Visual inspection of individual STARR-seq sites confirms that active enhancers have specific short segments protected from MNase digestion, while these are absent from closed enhancers (Figure 1C). To map these putative TF binding sites, we called peaks on MNase-seq data in the <50 bp range, with criteria that exclude nucleosomal intermediates at enhancer sites (Ramachandran et al., 2017). 96% of active enhancers have at least one peak. Some enhancers have only one peak, while others have clusters of multiple peaks (Figure 1C, D). On average an active enhancer has four peaks (Figure 1D, Normal distribution: μ = 3.7, σ = 2.3), and in some cases, up to 11 peaks are distinguishable. The spacing between peaks within enhancers is very variable, with ~50 bp as the most observed distance (Figure 1E).
Capture of important S2 motifs
If short fragments within enhancers are protected from digestion by bound TFs, they should contain consensus motifs for those factors. We first scanned the short peaks within enhancers with collections of Drosophila TF motif families and filtered matches for those factors that are expressed in S2 cells. We found motifs for factors known to be important in enhancer function in S2 cells like Trl, Kay, Twist, and GATAd/Serpent (Yanez-Cuna et al., 2014) among the top hits (Figure 1F, Table S1). We compared occurrence of motif families in short peaks to occurrence in whole enhancers and found the motifs for known factors to be either enriched (Trl, Kay) or occur at the same frequency as whole enhancers (Twist, GATAd/Serpent). These differences in enrichment point to either different extents of motif saturation by TFs at the enhancers or to the different extents to which MNase can map different TFs binding at enhancers. To ask if MNase efficiently captures binding at E-box, GATA, and Trl motifs, we plotted enrichment of short fragments at locations where motif mutations led to decreased enhancer activity in reporters (Yanez-Cuna et al., 2014). We observed in all 6 enhancers that were tested, mutated motifs overlapped MNase short peaks, indicating that MNase short fragments capture TF binding in vivo (Figure S1). One of the most abundant TFs in Drosophila S2 cells is the Trithoraxlike (Trl) protein, and indeed the consensus motif for Trl occurs most within protected enhancer sequences that have a detected motif (Figure 1F). To determine the correspondence of Trl binding to protection from MNase, we plotted the MNase short fragment enrichment and Trl mapping by ORGANIC native ChIP for active enhancers whose major protected peak displayed a single high-quality Trl motif (Figure 2A, motif underlies the peak at position 0 bp). We observe a striking high-resolution correspondence between protected short fragments and bound Trl protein at the central peak within enhancers. In contrast, enhancers without significant Trl motifs show no detectable Trl binding (Figure S2A), and short fragments within these enhancers must be due to other TFs.
Figure 2. Trl binding at active enhancers.

A) Heatmaps comparing enrichment of MNase short fragments and Trl ORGANIC native ChIP plotted relative to the primary peak of MNase short protection at enhancers with a single Trl motif at the central peak. B) Schematic demonstrating differences between CUT&RUN and ORGANIC in mapping co-bound TFs. The black line represents DNA and colored boxes on DNA represent motifs with TFs bound to them (green, Trl; blue, another TF). MNase and protein A-MNase are purple, and antibody is orange. C) At a representative Trl binding site in an enhancer with no other Trl motifs, enrichment of Trl native ChIP-seq (top), CUT&RUN (middle), and <50 bp MNase-seq (bottom) are plotted. The gray dashed line represents the summit of the major Mnase peak. The red dashed lines represent the secondary peaks. Trl motifs overlapping peaks are shown as an orange shaded box. The motifs identified at the MNase peaks are shown below. D) Enrichments plotted at enhancers with single Trl motif centered at the primary MNase peak. Short fragment enrichments from ORGANIC (left), CUT&RUN (middle), and MNase (right) are plotted. Gray arrows at +/−60 bp depict enrichment of secondary sites which is strongest for CUT&RUN and weakest for ORGANIC. E) Same as (D) but the plots are centered at the secondary peak of enhancers with single Trl motif. Gray arrow in the ORGANIC plot is at the center and points to the depletion of signal for primary sites. See also Figure S2.
ORGANIC native ChIP works by treating Drosophila nuclei with MNase under native conditions without crosslinking followed by immunoprecipitation and sequencing the DNA bound to the pulled down epitope. Immunoprecipitation methods like ORGANIC recover only the minimal fragment that is protected from MNase by a TF or its protein complex because MNase nibbles down all protected particles in a regulatory element (Figure 2B). However, profiling by CUT&RUN has the potential to preserve information from single DNA molecules. CUT&RUN uses an antibody to a chromatin protein to locally tether a protein A-MNase fusion, which then cleaves exposed DNA between proteins decorating that location (Figure 2B). Thus, in CUT&RUN data, any protected footprints around a factor binding site only appear if two factors are present on the same DNA molecule, for example, nucleosomes and subnucleosomes around chromatin-bound CTCF (Ramachandran et al., 2017; Skene and Henikoff, 2017). We reasoned that we could extract information on the co-binding of two TFs by comparing ORGANIC, MNase-seq, and CUT&RUN profiles. Indeed, on an individual active enhancer, one main peak is detected in anti-Trl ORGANIC, and this peak precisely coincides with a high-quality Trl motif (Figure 2C). However, secondary peaks also appear on either side of the Trl-bound site in MNase-seq and in CUT&RUN data (Figure 2C). These secondary peaks in MNase-seq data can be either due to co-bound factors or independent binding of individual factors in the regulatory element, but in CUT&RUN profiling, the secondary peaks must be due to other TFs that are co-bound with Trl at the central peak.
We next compared ORGANIC, CUT&RUN, and MNase-seq across active enhancers with only one Trl-containing MNase peak. In some enhancers, the Trl-containing MNase peak may be the strongest, “Primary Peak” in the enhancer, and we denote these enhancers as “Trl motif at Primary Peak”. In other enhancers, a non-Trl MNase peak may be the strongest peak in the enhancer and the Trl-containing MNase peak would be a weaker “Secondary Peak” and we call those enhancers “Trl motif at Secondary Peak”. Thus, we analyzed enhancers with only one Trl-containing MNase peak by either centering at the Primary Peaks (Figure 2D) or by centering at the Secondary Peaks (Figure 2E). If this co-binding happened without any protein-protein interactions, we would then observe high enrichment by ORGANIC at the MNase peak only when a high-quality Trl motif was present at that peak (Figure S2B). Indeed, only enhancers with motif-bearing primary peaks show enrichment for Trl by ORGANIC at primary peaks, while enhancers with Trl motif at secondary peaks show background counts (Figure 2D, left). In contrast, we observed high enrichment at both sets of enhancers when we plotted MNase-seq and Trl CUT&RUN at primary peaks (Figure 2D, middle and right). This pattern was reversed when we plotted Trl ORGANIC at secondary peaks. At secondary peaks, enhancers with Trl motif at secondary peak showed high enrichment in ORGANIC, whereas enhancers with Trl motif at primary peak showed a clear dip at the center with flanking peaks (Figure 2E, left). These results imply that co-bound TFs are common in these regulatory elements. Notably, non-Trl peaks are significantly higher in CUT&RUN profiling than in MNase-seq data, implying that other factors usually co-bind with Trl.
High-resolution dissection of co-bound transcription factors
To identify the dominant combinations of multi-TF binding, we centered active enhancers at the main protected short fragment peak, and then performed k-means clustering (k=9) (Figure 3A). Although most enhancers have multiple peaks, these clusters identify enhancers where one or two peaks dominate over the others. The resulting clusters revealed that ~28% of enhancers contain only one major peak of protected fragments (Cluster 3). In all other clusters, a secondary peak of TF binding is also prominent. Most enhancer clusters are depleted for nucleosomes across the region occupied by small fragments, thus corresponding to nucleosome-depleted regions (NDRs) that range in size from ~200 bp (Cluster 2) to as large as ~400 bp (Cluster 9) (Figure 3B). Cluster 1 is the exception: nucleosome depletion in this cluster is relatively weak, and this cluster also has the weakest small fragment peaks. Thus, the size and magnitude of NDRs are related to the spacing between small fragment peaks within the NDR, consistent with the antagonism between factors and histones for DNA. We then performed motif-family analysis to ask if specific TFs were enriched at specific enhancer clusters with rigorous statistical testing (Figure 3C). We observe some motif families to be enriched at single enhancer clusters (CG11504 in CL3, CG5953 in CL5, Brwl in CL3, CG15601 in CL1, Exd in CL3, Lola-PQ in CL3), and others to be enriched at multiple enhancer clusters (BEAF-32/Dref/Pnr in CL3–6, Clamp/Trl in CL2–9, Ken in CL3, 7, Aef1/CG4360 in CL3, 6, and Kay-Jra in CL2–5, 8–9; motif logos in Figure S3). The fact that key TFs like Trl and Kay are enriched at multiple clusters including cluster 3 tell us that same TFs may work alone or cooperatively based on the enhancer context (Figure 3C). These results suggest that small, protected fragments can be used to report the configuration of TF binding events at high resolution at most active enhancers.
Figure 3. Binding of multiple TFs is common at enhancers.

A) Heatmap of enrichment of short MNase-protected fragments plotted relative to the primary peak of short protection. Enhancers are ordered based on k-means clusters. B) Average enrichment of short and nucleosomal fragments of each enhancer cluster plotted relative to the primary peak of short protection. C) The ratio of the frequency of occurrence of each motif family under short MNase peaks to their frequency of occurrence in the whole enhancer is plotted as a heatmap. Significant enrichment or depletion is marked by an asterisk (p<0.05, hypergeometric test after multiple testing correction). Motif families with at least one significant hit in a MNase short peak cluster are included in the heatmap. See also Figure S3.
To profile factor binding combinations in enhancers with two major peaks, we turned to V-plots. V-plots depict the density of DNA fragments as a function of their midpoint (x-axis) and their length (y-axis) (Henikoff et al., 2011) and reveal structures of protein sub-complexes on DNA (Krassovsky et al., 2012; Zentner and Henikoff, 2013). A chromatin-bound protein protects its minimal bound DNA from MNase digestion, but incomplete digestion on either end of the particle results in a notable “V” shape of plots, where the right line of the “V” arises from protection on the left side of the chromatin-bound protein, and the left line arises from protection on the right side. When aligned to the main peak, we observed strong “V” with the vertex at the peak center, pointing to minimal protection of ~40 bp for all the enhancer clusters, further confirming that we are mapping TF binding at enhancers (Figure 4, S4).
Figure 4. V-plot analysis reveals cooperative binding at active enhancers.

A) Fragment midpoint versus fragment length plot (V-plot) of MNase fragments centered at the primary peak for enhancers in Cluster 3 for fragments 100–200 bp (top) and 0–100 bp (bottom) are plotted separately. The average density of fragment lengths for fragments that map within 0±2 bp of the central peak is plotted to the left of the V-plots. B) Similar to (A) for Cluster 4. The average density of fragment lengths for fragments that map within 0±2 bp of the central peak (orange) and 21±2 bp of the central peak (the center of the co-bound species, purple) is plotted to the left of the V-plots. C) Similar to (A) for Cluster 5. The average density of fragment lengths for fragments that map within 0±2 bp of the central peak (orange) and 30±2 bp of the central peak (the center of the co-bound species, purple) is plotted to the left of the V-plots. D) Similar to (A) for Cluster 6. The average density of fragment lengths for fragments that map within 0±2 bp of the central peak (orange) and 43±2 bp of the central peak (the center of the co-bound species, purple) is plotted to the left of the V-plots. E) X-Z projection of the right line of the “V” from V-plot plotted for Clusters 3–6. The slice of the V-plot used in the projection shown in the inset. F) Enrichment of the co-bound states for Cluster 3–6. See also Figures S4 and S5.
A V-plot of Cluster 3 enhancers centered on the primary small fragment peak displays a strong V with clear minimal protection of ~40 bp at the vertex, indicating the footprint of a single bound factor (Figure 4A). This vertex precisely corresponds to the peak of small, protected fragments (Figure 3B, S5). In contrast, a V-plot for Cluster 4 enhancers shows three vertices (Figure 4B). Two vertices are minimal ~40 bp protected segments that correspond to the primary and secondary small fragment peaks of this cluster (Figure 3B, S5). The third vertex lies between the primary and secondary peaks with a fragment length of ~80 bp (Figure S5). This position and length are consistent with a DNA fragment co-bound by TFs at both the primary and secondary sites. Other groups of enhancers also show the predicted arrangement of multiply bound TFs. Clusters 5 and 6 show a third vertex that lies between peaks but increases in size as these peaks are further apart (Figures 4C, D). For Cluster 5, the third vertex protects 100 bp, positioned 30 bp from the primary peak. For Cluster 6, the third vertex representing the co-bound particle is ~120 bp in size and is positioned 43 bp from the primary peak (Figure S5). In Cluster 7–9, the size of the co-bound species approaches that of nucleosomes and is not clearly observed (Figure S4).
From these V-plots, it is clear that the third vertex is formed by the right line of the primary peak V and the left line of the secondary peak V. This is because the left edge of the co-bound particle is the same as that of the TF bound at the primary peak, and the right edge of the co-bound species is the same as that of the TF bound at the secondary peak. Thus, the vertex of the co-bound particle will always lie on the right line of the primary peak V, and co-bound particles can be identified just by plotting the projection of the right line of the V (Figure 4E). For Cluster 3 there is a rapid decline of count density moving away from the sole peak (Figure 4E). Strikingly, for the multi-peak Clusters 4, 5, and 6, local accumulations are apparent at around 20, 30, and 40 bp respectively, indicating the positions of the co-bound vertex for each of those clusters (Figure 4E). The projection of the right line of the V confirms the observation of co-bound species in these clusters.
To estimate the abundance of co-bound TF particles, we calculated the ratio of fragment density at the co-bound vertex to the sum of fragment densities at the primary and secondary peak vertices. As a control, we calculated the ratio of counts at the same positions in V-plots for Cluster 3, which lacks binding of a second TF. The ratio of co-bound species to independently bound species was highest for CL4, which has a separation of ~40 bp between the TF binding sites and lowest for CL6 which has a separation of ~80 bp between binding sites (Figure 4F). Significantly, we found a >3-fold excess of protection at the co-bound vertex in CL4–6 compared to the control, CL3 (Figure 4F). Thus, many active enhancers show widespread and substantial cooperative binding of TFs at distances >40 bp. This cooperativity at a distance would presumably occur in the absence of direct protein-protein interactions.
Identification of chromatin structure at enhancers
V-plots enable the identification of co-bound TFs at aggregated enhancers but cannot determine TF co-binding at sites on a single enhancer. Further, the fraction of factor binding sites that are not bound remains undefined. We turned to dual-enzyme Single-Molecule Footprinting (dSMF) (Krebs et al., 2017) to define binding states of individual enhancers. Freely diffusing exogenous methyltransferases have been used to map chromatin structure in vivo (Jessen et al., 2004; Kelly et al., 2012; Krebs et al., 2017). The Drosophila genome is devoid of cytosine methylation; thus, dSMF with exogenous GpC and CpG methyltransferases have been used to footprint chromatin proteins genome-wide. Critically, the dSMF method can capture information on multiple sites on a single DNA strand, allowing interrogation of all states of factor binding sites in an enhancer, including exposed sites, TF-bound sites, and nucleosome-occluded sites.
Active enhancers are accessible, while the DNA of closed enhancers is relatively inaccessible (Figure 1A). As expected, methylation by GpC and CpG DNA methyltransferases in the dSMF method depends on DNA accessibility and is starkly different between active and closed enhancers (Figure 5A). This suggests that factor-bound sites in active enhancers may be well-footprinted by the high density of DNA methylation in active regulatory elements. Therefore, we classified dSMF reads as “exposed” if all cytosines around a peak of small-fragment MNase-seq were methylated (representative classification in Figure 5B, top). One or more contiguous unmethylated cytosines flanked by methylated cytosines in a dSMF read then defines protein-bound footprints on the enhancer, and we distinguished nucleosomes from TF-bound sites by the length of the unmethylated sequence, respectively (representative classification in Figure 5B, middle and bottom). Active enhancers are enriched for short unmethylated footprints, while closed enhancers are enriched for nucleosome-sized unmethylated footprints (Figure 5E). Footprint calls are not biased by sequence composition at enhancers, as we see no difference in length distribution of theoretical footprints between active and closed enhancers (Figure 5E), confirming that dSMF footprinting can distinguish chromatin structures of regulatory elements.
Figure 5. dSMF defines factor binding at enhancers.

A) Methyltransferase activities around MNase peaks in active and closed enhancers. B) Representative individual bisulfite reads which we classified as naked (top), TF-bound (middle), and nucleosome-bound (bottom) states of a binding site in an active enhancer (at chr2L:480,305). The MNase peak is shown as a gray shaded box. The footprints called by the algorithm are shown as blue lines and the whole bisulfite read is shown as a dark gray line. C) Bisulfite reads mapped to the MNase peak at chr2L:480,305. Unmethylated and methylated cytosines are colored grey and red respectively. D) Footprints at corresponding reads in (C) (blue lines). Three clusters are shown from top to bottom. E) Observed and expected distribution of lengths of footprints defined on bisulfite reads mapping to open and closed enhancers. F) The percentage of binding states at active and closed enhancers. G) Heatmap of occupancies of states of the TFBS at 3 clusters ordered by TF/NUC ratio. H) Boxplots of occupancies for the clusters shown in (G). I) Heatmap of MNase-seq ratio of short fragments to nucleosomal fragments plotted relative to primary enhancer peak. Enhancer peaks are plotted in the same order as (G).
Methylation reads from dSMF across a representative active enhancer is shown in Figure 5C. The proportion of individual reads with each of the three states represents the fraction of each state in the population of DNA molecules, and the fraction of time that each structure persists. Thus, for this particular active enhancer, the TF binding site is occluded by a nucleosome 52% of the time, exposed but not bound by a TF 23% of the time, and bound by a TF only 25% of the time. We then performed analyses of dSMF footprinting across all active enhancers with small-protected peaks defined by MNase-seq. Overall, both active and closed enhancers show low frequencies of TF-sized unmethylated footprints, although the group of active enhancers has many more instances of sites with a high proportion of short unmethylated footprints (Figure 5F). However, the proportions of exposed DNA and nucleosomal DNA is starkly different between active and closed enhancers. On average, active enhancers are exposed ~50% of the time and occluded by nucleosomes ~30% of the time. In contrast, closed enhancers are exposed only ~20% of the time, and ~75% of molecules are occluded by a nucleosome. Thus, active enhancers are distinguished by extensive eviction of nucleosomes and not high factor occupancy.
In order to probe the diversity of the partitioning of enhancers into the three chromatin structures (exposed, TF-bound, and nucleosome-occluded), we performed k-means clustering across 10,255 small, protected peaks defined by MNase-seq. Two of the clusters are characterized by exposed DNA (Cluster C) and nucleosomal structures (Cluster A, Figure 5G, H). Cluster B has equivalent proportions of exposed and nucleosomal states and the highest frequency of TF footprinting (Figure 5G). When we plotted the ratio of enrichment of short fragment to nucleosome-length fragments in MNase-seq for these clusters, we observed that the MNase ratio is proportional to the same ratio as defined by dSMF (Figure 5I). These MNase-seq ratios in dSMF-defined clusters independently confirm that we are mapping TF binding events at active enhancers. Thus, dSMF both recapitulates protein binding as identified by MNase-seq and enables relative quantification of the exposed state, which is invisible in other methods.
Cooperative binding is common at active enhancers
We next used dSMF data to analyze pairs of MNase short-protected peaks at active enhancers with multiple TF binding sites. The median length of DNA molecules in dSMF analysis is 269 bp (Figure S6A). There are 3 possible binding states of an enhancer with a single small-protected peak (exposed, TF-bound, and nucleosome-occluded). Therefore, an enhancer with two small-protected peaks has nine potential states, whereas an enhancer with 3 peaks would have 27 states, and so on. To ensure we have sufficient molecules to identify all states, we focused on pairs of two MNase short-protected peaks at active enhancers. Out of all 11,252 possible pairs of MNase short-protected peaks, 5,109 pairs had at least 5X coverage of TF-sized footprints in dSMF data for each peak in the pair. The majority of these pairs have more than 100 reads overlapping both peaks (Figure 6A), enabling robust identification of binding states. Indeed, multiple short footprints overlapping two short, protected peaks can be readily identified in single dSMF reads (Figure 6B), signifying TF co-binding. This read coverage is sufficient to find examples of 3 bound factor footprints in a single read (Figure 6B, bottom), underlining the potential of dSMF to identify multiple TF binding events in complex regulatory elements.
Figure 6. dSMF analysis of TFBS pairs at enhancers.

A) Distribution of the number of DNA molecules spanning each MNase peak pair used in the co-binding analysis. B) Representative individual bisulfite reads depicting two (top), and three (bottom) TF binding events in an intronic active enhancer in the brat gene (chr2L:19,155,173). The algorithm-called footprints are shown as blue lines and the whole bisulfite read is shown as a gray line. C) Bisulfite reads mapped to MNase peak in the brat intronic enhancer. Unmethylated and methylated cytosines are colored grey and red respectively. Corresponding reads are plotted in the right panel with called footprints (blue lines). Nine clusters: naked at both sites, naked and TF-bound, TF and naked, TF and TF, TF and nucleosome, nucleosome and TF, Nucleosome and naked, and nucleosome on both sites are shown from top to bottom. The two MNase peaks are 78 bp apart. D) Boxplot of the observed and expected prevalence of six states of pairs of short MNase peaks. See also Figure S6.
We developed an algorithm to classify binding states at enhancers with two small fragment peaks from methylation profiling (peak pair distance distribution: Figure S6B). At one such enhancer, we observed reads where one or the other peak site was protected by a TF (one site unmethylated) and reads where both peak sites were protected by TFs (both sites unmethylated), in addition to the exposed and nucleosome-occluded states (Figure 6C). We then calculated the prevalence of these states across all enhancers with two peaks. As we observed at elements with single small fragment peaks, the exposed DNA state is the most common (Figure 6D). We then calculated the expected probability for each of the states of the peak pairs being independent. Strikingly, homotypic states (DNA-DNA, Nuc-Nuc, TF-TF) have significantly higher observed prevalence than expected (Figure 6D), while heterotypic states (DNA-Nuc/Nuc-DNA, TF-DNA/DNA-TF, TF-Nuc/Nuc-TF) are less frequent than expected. Thus, this global analysis of pairs of binding sites within enhancers suggests that elements move in step between co-bound and nucleosome-occluded states.
In groups of enhancers we see cooperativity by MNase-seq. With dSMF, we can score co-binding within individual regulatory elements. We compared observed co-binding frequencies to expected frequencies of co-binding predicted based on methylation state in active enhancers over each small, protected peak. We found 31% of peak pairs had a significant (p<0.01, median cooperativity score =71) extent of cooperativity (Figure 7A). We determined the enrichment of motif family pairs in peak pairs with significant cooperativity compared to all peak pairs we analyzed and found several pairs that were over-represented (Table S2). Several motif family pairs contained Trl, Aef1, and Twist motifs, suggesting that these TFs might be predominantly involved in cooperative binding at enhancers. In enhancers with at least two peaks, we found that the majority (64%) show at least one cooperative interaction, and 28% of enhancers have more than one such interaction (Figure 7B). The strength of cooperativity decreases as the distance between small fragment peaks increases, with the largest cooperative effects observed between peaks that are <60 bp apart (Figure 7C). More moderate but significant cooperativity also occurs between peaks spaced as far apart as 140 bp, perhaps from indirect cooperativity (Morgunova and Taipale, 2017).
Figure 7. Cooperative binding of TFs is characteristic of active enhancers.

A) p-value of co-binding is plotted against normalized extent of co-binding as a histogram with 2D hexagonal binning. The red dotted line is at p-value = 0.01. B) Number of co-binding events at enhancers. C) Distribution of distance between peak pairs that are grouped by extent of co-binding. D) Boxplots of occupancies for states of binding site pairs for the three classes of co-binding. E) Histone H3 ChIP scores at peak pair loci for the three classes. F) CATCH-IT nucleosome turnover scores calculated peak pair loci for the three classes. G) Schematic of binding state transitions at active enhancers. N is nucleosomal, E is exposed DNA, and B is TF-bound. Thicker arrows represent putative higher rates of transition. See also Figure S7 and Tables S2 and S3.
Since we observed a similar distance effect in V-plot analysis of enhancer clusters (Figure 4F), we asked if we could recapitulate the dSMF observations by V-plot analysis. We selected small protected peak pairs based on the distance of separation in multiples of 10 (50 to 90 bp) and generated V-plots and ratio of vertices that corresponded to co-bound states and individually bound states (Figure S7A–F). We observed striking decrease in co-bound states as a function of distance in the V-plots and strong correlation between V-plot ratios and the ratios determined from dSMF counts (Figure S7G, H). This analysis confirmed that MNase-seq and dSMF captured similar binding events including significant cooperativity between TFs. Thus, cooperative interactions are widespread in regulatory elements across a wide range of spacings that imply multiple mechanisms of synergy.
In enhancers with two or more small fragment peaks, factors may independently bind on and off from their cognate sites or binding of one factor may be required to potentiate binding at a second site. To detect such initiating TFs, we compared the frequencies of methylation between peak sites in an enhancer, and if one site had a protection frequency >2-fold of the other site we scored it as a potential initiating site. We found specific motif families enriched in the initiating site and secondary site at these peak pairs compared to all peak pairs with significant cooperative binding (Table S3). Twist motif family was found most frequently at the initiating site, pointing to the possibility that Twist might have significantly higher occupancy compared to the TFs binding at secondary sites at enhancer peak pairs.
Together with cooperativity scores, we distinguish three categories: enhancers where two factors appear to bind independently, enhancers where one TF appears to initiate binding of another, and enhancers where cooperativity dominates. Overall, ~30% of enhancers contain an initiating TF site. We next determined the binding states of these three categories of enhancers. Cooperative enhancers had the highest occupancies of both sites being exposed or nucleosome-bound (Figure 7D), indicating that TF cooperativity may effectively displace nucleosomes from high-affinity sequences. On the other hand, independent TF binding occurs at enhancers that appear to be intrinsically nucleosome-depleted (Figure 7D). Measures of nucleosome occupancy by ChIP for histone H3 (Mueller et al., 2017) and of nucleosome turnover by metabolic labeling of histones (CATCH-IT) (Teves and Henikoff, 2011) support the idea that enhancers with independent binding of TFs have low nucleosome occupancy and low nucleosome turnover, while enhancers with cooperatively-bound TFs have high occupancy and high turnover of nucleosomes (Figure 7E, F). The chromatin dynamics of these enhancers suggests that TF cooperativity enables efficient nucleosome displacement at enhancers with high nucleosome affinity, perhaps enabling chromatin regulation of enhancer activity.
Discussion
Here, we exploit MNase-resistant protections of chromatin to detect bound proteins at high resolution and infer the regulatory architecture of enhancers. Enhancers have been thought to have poorly positioned nucleosomes, perhaps corresponding to weak initiation of transcription within elements, but we find that alignment of active enhancers by the factor-protected regions within them resolves chromatin features, revealing that enhancers – like active promoters – are structured and have defined nucleosome-depleted regions. Notably, while factor-protected regions within enhancers often encompass recognizable consensus motifs for known TFs, many features and even elements lack any statistically significant motif. As the Drosophila TF repertoire has been extensively characterized, this highlights that the rules dictating factor binding in vivo remain incomplete. Other aspects of chromatin beyond the sequences directly contacted by TF DNA-binding domains must promote the recognition and effective binding of regulatory sites.
Information guiding factor binding may come from DNA conformation around binding sites (Gordan et al., 2013; Inukai et al., 2017). Additionally, cooperativity between multiple TFs in a regulatory element can increase affinity and specificity for weaker consensus motifs (Crocker et al., 2015), for example by dimeric factors (Morgunova and Taipale, 2017; Rastogi et al., 2018; Slattery et al., 2011). TFs juxtaposed on a regulatory element might also enhance the affinity of each factor to DNA in vitro (Adams and Workman, 1995; Moyle-Heyrman et al., 2011; Polach and Widom, 1996), but given the fast transient binding of factors in vivo (Voss and Hager, 2014; Wilczynski and Furlong, 2010), it has not been clear how widespread factor cooperativity is. We find that while multiple TFs do bind independently at some active enhancers, 64% of active enhancers in the fly genome display substantial degrees of factor cooperativity. These cooperative interactions are not due to dimeric factors, since the cases we identify occur between factors that bind regulatory elements that are >30 bp apart. In some cases, cooperativity occurs between factors as far apart as 140 bp. Such long-distance synergies might be due to interacting factors that bridge distant sites, or by effects on nucleosome positioning (Mirny, 2010).
TF cooperativity correlated with nucleosome occupancy and histone turnover at active enhancers, implying antagonism between TFs and histones for DNA. In the context of chromatin, binding of multiple spaced TFs competes with nucleosome formation (Mirny, 2010; Moyle-Heyrman et al., 2011; Polach and Widom, 1996). In dynamic nucleosomes where DNA is being unwrapped and rewrapped across the surface of a histone octamer, binding of TFs at exposed DNA can block rewrapping of octamers. The efficiency of blocking the restoration of a nucleosome depends on the relative positioning of factor binding sites, where multiple binding sites on one side of a nucleosome are better competitors. Our observation that factor cooperativity occurs predominantly between sites spaced 50 bp apart in active enhancers fits with this idea. In this line of thinking, an important aspect of factor binding site grammars may be loosely constrained arrangements of sites that primarily act to destabilize nucleosomes. As many TFs recruit chromatin remodeling enzymes to their binding sites, catalyzed displacement of nucleosomes may also contribute to cooperative occupancy of regulatory elements.
A striking but unexplained observation in single-molecule profiling of eukaryotic chromatin is that factor binding sites are not bound by a cognate factor or occluded in a nucleosome up to ~25% of the time (Krebs et al., 2017; Sönmezer et al., 2020; Stergachis et al., 2020; Vierstra et al., 2020). These observations agree well with single-molecule tracking experiments that show only a small fraction of TFs to be bound stably to chromatin and that most TFs have a short residence time in the order of seconds at stably bound sites (Chen et al., 2014; Paakinaho et al., 2017). Future experiments to directly measure the turnover time of TFs at their binding sites by high-resolution live imaging, by techniques like SNAP-tagging (Ray-Gallet et al., 2011) and Anchor-away (Haruki et al., 2008) can uncover the underlying basis for such high levels of unbound states. How do regulatory elements function when no TF is bound? While TFs may often be absent from a regulatory element, part of the answer may lie in that restoration of nucleosomes is slow compared to the binding and release of factors in an active regulatory element (Figure 7G). With slow nucleosomal restoration, transient binding of factors maintains a regulatory element in an exposed configuration where factors can cycle on and off. The persistence of histone modifications on flanking nucleosomes may similarly provide a short-term memory of regulatory events when factors are not bound. In these ways, nucleosome dynamics may provide a mechanism to temper stochastic effects of transient factor binding in vivo, and thus provide stable regulatory output to direct gene expression.
Limitations
In this study, we determined TF binding using two orthogonal methods: MNase-seq and d SMF. Mapping of TF binding by both these methods depends on the occupancy of a site, how tightly it is bound by a TF, and how effectively the TF protects underlying DNA, factors that are common to most genomic methods that map TF binding. We also studied pairs of TFBS separated by distances starting at 30 bp because our methods cannot resolve individual binding events at <30 bp. Future studies could determine if cooperativity between TFs is even stronger at distances shorter than 30 bp, with and without protein-protein interactions.
STAR Methods
RESOURCE AVAILABILITY
Lead Contact
Further information and requests for resources and reagents should be directed to and will be fulfilled by the Lead Contact, Srinivas Ramachandran (srinivas.ramachandran@cuanschutz.edu).
Materials Availability
This study did not generate new unique reagents.
Data and Code Availability
All datasets were aligned to the dm3 version of the Drosophila genome. External datasets used in this study are listed in Table S4. CUT&RUN profiling for the Trl transcription factors has been deposited in GEO under accession GSE157664. The code to call peaks at enhancers and for clustering motif familes is available at https://github.com/srinivasramachandran/Dm-Enhancer-MNase. The code to reproduce figures from the dSMF analysis is available at https://doi.org/10.5281/zenodo.3979883. All scripts and pipelines used in the dSMF analysis are available at https://github.com/satyanarayan-rao/protein_binding_at_enhancers.
EXPERIMENTAL MODEL AND SUBJECT DETAILS
Cell lines
Drosophila S2 cells were purchased from Invitrogen and grown to mid-log-phase in HyClone Insect SFX media (GE). We used a primary antibody to Drosophila Trl (Melnikova et al., 2004) (a gift from G Cavalli, Institute of Human Genetics, Université de Montpellier, France) and protein A-micrococcal nuclease fusion (Skene and Henikoff, 2017) (pAMNase, a gift from S. Henikoff, Fred Hutchinson Cancer Research Center, Seattle WA).
METHOD DETAILS
CUT&RUN profiling
We used an immuno-tethered strategy for profiling the binding of the Trl transcription factor in Drosophila cells. The CUT&RUN method uses an antibody to a specific chromatin epitope to tether pAMNase at chromosomal binding sites within permeabilized cells (Skene and Henikoff, 2017). The nuclease is activated by the addition of calcium and cleaves DNA around binding sites. Cleaved DNA is isolated and subjected to paired-end Illumina sequencing to map the distribution of the chromatin epitope. CUT&RUN profiling with 1×10⁶ S2 cells and library amplification with 14 cycles of PCR was performed as described (Skene and Henikoff, 2017). Libraries were sequenced for 25 cycles in paired-end mode on the Illumina HiSeq 2500 platform at the Fred Hutchinson Cancer Research Center Genomics Shared Resource. Paired-end reads were mapped to the dm3 version of the D. melanogaster genome (FlyBase.org) using Bowtie2.
QUANTIFICATION AND STATISTICAL ANALYSIS
Enhancer identification in S2 cells
We obtained 5,499 STARR-seq summits for Drosophila S2 cells from https://data.starklab.org/publications/yanez-cuna_genomeRes_2014/S2_peakSummits.txt (Yanez-Cuna et al., 2014) and extended the summits by 250 bp on each side.
DNase hypersensitivity profiling
Single-end reads from the MODENCODE DNase hypersensitivity dataset were aligned to the dm3 version of the D. melanogaster genome using Novoalign. The fraction of read ends mapped at each nucleotide was multiplied by a constant to give a normalized count at that position.
Nucleosome mapping
Nucleosomes carrying the histone H3K27me3 or H3K27ac modifications were identified by selecting 140–220 bp (H3K27me3, (Ahmad and Spens, 2019)) or 20–150 bp (H3K27ac) mapped fragments in CUT&RUN profiling (Ramachandran et al., 2017). For profiling nucleosomes and calculating an “H3 ChIP score”, we combined MNase-seq data using 25 U and 100 U of MNase from the T=0 timepoint (control) profiling datasets published by (Mueller et al., 2017), using 140–154 bp mapped fragments. For CATCH-IT profiling, we used 120–174 bp mapped fragments from datasets published by (Teves and Henikoff, 2011). For all nucleosome mapping, the fraction of reads mapped at each nucleotide was multiplied by the size of the Drosophila assembly (139,712,364 bp) to normalize counts at each position, and counts were then aggregated into 10 bp windows.
Trl profiling
Binding sites of the Trl transcription factor were mapped using 20–50 bp fragments in ORGANIC native ChIP-seq and CUT&RUN datasets. Coverage was normalized by the size of the Drosophila assembly (139,712,364 bp) and counts were aggregated into 10 bp windows.
MNase profiling
We used paired-end sequencing data of MNase-digested Drosophila S2 nuclei enriched for small protected fragments by gel-isolation of digested DNA <100 bp (Ramachandran et al., 2017) and aggregated it together with sequenced datasets of total MNase-digested chromatin (Ramachandran et al., 2017; Ramachandran and Henikoff, 2016; Teves and Henikoff, 2011) (Table S4). To calculate TF footprint enrichment, we calculated the normalized log2 of TF-protected counts / Nucleosome-protected counts at every basepair in enhancer segments using protected fragments ≤50 bp for TFs and protected fragments 134–160 bp for nucleosomes.
To call TF peaks in enhancers, we normalized counts of centers of ≤50 bp protected fragments in aggregated MNase-seq data at basepair-resolution, and then smoothed counts with a 5 bp sliding window, generating the “≤50 high-resolution track”. We then intersected this track with STARR-seq enhancers (Yanez-Cuna et al., 2014) and called peaks using a custom script (deposited at https://github.com/srinivasramachandran/Dm-Enhancer-MNase). We used two stringent criteria to identify peaks: first, a peak must be a local maximum (>4 standard deviations from the mean); second, a peak must have >4-fold enrichment of short fragments over nucleosome-sized fragments. Each active enhancer was centered at its tallest peak, and Z-scores were calculated at the centers of ≤50 bp fragments ±200 bp from the central peak, and k-means clustering (k=9) was performed over the Z-score matrix.
For identifying motifs underlying small protected peaks, we used FIMO (Grant et al., 2011) with default parameters on the peaks called from ≤50 bp protection track with consensus motifs from Fly Factor Survey (Enuameh et al., 2013) and JASPAR (Fornes et al., 2020). Similar to recent motif analyses under DNase footprints (Vierstra et al., 2020), we clustered all motifs from Fly Factor Survey and JASPAR. We first calculated similarities between motifs using Tomtom (Gupta et al., 2007). We then performed hierarchical clustering of the motifs based on their similarities and assigned motif families (motif families deposited at https://github.com/srinivasramachandran/Dm-Enhancer-MNase/tree/master/Motif_Clustering). We assigned the corresponding motif family to each motif hit under the short MNase peaks. We then coalesced overlapping hits to the same motif family into single hits. Recovered motifs were then filtered for the corresponding TFs that are expressed in S2 cells with expression scores > 1 in S2 microarray profiling data (Henikoff et al., 2009) or ≥10 TPM in S2-DRSC RNA-seq profiling data (Cherbas et al., 2011).
For V-plots of clustered enhancers, we binned small, protected fragments by their fragment lengths and positions relative to centered enhancer summits. The fragment length vs. fragment midpoint position 2D histogram was normalized by the number of nucleosomal fragments (142–152 bp in length) mapping ±15 bp from the enhancer peak to plot the enrichment of fragments over nucleosome density at the peak.
dSMF sequence alignment
We used dual-enzyme single-molecule footprinting dSMF profiling data of Drosophila S2 cells published by (Krebs et al., 2017). We downloaded 150bp paired-end reads and used Trim-Galore (https://github.com/FelixKrueger/TrimGalore) to remove sequencing adapters and Bismark (Krueger and Andrews, 2011) to align bisulfite sequences to the dm3 assembly. Biological and technical replicates were merged to create a single alignment file for the downstream analysis. DNA methylation calls on non-CpG/GpC dinucleotides (~10% of the total) were discarded. We defined percentage methylation as the percentage of methylated cytosines (5mC/C) on each read over MNase peaks.
DNA molecule preparation and footprint calls
To infer protein binding events at single DNA molecule resolution, we examined only overlapping (≥0 bp) aligned reads and assessed the methylation of single DNA molecules. We called footprints of DNA regions protected by chromatin proteins if at least one cytosine was unmethylated between methylated cytosines in a read. Footprints <10 bp in length were discarded, as transcription factors typically protect ~10 bp or more. Special consideration was mapped reads with unmethylated cytosines but devoid of footprints; these represent a nucleosome bound at either of the edges of the read. Such nucleosomal footprints are called if the length of a DNA segment with unmethylated cytosines on edges was >130 bp. Footprints that were separated by one bp (“wobble”) were merged to define a longer footprint. To estimate potential footprint length profiles on reads as a baseline for observed footprints, we defined potential footprints by taking all combinations of three cytosines (nC3) in mapped reads.
Binding state assignment in the dSMF reads
For single factor sites
We defined a ±15 bp window around each small fragment peak center within active STARR-seq enhancers as the putative TF binding site. Any dSMF read with all cytosines methylated across the segment or with unmethylated cytosines limited to <10 bp was annotated as an exposed (E) binding site. An unmethylated footprint spanning 10–50 bp was annotated as a TF-bound (T) site, and unmethylated footprints >130 bp were annotated as nucleosome-occluded (N) sites. In cases of more than one unmethylated footprint in a read, the footprint with the largest overlap to the TF peak was assigned as its chromatin structure. Footprints at the edges of a read are special cases that were only retained and annotated as nucleosome-occluded if the edge unmethylated footprint spanning a binding site was >50 bp in length, ie. greater than expected for protection by a TF and consistent with nucleosomal protection.
For pairs of binding sites
Three possible structures at a TF binding site gives nine possible structures for pairs of binding sites. We used the above criteria for structure annotation, with the additional defined structures: reads with an unmethylated footprint <100 bp encompassing both binding sites were annotated as 2 co-bound (C) TFs (Figure S6C–F).
We calculated the normalized extent of transcription factor co-binding as the ratio of two probability terms using the following formulae
| (1) |
| (2) |
Where:
| (3) |
| (4) |
After replacing P(Observed) and P(Expected) from (1) and (2) respectively to (4), we find that the Extent of Cobinding is directly proportional to the total number of DNA molecules spanning both peaks. To remove this bias, we multiply by the extent of co- binding by the total TF binding fraction:
| (5) |
Figure S6G–H depicts the effect of normalization. We use this normalized extent of co-binding values throughout analysis. We normalized this “cooperativity score” from 0 to 100. The significance of these scores was calculated as a p-value for the observed frequencies of the co-bound state using the hypergeometric test with multiple hypothesis correction to obtain adjusted p-values for all 5,109 peak pairs. p-values were adjusted for multiple hypothesis testing using the Benjamini & Hochberg method.
To infer preferred binding sites within an enhancer, we calculate an Imbalance Score using the following formulae:
| (6) |
Thus, more TF-bound molecules at one site compared to another gives a high imbalance score. We annotated a binding site in a pair of sites as an Initiating site if it had an imbalance score >1.
Supplementary Material
Table S1. List of motifs identified at short Mnase peaks in active enhancers, Related to Figure 1
Table S2. List of motif family pairs that are significantly enriched in cooperatively bound TF peak pairs, Related to Figure 7
Table S3. List of motif family pairs that are significantly enriched at peaks pairs with an initiating TF compared to all cooperatively bound peak pairs, Related to Figure 7
KEY RESOURCES TABLE.
| REAGENT or RESOURCE | SOURCE | IDENTIFIER |
|---|---|---|
| Antibodies | ||
| Primary antibody to Drosophila Trl (Melnikova et al., 2004) (a gift from G Cavalli, Institute of Human Genetics, Université de Montpellier, France) | Melnikova et al., 2004 | N/A |
| Bacterial and Virus Strains | ||
| Biological Samples | ||
| Chemicals, Peptides, and Recombinant Proteins | ||
| Protein A-MNase fusion protein (pAMNase, a gift from S. Henikoff, Fred Hutchinson Cancer Research Center, Seattle WA) | Skene and Henikoff, 2017 | N/A |
| Critical Commercial Assays | ||
| Deposited Data | ||
| All sequencing datasets have been uploaded in GEO | GSE157664 | |
| STARR-seq summits for Drosophila S2 cells | Yanez-Cuna et al., 2014 | https://data.starklab.org/publications/yanez-cuna_genomeRes_2014/S2_peakSummits.txt |
| Experimental Models: Cell Lines | ||
| Drosophila S2 cells | Invitrogen | R69007 |
| Experimental Models: Organisms/Strains | ||
| Oligonucleotides | ||
| Recombinant DNA | ||
| Software and Algorithms | ||
| Bowtie2 | Langmead and Salzberg, 2012 | http://bowtie-bio.sourceforge.net/bowtie2/index.shtml |
| Bismark | Felix Krueger, Simon R Andrews, 2011 | https://www.bioinformatics.babraham.ac.uk/projects/bismark/ |
| Custom perl, R, and shell scripts to call peaks at enhancers and for clustering motif families | This paper | https://github.com/srinivasramachandran/Dm-Enhancer-MNase |
| Custom R scripts - scripts used in the dSMF analysis | This paper | https://github.com/satyanarayan-rao/protein_binding_at_enhancers |
| Custom python scripts - scripts and pipelines used in the dSMF analysis | This paper | https://github.com/satyanarayan-rao/protein_binding_at_enhancers |
| Code to reproduce figures from the dSMF analysis | This paper | https://doi.org/10.5281/zenodo.3979883 |
| Other | ||
Highlights.
Active enhancers are enriched for short fragments protected from MNase
V-plots and single molecule footprinting identify transcription factor co-binding
Cooperative binding of transcription factors is common at active enhancers
Acknowledgements
This work was supported by the RNA Bioscience Initiative, University of Colorado School of Medicine and NIH grants R35GM133434 (S. Ramachandran) and R01GM108699 (K.A.). We thank David Bentley, Sujatha Jagannathan, and Alexis Zukowski for critical reading of the manuscript.
Footnotes
Declaration of Interests
The authors declare no competing interests.
Publisher's Disclaimer: This is a PDF file of an unedited manuscript that has been accepted for publication. As a service to our customers we are providing this early version of the manuscript. The manuscript will undergo copyediting, typesetting, and review of the resulting proof before it is published in its final form. Please note that during the production process errors may be discovered which could affect the content, and all legal disclaimers that apply to the journal pertain.
References
- Adams CC, and Workman JL (1995). Binding of disparate transcriptional activators to nucleosomal DNA is inherently cooperative. Mol Cell Biol 15, 1405–1421. [DOI] [PMC free article] [PubMed] [Google Scholar]
- Ahmad K, and Spens AE (2019). Separate Polycomb Response Elements control chromatin state and activation of the vestigial gene. PLoS Genet 15, e1007877. [DOI] [PMC free article] [PubMed] [Google Scholar]
- Andersson R, and Sandelin A (2020). Determinants of enhancer and promoter activities of regulatory elements. Nat Rev Genet 21, 71–87. [DOI] [PubMed] [Google Scholar]
- Arnold CD, Gerlach D, Stelzer C, Boryn LM, Rath M, and Stark A (2013). Genome-wide quantitative enhancer activity maps identified by STARR-seq. Science 339, 1074–1077. [DOI] [PubMed] [Google Scholar]
- Arnosti DN, and Kulkarni MM (2005). Transcriptional enhancers: Intelligent enhanceosomes or flexible billboards? J Cell Biochem 94, 890–898. [DOI] [PubMed] [Google Scholar]
- Banerji J, Rusconi S, and Schaffner W (1981). Expression of a beta-globin gene is enhanced by remote SV40 DNA sequences. Cell 27, 299–308. [DOI] [PubMed] [Google Scholar]
- Bintu L, Buchler NE, Garcia HG, Gerland U, Hwa T, Kondev J, and Phillips R (2005). Transcriptional regulation by the numbers: models. Curr Opin Genet Dev 15, 116–124. [DOI] [PMC free article] [PubMed] [Google Scholar]
- Chen J, Zhang Z, Li L, Chen BC, Revyakin A, Hajj B, Legant W, Dahan M, Lionnet T, Betzig E, et al. (2014). Single-molecule dynamics of enhanceosome assembly in embryonic stem cells. Cell 156, 1274–1285. [DOI] [PMC free article] [PubMed] [Google Scholar]
- Cherbas L, Willingham A, Zhang D, Yang L, Zou Y, Eads BD, Carlson JW, Landolin JM, Kapranov P, Dumais J, et al. (2011). The transcriptional diversity of 25 Drosophila cell lines. Genome Res 21, 301–314. [DOI] [PMC free article] [PubMed] [Google Scholar]
- Crocker J, Abe N, Rinaldi L, McGregor AP, Frankel N, Wang S, Alsawadi A, Valenti P, Plaza S, Payre F, et al. (2015). Low affinity binding site clusters confer hox specificity and regulatory robustness. Cell 160, 191–203. [DOI] [PMC free article] [PubMed] [Google Scholar]
- Dunipace L, Ozdemir A, and Stathopoulos A (2011). Complex interactions between cis-regulatory modules in native conformation are critical for Drosophila snail expression. Development 138, 4075–4084. [DOI] [PMC free article] [PubMed] [Google Scholar]
- Enuameh MS, Asriyan Y, Richards A, Christensen RG, Hall VL, Kazemian M, Zhu C, Pham H, Cheng Q, Blatti C, et al. (2013). Global analysis of Drosophila Cys(2)-His(2) zinc finger proteins reveals a multitude of novel recognition motifs and binding determinants. Genome Res 23, 928–940. [DOI] [PMC free article] [PubMed] [Google Scholar]
- Fornes O, Castro-Mondragon JA, Khan A, van der Lee R, Zhang X, Richmond PA, Modi BP, Correard S, Gheorghe M, Baranasic D, et al. (2020). JASPAR 2020: update of the open-access database of transcription factor binding profiles. Nucleic Acids Res 48, D87–D92. [DOI] [PMC free article] [PubMed] [Google Scholar]
- Gordan R, Shen N, Dror I, Zhou T, Horton J, Rohs R, and Bulyk ML (2013). Genomic regions flanking E-box binding sites influence DNA binding specificity of bHLH transcription factors through DNA shape. Cell Rep 3, 1093–1104. [DOI] [PMC free article] [PubMed] [Google Scholar]
- Grant CE, Bailey TL, and Noble WS (2011). FIMO: scanning for occurrences of a given motif. Bioinformatics 27, 1017–1018. [DOI] [PMC free article] [PubMed] [Google Scholar]
- Gupta S, Stamatoyannopoulos JA, Bailey TL, and Noble WS (2007). Quantifying similarity between motifs. Genome Biol 8, R24. [DOI] [PMC free article] [PubMed] [Google Scholar]
- Haruki H, Nishikawa J, and Laemmli UK (2008). The anchor-away technique: rapid, conditional establishment of yeast mutant phenotypes. Mol Cell 31, 925–932. [DOI] [PubMed] [Google Scholar]
- He Q, Johnston J, and Zeitlinger J (2015). ChIP-nexus enables improved detection of in vivo transcription factor binding footprints. Nat Biotechnol 33, 395–401. [DOI] [PMC free article] [PubMed] [Google Scholar]
- Henikoff JG, Belsky JA, Krassovsky K, MacAlpine DM, and Henikoff S (2011). Epigenome characterization at single base-pair resolution. Proc Natl Acad Sci U S A 108, 18318–18323. [DOI] [PMC free article] [PubMed] [Google Scholar]
- Henikoff S, Henikoff JG, Sakai A, Loeb GB, and Ahmad K (2009). Genome-wide profiling of salt fractions maps physical properties of chromatin. Genome Res 19, 460–469. [DOI] [PMC free article] [PubMed] [Google Scholar]
- Hesselberth JR, Chen X, Zhang Z, Sabo PJ, Sandstrom R, Reynolds AP, Thurman RE, Neph S, Kuehn MS, Noble WS, et al. (2009). Global mapping of protein-DNA interactions in vivo by digital genomic footprinting. Nat Methods 6, 283–289. [DOI] [PMC free article] [PubMed] [Google Scholar]
- Inukai S, Kock KH, and Bulyk ML (2017). Transcription factor-DNA binding: beyond binding site motifs. Curr Opin Genet Dev 43, 110–119. [DOI] [PMC free article] [PubMed] [Google Scholar]
- Iwafuchi-Doi M, and Zaret KS (2014). Pioneer transcription factors in cell reprogramming. Genes Dev 28, 2679–2692. [DOI] [PMC free article] [PubMed] [Google Scholar]
- Jessen WJ, Dhasarathy A, Hoose SA, Carvin CD, Risinger AL, and Kladde MP (2004). Mapping chromatin structure in vivo using DNA methyltransferases. Methods 33, 68–80. [DOI] [PubMed] [Google Scholar]
- Joshi R, Passner JM, Rohs R, Jain R, Sosinsky A, Crickmore MA, Jacob V, Aggarwal AK, Honig B, and Mann RS (2007). Functional specificity of a Hox protein mediated by the recognition of minor groove structure. Cell 131, 530–543. [DOI] [PMC free article] [PubMed] [Google Scholar]
- Kasinathan S, Orsi GA, Zentner GE, Ahmad K, and Henikoff S (2014). High-resolution mapping of transcription factor binding sites on native chromatin. Nat Methods 11, 203–209. [DOI] [PMC free article] [PubMed] [Google Scholar]
- Kelly TK, Liu Y, Lay FD, Liang G, Berman BP, and Jones PA (2012). Genome-wide mapping of nucleosome positioning and DNA methylation within individual DNA molecules. Genome Res 22, 2497–2506. [DOI] [PMC free article] [PubMed] [Google Scholar]
- Krassovsky K, Henikoff JG, and Henikoff S (2012). Tripartite organization of centromeric chromatin in budding yeast. Proc Natl Acad Sci U S A 109, 243–248. [DOI] [PMC free article] [PubMed] [Google Scholar]
- Krebs AR, Imanci D, Hoerner L, Gaidatzis D, Burger L, and Schübeler D (2017). Genome-wide Single-Molecule Footprinting Reveals High RNA Polymerase II Turnover at Paused Promoters. Mol Cell 67, 411–422.e414. [DOI] [PMC free article] [PubMed] [Google Scholar]
- Krueger F, and Andrews SR (2011). Bismark: a flexible aligner and methylation caller for Bisulfite-Seq applications. Bioinformatics 27, 1571–1572. [DOI] [PMC free article] [PubMed] [Google Scholar]
- Lagha M, Bothma JP, and Levine M (2012). Mechanisms of transcriptional precision in animal development. Trends Genet 28, 409–416. [DOI] [PMC free article] [PubMed] [Google Scholar]
- Levine M (2010). Transcriptional enhancers in animal development and evolution. Curr Biol 20, R754–763. [DOI] [PMC free article] [PubMed] [Google Scholar]
- Ludwig MZ, Manu, Kittler R, White KP, and Kreitman M (2011). Consequences of eukaryotic enhancer architecture for gene expression dynamics, development, and fitness. PLoS Genet 7, e1002364. [DOI] [PMC free article] [PubMed] [Google Scholar]
- Mann RS, and Affolter M (1998). Hox proteins meet more partners. Curr Opin Genet Dev 8, 423–429. [DOI] [PubMed] [Google Scholar]
- Melnikova L, Juge F, Gruzdeva N, Mazur A, Cavalli G, and Georgiev P (2004). Interaction between the GAGA factor and Mod(mdg4) proteins promotes insulator bypass in Drosophila. Proc Natl Acad Sci U S A 101, 14806–14811. [DOI] [PMC free article] [PubMed] [Google Scholar]
- Mirny LA (2010). Nucleosome-mediated cooperativity between transcription factors. Proc Natl Acad Sci U S A 107, 22534–22539. [DOI] [PMC free article] [PubMed] [Google Scholar]
- Morgunova E, and Taipale J (2017). Structural perspective of cooperative transcription factor binding. Curr Opin Struct Biol 47, 1–8. [DOI] [PubMed] [Google Scholar]
- Moyle-Heyrman G, Tims HS, and Widom J (2011). Structural constraints in collaborative competition of transcription factors against the nucleosome. J Mol Biol 412, 634–646. [DOI] [PMC free article] [PubMed] [Google Scholar]
- Mueller B, Mieczkowski J, Kundu S, Wang P, Sadreyev R, Tolstorukov MY, and Kingston RE (2017). Widespread changes in nucleosome accessibility without changes in nucleosome occupancy during a rapid transcriptional induction. Genes Dev 31, 451–462. [DOI] [PMC free article] [PubMed] [Google Scholar]
- Paakinaho V, Presman DM, Ball DA, Johnson TA, Schiltz RL, Levitt P, Mazza D, Morisaki T, Karpova TS, and Hager GL (2017). Single-molecule analysis of steroid receptor and cofactor action in living cells. Nat Commun 8, 15896. [DOI] [PMC free article] [PubMed] [Google Scholar]
- Polach KJ, and Widom J (1996). A model for the cooperative binding of eukaryotic regulatory proteins to nucleosomal target sites. J Mol Biol 258, 800–812. [DOI] [PubMed] [Google Scholar]
- Ramachandran S, Ahmad K, and Henikoff S (2017). Transcription and Remodeling Produce Asymmetrically Unwrapped Nucleosomal Intermediates. Mol Cell 68, 1038–1053 e1034. [DOI] [PMC free article] [PubMed] [Google Scholar]
- Ramachandran S, and Henikoff S (2016). Transcriptional Regulators Compete with Nucleosomes Post-replication. Cell 165, 580–592. [DOI] [PMC free article] [PubMed] [Google Scholar]
- Rastogi C, Rube HT, Kribelbauer JF, Crocker J, Loker RE, Martini GD, Laptenko O, Freed-Pastor WA, Prives C, Stern DL, et al. (2018). Accurate and sensitive quantification of protein-DNA binding affinity. Proc Natl Acad Sci U S A 115, E3692–e3701. [DOI] [PMC free article] [PubMed] [Google Scholar]
- Ray-Gallet D, Woolfe A, Vassias I, Pellentz C, Lacoste N, Puri A, Schultz DC, Pchelintsev NA, Adams PD, Jansen LE, et al. (2011). Dynamics of histone H3 deposition in vivo reveal a nucleosome gap-filling mechanism for H3.3 to maintain chromatin integrity. Mol Cell 44, 928–941. [DOI] [PubMed] [Google Scholar]
- Reiter F, Wienerroither S, and Stark A (2017). Combinatorial function of transcription factors and cofactors. Curr Opin Genet Dev 43, 73–81. [DOI] [PubMed] [Google Scholar]
- Rhee HS, and Pugh BF (2011). Comprehensive genome-wide protein-DNA interactions detected at single-nucleotide resolution. Cell 147, 1408–1419. [DOI] [PMC free article] [PubMed] [Google Scholar]
- Schones DE, Cui K, Cuddapah S, Roh TY, Barski A, Wang Z, Wei G, and Zhao K (2008). Dynamic regulation of nucleosome positioning in the human genome. Cell 132, 887–898. [DOI] [PMC free article] [PubMed] [Google Scholar]
- Skene PJ, and Henikoff S (2017). An efficient targeted nuclease strategy for high-resolution mapping of DNA binding sites. Elife 6. [DOI] [PMC free article] [PubMed] [Google Scholar]
- Slattery M, Riley T, Liu P, Abe N, Gomez-Alcala P, Dror I, Zhou T, Rohs R, Honig B, Bussemaker HJ, et al. (2011). Cofactor binding evokes latent differences in DNA binding specificity between Hox proteins. Cell 147, 1270–1282. [DOI] [PMC free article] [PubMed] [Google Scholar]
- Sonmezer C, Kleinendorst R, Imanci D, Villacorta L, Schubeler D, Benes V, and Krebs AR (2020). Single molecule occupancy patterns of transcription factors reveal determinants of cooperative binding in vivo. bioRxiv. [Google Scholar]
- Spitz F, and Furlong EE (2012). Transcription factors: from enhancer binding to developmental control. Nat Rev Genet 13, 613–626. [DOI] [PubMed] [Google Scholar]
- Stergachis AB, Debo BM, Haugen E, Churchman LS, and Stamatoyannopoulos JA (2020). Single-molecule regulatory architectures captured by chromatin fiber sequencing. Science 368, 1449–1454. [DOI] [PubMed] [Google Scholar]
- Teves SS, and Henikoff S (2011). Heat shock reduces stalled RNA polymerase II and nucleosome turnover genome-wide. Genes Dev 25, 2387–2397. [DOI] [PMC free article] [PubMed] [Google Scholar]
- Vierstra J, Lazar J, Sandstrom R, Halow J, Lee K, Bates D, Diegel M, Dunn D, Neri F, Haugen E, et al. (2020). Global reference mapping of human transcription factor footprints. Nature 583, 729–736. [DOI] [PMC free article] [PubMed] [Google Scholar]
- von Hippel PH, and Berg OG (1986). On the specificity of DNA-protein interactions. Proc Natl Acad Sci U S A 83, 1608–1612. [DOI] [PMC free article] [PubMed] [Google Scholar]
- Voss TC, and Hager GL (2014). Dynamic regulation of transcriptional states by chromatin and transcription factors. Nat Rev Genet 15, 69–81. [DOI] [PMC free article] [PubMed] [Google Scholar]
- Wilczynski B, and Furlong EE (2010). Dynamic CRM occupancy reflects a temporal map of developmental progression. Mol Syst Biol 6, 383. [DOI] [PMC free article] [PubMed] [Google Scholar]
- Yanez-Cuna JO, Arnold CD, Stampfel G, Boryn LM, Gerlach D, Rath M, and Stark A (2014). Dissection of thousands of cell type-specific enhancers identifies dinucleotide repeat motifs as general enhancer features. Genome Res 24, 1147–1156. [DOI] [PMC free article] [PubMed] [Google Scholar]
- Zentner GE, and Henikoff S (2013). Mot1 redistributes TBP from TATA-containing to TATA-less promoters. Mol Cell Biol 33, 4996–5004. [DOI] [PMC free article] [PubMed] [Google Scholar]
Associated Data
This section collects any data citations, data availability statements, or supplementary materials included in this article.
Supplementary Materials
Table S1. List of motifs identified at short Mnase peaks in active enhancers, Related to Figure 1
Table S2. List of motif family pairs that are significantly enriched in cooperatively bound TF peak pairs, Related to Figure 7
Table S3. List of motif family pairs that are significantly enriched at peaks pairs with an initiating TF compared to all cooperatively bound peak pairs, Related to Figure 7
Data Availability Statement
All datasets were aligned to the dm3 version of the Drosophila genome. External datasets used in this study are listed in Table S4. CUT&RUN profiling for the Trl transcription factors has been deposited in GEO under accession GSE157664. The code to call peaks at enhancers and for clustering motif familes is available at https://github.com/srinivasramachandran/Dm-Enhancer-MNase. The code to reproduce figures from the dSMF analysis is available at https://doi.org/10.5281/zenodo.3979883. All scripts and pipelines used in the dSMF analysis are available at https://github.com/satyanarayan-rao/protein_binding_at_enhancers.