

Abstract
Tumor-associated macrophages (TAMs) play an important role in the immune response to cancer, but the mechanisms by which the tumor microenvironment controls TAMs and T cell immunity are not completely understood. Here we report that kynurenine produced by glioblastoma cells activates aryl hydrocarbon receptor (AHR) in TAMs to modulate their function and T cell immunity. AHR promotes CCR2 expression, driving TAM recruitment in response to CCL2. AHR also drives the expression of KLF4 and suppresses NF-κB activation in TAMs. Finally, AHR drives the expression of the ectonucleotidase CD39 in TAMs, which promotes CD8+ T cell dysfunction by producing adenosine in cooperation with CD73. In humans, the expression of AHR and CD39 was highest in grade 4 glioma, and high AHR expression was associated with poor prognosis. In summary, AHR and CD39 expressed in TAMs participate in the regulation of the immune response in glioblastoma and constitute potential targets for immunotherapy.
The tumor microenvironment plays a central role in the control of the immune response to tumors1–4. TAMs control cancer initiation, progression, metastasis and response to therapy5–11. One of the mechanisms by which TAMs contribute to cancer pathogenesis is by promoting immunosuppression. Indeed, TAM-induced immunosuppression contributes to the resistance to checkpoint blockade therapy1,2. However, the mechanisms by which the tumor microenvironment controls TAMs and tumor-specific immunity are not completely understood. Based on the encouraging results recently obtained with checkpoint inhibitors12,13, the identification of the molecular mechanisms that operate in TAMs to suppress tumor-specific immunity are likely to identify new targets for therapeutic intervention.
Glioblastoma (GBM) is the most common malignant primary brain tumor in adults14. GBM is also one of the most aggressive cancers, with a median survival of around 15 months despite aggressive treatment14. GBM achieves fast growth and dissemination in the brain parenchyma through several mechanisms, including rapid proliferation, the promotion of angiogenesis and the induction of immunosuppression14. TAMs constitute more than 30% of infiltrating cells in GBM15. Interestingly, GBM progression is associated with TAM infiltration, showing a better correlation than infiltration by FOXP3+ regulatory T (Treg) cells16. In support of an important role for TAMs in tumor pathogenesis, the modulation of TAM activity has beneficial effects on GBM3,17. In some tumors, including GBM, the acquisition of a phenotype resembling M2-like macrophages by TAMs has been linked with tumor progression and the suppression of tumor-specific immunity15. However, intermediate phenotypes that do not fit the M1/M2 model exist in vivo, suggesting that multiple modules in the transcriptional program of TAMs may promote their pathogenic activities. Hence, defining the mechanisms that control TAMs has important basic and clinical implications.
Here we report that kynurenine, a metabolite produced by glioma cells, participates in the control of TAMs via the activation of the ligand-activated transcription factor AHR. AHR-dependent transcriptional programs modulate TAM recruitment and activation in GBM as well as T cell immunity. These findings define a molecular pathway involved in the regulation of TAMs and the T cell response in GBM and identify candidate targets for therapeutic intervention.
Results
AHR is expressed by GBM-infiltrating TAMs.
To study TAMs in GBM, we first analyzed their transcriptional program. Since, microglia are the largest population of myeloid cells in the CNS of healthy individuals, and based on the reported effects of the brain microenvironment on the transcriptional program of myeloid cells18, we used microglia isolated from healthy individuals as a comparator in our transcriptional analysis. We found that GBM-infiltrating TAMs expressed transcripts linked to both the pro- (M1-like) and anti-inflammatory (M2-like) phenotypes (Fig. 1a–c).
Fig. 1 |. AHR is expressed by TAMs in GBM.
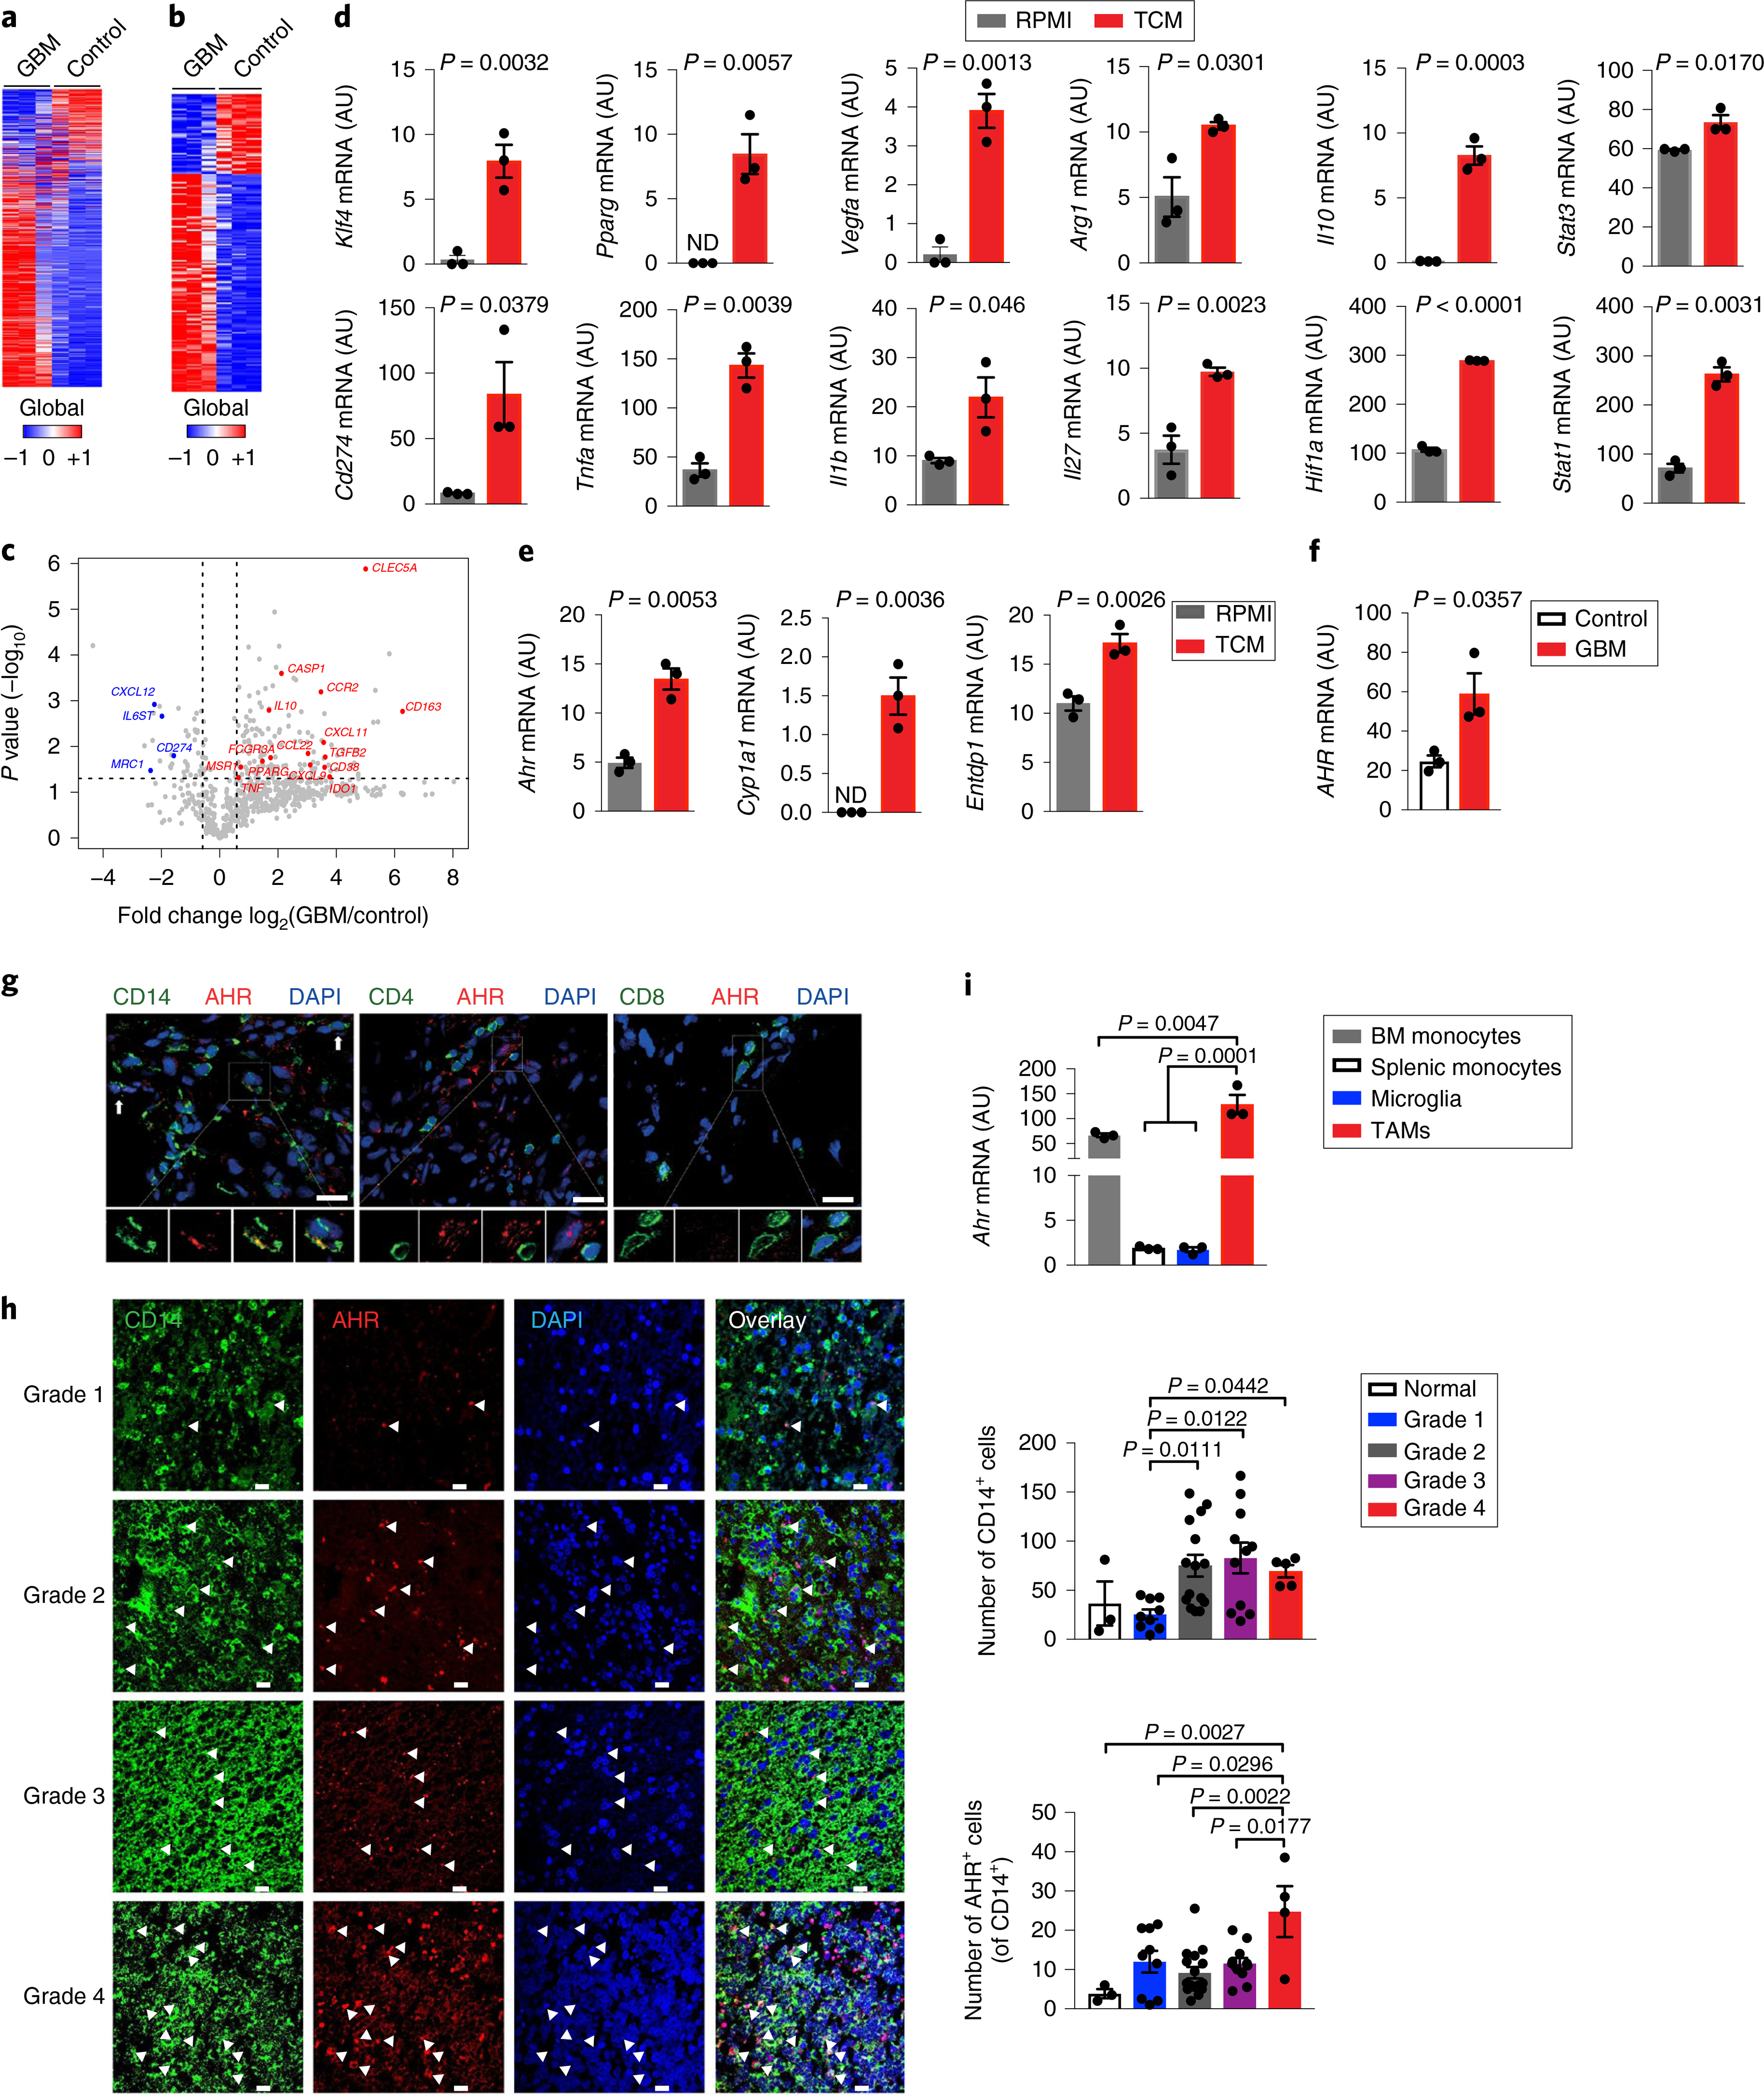
a–c, Gene expression analysis of GBM-infiltrating CD14+ cells (GBM) and microglia from healthy individuals (Control) using Nanostring (n = 3 biologically independent samples). Heatmap of all expressed genes (a), differentially regulated genes with P < 0.05 (b) and volcano plot of gene expression with P < 0.05 (fold change in relative expression of M1-like and M2-like genes as determined by log2 (GBM/control), with upregulated genes are shown in red and downregulated genes in blue) (c). d,e, Sorted splenic macrophages (CD11cNeg CD11b+ Ly6C+) stimulated with complete RPMI (RPMI) or TCM from GL261 cells for 24 h. Quantitative PCR (qPCR) analysis of M1- and M2-linked genes (d) and of Ahr and AHR target genes (n = 3 technical replicates) (e). Data are representative of three independent experiments, with similar results obtained. ND, not detectable. f, AHR expression in GBM and Control cells (n = 3 biologically independent samples) determined by qPCR. g, Representative immunofluorescence images of human GBM stained for AHR (red), CD14 (green), CD4 (green), CD8 (green) and nuclei (DAPI; blue) (n = 3 biologically independent samples). Arrows indicate co-expression of AHR and CD14. Scale bars, 25 μm. h, Left: representative immunofluorescence images of human gliomas stained for AHR (red), CD14 (green) and nuclei (blue) from a nervous system glioma tissue array (n = 43). Arrowheads indicate co-expression of AHR and CD14. Scale bars, 20 μm. Right: quantification of the total number of CD14+ cells and AHR+ CD14+ cells in 40 glioma samples and 3 controls. Kruskal–Wallis test was used for statistical analysis. i, Ahr expression in microglia (CD45Low CD11b+), bone marrow (BM) monocytes (CD3Neg B220Neg Ly6GNeg NK1.1Neg Siglec-FNeg CD11b+ Ly6CHi) and splenic monocytes (CD11cNeg CD11b+ Ly6CHi) from naive wild-type (WT) mice and TAMs (LinNeg CD45+ CD11b+) in GL261-bearing WT mice (n = 3 biologically independent samples). Data are representative of three independent experiments, with similar results obtained. Data in d–f, h and i are shown as mean ± s.e.m. P values were determined using two-sided Student’s t-tests (b–f) or one-way ANOVA (i).
Oncometabolites in the tumor microenvironment modulate TAM phenotype and function5,19. To evaluate the role of secreted tumor metabolites on TAM modulation, we generated tumor-conditioned media (TCM) using murine GL261 glioma cells and studied the effect of the TCM on murine macrophages. We found that TCM induced the upregulation of both M1-like (Stat1, Cd274, Il1b, Tnfa and Il27) and M2-like (Arg1, Vegfa, Il10, Klf4 and Pparg) markers in splenic macrophages (Fig. 1d). This profile resembled the phenotype of TAMs in human GBM samples (Fig. 1c; Supplementary Fig. 1a). Recent studies have reported that GBM produces the AHR ligand kynurenine (KYN) and that tumor-intrinsic KYN-driven AHR signaling contributes to GBM pathogenesis20,21. AHR is an important regulator of the immune response22; however, less is known about the role of AHR in the regulation of the immune response in GBM. Thus, we investigated the effects of TCM on AHR expression and activation in TAMs. TCM upregulated the expression of Ahr and AHR-driven genes such as Cyp1a1 and Entpd1 (which encodes CD39)23 in murine macrophages (Fig. 1e). The expression of Ahr and other tolerogenic genes was also upregulated in murine macrophages stimulated with TCM generated using murine CT2A glioma cells (Supplementary Fig. 1b). We found similar results when human CD14+ monocytes were stimulated with TCM prepared using human glioma lines (Supplementary Fig. 1c).
TAM infiltration is an important determinant of tumor progression and response to therapy in GBM and other tumors5–11,17. AHR is reported to regulate the pathogenicity of glioma cells20,21, but little is known about its role in the control of GBM TAMs. When compared to microglia from healthy individuals, GBM-infiltrating TAMs displayed higher AHR expression (Fig. 1f). Moreover, we detected AHR expression by immunofluorescence in TAMs present in human GBM biopsy samples (Fig. 1g,h; Supplementary Fig. 1d). The AHR expression levels were similar to those recently found to control macrophage and microglia activation24,25. In addition, we detected an increase in the number of CD14+ cells with tumor progression, and AHR+ CD14+ cells were upregulated in grade 4 gliomas (Fig. 1h; Supplementary Fig. 1d). High Ahr expression was also detected in TAMs in the murine intracranial GL261 glioma model syngeneic in C57BL/6 mice (Fig. 1i). Thus, AHR is expressed in TAMs in human GBM and its experimental models, reflecting the upregulation of AHR expression in TAMs and/or the recruitment of peripheral AHR+ macrophages to the GBM.
STAT1 and STAT3 and miR-29b control AHR expression in TAMs.
Increased STAT1 and STAT3 expression is associated with poor survival in patients with GBM26,27. STAT128 and STAT323 are reported to promote AHR expression, and the expression of Stat1 and Stat3 is increased in TCM-treated macrophages and in patients with GBM (Fig. 1d; Supplementary Fig. 1a). Moreover, in GL261 cells, we detected the expression of interferon-β (IFN-β) and interleukin-6 (IL-6), known activators of STAT1 and STAT3 signaling, respectively, and therefore candidates to promote AHR expression in TAMs (Fig. 2a,b). Indeed, the increased expression of AHR induced by the treatment of macrophages with TCM was abrogated by an IFN-β-blocking antibody and by STAT1 or STAT3 inhibitors (Fig. 2c,d). TCM treatment of macrophages triggered the recruitment of STAT1 and STAT3 to target sites in the Ahr promoter (Fig. 2e,f,h). Moreover, STAT1 and STAT3 transactivated the Ahr promoter in reporter assays (Fig. 2g,i), suggesting that STAT1 and STAT3 activation by glioma-secreted factors promotes AHR expression in TAMs.
Fig. 2 |. STAT1, STAT3 and miR-29 control AHR expression in TAMs.

a, qPCR analysis of cytokine genes in GL261 cells (n = 3 technical replicates). b, Production of IFN-β (n = 4 independent samples) and IL-6 (n = 3 independent samples) in control media (RPMI) and TCM from GL261 cells as assessed by ELISA. Unpaired two-tailed t-test. c,d, Ahr expression in BMDMs treated with anti-IFN-β antibody or STAT1 or STAT3 inhibitor for 15 min and stimulated with RPMI or TCM from GL261 cells for 24 h (n = 3 technical replicates). e, STAT1 and STAT3 binding sites in the Ahr promoter. The arrows indicate primers designed to study STAT1 (sites 1 and 2) and STAT3 (site 3) recruitment. f, ChiP analysis of STAT1 recruitment to the Ahr promoter in BMDMs stimulated with TCM (n = 3 technical replicates). g, Luciferase activity in HEK293 cells transfected with a luciferase reporter construct driven by the Ahr promoter (pAhR-Luc) and a construct encoding constitutively activated STAT1 (n = 3 technical replicates). h, STAT3 recruitment to the Ahr promoter in BMDMs stimulated with TCM as assessed by ChIP (n = 3 technical replicates). i, Luciferase activity in HEK293 cells transfected with a luciferase reporter driven by the AHR promoter (pAhR-Luc) and a construct encoding constitutively activated STAT3 (n = 4 technical replicates). j, Predicted miR-29 binding sites in the 3′ UTR of AHR. The asterisks indicate nucleotides mutated for the luciferase reporter assay. k, miR-29a and miR-29b expression determined by qPCR in TAMs (LinNeg CD45+ CD11b+) sorted from the brain of naive (Control) or GL261 cell-implanted (GBM) WT mice (n = 3 biologically independent samples). l, Correlation between patient survival and miR-29a, miR-29b and miR-29c expression levels (high or low) in GBM based on TCGA data (n = 91 biologically independent samples). Log-rank test was used for statistical analysis. m,n, miR-29b ectopic expression suppresses Ahr mRNA (m) and AHR protein (n) expression in RAW264.7 macrophages (n = 3 biologically independent samples). The immunoblot images are cropped; full scans are shown in Supplementary Fig. 2a. o, Luciferase activity measured 48 h post-transfection of an AHR 3′-UTR-driven luciferase reporter co-transfected with a miR-29b mimic (miR-29b) or control oligonucleotides (control) (n = 3 biologically independent samples). The following luciferase reporters were used: empty plasmid (Empty), plasmid with intact human AHR 3′-UTR (hAHR) and plasmid with human AHR 3′-UTR containing miR-29b mutant binding site (hAHRmut). Data are representative of two (c, d, f, h, i, k, m–o) or three (a) independent experiments, with similar results obtained. Data in a–d, f–i and k–o are shown as mean ± s.e.m. P values were determined by two-sided Student’s t-testa (b, g, i, k and n) or one-way ANOVA (c, d, f, h, m and o).
We then investigated the control of AHR expression in TAMs. AHRR and TIPARP are known suppressors of AHR signaling22, but we did not find a significant association between AHRR and TIPARP expression and survival in the two cohorts of patients with GBM29,30. A bioinformatics analysis of the AHR locus identified an evolutionary conserved binding site for the microRNA genes MIR29A (which encodes miR-29a), MIR29B (miR-29b) and MIR29C (miR-29c) in the 3′ untranslated region (UTR) of AHR (Fig. 2j), suggesting that miR-29 molecules suppress AHR expression. Indeed, miR-29a and miR-29b and Ahr expression were inversely correlated in TAMs (Fig. 2k, and compare to Fig. 1i); however, miR-29c was not detected in these cells. An analysis of The Cancer Genome Atlas (TCGA) data showed that high expression of miR-29b was associated with increased survival in patients with GBM (Fig. 2l), while no significant association was found with miR-29a or miR-29c expression. Thus, we investigated the effects of miR-29b on AHR expression.
Overexpression of miR-29b suppressed AHR expression in macrophages (Fig. 2m,n; Supplementary Fig. 2a). To investigate whether this observation indicates that miR-29b directly regulates AHR expression, we cloned the 3′ UTR of AHR downstream of a luciferase reporter. miR-29b overexpression reduced luciferase activity, and this suppressive effect was abolished when the miR-29 binding site in the 3′ UTR of AHR was disrupted by site-directed mutagenesis (Fig. 2o). Hence, these data suggest that decreased miR-29b expression contributes to AHR upregulation in TAMs. Collectively, these data identify STAT1 and STAT3 as positive regulators and miR-29b as a negative regulator of AHR expression in TAMs.
AHR modulates TAM recruitment and tumor growth.
AHR signaling affects the function of multiple cell types in the adaptive and innate immune system22. To interrogate the role of AHR expressed in myeloid cells in tumor pathology, we generated AHRLysM mice by crossing loxP-flanked AHR mice (AHRloxP/loxP) with LysM-Cre mice. In AHRLysM mice, AHR deletion was restricted to CD11b+ cells and did not affect T or B cells (Supplementary Figs. 2b and 3a–d). We also detected a slight decrease in Ahr expression in dendritic cells and in neutrophils, which constitute less than 3% of CD45+ CD11b+ glioma-infiltrating cells (Supplementary Fig. 3e,f). Moreover, the frequency of microglia and peripheral B and T cells was unaffected, as well as the total number of macrophages and inflammatory monocytes in naive AHRLysM mice (Supplementary Fig. 3g,h). Following intracranial implantation of GL261 glioma cells, we detected reduced tumor growth and increased survival in AHRLysM mice (Fig. 3a,b), concomitant with a lower frequency of TAMs (Fig. 3c). A similar increase in survival was detected following intracranial implantation of CT2A cells in AHRLysM mice (Supplementary Fig. 3i).
Fig. 3 |. AHR modulates TAM recruitment and tumor growth.

a, Tumor size in WT and AHRLysM mice 17 days after GL261-luciferase cell implantation (n = 4 independent mice). Representative images from each group are shown on the left and quantification of tumor size on the right. Unpaired two-tailed t-test. b, Survival curve analysis from WT and AHRLysM mice implanted intracranially with GL261 cells (n = 12 independent mice). Survival analysis was performed using a Kaplan–Meier plot using a log-rank (Mantel–Cox) test. c, Percentage of TAMs (LinNeg CD45+ CD11b+) in WT and AHRLysM mice implanted with GL261 cells. d,e, Percentage of microglia (CD11b+ CD45Low) and peripheral infiltrated macrophages (CD11b+ CD45Hi) in TAMs gated from naive WT mice and GBM WT and AHRLysM mice 15 days after GL261 cell implantation (n = 4 independent mice) (d), and 28 days after CT2A cell implantation (n = 3 independent mice) (e). Representative flow cytometry plots from each group are shown on the left and quantification analyses are on the right. f, Migration of WT and AHRLysM sorted splenic macrophages (CD11b+ Ly6C+) exposed to a gradient of CCL2 or PBS in the presence of an AHR inhibitor or vehicle (n = 3 technical replicates). g, Ccr2 mRNA expression in sorted peripheral infiltrated macrophages from GBM WT and AHRLysM (n = 3 biologically independent samples). h, CCR2 expression in splenic macrophages (CD11cNeg CD11b+ Ly6C+) from naive WT and AHRLysM mice (n = 3 biologically independent samples). APC, allophycocyanin; PE, phycoerythrin; FMO, fluorescence minus one. Data are representative of two (a, c–h) or three (b) independent experiments, with similar results obtained. Data in a, d–h are shown as mean ± s.e.m. P values were determined by two-sided Student’s t-tests (a, g and h) or one-way ANOVA (d, e and f).
TAMs in GBM are derived from microglia and peripheral macrophages15,31. We detected a decrease in the contribution of peripheral macrophages to TAMs in AHRLysM mice following intracranial implantation of GL261 glioma cells (Fig. 3d; Supplementary Fig. 3j,k). Similar results were observed in AHRLysM mice following intracranial implantation of CT2A glioma cells (Fig. 3e). Peripheral macrophages are recruited to the TAM compartment via CCR2 signaling triggered by CCL2 and CCL732. Indeed, we detected Ccl2 and Ccl7 expression in brain tumors isolated from wild-type mice implanted with GL261 cells, whereby Ccl2 was expressed at higher levels than Ccl7 (Supplementary Fig. 3l). We also detected Ccl2 and Ccl7 expression in CT2A cells (Supplementary Fig. 3m), as well as CCL2 protein in TCM from human GBM samples (Supplementary Fig. 3n). It is likely, however, that in vivo these and additional chemokines are produced both by tumor cells and by other cells, such as microglia and astrocytes, in the tumor microenvironment28,33.
We investigated the role of AHR in TAM recruitment. AHR-deficient CD11b+ macrophages showed decreased migration toward a CCL2 gradient in vitro (Fig. 3f). Similar results were observed when we treated wild-type macrophages with an AHR inhibitor at the initiation of the migration assay (Fig. 3f), ruling out that the decreased migration observed in AHR-deficient CD11b+ macrophages reflects differences in the starting cell populations.
To identify the mechanism by which AHR promotes migration in response to CCL2, we analyzed the expression of the CCL2 receptor CCR2. We detected decreased expression of CCR2 in splenic macrophages isolated from naive AHRLysM mice and in TAMs isolated from AHRLysM mice implanted intracranially with GL261 cells (Fig. 3g,h). This suggests that AHR promotes TAM recruitment by driving CCR2 expression. However, the decrease in CCR2 expression was only partial, suggesting that other signaling pathways besides AHR control CCR2 expression in TAMs34,35 and/or that AHR regulates CCR2 expression only in specific macrophage populations.
Collectively, these findings suggest that AHR controls the recruitment of peripheral macrophages to GBM. Moreover, considering the upregulation of AHR expression in macrophages by TCM, these findings suggest that the increase in AHR+ TAMs associated with GBM progression reflects both the recruitment of peripheral AHR+ macrophages and the upregulation of AHR expression in the tumor microenvironment.
KYN controls TAM activation via AHR signaling.
We next investigated the role of AHR in TAM function. AHR deficiency in AHRLysM mice led to a reduced expression of genes associated with M2-like macrophages and the upregulation of pathways linked to the M1-like phenotype in TAMs (Fig. 4a,b; Supplementary Fig. 4a), indicating that AHR controls TAM polarization.
Fig. 4 |. KYN controls TAM activation via AHR.
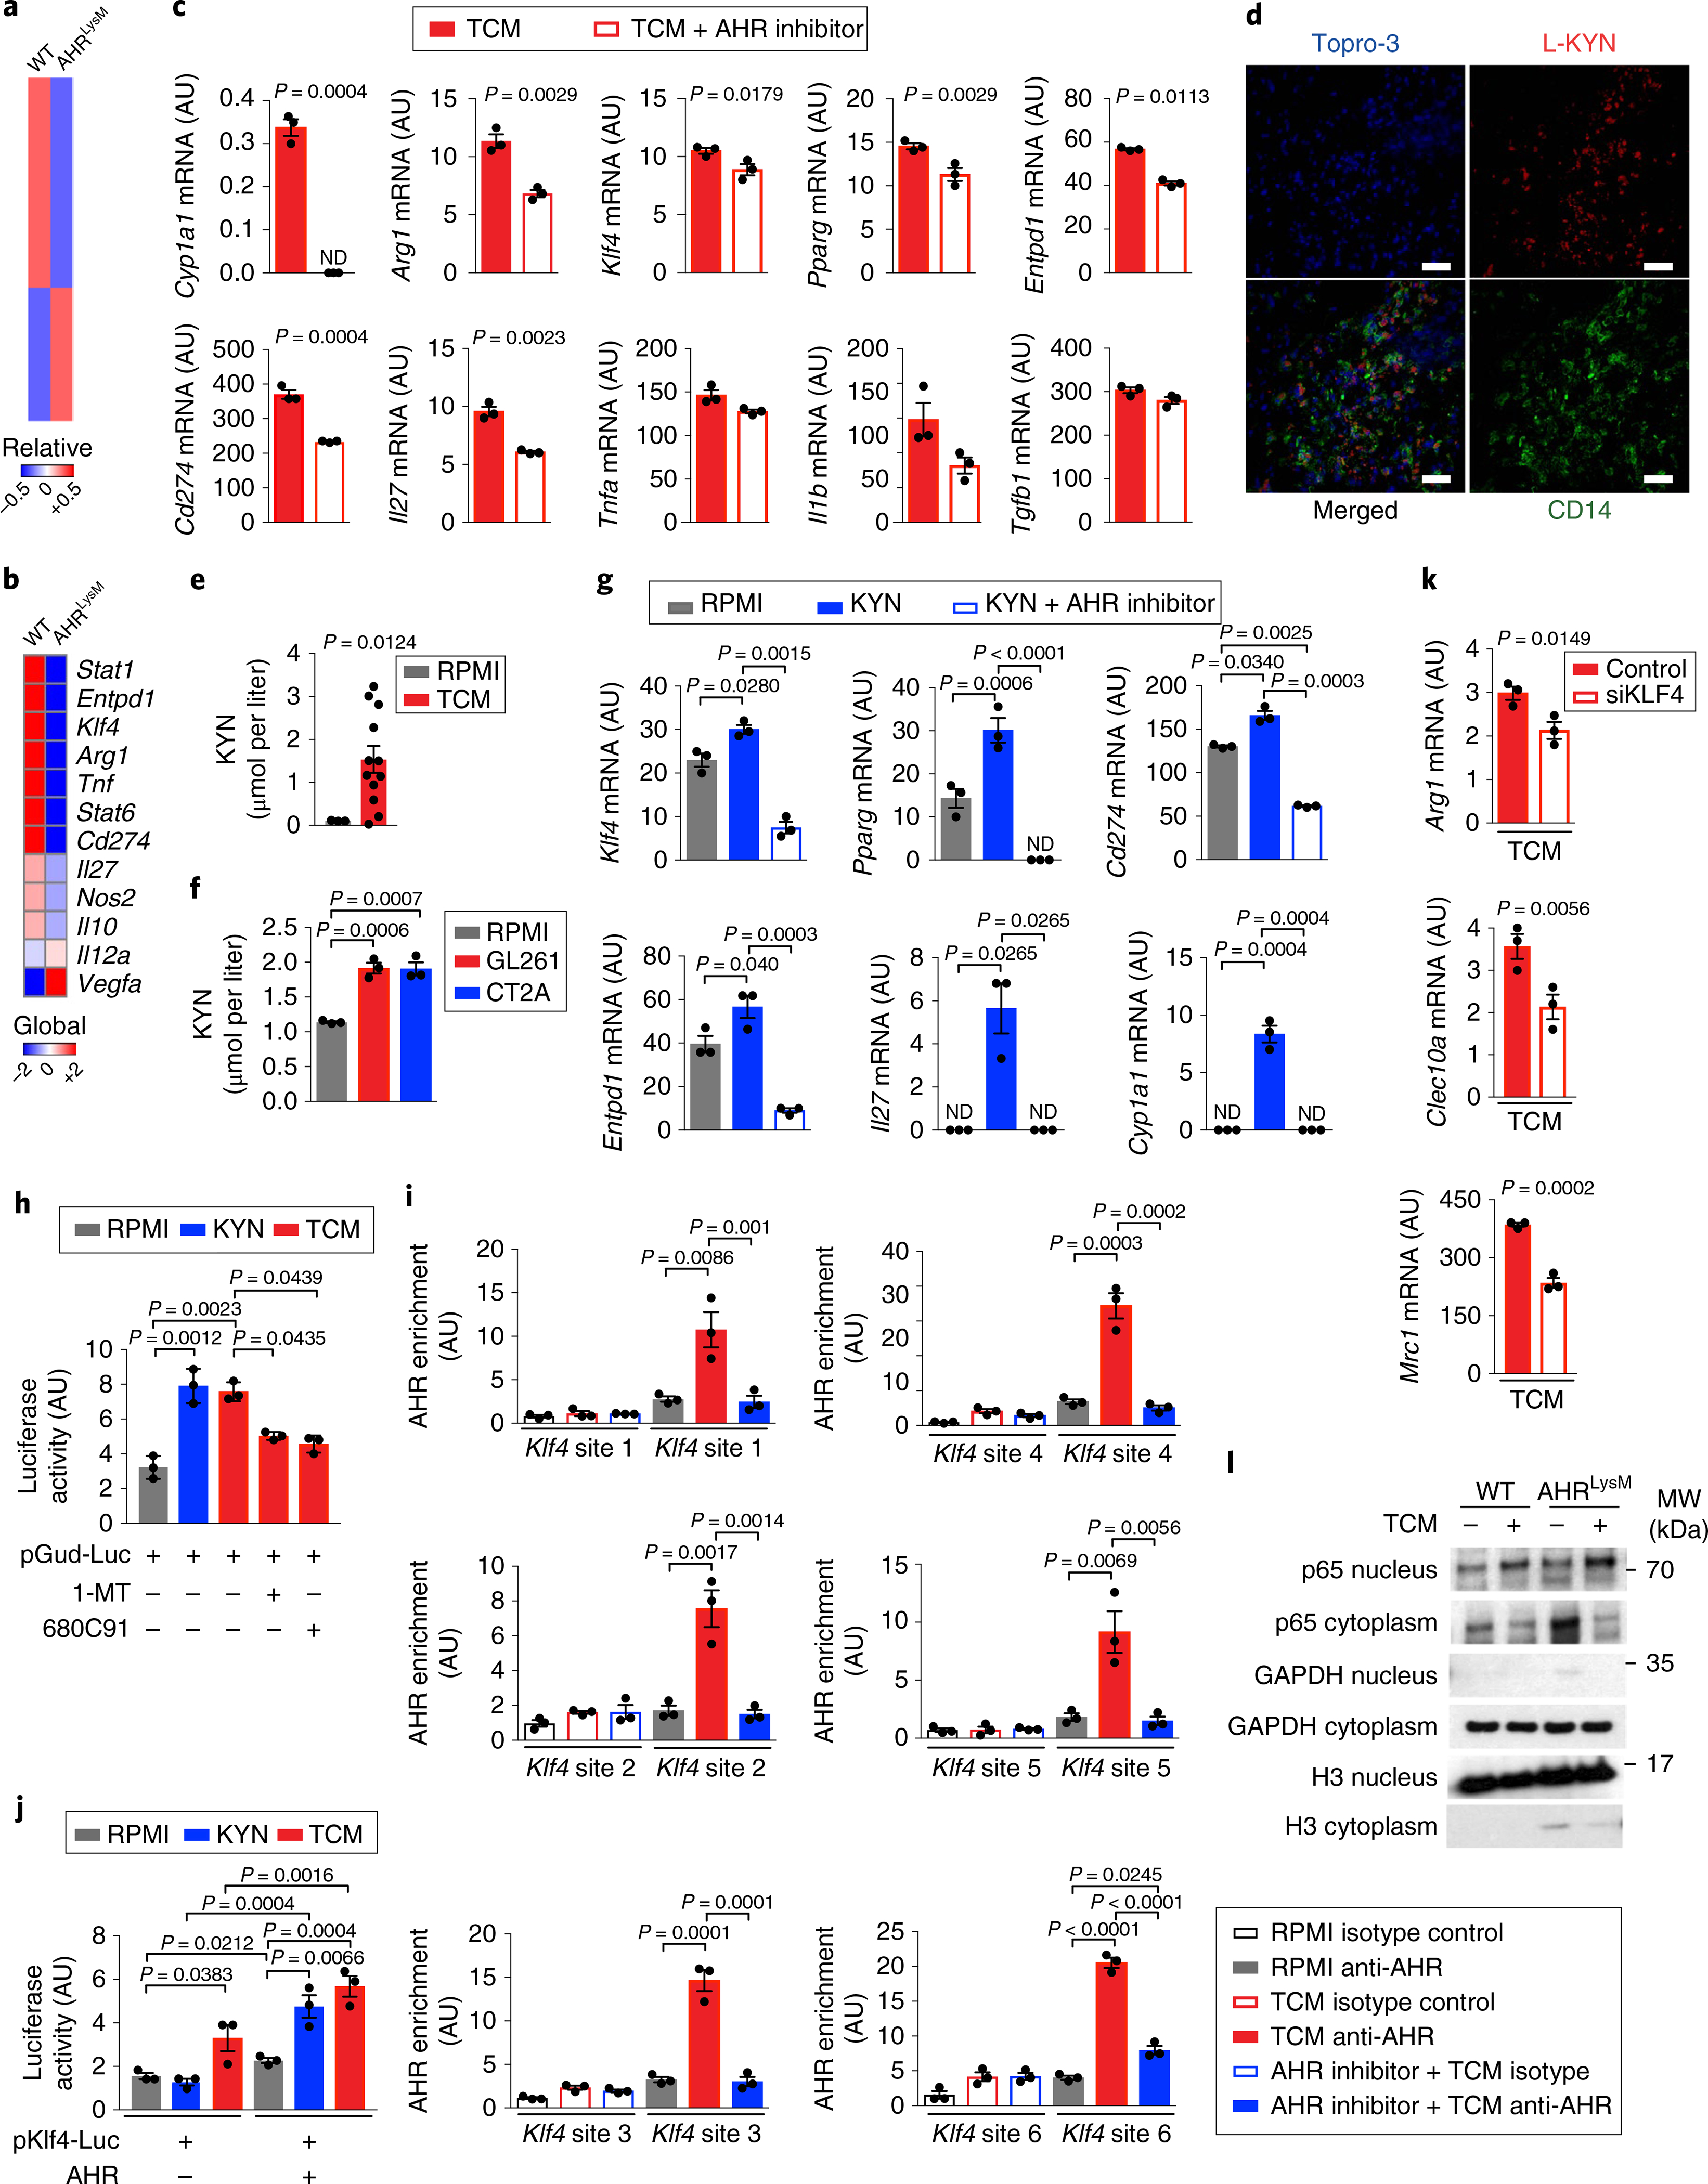
a,b, Nanostring analysis of peripheral infiltrated macrophages (LinNeg CD11b+ CD45Hi) in GBM from WT and AHRLysM mice 15 days after GL261 cell implantation (pool of 4 mice per group). Heatmaps of global gene expression (a) and macrophage polarization genes (b). c,g, Expression of M1- and M2-like genes by qPCR in splenic macrophages from WT mice treated with an AHR inhibitor or vehicle for 15 min and stimulated with TCM (c) or L-KYN (g) for 24 h (n = 3 technical replicates). d, Representative images of human GBM tissue (n = 3 biologically independent samples) stained for KYN (red), CD14 (green) and Topro-3 (blue). Scale bars, 50 μm. e,f, KYN levels in human (n = 12 biologically independent samples) (e) and mouse TCM (n = 3 biologically independent samples) (f). h, Luciferase activity in HEK293 cells transfected with a luciferase construct driven by an AHR-responsive promoter (pGud-luc). Cells were treated with a TDO inhibitor (680C91) or an IDO-1 inhibitor (1-MT) for 15 min and stimulated with TCM or KYN for 24 h (n = 3 technical replicates). i, AHR recruitment to the Klf4 promoter in BMDMs treated with TCM in the presence or absence of an AHR inhibitor as assessed by ChIP (n = 3 technical replicates). j, Luciferase activity in RAW264.7 cells transfected with a luciferase construct driven by the KLF4 promoter alone and AHR, incubated with TCM or KYN for 24 h (n = 3 technical replicates). k, qPCR analysis of KLF4 target genes in TCM-stimulated BMDMs depleted of KLF4 by siRNA (siKLF4) (n = 3 technical replicates). l, Western blot analysis of NF-κB (p65) activation in BMDMs stimulated with TCM for 90 min from WT and AHRLysM mice. H3, histone H3. Images are cropped; full scans are shown in Supplementary Fig. 2c. Data in c, g–l are representative of two independent experiments, with similar results obtained. Data in c, e–k are shown as mean ± s.e.m. P values were determined by two-sided Student’s t-tests (c, e and k) or one-way ANOVA (f–j).
AHR is a transcription factor whose activity is regulated by small molecules provided via metabolism and the environment22. Based on the effects of AHR deletion on TAM polarization in vivo (Fig. 4a,b; Supplementary Fig. 4a), and our observation that tumor supernatants induce the expression of M2-associated transcripts in human and murine systems (Fig. 1d; Supplementary Fig. 1b,c), we investigated the role of AHR on the modulation of TAMs by secreted glioma products. AHR inhibition suppressed the upregulation of M2-associated transcripts induced in macrophages by TCM (Fig. 4c).
KYN is a tryptophan-derived metabolite with anti-inflammatory activity and is produced during inflammation36 and by tumor cells21 as a result of the enzymatic activity of indoleamine 2,3-dioxygenase-1 (IDO-1) and tryptophan 2,3-dioxygenase (TDO-2). We detected KYN in human GBM samples in proximity to CD14+ cells (Fig. 4d), suggesting that macrophages are affected by KYN in the tumor microenvironment. KYN was also detected in TCM from human GBM samples and in TCM prepared from GL261 and CT2A cells (Fig. 4e,f). Treatment with KYN increased the expression of tolerogenic genes on macrophages in vitro, and this effect was abrogated by AHR inhibition (Fig. 4g). Moreover, KYN and TCM transactivated an AHR-responsive promoter reporter, and this activation was abrogated when the TCM was prepared using cells treated with IDO-1 or TDO-2 inhibitors (Fig. 4h).
To further investigate the impact of KYN on AHR activation and macrophage polarization, we knocked down Tdo2 and Ido1 in GL261 cells using a lentivirus-delivered short hairpin RNA construct (shTdo2/Ido1). Tdo2 and Ido1 silencing in GL261 cells delayed tumor growth in vivo, while it concomitantly reduced the expression of the immunosuppressive gene Arg1 in TAMs (Supplementary Fig. 4b–d). We also detected Ido1, but not Tdo2, expression in CT2A cells (Supplementary Fig. 4e). Altogether, these data demonstrate that the AHR signaling that is triggered by glioma-secreted KYN modulates the phenotype of TAMs.
Krüppel-like factor 4 (KLF4) is expressed in TAMs in an AHR-dependent manner (Fig. 4b,c). KLF4 is reported to drive the expression of genes associated with the M2-like phenotype in peripheral macrophages during inflammation (for example Arg1)37. Thus, we studied the role of KLF4 in the transcriptional control of macrophages by AHR.
Treatment of macrophages with TCM triggered the recruitment of AHR to its target sites in the Klf4 promoter; however, this recruitment was suppressed by AHR inhibition (Supplementary Fig. 4f,i). Moreover, in reporter assays, TCM and KYN transactivated the Klf4 promoter in an AHR-dependent manner (Fig. 4j). To study the role of KLF4 in the transcriptional program that is induced in TAMs by TCM, we knocked down Klf4 with short interfering RNAs (siRNAs) and stimulated macrophages with TCM in vitro (Supplementary Fig. 4g). The knockdown of Klf4 abrogated the upregulation of its M2-linked transcriptional targets Arg1, Mrc1 and Clec10a, but not the M1-related genes induced by TCM (Fig. 4k; Supplementary Fig. 4h).
Nuclear factor-κB (NF-κB) signaling in TAMs promotes tumor-specific immunity and suppresses tumor growth2. Interestingly, both KLF437 and AHR28,38 have been shown to suppress NF-κB-driven gene expression. An analysis of the transcriptional program of TAMs in AHRLysM macrophages revealed a significant (P = 2.51 × 10−37) upregulation of the NF-κB pathway (Supplementary Fig. 4i). Moreover, Ahr deletion led to increased NF-κB activation in macrophages treated in vitro with TCM (Fig. 4l; Supplementary Fig. 2c).
AHR is reported to limit NF-κB signaling via a mechanism mediated by SOCS2 upregulation and TRAF6 degradation28,38. We detected decreased Socs2 expression and increased TRAF6 levels in TCM-stimulated macrophages from AHRLysM mice (Supplementary Figs. 2d and 4j,k). Altogether, these data suggest that AHR controls TAM polarization through multiple mechanisms involving KLF4 and SOCS2.
AHR-driven CD39 expression in TAMs impairs the T cell response.
Our transcriptional analysis suggested that TCM drives the expression of the ectonucleotidase CD39 in macrophages in an AHR-dependent manner (Fig. 4c,g). Indeed, similar to our previous findings with AHR+ TAMs, we detected that CD39+ TAMs increased in association with GBM progression (Fig. 5a). In support of a role of AHR in driving CD39 expression in TAMs, CD39 expression was decreased in AHRLysM mice (Fig. 5b). Moreover, both TCM and KYN induced AHR recruitment to the Entpd1 promoter23, and TCM and AHR transactivated the Entpd1 promoter in reporter assays (Fig. 5c,d). Collectively, these data suggest that AHR promotes CD39 expression in TAMs.
Fig. 5 |. AHR-driven CD39 expression in TAMs impairs the T cell response.
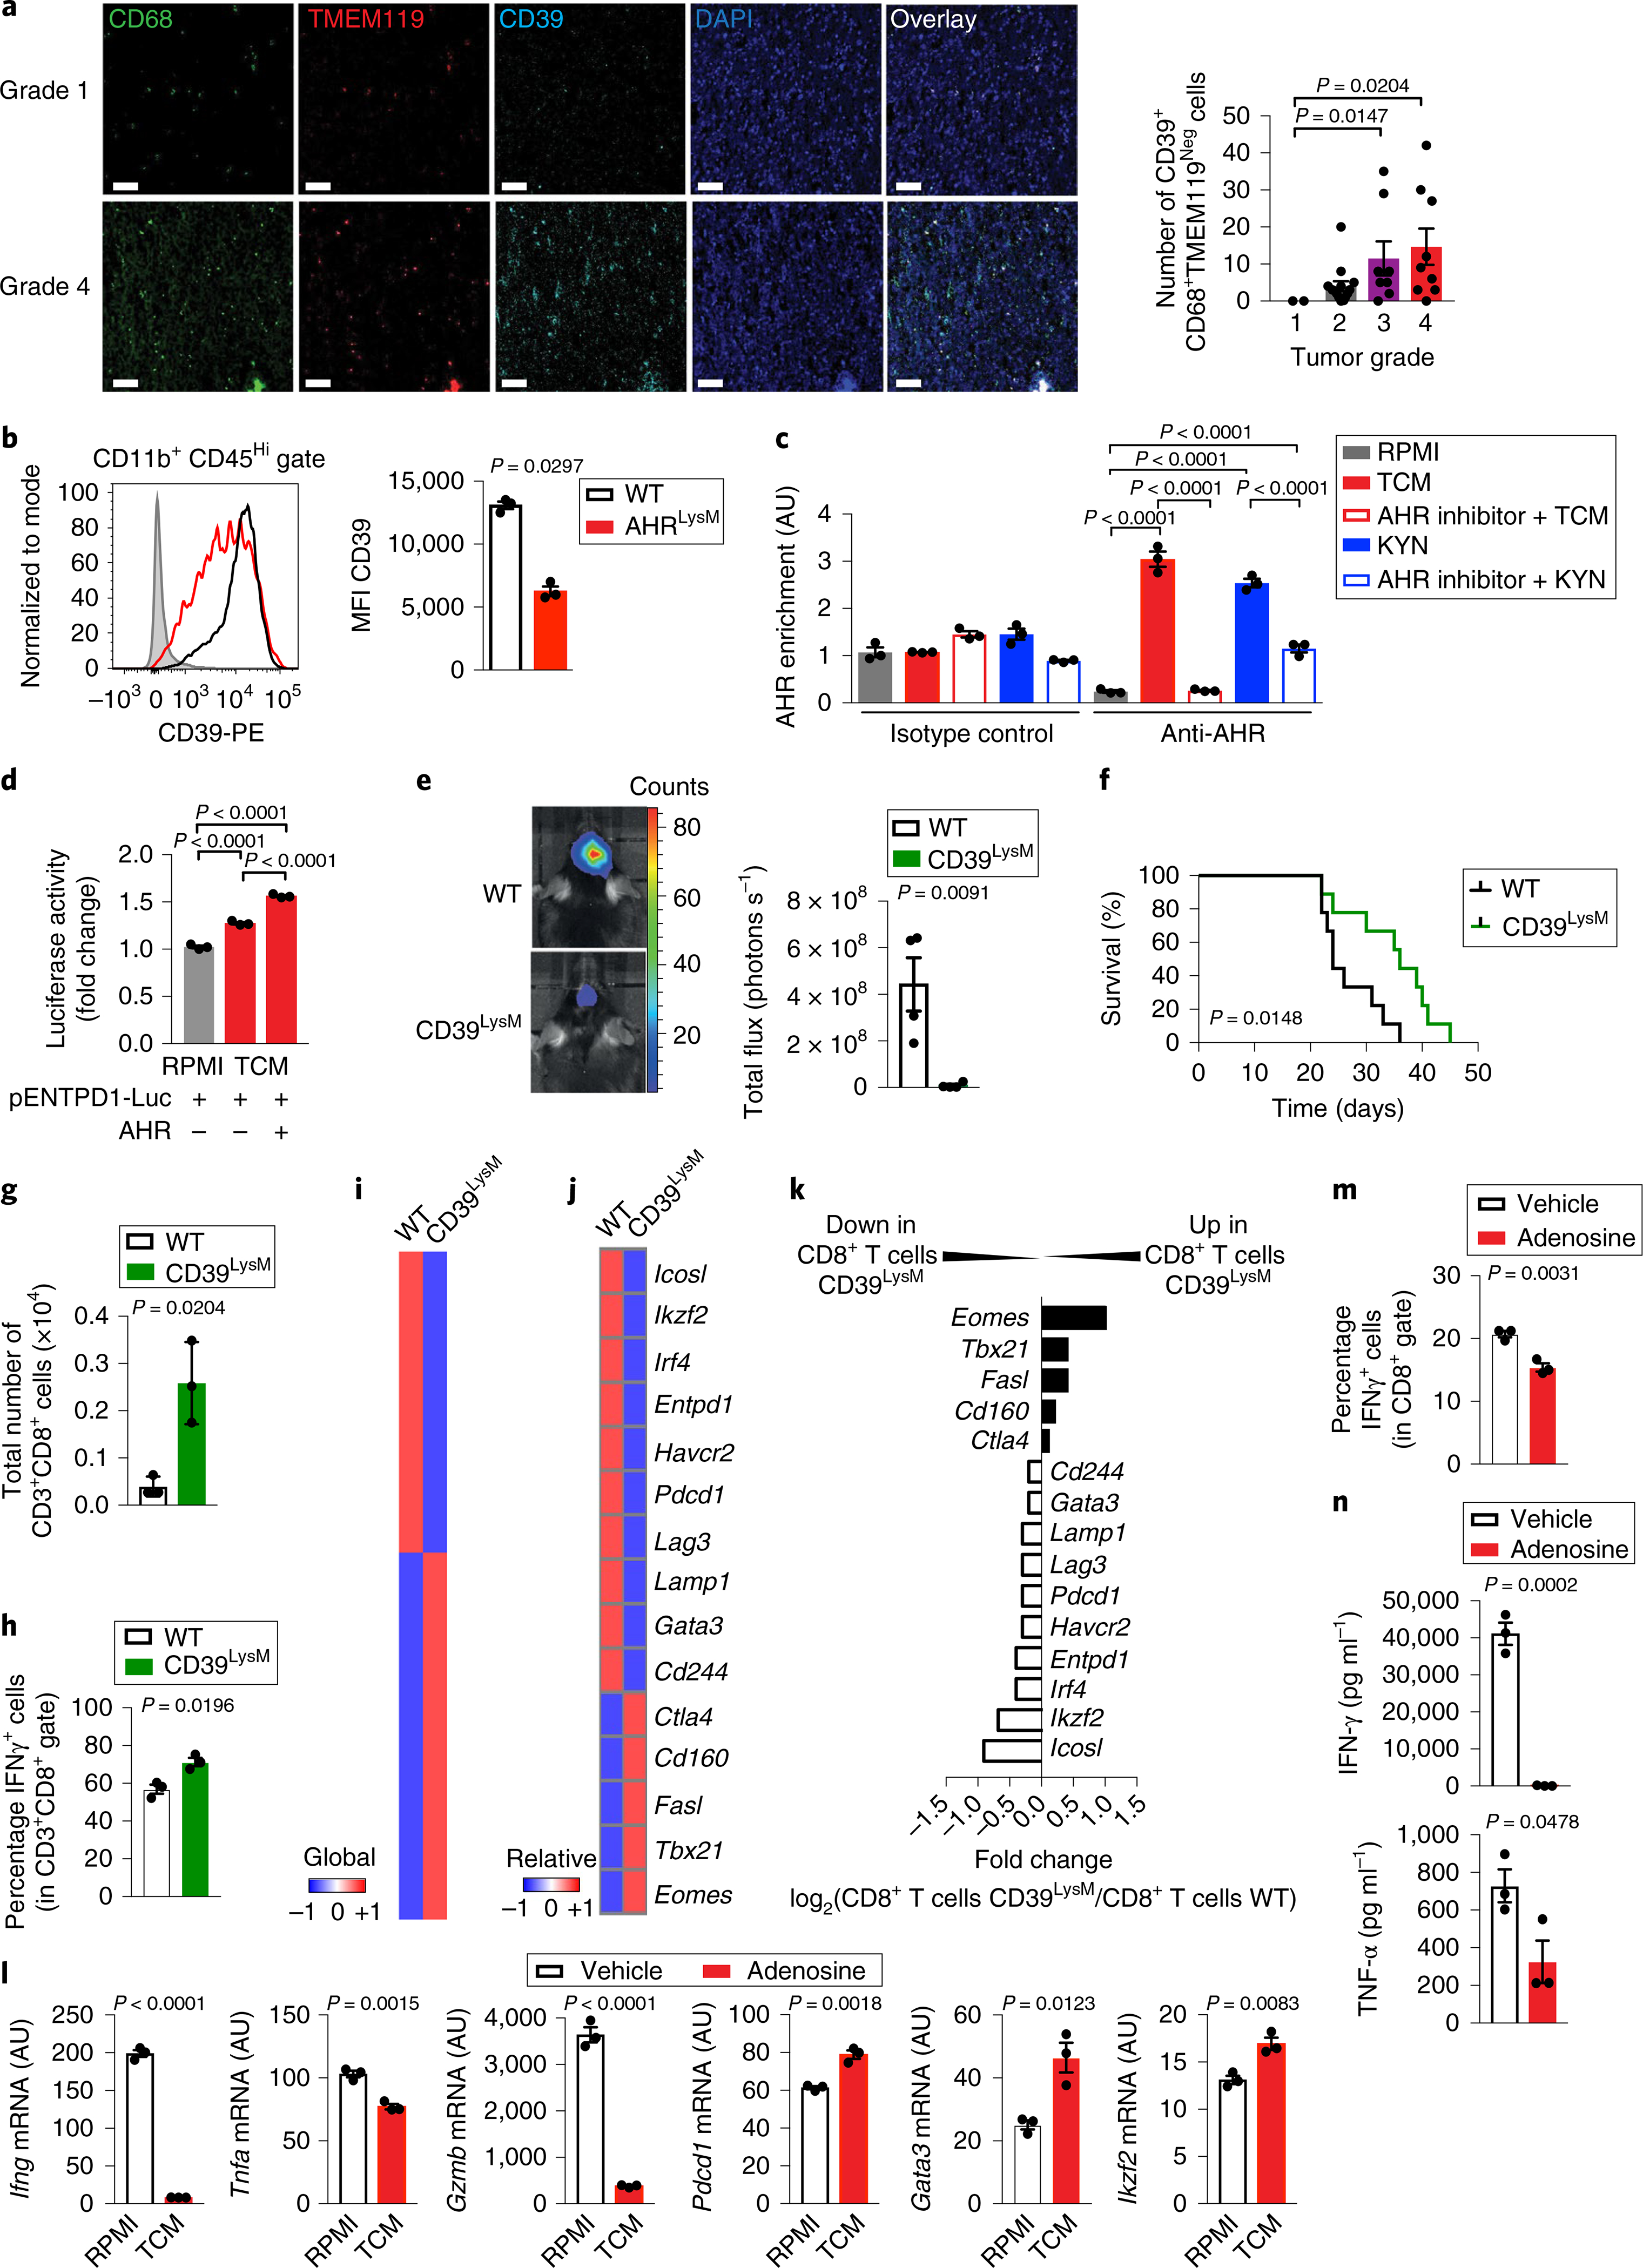
a, Left: representative immunofluorescence images of tissue array from human gliomas stained for TMEM119 (red), CD68 (green), CD39 (cyan) and nuclei (blue). Scale bars, 20 μm. Right: quantification of the total number of CD39+ CD68+ TMEM119Neg cells in 33 glioma samples classified as grade 1 (n = 2), grade 2 (n = 14), grade 3 (n = 8) or grade 4 (n = 9). Kruskal–Wallis test. b, Flow cytometry analysis of CD39 expression in peripheral infiltrated macrophages in TAMs (LinNeg CD11b+ CD45Hi) gated from WT and AHRLysM mice 17 days after GL261 cell implantation (n = 3 independent mice). Representative histogram shown on the left and quantification analysis on the right. c, AHR recruitment to the Entpd1 promoter as assessed by ChIP in KYN- or TCM-stimulated BMDMs in the presence or absence of an AHR inhibitor (n = 3 technical replicates). d, Relative expression of luciferase activity in HEK293 cells transfected with a luciferase reporter driven by the ENTPD1 promoter alone, or with a construct coding for AHR, and stimulated TCM for 24 h. RPMI condition was the reference sample (n = 3 technical replicates). e, Representative images from intracranial tumors in WT and CD39LysM mice 21 days after GL261-luciferase cell implantation (n = 4 independent mice). f, Survival curve analysis of WT and CD39LysM mice implanted intracranially with GL261-luciferase cells (n = 8 independent mice). g,h, Total number of TILs (CD3+ CD8+) (g) and percentage of IFN-γ+ cells in TILs (h) gated from WT and CD39LysM mice 15 days after GL261-luciferase cell implantation (n = 3 independent mice). i–k, Nanostring analysis of sorted CD8+ TILs from WT and CD39LysM mice 15 days after GL261-luciferase cell implantation (pool of 5 mice per group). Heatmap of gene expression for all genes (i) and of T cell dysfunction-related genes (j). k, Ratio of the expression of genes related to CD8+ T cell dysfunction in WT and CD39LysM mice. l–n, Naive CD8+ T cells purified using beads activated with anti-CD3 and anti-CD28 monoclonal antibodies in the presence or absence of adenosine for 48 h (n = 3 technical replicates for all analyses). Expression levels of T cell effector and dysfunction genes were analyzed by qPCR (l), frequency of IFN-γ+ cells in CD8+ T cells by FACS (m) and cytokines production by ELISA (n). Data in b–h and l–n are representative of two independent experiments; similar results were obtained. Data in a–e, g, h, l–n are shown as mean ± s.e.m. P values were determined by two-sided Student’s t-tests (b, e, g, h, l–n) or one-way ANOVA (a, c and d), and survival analysis was performed using a Kaplan–Meier plot using a log-rank (Mantel–Cox) test (f).
CD39 cooperates with CD73 to generate the nucleotide adenosine, which has been associated with the suppression of tumor-specific T cell immunity39. CD39 expression contributes to the suppressive function of Treg cells in the context of autoimmunity and cancer23,39,40. We hypothesized that AHR-driven CD39 expression in TAMs elevates adenosine production in the tumor microenvironment, leading to the suppression of tumor-specific T cell responses. However, the role of CD39 expressed in TAMs on the immune response is unknown, mostly because of the lack of mouse strains that enable the cell-specific deletion of CD39. Thus, we generated loxP-flanked Entpd1 (CD39) mice (CD39loxP/loxP) in which Entpd1 exons 5 and 6 are flanked with loxP sites, and crossed them to LysM-Cre mice to generate CD39LysM mice (Supplementary Fig. 5a,b). CD39LysM mice showed normal CD39 expression in T cells and FOXP3+ Treg cells, and harbored normal numbers of CD3+, CD8+, CD4+ and FOXP3+ T cells in naive mice (Supplementary Fig. 5c–e). Entpd1 deletion in myeloid cells reduced tumor growth and increased survival following intracranial implantation of GL261 cells (Fig. 5e,f).
Based on the reported effects of TAMs on tumor-specific immunity1–3, we analyzed CD8+ tumor-infiltrating T cells (CD8+ TILs). CD8+ T cell depletion abrogated the phenotype of AHRLysM mice, suggesting that AHR in TAMs controls tumor growth through its effects on CD8+ T cells (Supplementary Fig. 5f). Indeed, we detected an increase in total CD8+ TILs and IFN-γ+ CD8+ TILs in AHRLysM mice and CD39LysM mice implanted with GL261 and CT2A cells (Fig. 5g,h; Supplementary Fig. 5g–j). No significant difference was detected in the frequency of tumor-infiltrating FOXP3+ Treg cells between wild-type and AHRLysM mice (Supplementary Fig. 5h,j). An analysis of the transcriptional profile of CD8+ TILs revealed that Entpd1 deletion in myeloid cells downregulated the expression of genes associated with T cell dysfunction in cancer, such as Lag3, Entpd1, Havcr2, Pdcd1, Gata3 and Ikzf241,42 (Fig. 5i–k). Altogether, these data suggest that AHR-driven CD39 expression in TAMs promotes CD8+ T cell dysfunction.
Based on the role of adenosine in the control of T cells and our findings on TILs in CD39LysM mice, we analyzed the effects of adenosine on CD8+ T cells in vitro. The activation of naive CD8+ T cells in the presence of adenosine led to the upregulation of molecules associated with T cell dysfunction (Pdcd1, Gata3 and Ikzf2) and decreased the expression of Ifng, Tnfa and Gzmb (Fig. 5l). Accordingly, CD8+ T cell activation in the presence of adenosine resulted in a lower expression of IFN-γ and tumor necrosis factor-α (TNF-α) (Fig. 5m,n), resembling the phenotype of CD8+ TILs. Taken together, these data suggest that adenosine produced by CD39 on TAMs promotes CD8+ TIL dysfunction.
Association of AHR-driven transcriptional response to clinical outcome in GBM.
Finally, we studied the association of AHR with GBM progression in humans. We detected higher KYN levels in aggressive grade 4 gliomas (GBM) than in lower grade gliomas (Fig. 6a). We also detected an increased expression of genes linked to AHR and its effects on TAMs in TCGA data30 corresponding to grade 4 gliomas (Fig. 6b). Of note, we also found highest CCL2 and CCR2 expression in patients with mesenchymal GBM (Fig. 6c), in agreement with reports of higher TAM infiltration in mesenchymal GBM.
Fig. 6 |. Association of AHR transcriptional response to clinical outcome in GBM.

a, Left: representative immunofluorescence images of tissue array with non-tumor (n = 3) and human gliomas of different grades (n = 40) stained for KYN (green) and nuclei (blue). Scale bars, 20 μm. Right: quantification of KYN+ cells in non-tumor brain (n = 3) and tumors of grade 1 (n = 9), grade 2 (n = 16), grade 3 (n = 11) and grade 4 (n = 4). b, Heatmap of gene expression in GBM (n = 151) and lower-grade glioma (LGG, n = 527) samples generated using data shown in Supplementary Table 2 and arranged in the following order: group: GBM, LGG; grade: G2, G3 (LGG), G4 (GBM); LGG subclass: anaplastic astrocytoma, anaplastic oligoastrocytoma, astrocytoma, oligoastrocytoma, oligodendroglioma; GBM subclass: classical, G-CIMP, mesenchymal, neural, proneural; IDH mutant: no, yes. NA, not applicable or missing data. c, CCR2 and CCL2 mRNA RNA sequencing by expectation maximization (RSEM) from GBM patients with proneural (n = 29), neural (n = 26) or mesenchymal (n = 49) types using TCGA data (Supplementary Table 3). For a and c, each symbol represents one individual, and data are shown as mean ± s.e.m. P values were determined by one-way ANOVA.
Using TCGA data, we built a multivariate model in a forward fashion using relevant variables (age, gender, gene-expression subtype43, isocitrate dehydrogenase 1 (IDH1) mutation status and treatment) (Table 1). In the univariate analysis, we confirmed previous findings regarding the effects of age, temozolomide treatment, proneural glioma-CpG island methylator phenotype (G-CIMP) subtype and IDH1 mutation on survival29,43. Moreover, using published gene expression data29 in the multivariate model adjusted for age, expression subtype, IDH mutation and treatment, high AHR expression was associated with a significant increase in mortality. High expression of CYP1A1 and STAT1 were also associated with worse prognosis (Table 1). The effect of AHR on survival was independent of the tumor gene-expression subtype43 and treatment (Table 1). Similar results were obtained when we repeated these analyses in an additional set of samples30 (Supplementary Table 1). Taken together, these data support a role for AHR in GBM pathogenesis (Supplementary Fig. 6).
Table 1 |.
Univariate and multivariate analysis of overall survival of TCGA GBM patients using data shown in Supplementary Table 4, obtained from a previous study30
| Hazard ratio | 95% Confidence intervals | P value | |
|---|---|---|---|
| Univariate analysis | |||
| Age | 1.04 | 1.02–1.06 | <0.0001 |
| Gender (male) | 0.77 | 0.52–1.16 | 0.21 |
| TCGA expression subtype | |||
| Mesenchymal | Reference | – | – |
| Proneural non-G-CIMP | 1.24 | 0.70–2.19 | 0.46 |
| Proneural G-CIMP | 0.21 | 0.05–0.90 | 0.04 |
| Neural | 1.01 | 0.57–1.79 | 0.97 |
| Classical | 0.91 | 0.54–1.55 | 0.74 |
| IDH1 mutated | 0.24 | 0.06–0.98 | 0.05 |
| MGMT methylated | 0.65 | 0.40–1.04 | 0.08 |
| Treatment with temozolomide (being treated) | 0.28 | 0.19–0.43 | <0.0001 |
| RNA expression (high versus low by median) | |||
| AHR | 1.55 | 1.03–2.32 | 0.03 |
| ENTPD1 | 0.85 | 0.57–1.28 | 0.45 |
| KLF4 | 1.13 | 0.76–1.68 | 0.55 |
| CYP1A | 1.5 | 1.00–2.25 | 0.06 |
| STAT1 | 1.14 | 0.76–1.70 | 0.53 |
| STAT3 | 1.07 | 0.72–1.59 | 0.74 |
| CCL2 | 1.57 | 1.03–2.40 | 0.04 |
| CCR2 | 1.43 | 0.95–2.14 | 0.08 |
| Multivariate model (adjusted by age, expression subtype, IDH1 mutation and treatment) | |||
| High AHR expression | 1.58 | 1.01–2.47 | 0.05 |
| High ENTPD1 expression | 0.96 | 0.63–1.45 | 0.84 |
| High KLF4 expression | 1.46 | 0.96–2.22 | 0.07 |
| High CYP1A1 expression | 1.68 | 1.10–2.55 | 0.02 |
| High STAT1 expression | 1.58 | 1.01–2.48 | 0.05 |
| High STAT3 expression | 1.02 | 0.68–1.52 | 0.92 |
| High CCR2 expression | 1.36 | 0.89–2.07 | 0.15 |
| High CCL2 expression | 1.49 | 0.96–2.31 | 0.08 |
Log-rank test was used to assign significance. Bold text indicates genes with overall expression levels significantly associated with overall survival.
Discussion
Macrophages adjust their phenotype and function in response to local cues provided by the tissue microenvironment18. Oncometabolites in the tumor microenvironment act on TAMs and other immune cells to facilitate tumor growth. For example, lactate produced by tumor cells induces tumor-supportive TAMs through a mechanism mediated by HIF1α5. AHR is reported to limit pathogenic responses in peripheral macrophages during inflammation24. Our findings suggest that GBM co-opts this ‘disease tolerance defense pathway’ to escape the immune response and facilitate tumor growth. In particular, AHR regulates key pathways involved in macrophage polarization, repressing NF-κB signaling via SOCS2–TRAF6 and promoting KLF4-driven anti-inflammatory responses. Considering recent reports on the role of SOCS2 in tumor immunology44, this finding identifies new candidate therapeutic targets for the regulation of myeloid cells in the tumor microenvironment. Moreover, both AHR and HIF1α require ARNT (also known as HIF1β) to control the expression of target genes23. Hence, signaling pathways induced by KYN, lactate and other metabolites in the tumor microenvironment are likely to converge on common molecular mechanisms to control TAMs and other immune cells. The identification of common and cell-specific mechanisms that control the response to oncometabolites and other molecules in the tumor microenvironment, such as VEGF and macrophage-colony stimulating factor4, is likely to guide new therapeutic approaches targeting TAMs and other immune cells. Interestingly, TAM infiltration has been linked to disease progression in GBM and other tumors5–11,17. The molecular characterization of TAM populations in GBM may strengthen their prognostic value, while identifying new targets for therapeutic intervention.
Multiple mechanisms modulate TAM activation and infiltration in GBM. CSF1R signaling is reported to alter the phenotype and function of TAMs17. In addition, NF1 inactivation in mesenchymal GBM can promote TAM infiltration45. Indeed, mesenchymal GBM is reported to exhibit higher TAM infiltration compared with other subtypes45, in agreement with the higher expression of CCL2 and CCR2. Since AHR expression was not higher in mesenchymal GBM than in other GBM subgroups, these findings suggest that AHR is among several mechanisms operating in GBM to control TAM recruitment and function via CCL2 and CCR2 and other mediator molecules.
T cell dysfunction, defined as poor effector function, sustained expression of inhibitory receptors and a transcriptional state distinct from that of functional effector and memory T cells are associated with chronic infections and cancer46. Several factors in the tumor microenvironment are thought to promote CD8+ T cell dysfunction, including chronic antigen exposure, costimulatory signaling, cytokines and metabolites42. Our findings identify AHR-driven CD39 expression in TAMs as a contributor to T cell dysfunction in GBM. Additional factors are known to contribute to the impairment of the T cell response in GBM, such as R-2-hydroxyglutarate produced by IDH mutants47. Indeed, considering the effects of AHR signaling on multiple immune cells22, AHR activation in T cells may also contribute to their dysfunction in GBM.
Finally, AHR is activated by small molecules provided not only via metabolism but also by environmental sources such as the diet, the gut flora and pollutants22. These environmental factors play an important role in tumor development, progression and response to therapy48,49. Considering recent reports on the control of CNS-resident cells by AHR ligands provided via the diet and gut flora25,28, AHR signaling in TAMs and other cells in the tumor microenvironment may contribute to the potential effects of diet, the commensal flora or other environmental factors on GBM.
In conclusion, we identified a mechanism that participates in the control of TAMs and T cell immunity by GBM. These findings shed new light on the modulation of tumor-specific immunity by GBM, illuminate potential pathways through which environmental factors may affect disease pathology and identify candidate targets for therapeutic intervention.
Online content
Any methods, additional references, Nature Research reporting summaries, source data, statements of data availability and associated accession codes are available at https://doi.org/10.1038/s41593-019-0370-y.
Methods
Animals.
C57BL/6, LysM-Cre mice were purchased from Jackson Laboratories. AHRmut mice have been previously described50. CD39loxP/loxP will be described elsewhere (S.R. and S.C.R., submitted); requests for CD39loxP/loxP should be addressed to S.C.R. (srobson@bidmc.harvard.edu). Mice in which AHR or CD39 is specifically deleted in macrophages were generated by crossing LysM-Cre mice with AHRloxP/loxP or CD39loxP/loxP mice, respectively. The deletion of AHR and CD39 in macrophages was verified by PCR, western blotting and flow cytometry (Supplementary Figs. 3 and 5). Mice were kept in a conventional, pathogen-free facility at the Harvard Institutes of Medicine and the Building for Transformative Medicine. All mouse experiments were carried out in accordance with guidelines prescribed by the Institutional Animal Care and Use Committee at Harvard Medical School.
Cell lines.
Bioware Ultra cell line GL261-luc2 cells were obtained from Perkin Elmer and were cultured in DMEM supplemented with 10% fetal bovine serum (FBS) and G418 (100 μg ml−1). CT2A cells were cultured in DMEM supplemented with 10% FBS.
Tumor model.
For intracranial mouse glioma, mice were anesthetized, positioned in a Kopf Stereotaxic Alignment System and injected with 1 × 10⁵ GL261-luciferase cells (GL261-luc) or 1 × 10⁵ CT2A cells in 3 μl of DMEM. Injections were made to the right frontal lobe, ~1.8 mm lateral and 0.5 mm caudal from bregma and at a depth of 3 mm. CD8+ T cell depletion using an anti-CD8 monoclonal antibody (53.6–7, Bioxcell) or an isotype control monoclonal antibody (2A3, Bioxcell) was performed as previously described51. Bioluminescence Imaging (Xenogen IVIS-200 Optical In Vivo Imaging System) was performed weekly after tumor cell implantation to monitor tumor growth.
Isolation of tumor-infiltrating immune cells.
GL261-implanted mice were killed 15–20 days after implantation, and CT2A-implanted mice were killed 28 days after implantation. Mice were anesthetized and perfused with 20 ml of PBS. The brain was isolated, mechanically dissociated using a Wheaton Potter–Elvehjem tissue grinder in cold PBS, and the homogenized tissue was passed through a cell strainer (70 μm). To remove the myelin, the brain cell suspension was mixed with 10 ml of a 30% Percoll solution, and a layer of 5 ml PBS was added on top. Centrifugation at 1,600 r.p.m. for 25 min with slow acceleration and without breaks created a gradient that separated the cell pellet on the bottom from the myelin, which was carefully aspirated.
Flow cytometry.
Antibodies for flow cytometry were purchased from eBioscience or Biolegend and used as recommended by the manufacturers. Cells were analyzed on a LSRII or Fortessa flow cytometer (BD Biosciences). The gate strategy used to analyze and sort TAMs in tumor-implanted mice is shown in Supplementary Fig. 7. To exclude other immune lineages of cells (herein named Lin) we used the following antibodies: anti-CD3, anti-NK1.1, anti-Ly6G, anti-PDCA1 and anti-B220. We consider TAMs as CD45+ LinNeg CD45+ and CD11b+ (Supplementary Fig. 7). Within TAMs, TAMs derived from peripheral macrophages were defined as CD45+ CD11b+ Ly6C+ and microglia as CD45Low CD11b+. Of note, the expression of the microglia-specific marker TMEM11931,52 was restricted to CD45Low CD11b+ cells, while Ly6C was expressed only on TAMs derived from peripheral macrophages (Supplementary Fig. 3j). Bone marrow monocytes were defined as CD3Neg B220Neg Ly6GNeg NK1.1Neg Siglec-FNeg CD11b+ Ly6CHi, splenic monocytes as CD11cNeg CD11b+ Ly6CHi, neutrophils as CD115Neg CD11b+ CD11cNeg Ly6G+ and dendritic cells as CD115Neg CD11bNeg CD11c+ MHC IIHi. For intracellular cytokine staining, cells were cultured and restimulated for 3 h at 37 °C in culture medium containing phorbol myristate acetate (50 ng ml−1; Sigma), ionomycin (500 ng ml−1; Sigma) and monensin (GolgiStop; 2 μl ml−1; BD Biosciences). After staining for surface markers, cells were fixed and permeabilized as suggested by the manufacturer (eBiosciences).
Human samples.
Human microglia were isolated as previously described53. CD14+ GBM-infiltrating monocytes were extracted by mechanical disruption of ex vivo GBM samples collected from the operating room, and CD14+ cell isolation was performed by positive selection using CD14 beads (Miltenyi Biotec) after the homogenized tissue was passed through a cell strainer (70 μm). All patients had given informed consent for use of their resected brain tumor for research purposes. All studies using adult human tissue were approved by the McGill University Institutional Review Board (McGill University Health Centre Ethics Board; no. ANTJ2001/1). All experiments were conducted in accordance with the Helsinki Declaration. Peripheral blood mononuclear cells (PBMCs) from healthy controls (25–41 years old) were isolated using Ficoll gradient centrifugation. CD14+ cell purification was performed by positive selection using CD14 beads (Miltenyi Biotec) after homogenized tissue was passed through a cell strainer (70 μm). All procedures were approved by the Institutional Review Board of Brigham and Women’s Hospital.
Preparation of TCM.
A total of 6 × 10⁶ cells from GL261, LN229, A172 or U87 cell lines were cultivated in 9 ml RPMI-complete medium (containing 10% FBS, 1% penicillin and streptomycin, 1% L-glutamine and 1% sodium pyruvate) into 25 cm2 BD Falcon flasks. Supernatants were collected on days 1 and 2 and centrifuged at 1,300 r.p.m. for 10 min. The supernatant was sterile filtered using a 22-μm filter and stored at −80 °C. For monocyte stimulation, TCM from 24-h and 48-h cultures were mixed and then diluted 1:2 with DMEM complete medium.
Generation of BMDMs.
Bone marrow cells were isolated from the femur and tibiae of wild-type and AHRLysM mice and cultured for 7 days in the presence of macrophage-colony stimulating factor (10 ng ml−1). Media were changed every day. On day 6, macrophages were isolated by mild trypsinization with trypsin-EDTA (0.06%).
In vitro macrophage stimulation.
Human CD14+ cells and BMDMs were stimulated with TCM or KYN (K8625–100MG, Sigma-Aldrich) at 50 μM for 24 h. In some studies, cells were treated with an AHR inhibitor (at 10 nM; CH223191, 3858, Tocris Bioscience), a STAT-1 inhibitor (at 40 μM; fludarabine, S1491, Selleckchen), a STAT-3 inhibitor (at 10 μM; BP-1–102, S7769, Selleckchen), an IDO-1 inhibitor (at 50 μM; 1-MT, 5698, Tocris Bioscience), a TDO inhibitor (at 10 μM; 680C91, 4392, Tocris Bioscience) or with anti-IFN-β (2 μg ml−1; MAB8234, R&D) for 15 min before TCM stimulation.
In vitro T cell activation.
Naive CD8+ T cells were purified from the spleen and lymph nodes using magnetic beads. Naive CD8+ T cells were stimulated with plate-bound anti-CD3 (5 μg ml−1; no. 14–0031-86, eBioscience) and anti-CD28 (2.5 μg ml−1; PV-1, Abcam) in the presence or absence of adenosine (500 μM) for 3 days.
Immunofluorescence.
Immunohistofluorescence stainings of human ex vivo GBM samples were performed as previously described28. Briefly, frozen sections of nine human GBM specimens were thawed, fixed, washed and blocked with 10% donkey serum. Sections were then incubated overnight at 4 °C with antibodies against AHR (rabbit anti AHR, Enzo Life Sciences) and CD4 (mouse anti-human CD4, BD Pharmingen) or CD8 (rat anti-human CD8, BD Pharmingen) or CD14 (mouse anti-human, BD Pharmingen). After washes, the samples were incubated at room temperature for 40 min with secondary antibodies (donkey anti rabbit RRX, donkey anti-mouse Alexa 488 and donkey anti-rat Alexa 488, Jackson ImmunoResearch). Finally, sections were washed and mounted in gelvatol containing TOPRO-3 (Invitrogen). Imaging was performed using a Leica SP5 confocal microscope and Leica LAS AF software. Images were processed using Adobe Photoshop CS2. For imaging analyses, all the data were acquired using the same settings. For KYN staining on GBM samples, frozen tissue of three human GBM samples was cut into 10-μm thick sections, air dried and fixed in ice-cold acetone for 10 min. Sections were delipidized in 70% ethanol for 5 min, followed by blocking of endogenous avidin/ biotin using an avidin-biotin blocking kit (Life Technologies) and blocking of nonspecific binding using 10% goat serum (Sigma). L-KYN (mouse anti-human, ImmuSmol) was incubated in blocking buffer overnight at 4 °C. The next day, slides were washed with 0.05% PBS-Tween and incubated with goat anti-mouse biotin (Dako), followed by streptavidin-Cy3 (Jackson ImmunoResearch) for 40 min at room temperature. Sections were blocked for 30 min with 10% mouse serum (Sigma) and incubated for 1 h with CD14-FITC (fluorescein isothiocyanate) (mouse anti-human, BD Biosciences), followed by incubation with rabbit anti-FITC AF488 and goat anti-rabbit AF488 (both Life Technologies) for 40 min at room temperature. Sections were mounted in Mowiol containing TOPRO-3 (Invitrogen). Appropriate isotype control antibodies were used to control for nonspecific binding. Images were acquired using a Leica SP5 confocal microscope and Leica LAS AF software, and processed using Fiji and LAS X. All settings were kept the same.
We used glioma tissue arrays containing normal (n = 3), grade 1 (n = 9), grade 2 (n = 17), grade 3 (n = 10) and grade 4 (n = 5) samples from Abcam (ab178236). We also used tissue arrays containing normal (n = 5), grade 1 (n = 3), grade 2 (n = 8), grade 3 (n = 13) and grade 4 (n = 11) samples from Biomax US (BS17016c). Glioma tissue arrays were baked at 60 °C for 30 min. Sections were then deparaffinized in two washes of xylene (no. 214736, Sigma-Aldrich), followed by two washes in 100% ethanol for 5 min, one wash in 95% ethanol for 5 min, one wash in 70% ethanol for 5 min and one wash in 50% ethanol for 5 min. Slides were then rinsed with ddH2O. Antigen retrieval was performed by placing slides in boiling Epitope Retrieval Solution (no. IW-11000, IHC World) for 20 min. Slides were dried, a hydrophobic barrier was made (no. H-4000, Vector Laboratories) and sections were washed three times for 5 min with 0.3% Triton X-100 in PBS (PBS-T). Sections were blocked with 5% donkey serum (no. D9663, Sigma-Aldrich) in 0.3% PBS-T at room temperature for 30 min. Sections were then incubated with primary antibody diluted in blocking buffer overnight at 4 °C. Following primary antibody incubation, sections were washed three times with 0.3% PBS-T and incubated with secondary antibody diluted in blocking buffer for 2 h at room temperature. If sections were stained with two primary antibodies from the same species, one dual-species antibody was used on day 1, followed by secondary incubation with a Fab fragment conjugated to a fluorophore, then sections were washed five times with 0.3% PBS-T and incubated with the remainder of the primary antibodies followed by secondary antibody incubation. Sections were then washed three with 0.3% PBS-T, dried, and coverslips were mounted using Fluoromount-G with 4,6-diamidino-2-phenylindole (DAPI; no. 0100–20, SouthernBiotech). The following primary antibodies were used in this study: mouse anti-L-KYN (1:100; no. IS003 clone 3D4-F2, ImmuSmol); goat anti-CD14 (1:100; no. LS-B3012–50, LifeSpan Biosciences); rabbit anti-TMEM119 (1:500; no. ab185333, Abcam); mouse anti-CD39 (1:100; no. 328202, Biolegend); goat anti-AHR (1:100; no. ab186070, Abcam); mouse anti-AHR (1:100; no. ab2769, Abcam); mouse anti-CD68 (1:100; no. ab955, Abcam); rabbit anti-CD8 (0.175 μg ml−1; no. 790–4460, Ventana Labs); rabbit anti-CD4 (0.5 μg ml−1; no. 790–4423, Ventana Labs); and rat anti-CD3 (1.2 μg ml−1; no. MCA1477, Bio-Rad). The following secondary antibodies were used in this study: donkey anti-goat Alexa 647 IgG (H+L) cross-adsorbed (no. A-21447, Life Technologies); donkey anti-mouse Alexa 488 IgG (H+L) highly cross adsorbed (no. A-21202, Life Technologies); goat anti-rat IgG (H+L) cross-adsorbed Alexa Fluor 647 (no. A-21247, Thermo Fisher Scientific); donkey anti-rabbit IgG (H+L) highly cross-adsorbed Alexa Fluor 568 (no. A-10042, Thermo Fisher Scientific); Rhodamine Red-X-AffiniPure Fab fragment donkey anti-mouse IgG (H+L) (2 mg ml−1 stock; no. 715–297-003, Jackson ImmunoResearch); goat anti-rabbit IgG H&L Alexa Fluor 488 (no. ab150077, Abcam); donkey anti-goat IgG (H+L) cross-adsorbed secondary antibody, Alexa Fluor 488 (no. A-11055, Thermo Fisher Scientific); and donkey anti-mouse IgG H&L Alexa Fluor 647 (no. mab150107, Abcam). All secondary antibodies were used at 1:500 dilution. Sections were imaged on a LSM710 Zeiss confocal in duplicate by an experimenter blinded to the tumor grade. Images were scored by an observer blinded to the tumor grade. DAPI+ cells were scored for cell-specific markers followed by analysis of KYN, CD39 or AHR expression.
Cytokine production.
IL-6, IFN-γ, TNF-α, CCL2 and IFN-β (no. 42410, PBL Assay Science) were quantified by ELISA according to the manufacturer’s instructions.
CyTOF analysis was performed as previously described54. Samples were acquired on a CyTOF Mass Cytometer-039-Helios (Fluidigm) and analyzed using FlowJo software (Tree Star).
Migration assay.
Splenic macrophages were purified using CD11b beads (Miltenyi Biotec) and by FACS, and then seeded in the upper chamber of a 24-well cell culture insert with 5 μm pore-size (Corning)28. Migrating cells were quantified in the lower chamber after 3 h.
Quantitative PCR.
RNA was extracted using RNAeasy columns (Qiagen) and complementary DNA was prepared following the manufacturer’s instructions (Applied Biosystems) and used as the template for either real-time PCR or RT2Profiler PCR Array (330231 PAMM-006ZA, Qiagen). All the primers and probes were provided by Applied Biosystems, and were used on a ViiA 7 Real-Time PCR System (Applied Biosystems). Expression was normalized to GAPDH expression. The following primers and probe mixtures were purchased from Applied Biosystems: Entpd1 (Mm00515447_m1), Ahr (Mm00478930_m1), Hif1a (Mm00468872_m1), Stat1 (Mm00439518_m1), Klf4 (Mm00516104_m1), Pparg (Mm01184322_m1), Vegfa (Mm00437306_m1), Arg1 (Mm00475988_m1), Cd274 (Mm00452054_m1), Tgfb1 (Mm0117820_m1), Il10 (Mm00439614_m1), Tnfa (Mm00443258_m1), Il1b (Mm00434228_m1), Il27 (Mm00461162_m1), Mrc1 (Mm01329363_m1), Tdo2 (Mm00451266_m1), Ido1 (Mm01218007_m1), Clec10a (Mm00546125_g1), Socs2 (Mm00850544_g1), Cyp1b1 (Mm00487229_m1), Cyp1a1 (Mm00487218_m1), Ccr2 (Mm00438270_m1), Ccl2 (Mm00441242_m1), Ccl7 (Mn00443113_m1), hsa-miR-29a (002112), hsa-miR-29b (000413), Gapdh (Mm99999915_g1), AHR (Hs00169233_m1), CYP1B (Hs02382916_s1), MRC1 (Hs00267207_m1), KLF4 (Hs00358836_m1) ENTPD1 (Hs00969559_m1), LLGL1 (Hs01017181_m1) and GAPDH (Hs02758991_g1).
Chromatin immunoprecipitation.
Cells were crosslinked with 1% paraformaldehyde and lysed with 0.35 ml of lysis buffer (1% SDS, 10 mM EDTA, 50 mM Tris-HCl, pH 8.1) containing 1× protease inhibitor cocktail (Roche Molecular Biochemicals). Chromatin was sheared by sonication and supernatants were collected after centrifugation and diluted in buffer (1% Triton X-100, 2 mM EDTA, 150 mM NaCl, 20 mM Tris-HCl, pH 8.1). Five micrograms of antibody was prebound for a minimum of 4 h to protein A and protein G Dynal magnetic beads (Invitrogen) and washed three times with ice-cold PBS plus 5% BSA, and then added to the diluted chromatin and immunoprecipitated overnight. The magnetic bead–chromatin complexes were then washed three times in RIPA buffer (50 mM HEPES (pH 7.6), 1 mM EDTA, 0.7% sodium deoxycholate, 1% NP-40, 0.5 M LiCl) followed by two washes with TE buffer. Immunoprecipitated chromatin was then extracted with 1% SDS, 0.1 M NaHCO3 and heated at 65 °C for at least 6 h to reverse the paraformaldehyde crosslinking. DNA fragments were purified using a QIAquick DNA purification kit (Qiagen) and analyzed using SYBR green real time PCR (Takara Bio). We used the following antibodies for chromatin immunoprecipitation (ChIP): anti-AHR (BML-SA210, Enzo Life Sciences) and isotype control antibody (ab171870, Abcam). The following primer pairs were used: Klf4:AHR (site-1): forward: 5′-ACAGGTGAAACGACAGAGGA-3′, reverse: 5′-GGGGACTGAAGAAAGGCAC-3′; Klf4:AHR (site-2): forward: 5′-AAGACTGCCTTTTCCCCTCC-3′, reverse: 5′-GCTAGCCAACCCACTCAAAG-3′; Klf4:AHR (site-3): forward: 5′-AACGCCTTCCTTGTTCCTTC-3′, reverse: 5′-CTCAGAAGCTAGGAGAAGGGG-3′; Klf4:AHR (site-4): forward: 5′-CAATCACCCGGCCCTCAC-3′, reverse: 5′-GTACGCGCTTGTCCTGTC-3′; Klf4:AHR (site-5): forward: 5′-GACAGGACAAGCGCGTAC-3′, reverse: 5′-GCTCGAAAGTCCTGCCAC-3′; Klf4:AHR (site-6): forward: 5′-CAGAGGACCCCGAGTAGC-3′, reverse: 5′-AATAAACAAACTCCGCGCAC-3′; AhR:STAT1 forward: 5′-TGCGACTGGAGAGCATTC-3′, reverse: 5′-TCCTGAAGTCTGATGGAGGA-3′; Ahr:STAT3: forward: 5’-GTGTGCGCTCCCTTTGAC-3’, reverse: 5’-GCAGTGCTCTAGGGCTTCC3′, Entpd1:AHR (XRE-1): forward: 5′-CTTACACCGTCCTCCCTGAG-3′, reverse: 5′-GCCAGCTGTGAAATGACAAA-3′; Entpd1:AHR (XRE-2): forward: 5′-CCTGGGCCTCTCACTCTCTT-3′, reverse: 5′-GAGTGCTGCGCAGGTGTA-3′; Entpd1:AHR (XRE-3): forward: 5′-AAGGAGGTGGACACAACCAG-3′, reverse: 5′-TGAATAAATGTGTGCAGAAGGA-3′.
nCounter gene expression.
Total RNA (100 ng) was analyzed using the nCounter PanCancer Pathways Panel according to the manufacturer’s instructions (NanoString Technologies). Data were analyzed using nSolver Analysis software.
GL261 shRNA transfection.
GL261 cells were plated to 60–70% confluency. Pooled plasmids expressing shRNA were used targeting Tdo2 (sc-154157-SH, Santa Cruz Biotechnology), Ido1 (sc-41530-SH, Santa Cruz Biotechnology), and control non-targeting shRNA (sc-108060, Santa Cruz Biotechnology). Cell culture (10-cm) plates were transfected with 12 μg each of Tdo2 and Ido1 shRNA or with 12 μg of control non-targeting shRNA using Lipofectamine 2000 (no. 11668019, Invitrogen) diluted in Opti-MEM (no. 31985070, Life Technologies) according to the manufacturer’s protocol. Cells were transfected for 24 h, then the media was changed for 2 days to standard GL261 culture medium containing DMEM/F12 + GlutaMAX (no. 10565018, Life Technologies) plus 10% FBS and 1% penicillin–streptomycin. Cells were then grown in 5 μg ml−1 of puromycin (P9620–10ML, Sigma-Aldrich) diluted in GL261 culture medium for 3 days to select for transfected cells. Cells were then passaged and grown to confluency in 5 μg ml−1 of puromycin diluted in GL261 culture medium for another 3 days.
Plasmids and miRNA.
Constructs encoding STAT1 and pTK-Renilla were from Addgene. The vector coding for STAT3C has been previously described55. The construct encoding the AHR promoter was a gift from T. Kensler56, and the pGL3-KLF4-Luciferase construct was a gift from J. W. Christman57. To clone the 3′ UTR hAHR luciferase reporter, a fragment of the AHR 3′ UTR containing the putative miR-29b binding site was cloned into the NotI and XhoI sites of psiCHECK-2, downstream of Renilla luciferase. Mutations were introduced in the potential miR-29b binding sites by PCR reactions with specific oligonucleotides and PfuUltra II Fusion HS DNA Polymerase (Stratagene). The following sequences of oligonucleotides were used for hAHR 3′ UTR cloning: forward: 5′-ACTGCTCGAGGCTACTGGATTCTTATTAGTTCC-3′ and reverse: 5′-ACTAGCGGCCGCGTCTAAGCTCTTCAGCTC-3′. The following sequences of oligonucleotides were used for mutagenesis: forward: 5′-CTCAGATGTTAAAATAAATGGTTcGcgGCTTTTTATAAAAAG-3′ and reverse: 5′-CTTTTTATAAAAAGCcgCgAACCATTTATTTTAACATCTGAG-3′. For miRNA overexpression, a hsa-miR-29b-3p/mmu-miR-29b-3p miRNA mimic (MC10103) and a negative control oligonucleotide (4464058) were purchased from Applied Biosystems.
Transfection and luciferase assays.
HEK293 cells and RAW264.7 cells were grown in DMEM supplemented with 10% FBS and transfected using FuGENE HD (Roche) and 1 μg of each plasmid. After 24 h of transfection, the medium was removed. Luciferase activity was analyzed 48 h after transfection using a dual luciferase assay kit (Promega) and normalized to Renilla luciferase activity.
siRNA-mediated knockdown.
BMDMs were transfected with SMARTpool: ON-TARGETplus Klf4 siRNA (no. L-044410-01-0005, Dharmacon) with GeneSilencer siRNA Transfection Reagent (no. T5000, Genlantis) according to the manufacturer’s protocol.
KYN quantification.
KYN was quantified by ELISA (K3728, ImmunDiagnostik) according to the manufacturer’s instructions.
Western blotting.
Subcellular fractions were generated using a Cell Fractionation kit (Cell Signaling). A total of 5–10 μg of sample was separated by 4–12% Bis-Tris Nupage gels (Invitrogen), transferred to polyvinylidenedifluoride membranes (Millipore) and developed with antibodies against GAPDH (no. 14C10, Cell Signaling), histone H3 (EMD Millipore), NF-κB p65 (no. D14E12, Cell Signaling), TRAF6 (no. 8028, Cell Signaling) or AHR (no. BML-SA210, Enzo Life Sciences). Blots were developed using a SuperSignal West Femto Maximum sensitivity kit (Thermo Scientific/Life Technologies). Quantification was done using Image J software v.1.48 (NIH).
Statistical analysis.
Samples were randomly allocated into experimental groups at the start of each individual experiment. Genetically identical mice were randomly allocated to experimental groups at the start of the experiments. For in vitro experiments, biological samples were randomly allocated into experimental groups at the beginning of the experiment. No statistical methods were used to predetermine sample size, but our sample sizes are similar to those reported in previous publications, and significance levels determined as described in the figure legends. Data collection and analysis were not performed blind to the conditions of the experiments. Data distribution was assumed to be normal, but this was not formally tested. Prism 7.0 software was used for statistical analysis, and the statistical tests used are indicated in the individual figure legends. P < 0.05 was considered statistically significant. Volcano plots were generated using R statistical software (v.3.3.2) and the calibrate package (v.1.7.2). M1/M2 genes were considered significant if P < 0.05 and ±1.5-fold change. Heatmaps were generated using Gene-E program. For TCGA analysis, mRNA expression and clinical information for GBM29,30 and brain lower grade glioma (TCGA Provisional) datasets were downloaded from cBioPortal (http://www.cbioportal.org). Qiagen’s Ingenuity Pathway Analysis (Ingenuity Systems, www.ingenuity.com) was used to perform pathway analysis.
Human survival analysis.
A Cox proportional regression model was applied to estimate the hazard ratios and 95% confidence intervals (CIs) using months of follow-up after diagnosis as the timescale. Covariates included age, gender, Karnofsky performance score (KPS), TCGA expression subtype (mesenchymal, proneural non G-CIMP, proneural G-CIMP, neural, classical), IDH1 status (mutated, wild type), MGMT methylation status (methylated, unmethylated), treatment (dichotomized as receiving temozolomide or not) and the expression of AHR, ENTPD1, KLF4, CYP1A1, STAT1, STAT3, CCL2 and CCR2 (linear and dichotomized values were tested) (Supplementary Tables 4 and 5). A multivariate Cox model was built in a forward fashion, including variables with P < 0.2 in the univariate analysis. Patients were stratified into low or high groups based on gene expression, using the median expression as the cut-off value; patients were included in the high group if mRNA expression was greater than the median. Additional interactions were tested for relevant variables. The proportional-hazards assumption was tested by visual inspection of log–log plots and the proportionality hazard assumption test with Schoenfeld residuals as follows: the model was considered to fit the data if the true cumulative hazard function conditional on the covariate vector had an exponential distribution with a hazard rate of one. To assess this, we plotted a Nelson–Aalen cumulative hazard function and the Cox–Snell residuals and evaluated if the hazard function line followed a 45-degree line. Final model fitness was assessed by the exploration of Cox–Snell residuals. Cox models were built using the survival package, v.2.42–3, in R and Stata, v.12.1 (Statacorp). Two-sided P < 0.05 was considered statistically significant.
Reporting Summary.
Further information on research design is available in the Nature Research Reporting Summary linked to this article.
Data availability
The authors declare that the data supporting the findings of this study are available as Supplementary Tables 2–5.
Code availability
The code used for these studies is provided as Supplementary Software 1 and 2.
Supplementary Material
Acknowledgements
This work was supported by the following grants: NS087867, ES02530, AI126880 and AI093903 from the National Institutes of Health (NIH) and RSG-14-198-01-LIB from the American Cancer Society to F.J.Q.; the Brain Science Foundation grant to G.Gabriely and ES07381 to D.S. M.C.T. received support from an educational grant from Mallinkrodt Pharmaceuticals (A219074). M.A.W. was supported by a training grant from the NIH (1F32NS101790) and the Dana Farber Cancer Institute (T32CA207201). V.R. was supported by a fellowship from the German Research Foundation (DFG RO4866 1/1) and an educational grant from Mallinkrodt Pharmaceuticals (A219074). C.G.-V. is supported by an Alfonso Martín Escudero Foundation postdoctoral fellowship. A.B. was supported by a doctoral fellowship (CBB BDS-00503-16) from FAPEMIG, Brazil. We thank T. Seyfried (Biology Department, Boston College, MA, USA) for providing the CT2A cell line.
Footnotes
Competing interests
F.J.Q. is a member of the Scientific Advisory Board of Kyn Therapeutics. D.S. is a cofounder of and holds equity in Hercules Pharmaceuticals. The other authors declare no competing interests.
Additional information
Supplementary information is available for this paper at https://doi.org/10.1038/s41593-019-0370-y.
Reprints and permissions information is available at www.nature.com/reprints.
Journal peer review information: Nature Neuroscience thanks Ingo Mellinghoff, Judith Varner, and other anonymous reviewer(s) for their contribution to the peer review of this work.
References
- 1.De Henau O et al. Overcoming resistance to checkpoint blockade therapy by targeting PI3Kγ in myeloid cells. Nature 539, 443–447 (2016). [DOI] [PMC free article] [PubMed] [Google Scholar]
- 2.Kaneda MM et al. PI3Kγ is a molecular switch that controls immune suppression. Nature 539, 437–442 (2016). [DOI] [PMC free article] [PubMed] [Google Scholar]
- 3.Quail DF et al. The tumor microenvironment underlies acquired resistance to CSF-1R inhibition in gliomas. Science 352, aad3018 (2016). [DOI] [PMC free article] [PubMed] [Google Scholar]
- 4.Quail DF & Joyce JA Microenvironmental regulation of tumor progression and metastasis. Nat. Med 19, 1423–1437 (2013). [DOI] [PMC free article] [PubMed] [Google Scholar]
- 5.Colegio OR et al. Functional polarization of tumour-associated macrophages by tumour-derived lactic acid. Nature 513, 559–563 (2014). [DOI] [PMC free article] [PubMed] [Google Scholar]
- 6.Condeelis J & Pollard JW Macrophages: obligate partners for tumor cell migration, invasion, and metastasis. Cell 124, 263–266 (2006). [DOI] [PubMed] [Google Scholar]
- 7.Franklin RA et al. The cellular and molecular origin of tumor-associated macrophages. Science 344, 921–925 (2014). [DOI] [PMC free article] [PubMed] [Google Scholar]
- 8.Junttila MR & de Sauvage FJ Influence of tumour micro-environment heterogeneity on therapeutic response. Nature 501, 346–354 (2013). [DOI] [PubMed] [Google Scholar]
- 9.Noy R & Pollard JW Tumor-associated macrophages: from mechanisms to therapy. Immunity 41, 49–61 (2014). [DOI] [PMC free article] [PubMed] [Google Scholar]
- 10.Qian BZ et al. CCL2 recruits inflammatory monocytes to facilitate breast-tumour metastasis. Nature 475, 222–225 (2011). [DOI] [PMC free article] [PubMed] [Google Scholar]
- 11.Qian BZ & Pollard JW Macrophage diversity enhances tumor progression and metastasis. Cell 141, 39–51 (2010). [DOI] [PMC free article] [PubMed] [Google Scholar]
- 12.Preusser M, Lim M, Hafler DA, Reardon DA & Sampson JH Prospects of immune checkpoint modulators in the treatment of glioblastoma. Nat. Rev. Neurol 11, 504–514 (2015). [DOI] [PMC free article] [PubMed] [Google Scholar]
- 13.Sharma P & Allison JP The future of immune checkpoint therapy. Science 348, 56–61 (2015). [DOI] [PubMed] [Google Scholar]
- 14.Wen PY & Reardon DA Neuro-oncology in 2015: progress in glioma diagnosis, classification and treatment. Nat. Rev. Neurol 12, 69–70 (2016). [DOI] [PubMed] [Google Scholar]
- 15.Hambardzumyan D, Gutmann DH & Kettenmann H The role of microglia and macrophages in glioma maintenance and progression. Nat. Neurosci 19, 20–27 (2016). [DOI] [PMC free article] [PubMed] [Google Scholar]
- 16.Thomas AA et al. Regulatory T cells are not a strong predictor of survival for patients with glioblastoma. Neuro Oncol 17, 801–809 (2015). [DOI] [PMC free article] [PubMed] [Google Scholar]
- 17.Pyonteck SM et al. CSF-1R inhibition alters macrophage polarization and blocks glioma progression. Nat. Med 19, 1264–1272 (2013). [DOI] [PMC free article] [PubMed] [Google Scholar]
- 18.Gosselin D et al. Environment drives selection and function of enhancers controlling tissue-specific macrophage identities. Cell 159, 1327–1340 (2014). [DOI] [PMC free article] [PubMed] [Google Scholar]
- 19.Gabrilovich DI, Ostrand-Rosenberg S & Bronte V Coordinated regulation of myeloid cells by tumours. Nat. Rev. Immunol 12, 253–268 (2012). [DOI] [PMC free article] [PubMed] [Google Scholar]
- 20.Gabriely G, Wheeler MA, Takenaka MC & Quintana FJ Role of AHR and HIF-1α in glioblastoma metabolism. Trends Endocrinol. Metab 28, 428–436 (2017). [DOI] [PMC free article] [PubMed] [Google Scholar]
- 21.Opitz CA et al. An endogenous tumour-promoting ligand of the human aryl hydrocarbon receptor. Nature 478, 197–203 (2011). [DOI] [PubMed] [Google Scholar]
- 22.Gutiérrez-Vázquez C & Quintana FJ Regulation of the immune response by the aryl hydrocarbon receptor. Immunity 48, 19–33 (2018). [DOI] [PMC free article] [PubMed] [Google Scholar]
- 23.Mascanfroni ID et al. Metabolic control of type 1 regulatory T cell differentiation by AHR and HIF1-α. Nat. Med 21, 638–646 (2015). [DOI] [PMC free article] [PubMed] [Google Scholar]
- 24.Bessede A et al. Aryl hydrocarbon receptor control of a disease tolerance defence pathway. Nature 511, 184–190 (2014). [DOI] [PMC free article] [PubMed] [Google Scholar]
- 25.Rothhammer V et al. Microglial control of astrocytes in response to microbial metabolites. Nature 557, 724–728 (2018). [DOI] [PMC free article] [PubMed] [Google Scholar]
- 26.Mukthavaram R et al. Effect of the JAK2/STAT3 inhibitor SAR317461 on human glioblastoma tumorspheres. J. Transl Med 13, 269 (2015). [DOI] [PMC free article] [PubMed] [Google Scholar]
- 27.Thota B et al. STAT-1 expression is regulated by IGFBP-3 in malignant glioma cells and is a strong predictor of poor survival in patients with glioblastoma. J. Neurosurg 121, 374–383 (2014). [DOI] [PubMed] [Google Scholar]
- 28.Rothhammer V et al. Type I interferons and microbial metabolites of tryptophan modulate astrocyte activity and central nervous system inflammation via the aryl hydrocarbon receptor. Nat. Med 22, 586–597 (2016). [DOI] [PMC free article] [PubMed] [Google Scholar]
- 29.Brennan CW et al. The somatic genomic landscape of glioblastoma. Cell 155, 462–477 (2013). [DOI] [PMC free article] [PubMed] [Google Scholar]
- 30.The Cancer Genome Atlas Research Network. Comprehensive genomic characterization defines human glioblastoma genes and core pathways. Nature 455, 1061–1068 (2008). [DOI] [PMC free article] [PubMed] [Google Scholar]
- 31.Bowman RL et al. Macrophage ontogeny underlies differences in tumor-specific education in brain malignancies. Cell Rep 17, 2445–2459 (2016). [DOI] [PMC free article] [PubMed] [Google Scholar]
- 32.Platten M et al. Monocyte chemoattractant protein-1 increases microglial infiltration and aggressiveness of gliomas. Ann. Neurol 54, 388–392 (2003). [DOI] [PubMed] [Google Scholar]
- 33.Mayo L et al. Regulation of astrocyte activation by glycolipids drives chronic CNS inflammation. Nat. Med 20, 1147–1156 (2014). [DOI] [PMC free article] [PubMed] [Google Scholar]
- 34.Phillips RJ, Lutz M & Premack B Differential signaling mechanisms regulate expression of CC chemokine receptor-2 during monocyte maturation. J. Inflamm. (Lond.) 2, 14 (2005). [DOI] [PMC free article] [PubMed] [Google Scholar]
- 35.Sozzani S et al. MCP-1 and CCR2 in HIV infection: regulation of agonist and receptor expression. J. Leukoc. Biol 62, 30–33 (1997). [DOI] [PubMed] [Google Scholar]
- 36.Platten M et al. Treatment of autoimmune neuroinflammation with a synthetic tryptophan metabolite. Science 310, 850–855 (2005). [DOI] [PubMed] [Google Scholar]
- 37.Liao X et al. Krüppel-like factor 4 regulates macrophage polarization. J. Clin. Invest 121, 2736–2749 (2011). [DOI] [PMC free article] [PubMed] [Google Scholar]
- 38.Yeste A et al. Tolerogenic nanoparticles inhibit T cell-mediated autoimmunity through SOCS2. Sci. Signal 9, ra61 (2016). [DOI] [PubMed] [Google Scholar]
- 39.Takenaka MC, Robson S & Quintana FJ Regulation of the T cell response by CD39. Trends Immunol 37, 427–439 (2016). [DOI] [PMC free article] [PubMed] [Google Scholar]
- 40.Deaglio S et al. Adenosine generation catalyzed by CD39 and CD73 expressed on regulatory T cells mediates immune suppression. J. Exp. Med 204, 1257–1265 (2007). [DOI] [PMC free article] [PubMed] [Google Scholar]
- 41.Singer M et al. A distinct gene module for dysfunction uncoupled from activation in tumor-infiltrating T Cells. Cell 166, 1500–1511.e9 (2016). [DOI] [PMC free article] [PubMed] [Google Scholar]
- 42.Wherry EJ & Kurachi M Molecular and cellular insights into T cell exhaustion. Nat. Rev. Immunol 15, 486–499 (2015). [DOI] [PMC free article] [PubMed] [Google Scholar]
- 43.Verhaak RG et al. Integrated genomic analysis identifies clinically relevant subtypes of glioblastoma characterized by abnormalities in PDGFRA, IDH1, EGFR, and NF1. Cancer Cell 17, 98–110 (2010). [DOI] [PMC free article] [PubMed] [Google Scholar]
- 44.Nirschl CJ et al. IFNγ-dependent tissue-immune homeostasis is co-opted in the tumor microenvironment. Cell 170, 127–141 (2017). [DOI] [PMC free article] [PubMed] [Google Scholar]
- 45.Wang Q et al. Tumor evolution of glioma-intrinsic gene expression subtypes associates with immunological changes in the microenvironment. Cancer Cell 32, 42–56.e6 (2017). [DOI] [PMC free article] [PubMed] [Google Scholar]
- 46.Wherry EJ T cell exhaustion. Nat. Immunol 12, 492–499 (2011). [DOI] [PubMed] [Google Scholar]
- 47.Kohanbash G et al. Isocitrate dehydrogenase mutations suppress STAT1 and CD8+ T cell accumulation in gliomas. J. Clin. Invest 127, 1425–1437 (2017). [DOI] [PMC free article] [PubMed] [Google Scholar]
- 48.Thaiss CA, Zmora N, Levy M & Elinav E The microbiome and innate immunity. Nature 535, 65–74 (2016). [DOI] [PubMed] [Google Scholar]
- 49.Vétizou M et al. Anticancer immunotherapy by CTLA-4 blockade relies on the gut microbiota. Science 350, 1079–1084 (2015). [DOI] [PMC free article] [PubMed] [Google Scholar]
References
- 50.Okey AB, Vella LM & Harper PA Detection and characterization of a low affinity form of cytosolic Ah receptor in livers of mice nonresponsive to induction of cytochrome P1–450 by 3-methylcholanthrene. Mol. Pharmacol 35, 823–830 (1989). [PubMed] [Google Scholar]
- 51.Gabriely G et al. Targeting latency-associated peptide promotes antitumor immunity. Sci. Immunol 2, 2 (2017). [DOI] [PMC free article] [PubMed] [Google Scholar]
- 52.Bennett ML et al. New tools for studying microglia in the mouse and human CNS. Proc. Natl Acad. Sci. USA 113, E1738–E1746 (2016). [DOI] [PMC free article] [PubMed] [Google Scholar]
- 53.Durafourt BA, Moore CS, Blain M & Antel JP Isolating, culturing, and polarizing primary human adult and fetal microglia. Methods Mol. Biol 1041, 199–211 (2013). [DOI] [PubMed] [Google Scholar]
- 54.David BA et al. Isolation and high-dimensional phenotyping of gastrointestinal immune cells. Immunology 151, 56–70 (2017). [DOI] [PMC free article] [PubMed] [Google Scholar]
- 55.Mascanfroni ID et al. IL-27 acts on DCs to suppress the T cell response and autoimmunity by inducing expression of the immunoregulatory molecule CD39. Nat. Immunol 14, 1054–1063 (2013). [DOI] [PMC free article] [PubMed] [Google Scholar]
- 56.Shin S et al. NRF2 modulates aryl hydrocarbon receptor signaling: influence on adipogenesis. Mol. Cell. Biol 27, 7188–7197 (2007). [DOI] [PMC free article] [PubMed] [Google Scholar]
- 57.Karpurapu M et al. Krüppel like factor 4 promoter undergoes active demethylation during monocyte/macrophage differentiation. PLoS One 9, e93362 (2014). [DOI] [PMC free article] [PubMed] [Google Scholar]
Associated Data
This section collects any data citations, data availability statements, or supplementary materials included in this article.
Supplementary Materials
Data Availability Statement
The authors declare that the data supporting the findings of this study are available as Supplementary Tables 2–5.