Abstract
Expression quantitative trait loci (eQTLs) studies provide associations of genetic variants with gene expression but fall short of pinpointing functionally important eQTLs. Here, using H3K27ac HiChIP assays, we mapped eQTLs overlapping active cis-regulatory elements that interact with their target gene promoters (promoter-interacting eQTLs, pieQTLs) in five common immune cell types (Database of Immune Cell Expression, Expression quantitative trait loci and Epigenomics (DICE) cis-interactome project). This approach allowed us to identify functionally important eQTLs and show mechanisms that explain their cell-type restriction. We also devised an approach to eQTL discovery that relies on HiChIP-based promoter interaction maps as a structural framework for deciding which SNPs to test for association with gene expression, and observe ultra-long-distance pieQTLs (>1 megabase away), including several disease-risk variants. We validated the functional role of pieQTLs using reporter assays, CRISPRi, dCas9-tiling guides and Cas9-mediated base-pair editing. In this article we present a method for functional eQTL discovery and provide insights into relevance of noncoding variants for cell-specific gene regulation and for disease association beyond conventional eQTL mapping.
Genetic variants that are common in the general population have been linked to disease susceptibility by genome-wide association studies (GWASs)1. The vast majority of these GWAS variants are present in noncoding DNA sequences and inherited as dense haploblocks2,3; hence, it has been challenging to define functional variants. To determine whether noncoding variants affect gene expression in cis, several genome-wide studies have examined their association with gene expression (eQTLs) in a wide range of tissues and cell types4–7. In only a few instances, through extensive experimental efforts, functional variants driving such strong cell-specific effects have been identified8–10. Overall, these studies have injected confidence in unbiased genetic studies (GWAS and eQTL discovery) as a platform to identify cell types and genes driving the genetic risk for human diseases. Systematic efforts to define functional/causative disease-associated variants at a larger scale would further support the value of gene association-based approaches to understand human disease etiology.
Profiling studies of primary human cell types by the Encyclopedia of DNA Elements (ENCODE) and National Institutes of Health (NIH) Roadmap Consortium have annotated cell-specific regulatory potential to noncoding DNA sequences11,12 and shown enrichment of disease-risk-associated variants at cis-regulatory elements; nonetheless, our understanding of how variants influence their target genes is generally poor. Genome-wide chromatin conformation capture methods have shown that long-range chromatin interactions bring distal cis-regulatory elements and promoters into proximity and influence gene expression13–15. These interactions may span linear distances of ≥1 megabase (Mb) and often skip over (PCHiC) and HiChIP analyses in some common immune cell types and three primary T-cell subsets, respectively, have revealed interactions between cis-regulatory elements overlapping disease-risk variants and promoters of potential new target genes10,16. Notably, in the first phase of the Database of Immune Cell Expression, Expression quantitative trait loci and Epigenomics (DICE) project, our analysis of 13 types of immune cells and two activation conditions revealed that the majority of disease-risk variants were associated with gene expression in only one or a few cell types7. Taken together, these studies emphasize the value of creating high-resolution cis-regulatory interaction maps for a wide range of disease-relevant primary cell types to understand the mechanisms through which disease-risk-associated variants exert their effects on gene expression in a cell-specific manner.
Results
Active cis-regulatory interaction maps in human immune cell types.
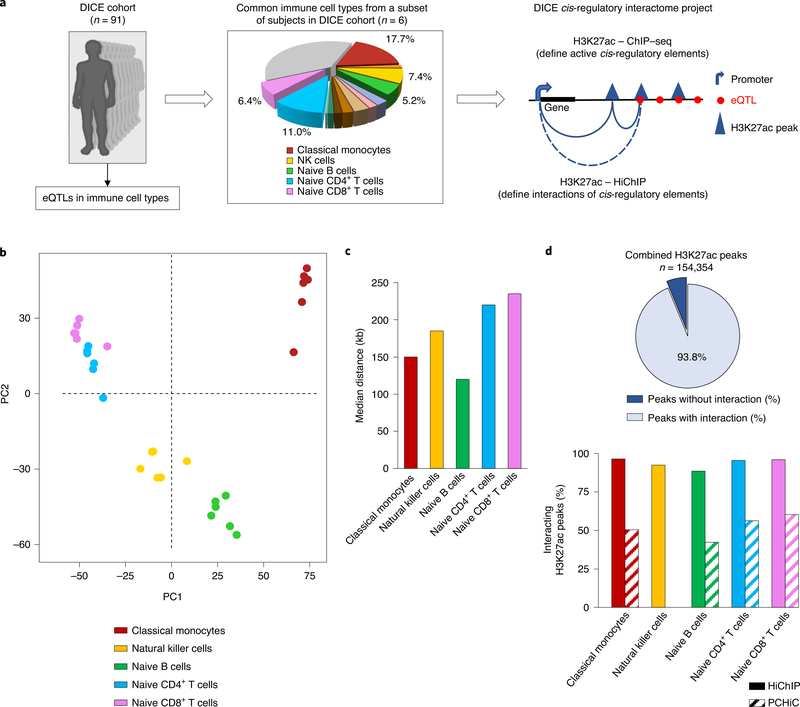
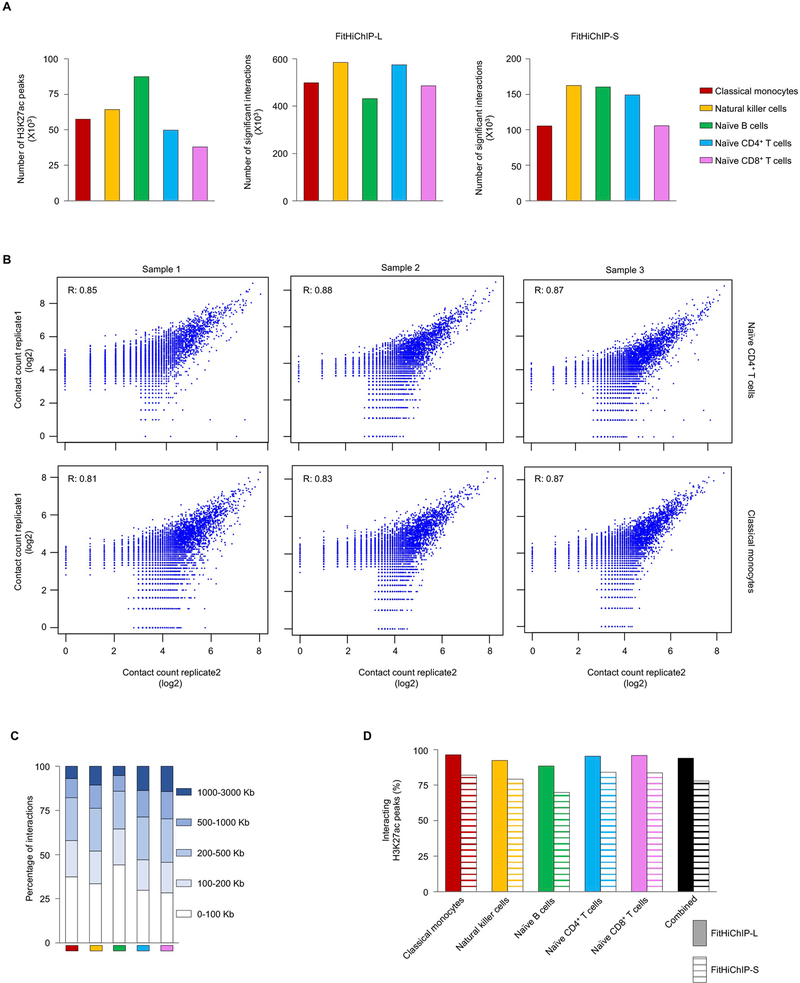
To discover active cis-regulatory interactions at a genome-wide scale, we performed chromatin immunoprecipitation sequencing (ChIP–seq) and HiChIP for the histone modification H3K27ac, which marks active cis-regulatory elements10,17, for five immune cell types prevalent in human peripheral blood mononuclear cells (PBMCs) that were analyzed in the DICE project (https://dice-database.org) (Fig. 1a, Extended Data Fig. 1a and Supplementary Tables 1–3). Significant long-distance (>10 kilobases (kb) to 3 Mb) cis-regulatory interactions were defined using FitHiChIP18 with two different background models (FitHiChIP-L and FitHiChIP-S; Methods, Extended Data Fig. 1a and Supplementary Table 1). Principal component analysis of the cis-regulatory interactome showed that cell types from different donors clustered together, suggesting cell-type specificity of the cis-regulatory interactions (Fig. 1b). Reproducibility analysis of HiChIP contact counts among replicates of same donor for naive CD4+ T cells (n = 3) and classical monocytes (n = 3) showed a correlation (0.81–0.87; Extended Data Fig. 1b) suggesting reproducibility of chromatin interaction. The median genomic distance for significant interactions ranged from 120 kb to 235 kb among the five different cell types (Fig. 1c and Extended Data Fig. 1c).
Fig. 1 |. Active cis-regulatory interaction maps in human immune cell types from DiCe.
a, Study overview. b, Principal component analysis (PCA) of the cis-regulatory interactome of all samples. Each dot represents an independent sample and colors indicate different cell types. c, Median interaction distance of significant interactions in each cell type. d, The percentages of all H3K27ac peaks with long-range (>10 kb) interactions detected by HiChIP assay (top panel). Bottom panel shows comparison of the fractions of H3K27ac peaks that have chromatin interactions as captured by either HiChIP or a complementary assay PCHiC in each cell type. NK, natural killer; PC1, principal component 1; PC2, principal component 2.
Analysis of aggregate H3K27ac ChIP–seq peak data for each cell type revealed that 94% (FitHiChIP-L) and 78% (FitHiChIP-S) of all of the H3K27ac peaks showed significant long-distance (>10 kb to 3 Mb) cis-interactions (Fig. 1d and Extended Data Fig. 1d). Whereas, PCHiC, a complementary assay16,19, captured interactions for only ~50% of H3K27ac peaks in these cell types16, which indicated lower sensitivity for interactions involving active cis-regulatory regions compared with HiChIP assay (Fig. 1d, lower graph). Overall, these results suggested that H3K27ac HiChIP assay generated highly sensitive and reproducible chromatin interaction maps for active cis-regulatory elements in common immune cell types.
Identification of pieQTLs.
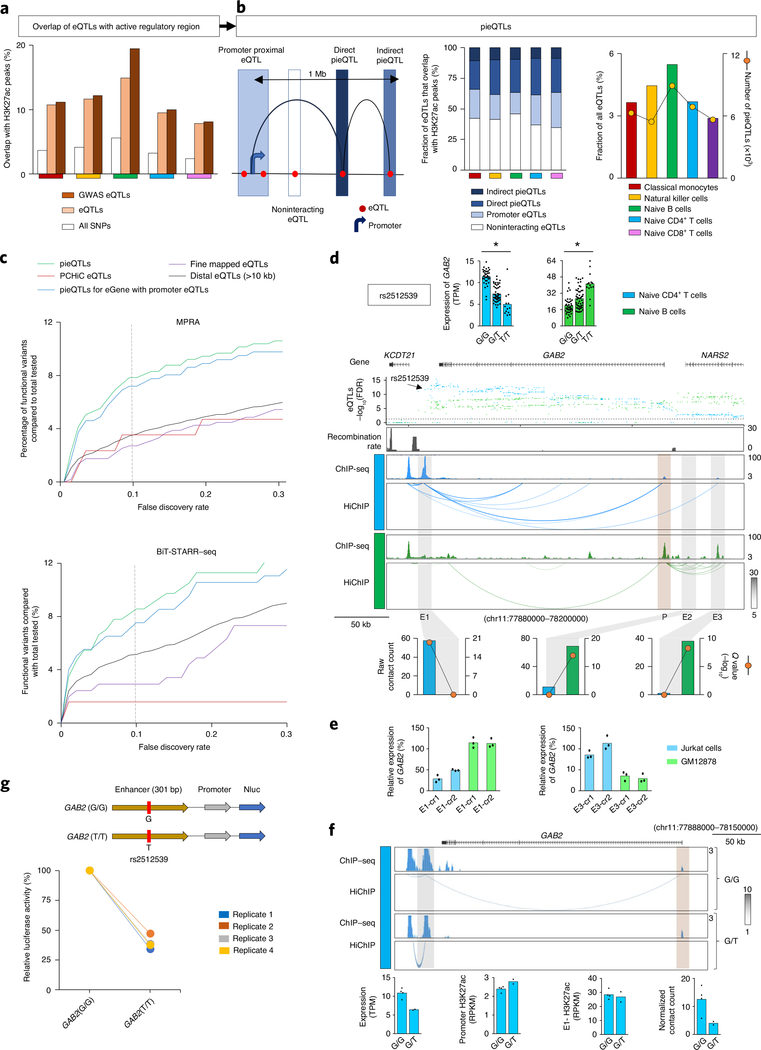
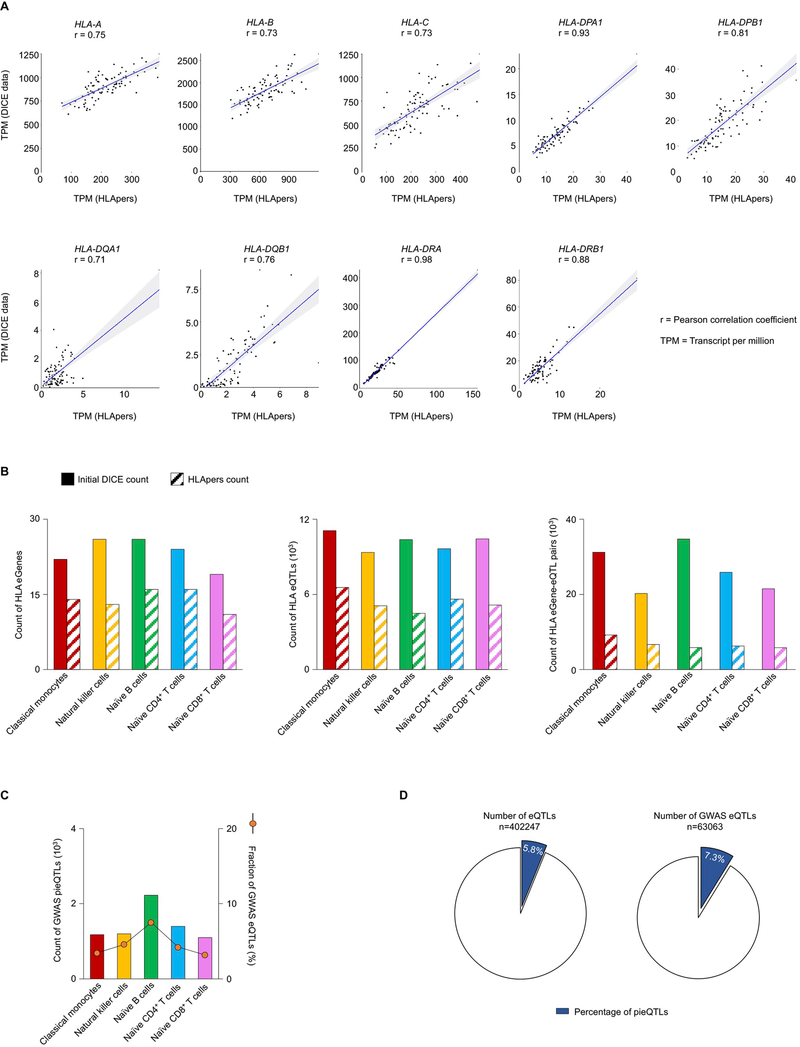
Identifying functionally important eQTLs has been challenging as eQTLs are generally present in dense haploblocks and regions far away from their target gene. For this work, we started from all previously published DICE eQTLs, except for highly polymorphic HLA genes, for which we calculated transcript levels using a recent method (HLApers20) that defined HLA eQTLs (Supplementary Methods and Extended Data Fig. 2a,b). Consistent with previous reports, we found that compared with all SNPs tested (~4% per cell type) a greater fraction of eQTLs (~11% per cell type) and GWAS eQTLs (~12% per cell type) overlapped active cis-regulatory elements identified in the corresponding cell type (Fig. 2a), indicating that eQTLs are most likely to perturb the function of cell-type-specific cis-regulatory elements. We reasoned that functionally important eQTLs are likely to be enriched in active cis-regulatory elements that also physically interact with the promoter region of their target genes (referred to as eGenes). The interactions involving promoter proximal eQTLs (±2.5 kb from the transcription start site (TSS) of the eGene), which accounted for ~20% of all eQTLs that overlapped active cis-regulatory elements identified in the five DICE immune cells types (Fig. 2b, left panel), are difficult to study with conformation capture methods21. However, HiChIP data allowed us to resolve the promoter interactions of distal eQTLs (>10 kb to 1 Mb from TSS of eGene) within the previously used distance threshold (1 Mb) for eQTL discovery studies4,7 (Fig. 2b, left panel). Across different cell types, between 23.1% and 29.8% of all of the distal eQTLs that overlapped active cis-regulatory elements interacted directly with the promoter of their target eGenes, referred to as direct pieQTLs (Fig. 2b, middle panel). Another 8.7% to 10.8% of these distal eQTLs that overlapped active cis-regulatory elements interacted indirectly, through a common point of interaction, with the promoter for eGenes that do not have any direct pieQTLs, termed indirect pieQTLs (Fig. 2b, middle panel). Hereafter, for simplicity, we refer to the set of direct pieQTLs and the set of indirect pieQTLs for eGenes without a direct pieQTLs as pieQTLs (Fig. 2b, middle panel, and Supplementary Table 4).
Fig. 2 |. pieQtLs define potentially functional eQtLs.
a, Percentages of genotyped DICE SNPs, DICE eQTLs and GWAS eQTLs located in regions with H3K27ac peaks in different cell types. b, Classification of eQTLs based on their location and interaction with the promoter of their target gene (left panel); fractions of direct or indirect pieQTLs, promoter eQTLs and noninteracting eQTLs (middle panel). Right panel, total counts of pieQTLs and the fraction of eQTLs that are pieQTL in each cell type. c, Among the naïve B-cell pieQTLs, pieQTLs for the eGenes with promoter QTLs, PCHiC-overlapping eQTLs16, fine-mapped eQTLs and distal eQTLs (>10 kb from TSS) that were tested in GM12878 cells by a massively parallel reporter assay (MPRA) (top panel) and Biallelic Targeted STARR-seq (BiT-STARR–seq) (bottom panel), the percentages of genetic variants deemed to have genotype-dependent enhancer activity at different FDR thresholds are shown for each set. d, Mean expression levels (TPM) of GAB2, an eGene in both naïve B cells (*adj. association P value: 1.9 × 10⁻⁴) and naïve CD4+ T cells (*adj. association P value: 2.1 × 10⁻¹²), from donors (n = 85) categorized based on the genotype at the indicated cis-eQTL; each symbol represents an individual subject; adj. association P value calculated by Benjamini–Hochberg method. WashU Epigenome browser tracks for the extended GAB2 locus, adj. association P value for naïve B-cell (green color) and naïve CD4+ T-cell (blue color) eQTLs linked to GAB2 expression, recombination rate tracks36,37, H3K27ac ChIP–seq tracks and HiChIP interactions in naïve CD4+ and naïve B cells. Bottom panel shows HiChIP raw contact counts and statistical significance (Q value) for the interaction of indicated enhancer regions (E1, E2, E3). e, Real-time PCR quantification of GAB2 transcript levels (relative to the housekeeping gene YWHAZ) in Jurkat cells and GM12878 cells 48 h after CRISPRi-mediated silencing of indicated enhancer with two independent crRNAs (cr1 and cr2); bar graph shows the percentage reduction in GAB2 transcript levels compared with control guide RNA; each dot represents an independent assay (n = 3). f, H3K27ac ChIP–seq tracks and HiChIP interactions in naïve CD4+ T cells from individual donors classified based on the genotype at rs2512539. Bottom panel shows genotype-dependent summarization of GAB2 transcript levels, H3K27ac enrichment levels at E1 enhancer region and GAB2 promoter region, and HiChIP normalized contact counts for the interaction of E1 enhancer region to GAB2 promoter; each symbol represents an individual subject. g, The luciferase reporter construct of GAB2 enhancer with reference and alternate alleles and their relative luciferase activity in Jurkat cells 72 h after nucleofection (n = 4). adj. association P value, adjusted association P value.
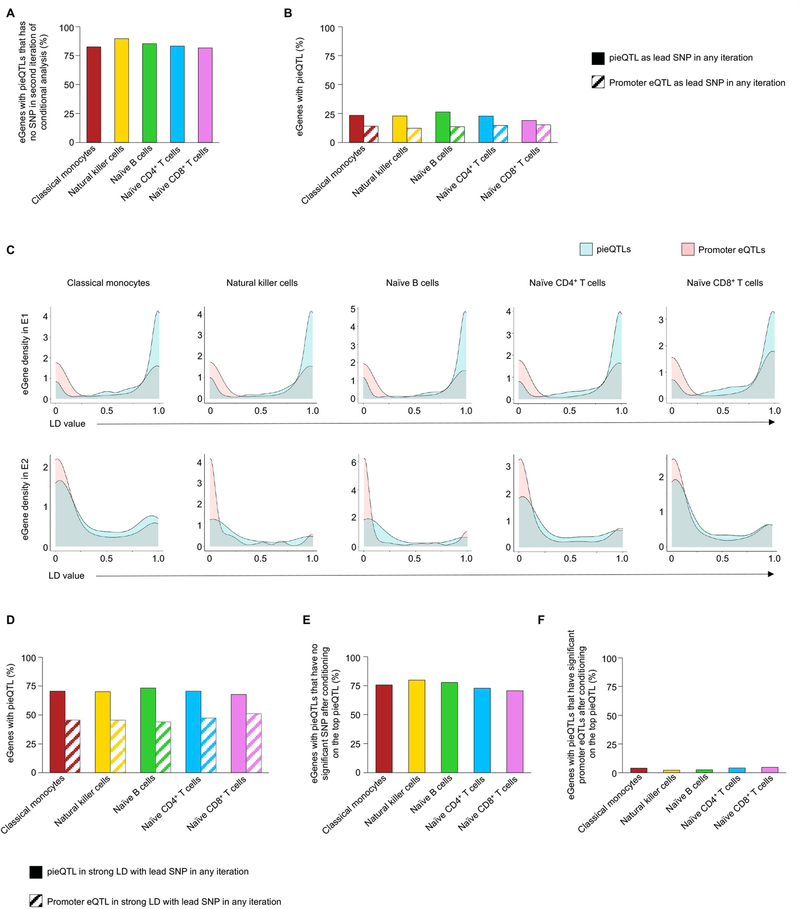
In total, we delineated 23,386 unique pieQTLs (~5.8% of all unique eQTLs) across the five cell types (Fig. 2b, right panel, and Supplementary Table 4) corresponding to 3,196 unique eGenes. Our interaction-based approach to identify pieQTLs resulted in a substantial reduction in the number of likely functional genetic variants also among the eQTLs that simply overlapped distal cis-regulatory elements (34% to 38.7%) (Fig. 2b). Notably, we found that pieQTLs were significantly enriched for disease-risk-associated variants (P < 1 × 10⁻⁶, n = 4,620 GWAS eQTLs, 7.3% of all GWAS eQTLs; Extended Data Fig. 2c,d). To assess eQTL effects explained by pieQTLs in comparison with other eQTLs including promoter eQTLs (±2.5 kb from TSS), we performed conditional analysis for eGenes with pieQTLs22,23 (Supplementary Methods and Extended Data Fig. 3a–d). Consistent with the Genotype-Tissue Expression project (GTEx) estimates23, only 10–18% of eGenes reported additional independent eQTLs (E2, E3, and so on) beyond the first iteration of the conditional mapping (E1) across all cell types (Extended Data Fig. 3a). Notably, 33–41% (per cell type) of eGenes with pieQTLs did not have any promoter eQTLs to begin with, which suggested that variation in expression of these eGenes is likely attributable to the distal cis-regulatory eQTLs interacting with the promoter, that is, pieQTLs. To determine whether cis-eQTLs other than the lead pieQTL are independently associated with expression of their target eGenes, we also conducted a modified conditional eQTL analysis where we removed the effect of the top pieQTL by using it as the covariate in the first iteration (Methods). After removing this effect, we found that for the majority of eGenes with pieQTLs (71–80%) no other SNP showed significant association with expression of their eGene, that is, no other eQTLs are conditionally independent from the top pieQTL (Extended Data Fig. 3e,f). Overall, these results suggest the importance of our pieQTL mapping in prioritizing SNPs that explain substantial variation of gene expression. However, due to high linkage disequilibrium (LD) (R2 > 0.8) between at least one pieQTL and one promoter eQTL for around 50% of genes with pieQTLs, it remains infeasible to computationally quantify the relative contribution of promoter eQTLs versus pieQTLs in gene regulation, highlighting the need for further experimental validations.
Functional characterization of pieQTLs.
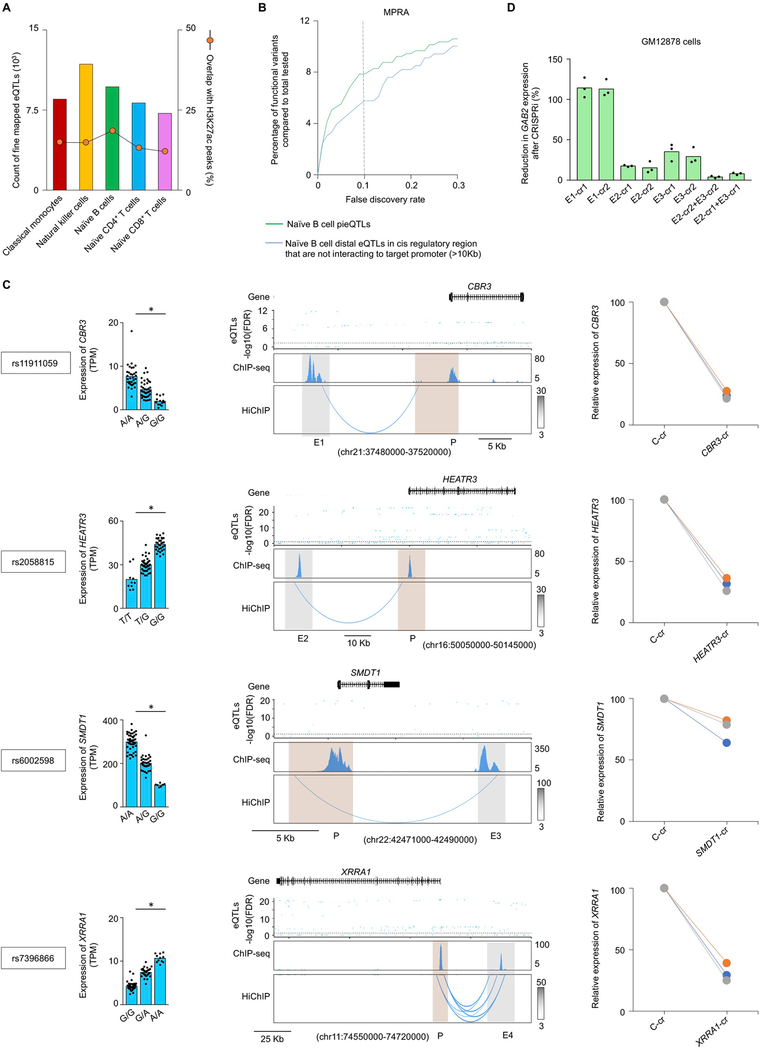
To test whether pieQTLs were enriched for functional variants that directly modulate gene expression, we used functionally validated genetic variants from two high-throughput reporter assays24,25. We found that among the variants tested by these assays, naïve B-cell pieQTLs were significantly enriched in functionally validated variants compared with all distal eQTLs (>10 kb away from TSS) (Fig. 2c). For both reporter assays, the higher enrichment for pieQTLs held true when compared with putative functional eQTLs identified by computational fine-mapping of B-cell eQTLs26 (Fig. 2c and Extended Data Fig. 4a) or with distal eQTLs that overlapped with active cis-regulatory regions not interacting to their target promoter (Extended Data Fig. 4b).
To validate the functional importance of pieQTLs for gene expression, we performed CRISPRi27 experiments to show that the DNA regions overlapping these pieQTLs acted as functional enhancers for their target genes (GAB2, CBR3, HEATR3, SMDT1, XRRA1; Fig. 2e,f and Extended Data Fig. 4c). For example, expression of GAB2 in T cells and B cells was associated with >600 SNPs present in dense haploblocks spanning a 300-kb region both upstream and downstream of the GAB2 gene, and included several cancer-risk SNPs28–30 (Fig. 2d). Among these eQTLs, we resolved a small number as pieQTLs (n = 3 in naïve CD4+ T cells and n = 58 in naïve B cells) that are likely to be enriched for functional SNPs. Interestingly, the pieQTLs in T cells were distinct from those in B cells, and were restricted to a cis-regulatory region (E1) >100 kb downstream of the GAB2 promoter, whereas the B-cell pieQTLs were mainly located in two cis-regulatory regions (E2 and E3) upstream of the GAB2 promoter. This finding indicated that these different pieQTLs are likely to impact distinct cell-specific cis-regulatory circuits and may explain why the cancer-risk allele (rs2511162G/G) was associated with increased GAB2 expression in T cells but lower expression in B cells (Fig. 2d). Using CRISPRi, we confirmed that the cis-regulatory regions (E1) that overlapped T-cell-specific pieQTLs function as an enhancer for GAB2 gene in Jurkat cells (T-cell line) but not in GM12878 cells (B-cell line), whereas the cis-regulatory regions (E2, E3) that overlapped B-cell-specific pieQTLs showed the opposite pattern (Fig. 2e and Extended Data Fig. 4d). Notably, the cis-regulatory element (E1) harboring T-cell-specific pieQTLs showed no genotype-dependent changes in H3K27ac enrichment but had a higher number of interactions in T cells from donors homozygous for the allele and correlated with higher expression (n = 4, rs2512539G/G) compared with heterozygous donors (n = 2, rs2512539G/T) (Fig. 2f). Allele-specific analysis of E1 interactions in naïve CD4+ T cells from heterozygous donors showed that the expression-increasing G allele had more HiChIP reads overlapping it compared with the T allele (11 reads versus 1 read). An independent luciferase-based reporter assay also confirmed the regulatory potential of the pieQTL (rs2512539) associated with GAB2 expression (Fig. 2g). Overall, using chromatin interaction maps of active cis-regulatory regions, we discovered pieQTLs that are likely to be enriched for functionally important genetic variants.
Ultra-long-distance cis-interactions define target genes of eQTLs.
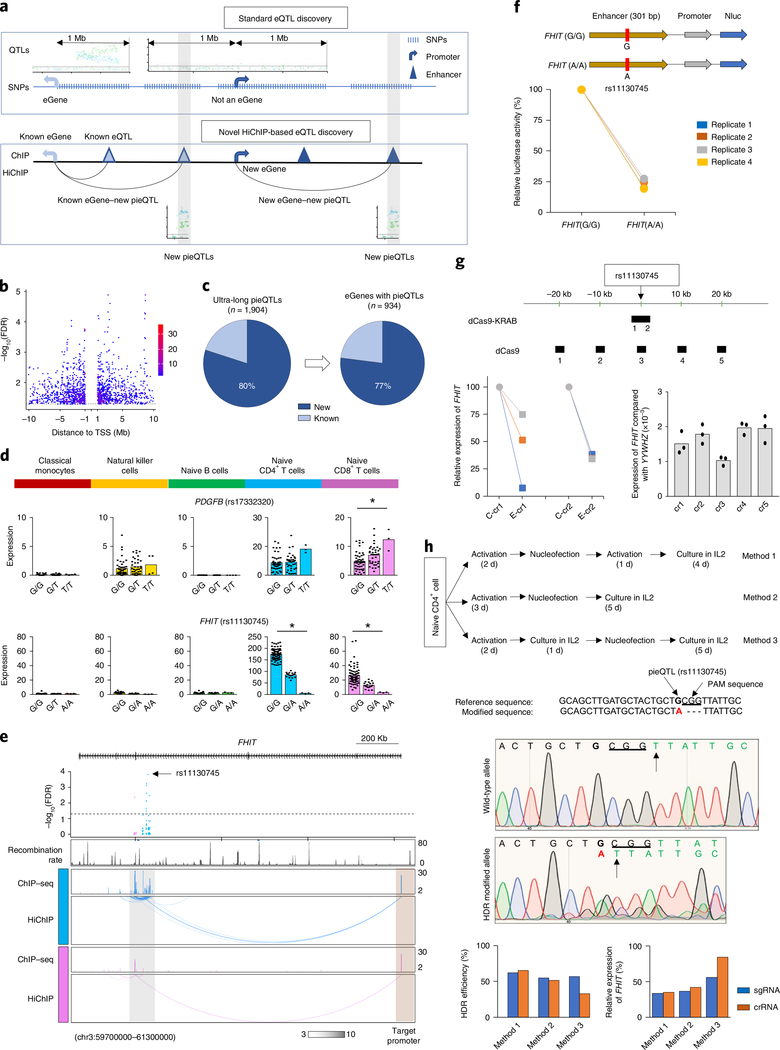
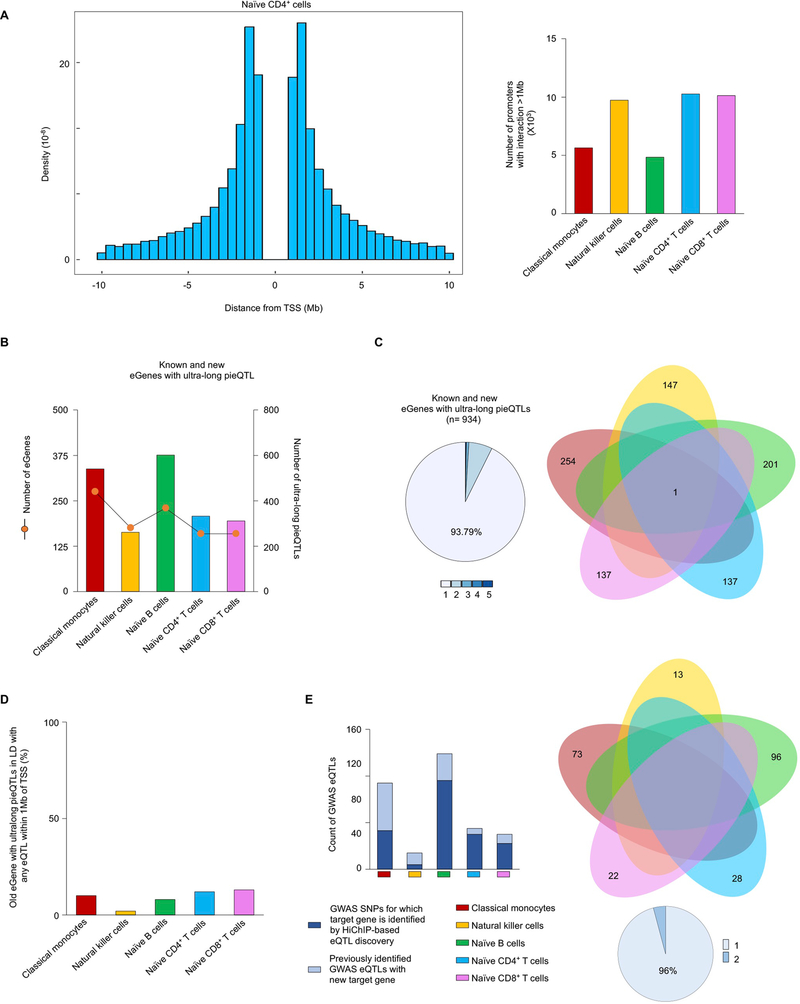
To minimize corrections for multiple association tests, most cis-eQTL discovery studies restrict analysis to SNPs within ±1 Mb of the TSS of the gene tested4,7 (Fig. 3a). Our HiChIP analysis revealed that many promoters (n > 5,000 for each cell type) directly or indirectly interacted with cis-regulatory elements that were located >1 Mb away (ultra-long cis-interactions) (Extended Data Fig. 5a), suggesting that SNPs present in these cis-regulatory elements, although >1 Mb away from the TSS of the gene in linear distance, may perturb their activity and in turn influence the transcriptional activity of their interacting gene promoter23,31. Therefore, it is likely that current approaches to eQTL discovery miss potentially important ultra-long-distance eQTLs (>1 Mb from TSS) as well as the target genes (eGenes) for disease-risk variants. To test this possibility, we devised an approach to eQTL discovery that relies on HiChIP-based promoter interaction maps as a structural framework for deciding what SNPs to test for association with gene expression. Here, we tested associations with gene expression only for the SNPs that overlapped DNA regions that directly or indirectly interacted with the promoter of potential target genes (promoter-interacting SNPs) up to 10 Mb away, that is, ultra-long-range interactions (Fig. 3a).
Fig. 3 |. Ultra-long-distance cis-interactions define target genes of eQtLs.
a, Schematic representation of standard and HiChIP-based eQTL discovery. b, Distance of ultra-long pieQTLs from the TSS of the target eGene; panel shows the adj. association FDR value for all ultra-long pieQTLs and the dotted line indicates adj. association FDR < 0.05. c, Pie charts show the percentages of new and known ultra-long pieQTLs and their associated eGenes. d, Mean expression levels (TPM) of selected eGenes in the indicated cell types from donors (n = 88) categorized based on the genotype at the indicated pieQTL; each symbol represents an individual subject; *adj. association P < 0.05 calculated by the Benjamini–Hochberg method. e, WashU Epigenome browser tracks for the extended FHIT locus, adj. association P values for naïve CD4+ T-cell and CD8+ T-cell eQTLs linked to FHIT expression, recombination rate tracks36,37, H3K27ac ChIP–seq tracks and HiChIP interactions as identified by FitHiChIP. f, The luciferase reporter construct of FHIT enhancer with reference and alternate alleles and their relative luciferase activity in Jurkat cells 72 h after nucleofection (n = 4). g, Top panel, the approximate genomic locations targeted by different crRNAs. Bottom left, real-time PCR quantification of FHIT transcript levels (relative to the housekeeping gene YWHAZ) in Jurkat cells 48 h after dCas9-KRAB-mediated silencing of the indicated enhancer with two independent crRNAs and control RNA (C-cr). Bottom right, real-time PCR quantification of FHIT gene transcript levels compared with the housekeeping gene YWHAZ in Jurkat cells 48 h after targeting dCas9 protein to the indicated genomic locations (n = 3). h, Upper panel, overview of three methods for CRISPR-mediated HDR in primary human T cells (from a donor homozygous for the rs11130745G/G allele). Middle panel, the Sanger sequencing result of the nonedited reference and HDR-modified allele. Bottom-left panel, efficiency of CRISPR-mediated genome editing of rs11130745G/G allele to rs11130745A/A allele with a deletion of the adjacent 3-bp PAM sequence by three independent methods using sgRNA and crRNA. Due to the dependency of fluorescence intensity on nucleotide identity, HDR efficiency was quantified based on the reduction in the intensity of the indicated ‘T’ allele (arrow, present in both reference and modified genomic regions) in the HDR-modified allele compared with the reference allele. Bottom-right panel, the percentage reduction in FHIT transcript levels in HDR-edited primary human T cells compared with conditions without HDR (control guide RNA).
Across the five DICE cell types, we discovered 1,904 unique ultra-long-distance pieQTLs, which included a small fraction (~20%) that were previously defined as eQTLs but for different target genes within 1 Mb (Fig. 3a–c, Extended Data Fig. 5b and Supplementary Table 5). The vast majority of the identified eGenes (~94%) and pieQTLs were highly cell-specific as ultra-long-distance cis-regulatory interactions also tended to be cell-specific (Extended Data Fig. 5c). In total, 934 unique eGenes were linked to these ultra-long-distance pieQTLs (Fig. 3c), which is a substantial addition to the eQTL discovery (n = 8,239 genes) for these five cell types from our previous study using a standard eQTL discovery approach4,7. A majority of these eGenes with an ultra-long pieQTL (~77%) did not have any eQTLs within 1 Mb of their TSS (Fig. 3c). Out of the remaining 23%, only a small number of genes (1–6 per cell type) had a strong LD between an ultra-long pieQTL and an eQTL, that is, within 1 Mb of their TSS (Extended Data Figs. 5d and 6 and Supplementary Methods). Overall, more than 96% of all eGenes with an ultra-long pieQTL did not have any eQTLs from the conventional range (±1 Mb of TSS), that is, in strong LD with the ultra-long pieQTL, suggesting that their long-range associations with gene expression cannot be attributed to another variant that is closer to the promoter.
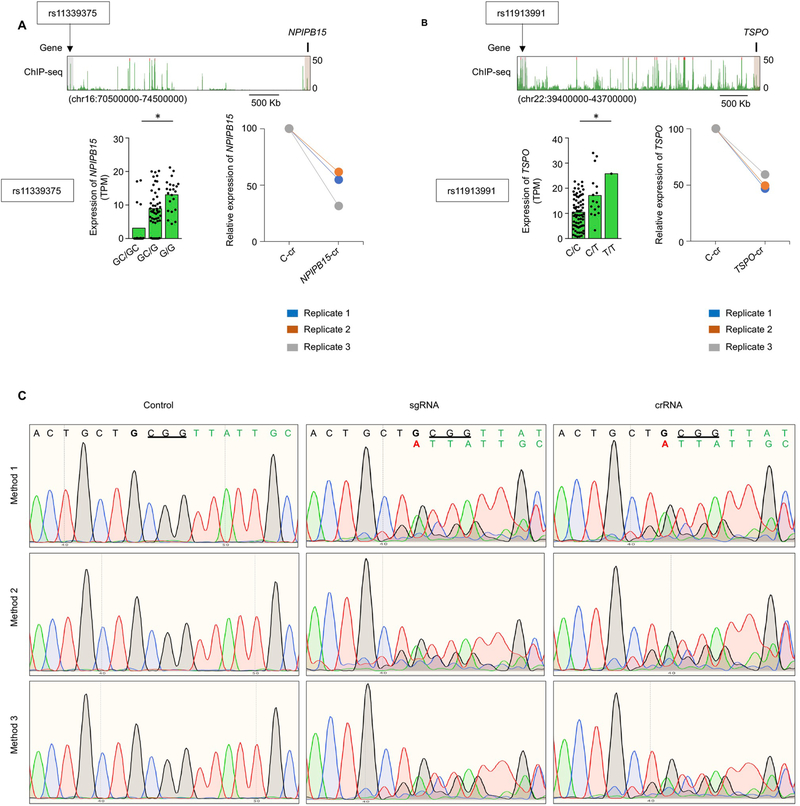
For three examples of ultra-long-pieQTL target genes (NPIPB15, located ~3.8 Mb away; TSPO, located ~4 Mb away; and FHIT, located ~1.2 Mb away), we performed CRISPRi to show that cis-regulatory regions overlapping ultra-long pieQTLs are functional enhancers for their target genes (Fig. 3g and Extended Data Fig. 7a,b). A noteworthy example of an eGene, FHIT, encodes for a member of the histidine triad gene family that functions as a tumor suppressor gene, for which we identified an ultra-long pieQTL (rs11130745) located ~1.2 Mb from its TSS in T cells (Fig. 3d). There were no significant eQTLs within 1 Mb of the TSS of FHIT gene and hence this gene was missed as an eGene in our previous report7. Chromatin interaction maps highlight the specific chromatin interaction between the FHIT promoter and the active cis-regulatory regions that overlapped the identified pieQTL (Fig. 3e). To test the function of this pieQTL (rs11130745), first we employed a luciferase-based reporter assay to confirm its allele-specific regulatory potential (Fig. 3f). CRISPRi confirmed that the cis-regulatory region overlapping rs11130745 functioned as an enhancer for FHIT (Fig. 3g). To better distinguish the genomic region predicted to have an effect on FHIT expression from nearby regions that are not predicted to have such an effect, we next used a catalytically dead Cas9 protein (dCas9) with tiling guide RNAs to target multiple regions around the pieQTL. Targeting the region overlapping rs11130745 specifically decreased FHIT expression compared with the four nearby regions within 20 kb (Fig. 3g). To further test the function of the allele (rs11130745G/G) associated with increased FHIT expression, we performed CRISPR-mediated homology-directed recombination (HDR) in primary human T cells (from a donor homozygous for the rs11130745G/G allele) (Fig. 3h, top panel). We successfully modified the DNA sequence of the allele associated with increased expression from rs11130745G/G to rs11130745A/A with a deletion of the adjacent 3-base-pair (bp) PAM sequence (Fig. 3h, middle panel, and Extended Data Fig. 7c), with high HDR efficiency (~50%). Using real-time PCR, we showed that this isogenic change in ~50% of the alleles reduced FHIT expression in primary human T cells when compared with conditions without HDR (Fig. 3h, bottom panel). Overall, we provide multiple lines of evidence to support that this ultra-long pieQTL (rs11130745) is likely to play an important role in controlling FHIT expression levels in T cells.
Our approach also identified a number of target genes (n = 73) for GWAS eQTLs, and found associations with gene expression (n = 242) for GWAS SNPs previously not thought to be eQTLs (Extended Data Fig. 5e). For example, our HiChIP-based eQTL analysis found a meningioma-risk SNP (>1 Mb away) that was significantly associated with the expression of PDGFB in naïve CD8+ T cells (Fig. 3d). In summary, our approach to eQTL discovery, which limits analysis to SNPs interacting with promoters, reduces multiple testing and improves statistical power to detect ultra-long-distance eQTLs and eGenes. This approach can be applied to reanalyze eQTL mappings for any cell type or tissue with matching HiChIP data.
Nontranscribing promoters can have enhancer activity.
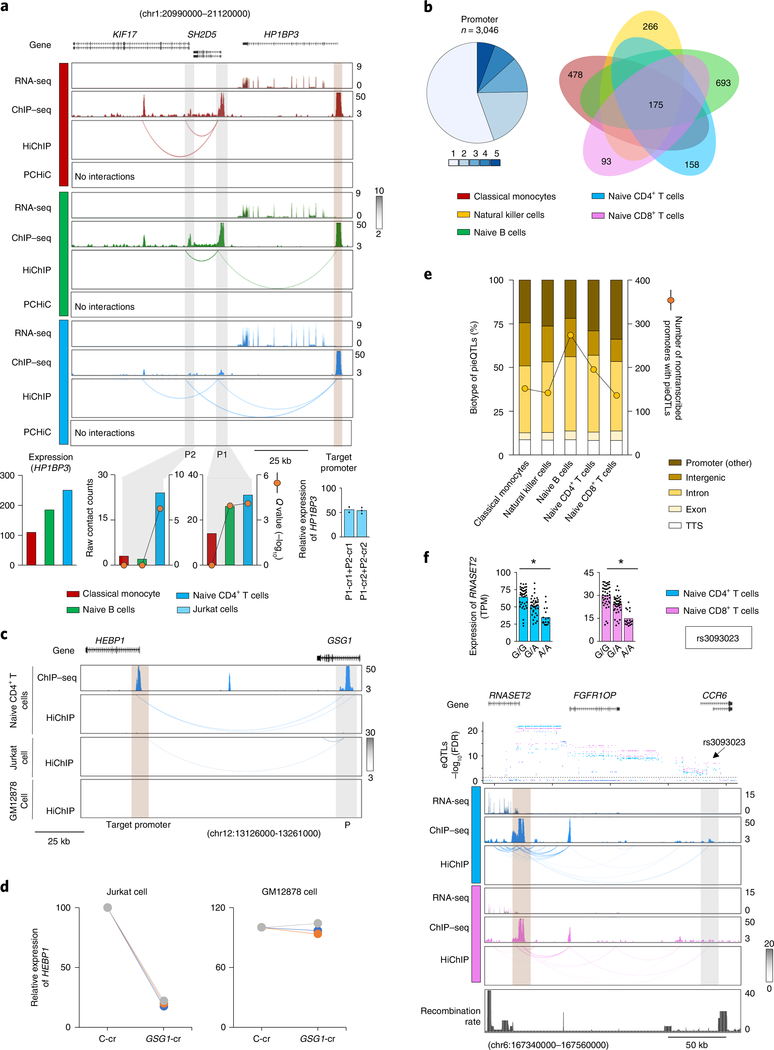
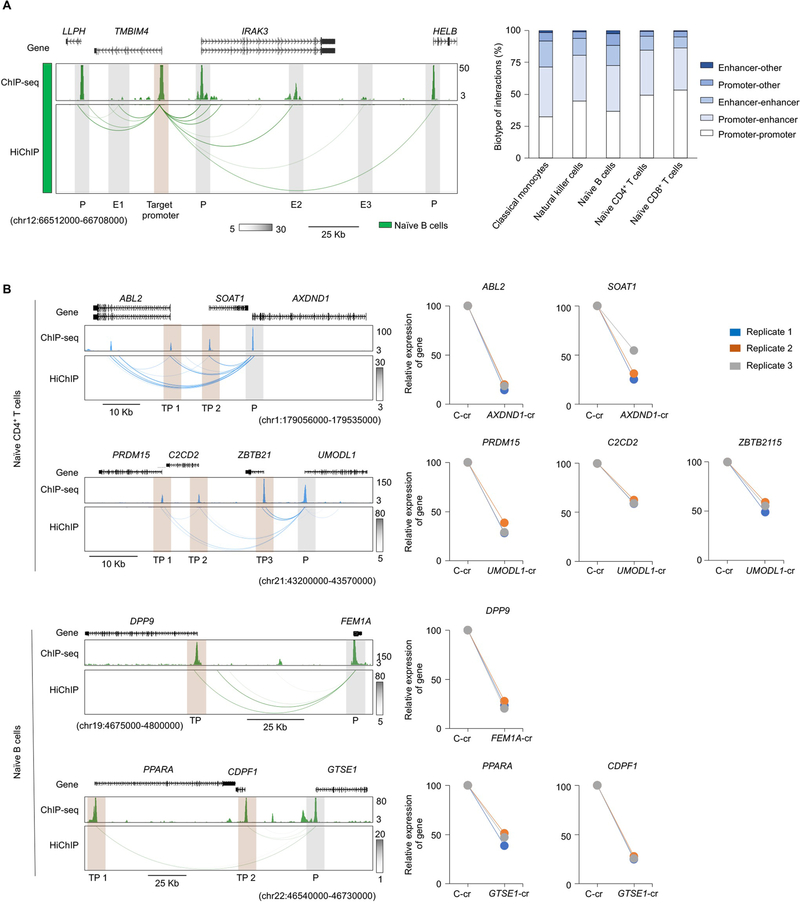
We found that over 40% of the promoter interactions were with another promoter region (Extended Data Fig. 8a). Surprisingly, a substantial number (n > 3,000) of these promoters were from transcriptionally inactive genes, which suggested that this class of promoters may function as active enhancers for distal genes (Supplementary Table 3). For a subset of promoters, we performed CRISPRi to investigate whether these promoters indeed have enhancer activity for the target genes they interacted with (Fig. 4a and Extended Data Fig. 8b). Overall, we found significant reduction in the expression levels of target genes whose promoters interacted with the silenced nontranscribing promoter (Extended Data Fig. 8b). For example, the promoter regions of two genes transcriptionally inactive in all profiled DICE cell types, SH2D5 and KIF17, interacted with the promoter of a transcriptionally active gene HP1BP3 in naïve CD4+ T cells and naïve B cells but not in classical monocytes. Notably, the expression level of HP1BP3 was lower in monocytes compared with CD4+ T cells and B cells (Fig. 4a). Using CRISPRi in Jurkat cells (T-cell line), we confirmed that targeting the promoters of SH2D5 and KIF17 significantly reduced the expression of HP1BP3 (Fig. 4a).
Fig. 4 |. Nontranscribing promoters have enhancer activity.
a, WashU Epigenome browser tracks for the extended HP1BP3 locus, RNA-seq tracks, H3K27ac ChIP–seq tracks, HiChIP interactions and PCHiC interactions in classical monocytes, naïve CD4+ T cells and naïve B cells. Bottom panel, HP1BP3 transcript levels, HiChIP raw contact counts and statistical significance (Q value) for the interaction of nontranscribing promoters (P1, P2) to the target promoter. Real-time PCR quantification of HP1BP3 transcript levels (relative to the housekeeping gene YWHAZ) in Jurkat cells 48 h after CRISPRi-mediated silencing of SH2D5 (P1) and KIF17 (P2) promoters with two independent crRNAs (cr1 and cr2) for each promoter; bar graph shows the percentage reduction in HP1BP3 transcript levels compared with control guide RNA; each dot represents an independent assay. b, Pie chart shows fractions of nontranscribed promoters with long-range interactions in varying numbers of cell types and their overlap in the indicated cell types (right panel). c, WashU Epigenome browser tracks for H3K27ac ChIP–seq tracks, and HiChIP interactions of the extended GSG1 locus for naïve CD4+ cells and HiChIP interactions for Jurkat and GM12878 cells. d, Real-time PCR quantification of respective gene transcript levels (relative to the housekeeping gene YWHAZ) in Jurkat cells or GM12878 cells 48 h after CRISPRi-mediated silencing of the indicated enhancer (n = 3). e, Percentages of pieQTLs belonging to each biotype, defined based on genomic location. The right axis shows the count of nontranscribed promoters that harbor pieQTLs. f, Mean expression levels (TPM) of RNASET2, an eGene in both naïve CD4+ T cells (*adj. association P value: 3.9 × 10⁻⁶) and naïve CD8+ T cells (*adj. association P value: 4.2 × 10⁻⁸), from donors (n = 89) categorized based on the genotype at the indicated cis-eQTL; each symbol represents an individual subject; *adj. association calculated by the Benjamini–Hochberg method. WashU Epigenome browser tracks for the extended RNASET2-CCR6 locus, adj. association P values for naïve CD4+ T-cell (blue color) and CD8+ T-cell (pink color) eQTLs linked to RNASET2 expression, RNA-seq tracks, H3K27ac ChIP–seq tracks, HiChIP interactions and recombination rate tracks36,37. RNA-seq, RNA sequencing; TTS, transcription termination site.
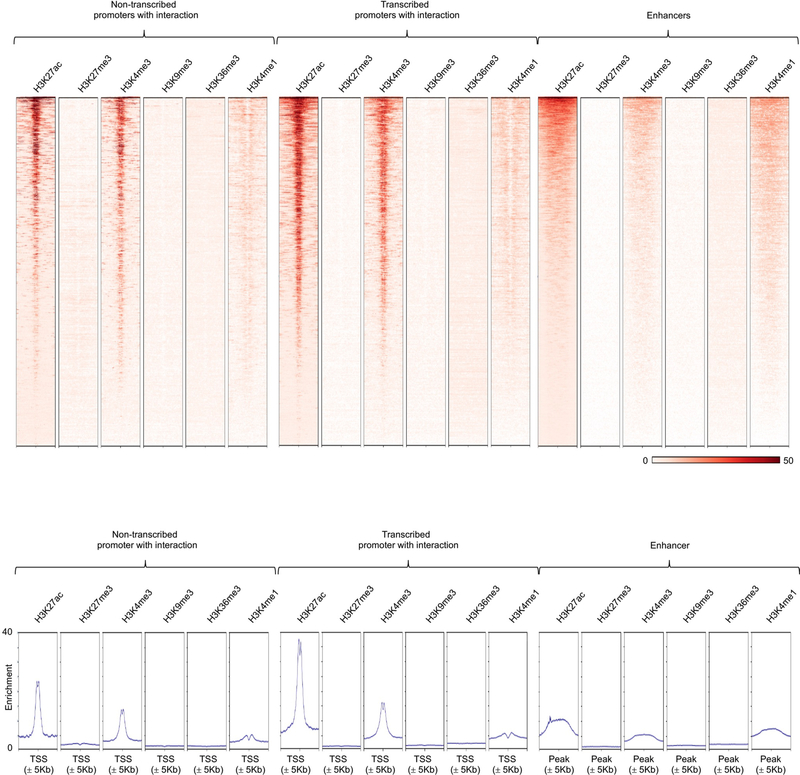
Comparison across all of the cell types showed that the majority of this class of transcriptionally inactive promoters that interacted with other promoters was cell-specific (Fig. 4b), thus highlighting the presence of a class (promoters of nontranscribed genes) of cell-specific cis-regulatory elements that can modulate expression levels of other genes. In the case of GSG1 promoter, a non-transcribed promoter with enhancer activity, we confirmed that its activity is cell-type-specific (Fig. 4c). GSG1 promoter interacts with HEBP1 promoter in a T-cell line but not in a B-cell line, and as expected silencing of GSG1 promoter in GM12878 cells had no significant effect on expression of HEBP1, whereas it substantially reduced expression of HEBP1 in Jurkat cells (Fig. 4d). Analyses based on one-dimensional chromatin assays suggested that this class of promoters have similar features as ‘transcribed promoters’ although they were not expressed (Extended Data Fig. 9). However, the three-dimensional proximity information from the HiChIP assay allowed us to accurately define their regulatory potential as active enhancers and to map them to their target genes32,33.
Among pieQTLs, we found that nearly 28% were composed of promoter–promoter interactions, that is, a pieQTL located in another promoter that interacts with the promoter of a target eGene (Fig. 4e). Both transcriptionally active and inactive promoters overlapped pieQTLs (Fig. 4e), the latter likely serving as enhancers for target eGenes, as described in Fig. 4a,d. For example, GWAS pieQTLs localized in the CCR6 promoter, which is transcriptionally inactive in naïve CD4+ and CD8+ T cells, were associated with the expression of a neighboring gene RNASET2 with whose promoter they interacted (Fig. 4f).
Cell-specific and genotype-dependent effects of pieQTLs.
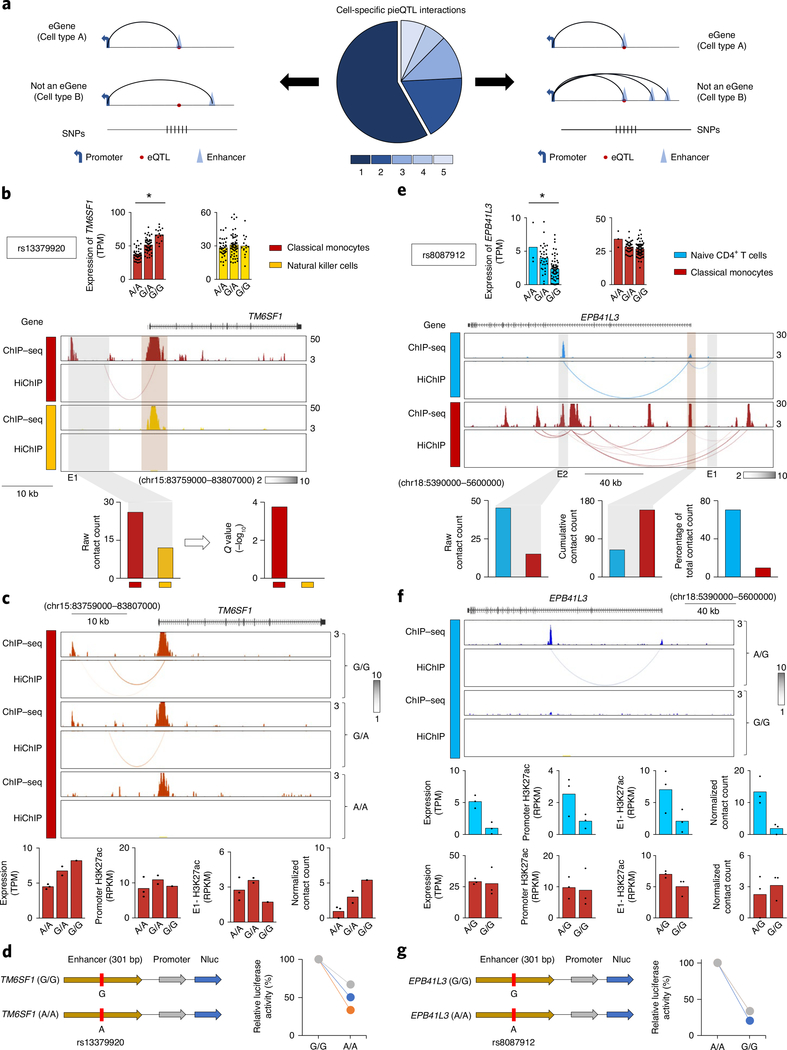
We next looked for mechanisms that mediate the cell-specific effects of pieQTLs. We found that a major fraction of promoter interactions of cell-specific pieQTLs were specific to the susceptible cell type (Fig. 5a, middle panel, and Supplementary Tables 3 and 4). For genes that are transcriptionally active in multiple cell types but display genotype-dependent effects in only one cell type, the cis-regulatory interactions specific to the susceptible cell type are likely to drive the effects of cell-specific pieQTLs, whereas the interactions and pieQTLs specific to cell types not affected by the eQTLs are less likely to be functionally important (Fig. 5a, left panel). For example, the TM6SF1 gene displayed genotype-dependent (rs13379920) association only in classical monocytes, although it was expressed in other immune cell types such as natural killer cells. We hypothesized that the monocyte-specific cis-regulatory interaction which overlapped pieQTLs are likely to drive genotype-dependent effects (Fig. 5b,c). Monocytes from donors homozygous for the expression-increasing allele (rs13379920G/G) showed higher interaction counts compared with heterozygous donors and those homozygous for the expressing-reducing allele r13379920A/A (Fig. 5c). Notably, H3K27ac enrichment levels at the TM6SF1 promoter and E1 enhancer did not show significant genotype-dependent changes (Fig. 5c, bottom panel). Luciferase-based reporter assay confirmed the regulatory potential of the pieQTL (rs13379920) associated with TM6SF1 expression (Fig. 5d).
Fig. 5 |. Mechanisms of cell-specific expression QTLs.
a, Pie chart shows the fractions of cell-specific pieQTLs with promoter interactions that are either cell-specific or shared between cell types; schematic representations of the two types of promoter interactions are shown. b, Mean expression levels (TPM) of TM6SF1, an eGene in classical monocytes (*adj. association P value: 2.5 × 10⁻¹⁰) but not in NK cells, from donors (n = 91) categorized based on the genotype at the indicated cis-eQTL; each symbol represents an individual subject; *adj. association P value calculated by the Benjamini–Hochberg method. WashU Epigenome browser tracks for the extended TM6SF1 locus, H3K27ac ChIP–seq tracks and HiChIP interactions in the indicated cell types. Bottom panel, HiChIP raw contact counts and statistical significance for the interaction of the indicated enhancer region (E1). c, H3K27ac ChIP–seq tracks and HiChIP interactions in classical monocytes from donors classified based on the genotype at rs13379920. Bottom panel, genotype-dependent effects on TM6SF1 transcript levels, H3K27ac enrichment levels at E1 enhancer region and TM6SF1 promoter region, and HiChIP normalized contact counts for the interaction of E1 enhancer region to TM6SF1 promoter; each symbol represents an individual subject. d, The luciferase reporter construct of TM6SF1 enhancer with reference and alternate alleles and their relative luciferase activities in THP-1 cells 72 h after nucleofection (n = 3). e, Mean expression levels (TPM) of EPB41L3, an eGene in naïve CD4+ T cells (*adj. association P value: 7.0 × 10⁻³) but not in classical monocytes, from donors (n = 87) categorized based on the genotype at the indicated cis-eQTL; each symbol represents an individual subject; *adj. association P value calculated by the Benjamini–Hochberg method. WashU Epigenome browser tracks for the extended EPB41L3 locus, H3K27ac ChIP–seq tracks and HiChIP interactions in the indicated cell types. Bottom panel, HiChIP raw contact counts and statistical significance (Q value) for the interaction of the indicated enhancer region (E2); middle graph shows total contact counts for all long-range interactions with the EPB41L3 promoter; right graph shows the percentages contributed by E2 interaction. f, H3K27ac ChIP–seq tracks and HiChIP interactions in naïve CD4+ T cells from donors classified based on the genotype at rs8087912. Bottom panel, genotype-dependent effects on EPB41L3 transcript levels, H3K27ac enrichment levels at E2 enhancer region and EPB41L3 promoter region, HiChIP normalized contact counts for the interaction of E2 enhancer region with EPB41L3 promoter for naïve CD4+ T cells and classical monocytes; each symbol represents an individual subject. g, The luciferase reporter construct of EPB41L3 enhancer with reference and alternate alleles and their relative luciferase activity in Jurkat cells 72 h after nucleofection (n = 3).
pieQTLs overlapping active cis-regulatory interactions that are shared between cell types could also drive cell-specific effects (Fig. 5a, right panel) in cases where such an interaction is the sole or one of the few cis-regulatory interactions in the susceptible cell type. The cell types not affected may have multiple other cis-regulatory interactions with the gene promoter, thus rendering the pieQTL interaction redundant for gene expression (Fig. 5a, right panel). This concept is well illustrated in the EPB41L3 locus, where pieQTLs overlapped a single cis-regulatory interaction (E2) that was shared by both naïve CD4+ T cells and monocytes, and yet displayed genotype-dependent association (rs8087912) only in naïve CD4+ T cells (Fig. 5e,f). Luciferase-based reporter assay confirmed the regulatory potential of the pieQTL (rs8087912) associated with EPB41L3 expression (Fig. 5g). This cis-regulatory interaction (E2) was one of the two EPB41L3 promoter interactions in CD4+ T cells, and showed genotype-dependent changes in H3K27ac enrichment and frequency of interaction that matched with the gene expression pattern in CD4+ T cells, suggesting functional importance for that cell type (Fig. 5f). However, in monocytes the EPB41L3 promoter interacted with six cis-regulatory elements, including E2 which overlaps with the T-cell-specific pieQTL rs8087912, without any genotype-dependent association to that SNP (Fig. 5d, bottom panel). This cell-type-specific difference in the role of E2 enhancer was reflected in the relative contribution of its interactions to the total number of EPB41L3 promoter interactions in the two cell types (Fig. 5d). This finding suggests that cell-type-specific redundancy in cis-regulatory interactions of a promoter may act as a buffer in masking the effect of a specific enhancer or an SNP on the corresponding gene’s expression, hence explaining cell-type restriction of some eQTLs and pieQTLs.
Discussion
The DICE project has illustrated that the majority of eQTLs, including those associated with disease risk, have strong effects on gene expression in only one or a few purified cell types, which implies that functional eQTLs are likely to perturb cell-specific gene regulation. Therefore, to comprehensively identify functional eQTLs in dense haploblocks with cell-type-specific associations, it is important to first define the cell-type-specific cis-regulatory regions and their interactions. This in turn requires the generation and comparison of high-resolution and highly sensitive cis-regulatory interaction maps in multiple primary human cell types and tissues. Currently available high-resolution Hi-C datasets are mainly in cell lines that may not recapitulate the cis-regulatory interactions in primary cell types34,35. PCHiC data exist for some primary immune cell types, but, as we and others16 have observed, the sensitivity and specificity of this assay to capture active cis-regulatory interactions are limited. HiChIP assay for H3K27ac has the advantage of capturing such active cis-regulatory interactions as opposed to structural interactions that may not directly influence gene expression.
To define potentially functional QTLs, we overlapped cis-regulatory interaction maps with eQTL datasets from matched cell types to define pieQTLs, a class of eQTLs that overlapped distal cis-regulatory elements which directly or indirectly interacted with the promoters of their target eGenes. pieQTLs as a class are likely to be enriched for functional QTLs as they have the potential to perturb the function of an active cis-regulatory element that influences transcriptional activity of the target eGene promoter. We have experimentally shown several examples where cis-regulatory elements harboring pieQTLs function as enhancers for their target eGenes.
Current approaches to discover cis eQTLs rely on imposing an arbitrary linear genomic distance from the TSS of the target gene (1 Mb) as a constraint to minimize the number of SNPs tested for association with gene expression levels. However, this approach can be overburdened by multiple testing, as all SNPs in the 1-Mb region regardless of whether they overlap cis-regulatory elements or interact with the promoter of the target gene are tested, thus reducing statistical power. We reasoned that an SNP located >1 Mb away, but overlapping a cis-regulatory element that interacted with a gene promoter, should justifiably be tested for association with expression of that gene, thereby giving priority to three-dimensional proximity rather than one-dimensional organization. We devised a strategy to revise eQTL mapping based on the cis-regulatory interaction map of the cell-type examined: for each expressed gene, we tested associations only for SNPs that overlapped a cis-regulatory element and interacted with its promoter region up to 10-Mb distance. This approach allowed us to identify several ultra-long-distance eQTLs and more target eGenes for known eQTLs, and can be extended to reanalyze eQTL datasets for any cell type or tissue for which a cis-regulatory interaction map is available.
The vast majority of cis-regulatory interactions were highly cell-type specific, which may explain why the majority of the eQTLs are also cell-specific, as there is a high possibility for these eQTLs perturbing cell-specific regulatory circuits. We highlighted how cell-specific eQTLs perturb cis-regulatory interactions that are both cell-type restricted and shared. Such molecular mechanisms that explain how long-distance eQTLs potentially regulate gene expression are likely to further support the value of unbiased genetic association studies to identify cell types and genes linked to human diseases.
Online content
Any methods, additional references, Nature Research reporting summaries, source data, extended data, supplementary information, acknowledgements, peer review information; details of author contributions and competing interests; and statements of data and code availability are available at https://doi.org/10.1038/s41588–020-00745–3.
Methods
Experimental model and cohort details.
Leukapheresis samples.
The Institutional Review Board of the La Jolla Institute for Allergy and Immunology (Institutional Review Board protocol no. SGE-121–0714) approved the study. For the DICE study, a total of 91 healthy volunteers were recruited in the San Diego area, who provided written, informed consent for collecting leukapheresis samples at the San Diego Blood Bank and sharing deidentified data for research purposes. All donors self-reported ethnicity and race details, and were tested negative for hepatitis B, hepatitis C and human immunodeficiency virus. We selected six individuals for this study; details are provided in Supplementary Table 1a.
Cell lines.
Jurkat cells and GM12878 cells were gifts from Anjana Rao (La Jolla Institute for Immunology) and Erez Lieberman Aiden (Baylor College of Medicine), respectively. Jurkat cells were cultured in RPMI-1640 (GIBCO) with 10% fetal bovine serum (FBS) (Hyclone, characterized SH3007103) and 100 U ml−1 Penicillin-Streptomycin (GIBCO). GM12878 cells were cultured in RPMI-1640 (GIBCO) with 15% FBS (Hyclone, characterized SH3007103) and 100 U ml−1 Penicillin-Streptomycin (GIBCO). THP-1 cells were obtained from ATCC and were cultured in RPMI-1640 (GIBCO) with 10% FBS (Hyclone, characterized SH3007103), 100 U ml−1 Penicillin-Streptomycin (GIBCO) and 0.05 mM 2-mercaptoethanol (GIBCO). HEK293T cells were a gift from Sonia Sharma (La Jolla Institute for Immunology) and were cultured in DMEM, high glucose, with 10% FBS (Hyclone, characterized SH3007103) and 100 U ml−1 Penicillin-Streptomycin (GIBCO).
Method details.
PBMC processing.
PBMCs were obtained from leukapheresis samples by density gradient centrifugation and cryopreserved in liquid nitrogen. For the isolation of immune cell types of interest, cryopreserved PBMCs were thawed, washed and stained directly with cocktails of fluorescently conjugated antibodies or pre-enriched for total B cells using the ‘Human B Cell Isolation Kit II’ (Miltenyi Biotec), following the manufacturer’s instructions, before staining with antibodies and sorting on a BD FACSAria II (Becton Dickinson) using the gating strategies as described7. Flow cytometry data were analyzed using FlowJo software (FlowJo v.10.4.1). The FACS-sorted cells were washed and fixed using 1% formaldehyde, as described38, for ChIP–seq and HiChIP assays.
HiChIP for H3K27ac.
Samples from six donors (as described above) from each cell type and replicates of two cell types from three donors were used for this assay. HiChIP was performed as described previously with some modifications10. Briefly, cells were crosslinked with 1% formaldehyde and flash-frozen in liquid nitrogen. Fixed cells were lysed to obtain the nuclear fraction, and then chromatin was digested in intact nuclei using 200 U of the 4-base cutter MboI (New England Biolabs), and restricted ends religated as described10. Pelleted nuclei were dissolved in 130 μl of nuclear lysis buffer (50 mM Tris-HCl, pH 7.5, 10 mM EDTA and 1% SDS) and were sonicated using a Covaris S220 for 4 min with the following settings: fill level 10, duty cycle 5, peak incidence power 105, cycles per burst 200. Sonicated chromatin was diluted ten times in ChIP Dilution Buffer (50 mM Tris-HCl, pH 8, 167 mM NaCl, 1.1 mM EDTA, 0.55 mM EGTA, 0.11% Na-deoxycholate, 1.1% Triton X-100 and 1× protease inhibitors) and immunoprecipitation was done overnight at 4 °C by incubating 2.5 μl (7 μg) of H3K27ac antibody (C15410196; Diagenode) precoated on 25-μl protein A-coated magnetic beads (Thermo Fisher Scientific). Immunocomplexes were captured and washed three times for 5 min each with RIPA buffer (10 mM Tris-HCl, pH 8, 140 mM NaCl, 0.1% SDS, 0.1% Na-deoxycholate, 1% Triton X-100, 0.5 mM EGTA and 1 mM EDTA), high-salt buffer (50 mM Tris-HCl, pH 8, 500 mM NaCl, 0.1% SDS, 0.5% Na-deoxycholate, 1% Nonidet-P40 and 1 mM EDTA), LiCl buffer (50 mM Tris-HCl, pH 8, 250 mM LiCl, 1 mM EDTA, 1% Nonidet-P40 and 0.5% Na-deoxycholate) and low-salt buffer (10 mM Tris-HCl, pH 8, 1 mM EDTA and 50 mM NaCl). Beads were resuspended in TE (10 mM Tris-HCl, pH 8, 1 mM EDTA), transferred to fresh tubes, captured and then resuspended in 200 μl of elution buffer (50 mM NaHCO3 and 1% SDS). Samples were treated with 10 μg of RNase A (Thermo Fisher Scientific) for 30 min at 37 °C and then with 2 μl of 20 mg ml−1 proteinase K (Thermo Fisher Scientific) for 1 h at 55 °C, and incubated overnight at 65 °C. DNA was purified using affinity columns (Zymo Research) and eluted in 20 μl of DNA elution buffer (10 mM Tris-HCl). Adapters were ligated to DNA using NEBNext Ultra DNA Library Prep Kit (New England Biolabs) according to the manufacturer’s protocol. Streptavidin C-1 beads were used to capture biotinylated DNA according to the manufacturer’s protocol and resuspended in 20 μl of DNA elution buffer (10 mM Tris-HCl). To generate the sequencing library, PCR amplifications of the DNA were performed while the DNA was still bound to the beads. Purified HiChIP libraries were size-selected to 300–800 bp using AMPure XP beads (Beckman Coulter Life Sciences) according to the manufacturer’s protocol and subjected to 2 × 50-bp paired-end sequencing on an Illumina HiSeq 2500 or NovaSeq6000 (Illumina).
CRISPRi targeting of enhancers using KRAB-dCas9.
At 3 d before CRISPRi assay, KRAB-dCas9-expressing cells (mCherry positive) were sorted again to ensure that all cells expressed KRAB-dCas9. Then, 44 μM crRNA and tracrRNA (from IDT) duplex specific for each target was prepared by mixing the two RNA oligos in equimolar concentrations in a sterile microcentrifuge and heating at 95 °C followed by cooling at room temperature. Cells were transfected with 3.6 μM crRNA and tracrRNA duplex specific for the target enhancer or for the nontargeting region (from IDT) using the Neon Transfection System (Thermo Fisher Scientific) according to the manufacturer’s protocol (settings: 1,600 V, 10 ms, 3 pulses); see Supplementary Table 1e for crRNA sequences. Fresh medium (as described above) was then added and cells were maintained for 48 h. After 48 h cells were collected and knockdown efficiency for the target gene was analyzed by real-time PCR for transcript levels.
Inhibition of targeted region using dCas9.
At 3 d before CRISPRi assay, dCas9-expressing cells (EGFP positive) were sorted to ensure that all cells expressed dCas9. Then, 44 μM crRNA and tracrRNA (IDT) duplex specific for each target was prepared by mixing the two RNA oligonucleotides in equimolar concentrations in a sterile microcentrifuge, and heating at 95 °C followed by cooling at room temperature. RNP complexes were prepared by incubating dCas9 and crRNA–tracrRNA duplex specific for target regions for 20 min at room temperature. Cells were transfected with RNP complex using the Neon Transfection System (Thermo Fisher Scientific) according to the manufacturer’s protocol (settings: 1,600 V, 10 ms, 3 pulses); see Supplementary Table 1e for crRNA sequences. Fresh medium (as described above) was then added and cells were maintained for 48 h. After 48 h cells were collected and knockdown efficiency was analyzed by real-time PCR for transcript levels of target genes.
Genome editing in activated CD4+ T cells.
Naïve CD4+ T cells purified using a magnetic-activated cell-sorting column were resuspended at a concentration of 2.5 × 10⁵ per ml in 1 ml of prewarmed IMDM medium, supplemented with 5% (vol/vol) heat-inactivated FBS and 2% (vol/vol) human AB serum (CellGro) and activated ex vivo with Dynabeads Human T-Activator CD3/CD28 (Thermo Fisher Scientific) at a bead-to-cell ratio of 2:1 for the indicated duration at 37 °C. Three different activation conditions were used to determine the activation condition that leads to efficient HDR efficiency as well as reproducibility of effect. After activation, Dynabeads were removed and cells were cultured in fresh medium with IL-2 for the indicated number of days. RNP complexes were prepared by incubating dCas9 with either single guide RNA (sgRNA) alone or crRNA–tracrRNA duplex specific for the target region for 20 min at room temperature. Then, 2.0 × 10⁵ activated CD4+ T cells were washed two times with PBS before resuspension in 8 μl of buffer T, and 80 pmol of HDR template was added to the cell suspension along with RNP complex. Cells were transfected using the Neon Transfection System (Thermo Fisher Scientific) according to the manufacturer’s protocol (settings: 1,600 V, 10 ms, 3 pulses); see Supplementary Table 1e for sgRNA and crRNA sequences. Fresh medium (as described above) was then added and cells were maintained for the indicated duration. Cells were collected, and DNA and RNA were isolated for downstream analysis. Genome editing was verified by Sanger sequencing and effects on gene expression assessed by real-time PCR for transcript levels.
Preprocessing of HiChIP data.
For individual samples in different cell types, we applied HiC-Pro pipeline39 on the respective paired-end reads (fastq files). Each end was mapped independently to hg19 reference genome, using the aligner bowtie2 (ref. 40) (v.2.3.3.1). We used the bowtie2 global options --very-sensitive -L 30 --score-min L,−0.6,−0.2 --end-to-end --reorder and bowtie2 local options --very-sensitive -L 20 --score-min L,−0.6,−0.2 --end-to-end --reorder during alignment. Aligned reads were then paired, and paired reads involving two different MboI restriction sites were retained. For read mapping, we used MAPQ threshold = 0 and MboI as the restriction enzyme. For each cell type, we then merged the valid read pairs (generated from HiC-Pro) of individual samples within the distance range 10 kb to 3 Mb, and randomly selected 70 M valid pairs within this range to create one aggregate HiChIP contact map per cell type. FitHiChIP was applied as described below on each individual sample as well as the aggregate HiChIP data per cell type to call statistically significant loops.
Loop calling from H3K27ac HiChIP data using FitHiChIP.
To estimate statistically significant interactions/loops from the generated HiChIP datasets, we employed FitHiChIP18, which was specifically designed for analysis of HiChIP data and shown to have higher sensitivity and specificity for loop calling compared with other approaches. FitHiChIP uses the valid read pairs generated by HiC-Pro39 and a set of reference ChIP–seq or HiChIP peaks corresponding to the target protein or histone modifications of interest (here H3K27ac) to derive statistically significant interactions in two stages: (1) performing a regression for each genomic distance to estimate parameters linking the bias values (normalized one-dimensional coverage per bin) to the observed HiChIP contact counts; and (2) smoothing the estimated parameters across different genomic distances by a monotonic spline-fitting technique (originally proposed in ref. 41). FitHiChIP applies fixed-size binning (here 5 kb) on the input set of valid HiChIP reads, and attributes a bin as peak-bin if that bin overlaps with a ChIP–seq or HiChIP-inferred peak in the reference peaks file, subject to 1-bp minimum overlap without any slack. Otherwise, the bin is labeled as a non-peak-bin. The background (set of locus pairs used to infer the null model) as well as the foreground (that is, set of locus pairs that were assigned a significance estimate) of FitHiChIP can be either peak-to-peak (that is, interactions between two peak bins) or peak-to-all (that is, interactions involving peak bins in at least one end). The default mode of FitHiChIP uses peak-to-all pairs for the foreground, which is the setting employed in this study.
For the background estimation (that is, estimating expected contact counts from all pairs), the use of only peak-to-peak pairs leads to a higher average background contact probability (stringent background or S), whereas the use of peak-to-all pairs leads to a less-stringent or a loose background (L). Accordingly, FitHiChIP-L reports a higher number of loop calls compared with FitHiChIP-S. For either model, the binomial distribution is employed on the generated contact probabilities to estimate the P values, which are then corrected for multiple testing. Interactions having false discovery rate (FDR) < 0.01 are considered significant and reported as loop calls. For the HiChIP samples reported in this study, we executed FitHiChIP using both loose and stringent background models. Except for the results presented in Figs. 1c,d and 3 and Extended Data Figs. 1b and 5, all other results reported in this study were generated using the stringent (S) background model of FitHiChIP.
Finding nontranscribing promoters acting as enhancers.
A nontranscribing promoter acting as an enhancer was defined as a nontranscribing gene g (expression < 1 transcripts per million (TPM)) provided there was no other gene g1 that had expression > 1 TPM, and the distance between the TSSs of g and g1 was less than 10 kb. A nontranscribing promoter acting as an enhancer is considered cell-specific if it is defined in only one cell type. The number of significant interactions associated with nontranscribing promoters acting as enhancers is equal to the number of loops whose one interacting bin is within 5 kb of the TSS of nontranscribing promoters acting as enhancers. Peak score for nontranscribing promoters acting as enhancers is computed as the mean peak significance (−log10 FDR) of all ChIP–seq peaks located within 500 bp of the TSS of nontranscribing promoters acting as enhancers.
Overlap of eQTLs with ChIP–seq peaks and finding pieQTLs.
We annotated an eQTL as overlapping with ChIP–seq peaks if the SNP was within 500 bp of a reference peak region. In this study, we used only those eQTLs that overlap with reference H3K27ac ChIP–seq peaks of corresponding cell types to check whether they are promoter interacting (pieQTL) or not. An eQTL was considered ‘near promoter’ or simply called as ‘promoter eQTL’ if it was within 10 kb of a defined TSS. A pieQTL was considered directly interacting with a gene if the pieQTL was within 5 kb of a bin that was involved in at least one significant interaction with another bin that was within 5 kb of the corresponding gene promoter. On the other hand, a pieQTL was considered interacting indirectly with a gene if both a bin within 5 kb of the pieQTL and a bin within 5 kb of the promoter interact significantly with a third bin that overlaps an H3K27ac peak and the same pieQTL is not directly interacting with the gene. FitHiChIP-S (peak-to-peak background model) loops were used to derive the pieQTLs and corresponding eGenes. We modeled an undirected graph G using the R package iGraph (https://igraph.org/r/) whose nodes correspond to promoter bins, enhancer bins and eQTL overlapping bins, and whose edges denote the presence of FitHiChIP-S loops between the corresponding bins. Direct and indirect connections involving pieQTLs were performed using graph analysis routines provided in iGraph. pieQTLs for individual cell types, overlapping with H3K27ac ChIP–seq peaks for the corresponding cell type, were annotated using HOMER42 (using the annotatePeaks.pl) to categorize them into one of the five categories: promoter, intergenic, intronic, exonic and transcription termination site.
Determination of ultra-long-range pieQTLs.
To identify ultra-long-range pieQTLs, a set of common SNPs previously analyzed7 was tested for association with the expression of transcripts using the MatrixEQTL package v.2.2, as described7. To minimize the number of tests performed per gene, we considered only genomic windows containing SNPs that showed significant interaction with a promoter defined by our HiChIP analysis. FitHiChIP-L loops were used to derive the ultra-long-range pieQTLs and corresponding eGenes. A linear model was fitted for the expression of each transcript for the underlying genotype of all SNPs located within a window. The first two principal components of the genotyping data were used as covariates to minimize possible differences introduced by the different ancestry in the samples. SNPs missing for more than 5% of the samples or with a minimum allele frequency lower than 5% were removed from the analysis. The regularized log transformation of the DESeq2 package43 was applied and the homoscedastic data were then quantile-normalized to diminish the effects of possible outliers. FDR values were calculated using the Benjamini–Hochberg method. For the determination of long-range pieQTLs and the affected transcripts and their comparison across cell types, the following thresholds were applied: FDR < 0.05, raw P < 0.0001, TPM > 1.0 and distance to TSS > 1 Mb.
GWAS SNP overlap.
GWAS SNPs were defined as previously described7. Briefly, we downloaded the dataset of the Phenotype-Genotype Integrator (PheGenI)44, which merges National Human Genome Research Institute (NHGRI) GWAS Catalog data with several databases of the National Center for Biotechnology Information, including Gene, dbGaP, OMIM, eQTL and dbSNP (September 2017; https://www.ncbi.nlm.nih.gov/gap/phegeni). SNP positions were back-translated from PheGenI’s GRCh38 annotation to GRCh37.p13 using SNPTracker45, and the resulting catalog of SNP–trait associations included 14,321 significant associations (lead GWAS SNPs; defined as P < 5 × 10⁻⁸) and 846 distinct phenotypes/traits. LD was calculated using PLINK v.1.90b3w (ref. 46) for continental ‘super-populations’ (AFR, AMR, EAS, EUR, SAS) based on data from phase 3 of the 1000 Genomes Project47. SNPs in tight genetic linkage with GWAS lead SNPs (LD threshold R2 > 0.8) in any of the five super-populations were retrieved along with the SNP information (for example, genomic location, allelic variant, allele frequencies). Utilizing this dataset, GWAS SNPs (lead SNPs and SNPs in LD) were analyzed for overlap with long-range pieQTLs (FDR < 0.05, raw P < 0.0001, TPM > 1.0 and distance to TSS > 1 Mb) separately for each cell type to identify transcripts regulated by SNPs in haploblocks containing GWAS lead SNP(s).
Statistical analysis and data display.
Processing of data, applied methods and codes are described in the respective section in the Methods. The numbers of individuals, samples and replicates analyzed, and the statistical tests performed, are indicated in the figure legends.
For the determination of cis-acting eQTLs and associated genes and their comparison across cell types, the following thresholds were applied: FDR < 0.05, raw P < 0.0001 and TPM > 1.0.
Statistical analysis for comparison between two groups was performed with Student’s paired two-tailed t-test or Wilcoxon matched-pairs signed-rank test using GraphPad Prism v.7.0d.
GraphPad Prism v.7.0d software and Microsoft Office were used for generating graphs and performing statistical significance tests. The R package (3.4) with custom scripts was utilized for generating heat maps and volcano plots. Statistical analysis for comparison between two groups was performed with Student’s paired two-tailed t-test or Wilcoxon matched-pairs signed-rank test using GraphPad Prism v.7.0d. WashU Epigenome browser was used to visualize the ChIP–seq peaks, HiChIP interactions and PCHiC interactions.
Reporting Summary.
Further information on research design is available in the Nature Research Reporting Summary linked to this article.
Data availability
The DICE project provides anonymized data for public access at http://dice-database.org. Individual-specific RNA-sequencing and genotype data are available from the database of Genotypes and Phenotypes (dbGaP) (accession number: phs001703.v1.p1). Individual-specific HiChIP and ChIP–seq data are available from dbGaP (accession number: phs001703.v3.p1). The list of pieQTLs for each cell type is available through https://dice-database.org. All downloaded data are available through public repositories such as Gencode, dbGaP, PheGenI, 1000 Genomes Project, IHEC data portal, GEO and SRA. Further information and requests for reagents may be directed to the corresponding author/lead contacts, Pandurangan Vijayanand (vijay@lji.org) and Ferhat Ay (ferhatay@lji.org).
Code availability
The code developed for the analyses performed in this study is available upon request as well as from GitHub at https://github.com/ay-lab/pieQTL_NG.
Supplementary Material
Extended Data
Extended Data Fig. 1 |. Active cis-regulatory interaction maps in human immune cell types from DiCe, Related to Fig. 1.
a, The number of H3K27ac ChIP-seq peaks detected in each cell type (left panel); center and right panel shows number of significant cis-regulatory interactions using two different background models (FitHiChIP-L and FitHiChIP-S, see Methods) from 70 million unique paired-end reads for each type. b, Correlation of log transformed HiChIP contact counts for assessing the reproducibility between two replicates of the same donor for naïve CD4+ T cells (top, n=3) and for classical monocytes (bottom, n=3). c, The distribution of genome-wide interaction distances for active cis-regulatory elements in each cell type. d, Percentage of all H3K27ac peaks with long-range (>10 Kb) interactions (FitHiChIP-L and FitHiChIP-S) identified using two different background models.
Extended Data Fig. 2 |. Promoter interacting eQtLs, Related to Fig. 2.
a, Pearson correlations of TPM counts between expression quantification methods applied to naïve CD4+ T cell RNA-seq data for nine HLA genes. Blue lines indicate linear regression between TPM counts. Gray shaded areas indicate 95% confidence intervals. b, Total number of HLA eGenes (left panel), eQTLs (middle panel) and eGene-eQTL pairs (right panel) in initial DICE study and with our revised HLA analysis using the HLApers pipeline (see Supplementary Methods). c, Total count of GWAS-pieQTLs and their percentage among all eQTLs and pieQTLs in each cell type. d, Percentage of all eQTLs (left panel) and GWAS-eQTLs (right panel) that are pieQTLs.
Extended Data Fig. 3 |. Conditional analysis of eQtLs, Related to Fig. 2.
a, Percentage of eGenes with pieQTLs that has no significant SNP in the second iteration of conditional analysis. b, Percentage of eGenes with pieQTLs that has a pieQTL or a promoter eQTL as the top conditionally independent SNP in any iteration. c, Distribution of LD values (R2) for promoter eQTLs and pieQTLs (the highest value per gene for each) with respect to the lead SNPs of conditional analysis in the first (E1 - upper panel) or the second (E2 - bottom panel) iteration for different cell types. d, Percentage of eGenes with pieQTLs that have at least one pieQTL or a promoter eQTL in strong LD (R2>0.8) with top conditionally independent SNP in any iteration. e, Percentage of eGenes with pieQTLs for which no SNP remains significant in conditional analysis after removing the effect of the top pieQTL. f, Percentage of eGenes with pieQTLs where promoter eQTL remains significant (that is, conditionally independent) after removing the effect of the top pieQTL in the conditional analysis.
Extended Data Fig. 4 |. Validation of Promoter interacting eQtLs, Related to Fig. 2.
a, Number of computationally fine-mapped eQTLs in different cell types, and the percentage of them located in genomic regions with H3K27ac peaks. b, Percentage of genetic variants deemed to have genotype-dependent enhancer activity (at different FDR thresholds) in lymphoblastoid B cell lines by MPRA assay among the pieQTLs from naïve B cells, pieQTLs that are specific to classical monocytes as well as among distal eQTLs (>10Kb from TSS) from both cell types. c, Left panels, mean expression levels (TPM) of CBR3, HEATR3, SMDT1 and XRRA1, eGenes in naïve CD4+ T cells from subjects (n>85) categorized based on the genotype at the indicated pieQTL; each symbol represents an individual subject; * adj. association P value < 0.05, calculated by Benjamini-Hochberg method. Middle panel, WashU Epigenome browser tracks for the extended CBR3, HEATR3, SMDT1 and XRRA1 locus, adj. association P value for naïve CD4+ T cells eQTLs linked to respective gene expression, H3K27ac ChIP-seq tracks, and HiChIP interactions for the indicated gene locus. Right panels, real-time PCR quantification of respective gene transcript levels (relative to the housekeeping gene YWHAZ) in Jurkat cells 48 hour after CRISPRi-mediated silencing of indicated enhancer (n=3). d, Real-time PCR quantification of GAB2 transcript levels (relative to the housekeeping gene YWHAZ) in GM12878 cells 48 hours after CRISPRi-mediated silencing of indicated enhancers (E1, E2, E3 and E2-E3 combined) with two independent crRNAs (cr1 and cr2); bar graph shows the percentage reduction in GAB2 transcript levels compared to control guide RNA, each dot represents an independent assay (n=3).
Extended Data Fig. 5 |. HiChiP-based eQtL discovery, Related to Fig. 3.
a, Distribution of interaction distances between promoters and cis-regulatory elements, right panel shows the number of promoters that have a statistically significant interaction (FitHiChIP-L) with cis-regulatory elements located >1 Mb to <10 Mb distance away. b, The number of ultra-long pieQTLs and eGenes identified by HiChIP-based eQTL discovery method in different cell types. c, Pie chart (left panel) shows the proportion of new eGenes that are shared among varying number of cell types and Venn diagram shows their cell type specificity (right panel). d, Percentage of previously identified eGenes7 with ultra-long pieQTLs (as mapped here) that have any such ultra-long pieQTL in LD (R2>0.8) with any eQTL within 1Mb of TSS. e, Number of new GWAS eQTLs identified by HiChIP-based eQTL discovery method in different cell types. Right panel, pie chart (bottom) shows the proportion of new GWAS eQTLs that are shared among varying number of cell types and Venn diagram (top) shows their cell type specificity.
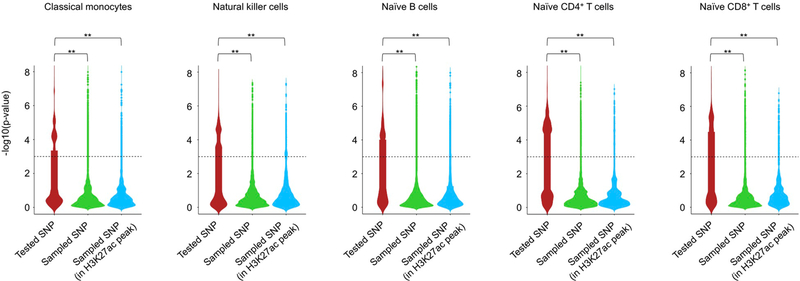
Extended Data Fig. 6 |. HiChIP-based eQTL discovery prioritizes the testing of ultra-long distance genetic variants with more significant associations to target gene expression, Related to Fig. 3.
Distribution of eQTL association P values in each cell type for SNPs tested in our ultra-long pieQTL discovery method (that is, overlapping promoter interacting regulatory regions within 1 Mb to 10 Mb of the TSS), and for genomic distance-matched set of SNPs either randomly sampled or sampled from H3K27ac peak-overlapping regions. All association P values were computed using MatrixEQTL package as described in Methods. Two-sided Wilcoxon rank-sum test was used to determine the significance of difference between a pair of distributions (** indicates P value < 1e-6).
Extended Data Fig. 7 |. Validation of ultra-long pieQtL, Related to Fig. 3.
a, WashU Epigenome browser tracks for the extended NPIPB15 locus and H3K27ac ChIP-seq tracks for the indicated locus. Bottom left panel, mean expression levels (TPM) of NPIPB15, eGenes in naïve B cells from subjects (n=91) categorized based on the genotype at the indicated cis-eQTL; each symbol represents an individual subject; * adj. association P value: 0.007, calculated by Benjamini-Hochberg method. Bottom right panel, real-time PCR quantification of NPIPB15 transcript levels (relative to the housekeeping gene YWHAZ) in GM12878 cells 48 hour after CRISPRi-mediated silencing of indicated enhancer (n=3). b, WashU Epigenome browser tracks for the extended TSPO locus and H3K27ac ChIP-seq tracks for the indicated locus. Bottom left panel, mean expression levels (TPM) of TSPO, eGenes in naïve B cells from subjects (n=86) categorized based on the genotype at the indicated cis-eQTL; each symbol represents an individual subject; * adj. association P: 0.03, calculated by Benjamini-Hochberg method. Bottom right panel, real-time PCR quantification of TSPO transcript levels (relative to the housekeeping gene YWHAZ) in GM12878 cells 48 hours after CRISPRi-mediated silencing of indicated enhancer (n=3). c, CRISPR-mediated homology-directed recombination (HDR) in primary human T cells from a donor homozygous for the rs11130745G/G allele for the FHIT-related 1.2 Mb away ultra-long pieQTL. The sanger sequencing result of CRISPR-mediated genome editing of rs11130745G/G allele to rs11130745A/A allele with a deletion of the adjacent 3 bp PAM sequence by three independent methods using control RNA, sgRNA and crRNA is shown.
Extended Data Fig. 8 |. Non-transcribed promoters that function as potential enhancers, Related to Fig. 4.
a, Left panels, WashU Epigenome browser tracks for the extended TMBIM4 locus, H3K27ac ChIP-seq tracks and HiChIP interactions in naïve B cells. Target promoter is highlighted in salmon color and other interacting cis-regulatory elements (promoter and enhancers) are highlighted in grey color. Right panels, Percentage of chromatin interactions belonging to each biotype. b, Left panels, WashU Epigenome browser tracks for H3K27ac ChIP-seq tracks, and HiChIP interactions of the extended AXDND1 and UMODL1 locus for naïve CD4+ T cells; FEM1A and GTSE1 locus for naïve B cells. Right panels, real-time PCR quantification of respective gene transcript levels (relative to the housekeeping gene YWHAZ) in Jurkat cells or GM12878 cells 48 hour after CRISPRi-mediated silencing of indicated enhancer (n=3).
Extended Data Fig. 9 |. Properties of non-transcribed promoters that function as potential enhancers, Related to Fig. 4.
Enrichment heatmap (upper panel) and distribution frequency (bottom panel) of H3K27ac, H3K27me3, H3K4me3, H3K9me3, H3K36me3 and H3K4me1 modifications centered on TSS ± 5 Kb for non-transcribed promoters, transcribed promoters and enhancers with interactions. ChIP-seq bigwig tracks of the histone marks H3K27me3, H3K36me3, H3K4me1, H3K4me3, and H3K9me3 were downloaded from the IHEC data portal (https://epigenomesportal.ca/ihec/grid.html?build=2017–10&assembly=1&cellTypeCategories=1).
Acknowledgements
We thank the La Jolla Institute (LJI) Flow Cytometry Core for assisting with cell sorting; the LJI’s Clinical Studies Core for organizing sample collection; and the IGM Genomics Center at the University of California in San Diego for technical support with genotyping of tissue donors. We thank J.A. Greenbaum (LJI) and B. Ha (LJI) for data submission to dbGaP. We also thank the members of Ay and Vijayanand laboratories for their valuable comments and suggestions. This work was funded by NIH grants no. R24-AI108564 (P.V., F.A., B.P., M.K.) and no. R01-HL114093 (P.V.), the William K. Bowes Jr Foundation (P.V.), grant no. R35-GM128938 (F.A.) and grant no. UL1-TR002550 (P.M.). Utilized equipment was supported by the NIH grants no. S10RR027366 (BD FACSAria II) and no. S10-OD016262 (Illumina HiSeq 2500).
Footnotes
Competing interests
The authors declare no competing interests.
Additional information
Extended data is available for this paper at https://doi.org/10.1038/s41588-020-00745-3.
Supplementary information is available for this paper at https://doi.org/10.1038/s41588-020-00745-3.
Correspondence and requests for materials should be addressed to F.A. or P.V.
Peer review information Nature Genetics thanks the anonymous reviewers for their contribution to the peer review of this work.
Reprints and permissions information is available at www.nature.com/reprints.
References
- 1.MacArthur J et al. The new NHGRI-EBI Catalog of published genome-wide association studies (GWAS Catalog). Nucleic Acids Res. 45, D896–D901 (2017). [DOI] [PMC free article] [PubMed] [Google Scholar]
- 2.International HapMap Consortium. A haplotype map of the human genome. Nature 437, 1299–1320 (2005). [DOI] [PMC free article] [PubMed] [Google Scholar]
- 3.McCarthy MI et al. Genome-wide association studies for complex traits: consensus, uncertainty and challenges. Nat. Rev. Genet 9, 356–369 (2008). [DOI] [PubMed] [Google Scholar]
- 4.Consortium GTEx. The genotype-tissue expression (GTEx) project. Nat. Genet 45, 580–585 (2013). [DOI] [PMC free article] [PubMed] [Google Scholar]
- 5.Carithers LJ & Moore HM The genotype-tissue expression (GTEx) project. Biopreserv. Biobank 13, 307–308 (2015). [DOI] [PMC free article] [PubMed] [Google Scholar]
- 6.Keen JC & Moore HM The genotype-tissue expression (GTEx) project: linking clinical data with molecular analysis to advance personalized medicine. J. Pers. Med 5, 22–29 (2015). [DOI] [PMC free article] [PubMed] [Google Scholar]
- 7.Schmiedel BJ et al. Impact of genetic polymorphisms on human immune cell gene expression. Cell 175, 1701–1715.e16 (2018). [DOI] [PMC free article] [PubMed] [Google Scholar]
- 8.Schmiedel BJ et al. 17q21 asthma-risk variants switch CTCF binding and regulate IL-2 production by T cells. Nat. Commun 7, 13426 (2016). [DOI] [PMC free article] [PubMed] [Google Scholar]
- 9.Smemo S et al. Obesity-associated variants within FTO form long-range functional connections with IRX3. Nature 507, 371–375 (2014). [DOI] [PMC free article] [PubMed] [Google Scholar]
- 10.Mumbach MR et al. Enhancer connectome in primary human cells identifies target genes of disease-associated DNA elements. Nat. Genet 49, 1602–1612 (2017). [DOI] [PMC free article] [PubMed] [Google Scholar]
- 11.Consortium EP An integrated encyclopedia of DNA elements in the human genome. Nature 489, 57–74 (2012). [DOI] [PMC free article] [PubMed] [Google Scholar]
- 12.Roadmap Epigenomics Consortium et al. Integrative analysis of 111 reference human epigenomes. Nature 518, 317–330 (2015). [DOI] [PMC free article] [PubMed] [Google Scholar]
- 13.Yao L, Berman BP & Farnham PJ Demystifying the secret mission of enhancers: linking distal regulatory elements to target genes. Crit. Rev. Biochem. Mol. Biol 50, 550–573 (2015). [DOI] [PMC free article] [PubMed] [Google Scholar]
- 14.Schoenfelder S & Fraser P Long-range enhancer–promoter contacts in gene expression control. Nat. Rev. Genet 20, 437–455 (2019). [DOI] [PubMed] [Google Scholar]
- 15.Stadhouders R, Filion GJ & Graf T Transcription factors and 3D genome conformation in cell-fate decisions. Nature 569, 345–354 (2019). [DOI] [PubMed] [Google Scholar]
- 16.Javierre BM et al. Lineage-specific genome architecture links enhancers and non-coding disease variants to target gene promoters. Cell 167, 1369–1384.e19 (2016). [DOI] [PMC free article] [PubMed] [Google Scholar]
- 17.Fang R et al. Mapping of long-range chromatin interactions by proximity ligation-assisted ChIP-seq. Cell Res. 26, 1345–1348 (2016). [DOI] [PMC free article] [PubMed] [Google Scholar]
- 18.Bhattacharyya S, Chandra V, Vijayanand P & Ay F Identification of significant chromatin contacts from HiChIP data by FitHiChIP. Nat. Commun 10, 4221 (2019). [DOI] [PMC free article] [PubMed] [Google Scholar]
- 19.Schoenfelder S, Javierre BM, Furlan-Magaril M, Wingett SW & Fraser P Promoter capture Hi-C: high-resolution, genome-wide profiling of promoter interactions. J. Vis. Exp 136, e57320 (2018). [DOI] [PMC free article] [PubMed] [Google Scholar]
- 20.Aguiar VRC, Cesar J, Delaneau O, Dermitzakis ET & Meyer D Expression estimation and eQTL mapping for HLA genes with a personalized pipeline. PLoS Genet. 15, e1008091 (2019). [DOI] [PMC free article] [PubMed] [Google Scholar]
- 21.Ay F & Noble WS Analysis methods for studying the 3D architecture of the genome. Genome Biol. 16, 183 (2015). [DOI] [PMC free article] [PubMed] [Google Scholar]
- 22.Dobbyn A et al. Landscape of conditional eQTL in dorsolateral prefrontal cortex and co-localization with schizophrenia GWAS. Am. J. Hum. Genet 102, 1169–1184 (2018). [DOI] [PMC free article] [PubMed] [Google Scholar]
- 23.Consortium GT et al. Genetic effects on gene expression across human tissues. Nature 550, 204–213 (2017). [DOI] [PMC free article] [PubMed] [Google Scholar]
- 24.Tewhey R et al. Direct identification of hundreds of expression-modulating variants using a multiplexed reporter assay. Cell 165, 1519–1529 (2016). [DOI] [PMC free article] [PubMed] [Google Scholar]
- 25.Kalita CA et al. High-throughput characterization of genetic effects on DNA–protein binding and gene transcription. Genome Res. 28, 1701–1708 (2018). [DOI] [PMC free article] [PubMed] [Google Scholar]
- 26.Benner C et al. FINEMAP: efficient variable selection using summary data from genome-wide association studies. Bioinformatics 32, 1493–1501 (2016). [DOI] [PMC free article] [PubMed] [Google Scholar]
- 27.Gilbert LA et al. Genome-scale CRISPR-mediated control of gene repression and activation. Cell 159, 647–661 (2014). [DOI] [PMC free article] [PubMed] [Google Scholar]
- 28.Litchfield K et al. Identification of 19 new risk loci and potential regulatory mechanisms influencing susceptibility to testicular germ cell tumor. Nat. Genet 49, 1133–1140 (2017). [DOI] [PMC free article] [PubMed] [Google Scholar]
- 29.Wang Z et al. Meta-analysis of five genome-wide association studies identifies multiple new loci associated with testicular germ cell tumor. Nat. Genet 49, 1141–1147 (2017). [DOI] [PMC free article] [PubMed] [Google Scholar]
- 30.Litchfield K et al. Identification of four new susceptibility loci for testicular germ cell tumour. Nat. Commun 6, 8690 (2015). [DOI] [PMC free article] [PubMed] [Google Scholar]
- 31.Smallwood A & Ren B Genome organization and long-range regulation of gene expression by enhancers. Curr. Opin. Cell Biol 25, 387–394 (2013). [DOI] [PMC free article] [PubMed] [Google Scholar]
- 32.Dao LTM et al. Genome-wide characterization of mammalian promoters with distal enhancer functions. Nat. Genet 49, 1073–1081 (2017). [DOI] [PubMed] [Google Scholar]
- 33.Jung I et al. A compendium of promoter-centered long-range chromatin interactions in the human genome. Nat. Genet 51, 1442–1449 (2019). [DOI] [PMC free article] [PubMed] [Google Scholar]
- 34.Thormann V et al. Genomic dissection of enhancers uncovers principles of combinatorial regulation and cell type-specific wiring of enhancer–promoter contacts. Nucleic Acids Res. 46, 2868–2882 (2018). [DOI] [PMC free article] [PubMed] [Google Scholar]
- 35.Schmitt AD et al. A compendium of chromatin contact maps reveals spatially active regions in the human genome. Cell Rep. 17, 2042–2059 (2016). [DOI] [PMC free article] [PubMed] [Google Scholar]
- 36.Kong A et al. A high-resolution recombination map of the human genome. Nat. Genet 31, 241–247 (2002). [DOI] [PubMed] [Google Scholar]
- 37.Kong A et al. Fine-scale recombination rate differences between sexes, populations and individuals. Nature 467, 1099–1103 (2010). [DOI] [PubMed] [Google Scholar]
- 38.Seumois G et al. Epigenomic analysis of primary human T cells reveals enhancers associated with TH2 memory cell differentiation and asthma susceptibility. Nat. Immunol 15, 777–788 (2014). [DOI] [PMC free article] [PubMed] [Google Scholar]
- 39.Servant N et al. HiC-Pro: an optimized and flexible pipeline for Hi-C data processing. Genome Biol. 16, 259 (2015). [DOI] [PMC free article] [PubMed] [Google Scholar]
- 40.Langmead B & Salzberg SL Fast gapped-read alignment with Bowtie 2. Nat. Methods 9, 357–359 (2012). [DOI] [PMC free article] [PubMed] [Google Scholar]
- 41.Ay F, Bailey TL & Noble WS Statistical confidence estimation for Hi-C data reveals regulatory chromatin contacts. Genome Res. 24, 999–1011 (2014). [DOI] [PMC free article] [PubMed] [Google Scholar]
- 42.Heinz S et al. Simple combinations of lineage-determining transcription factors prime cis-regulatory elements required for macrophage and B cell identities. Mol. Cell 38, 576–589 (2010). [DOI] [PMC free article] [PubMed] [Google Scholar]
- 43.Love MI, Huber W & Anders S Moderated estimation of fold change and dispersion for RNA-seq data with DESeq2. Genome Biol. 15, 550 (2014). [DOI] [PMC free article] [PubMed] [Google Scholar]
- 44.Ramos EM et al. Phenotype–Genotype Integrator (PheGenI): synthesizing genome-wide association study (GWAS) data with existing genomic resources. Eur. J. Hum. Genet 22, 144–147 (2014). [DOI] [PMC free article] [PubMed] [Google Scholar]
- 45.Deng JE, Sham PC & Li MX SNPTracker: a swift tool for comprehensive tracking and unifying dbSNP rs IDs and genomic coordinates of massive sequence variants. G3 (Bethesda) 6, 205–207 (2015). [DOI] [PMC free article] [PubMed] [Google Scholar]
- 46.Purcell S et al. PLINK: a tool set for whole-genome association and population-based linkage analyses. Am. J. Hum. Genet 81, 559–575 (2007). [DOI] [PMC free article] [PubMed] [Google Scholar]
- 47.1000 Genomes Project Consortium et al. A global reference for human genetic variation. Nature 526, 68–74 (2015). [DOI] [PMC free article] [PubMed] [Google Scholar]
Associated Data
This section collects any data citations, data availability statements, or supplementary materials included in this article.
Supplementary Materials
Data Availability Statement
The DICE project provides anonymized data for public access at http://dice-database.org. Individual-specific RNA-sequencing and genotype data are available from the database of Genotypes and Phenotypes (dbGaP) (accession number: phs001703.v1.p1). Individual-specific HiChIP and ChIP–seq data are available from dbGaP (accession number: phs001703.v3.p1). The list of pieQTLs for each cell type is available through https://dice-database.org. All downloaded data are available through public repositories such as Gencode, dbGaP, PheGenI, 1000 Genomes Project, IHEC data portal, GEO and SRA. Further information and requests for reagents may be directed to the corresponding author/lead contacts, Pandurangan Vijayanand (vijay@lji.org) and Ferhat Ay (ferhatay@lji.org).


