Abstract
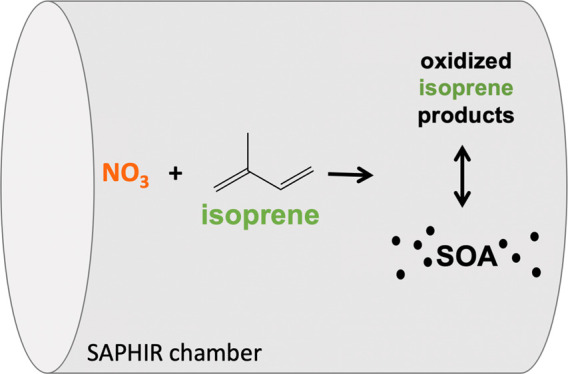
Alkyl nitrate (AN) and secondary organic aerosol (SOA) from the reaction of nitrate radicals (NO3) with isoprene were observed in the Simulation of Atmospheric PHotochemistry In a large Reaction (SAPHIR) chamber during the NO3Isop campaign in August 2018. Based on 15 day-long experiments under various reaction conditions, we conclude that the reaction has a nominally unity molar AN yield (observed range 90 ± 40%) and an SOA mass yield of OA + organic nitrate aerosol of 13–15% (with ∼50 μg m–3 inorganic seed aerosol and 2–5 μg m–3 total organic aerosol). Isoprene (5–25 ppb) and oxidant (typically ∼100 ppb O3 and 5–25 ppb NO2) concentrations and aerosol composition (inorganic and organic coating) were varied while remaining close to ambient conditions, producing similar AN and SOA yields under all regimes. We observe the formation of dinitrates upon oxidation of the second double bond only once the isoprene precursor is fully consumed. We determine the bulk partitioning coefficient for ANs (Kp ∼ 10–3 m3 μg–1), indicating an average volatility corresponding to a C5 hydroxy hydroperoxy nitrate.
Keywords: isoprene, nitrate, oxidation mechanism, peroxy radicals, gas-aerosol partitioning, secondary organic aerosol
1. Introduction
Isoprene (C5H8) has the largest nonmethane biogenic volatile organic compound emission, at around 600 Tg/year, compared to all other mono- and sesquiterpenes combined, which are emitted at around 150 Tg/year.1 Isoprene is emitted during the day by deciduous trees2 and is primarily oxidized by OH (daytime lifetime ∼ 1–2 h), O3 (24 h average lifetime ∼ 1 days), and NO3 (night-time lifetime highly variable, from 10 min to >100 h depending on available NOx). During the day, OH and O3 are the primary oxidizers; however, isoprene emissions are large enough that isoprene can remain abundant in the boundary layer3 and can continue to react at night by O3 and NO3. Nitrate radical oxidation is considered night-time reaction because NO3 reacts rapidly with photochemically generated NO and undergoes photolysis during the day;4 however, due to its high reactivity with isoprene (rate constants of isoprene with O3: 1 × 10–17 cm3 molecules–1 s–15 and NO3: 6.78 × 10⁻¹³ cm3 molecules–1 s–1,6 at 298 K), this reaction can also be important in power plant plumes7 and shaded forest canopies where photolysis is suppressed. Because of this, NO3 is an important oxidizer of isoprene, particularly in regions where urban or industry plumes travel into forests.
The nitrate (NO3) radical-initiated oxidation of isoprene is a key atmospheric reaction in regions subject to both biogenic and anthropogenic emissions. Recently, several studies have shown large but variable mass yields of secondary organic aerosol (SOA) formed from this reaction, ranging from 2 to 14% in chambers8,9 up to 30% based on field measurements,10 suggesting that it may also be an important contributor to global aerosol concentrations.11 This variability has spurred further research into the product branching ratios and volatility.12,13 Even with generally lower SOA mass yields than the larger mono- and sesquiterpenes,1 isoprene is expected to be a substantial contributor to aerosol loading because of its far larger global emission rate.14 More quantitative information about these NO3-initiated isoprene oxidation products is necessary to better understand the mechanisms of these reactions for use in modeling and predictions of changes in the global aerosol budget. This knowledge will further improve our understanding of the impacts of SOA on solar radiative forcing and thus surface temperature,15,16 visibility degradation, and human health.17,18
The importance of isoprene in the global SOA budget has been studied and reviewed recently.14,19 The gas-phase products of isoprene photo-oxidation have previously been thought to be too small and too volatile to self-nucleate and condense into the particle phase, and studies have shown the total isoprene SOA mass yield for all oxidants to be ∼3%.20,21 A chamber study on isoprene photo-oxidation by Liu et al.22 found SOA mass yields up to 15%, a factor of 2 or more higher than mass yields used in chemical models. In the presence of seed aerosol, the organonitrate products from the oxidation of isoprene partition into the particle phase. The type of seed aerosol used (acidic/neutral or inorganic/organic) has also been shown to yield different amounts of SOA for the oxidation of isoprene.23
Atmospheric simulation experiments in chambers are valuable tools to investigate mechanistic details of VOC oxidation and SOA formation. In a large chamber such as the SAPHIR chamber used here (270 m3 volume), a further advantage is the ability to access near-ambient conditions, because wall losses compete less efficiently with the chemical processes of interest. However, chamber studies do have limitations that must be considered in analyzing results. Most chamber studies of isoprene SOA show low amounts of oxidation products and especially low amounts of aerosol. One factor that may contribute to this is the insufficient time to allow products to further react after first-generation products have been formed. Due to the semivolatile nature of the SOA, products form and can quickly partition to the walls in a chamber, reducing the accessible reaction timescale. In the real atmosphere, reaction products continue to react much longer and can slowly form later-generation products; these products would normally only be formed quickly enough to be observed on chamber experiment timescales when run at elevated concentrations.
In the experiments reported here, to further simulate true atmospheric conditions and enhance partitioning to particles rather than walls, seed aerosol was used in some experiments. Beyond overcoming wall loss constraints, this use of seed aerosol is more similar to real atmospheric conditions, where a variety of different particles exist that isoprene gas products can condense onto. To the extent that current models use SOA parameterizations primarily derived from experiments without seed aerosol, they may underestimate partitioning to the particulate phase and thus SOA yields.
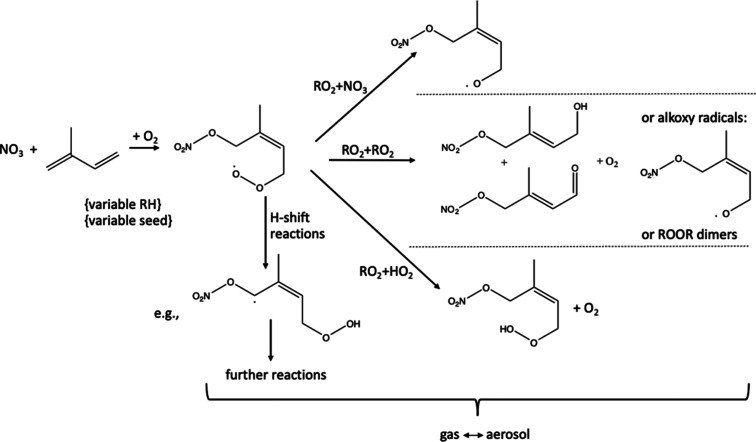
This NO3Isop chamber campaign sought to characterize the mechanisms and yields of SOA from the NO3-radical-initiated oxidation of isoprene under varying conditions, with a motivating question of whether certain chemical regimes lead to larger SOA mass yields (see Figure 1). This paper describes (1) the alkyl nitrate (AN or RONO2) molar yields for the entire campaign, across both seeded and unseeded experiments, (2) the SOA mass yield and bulk aerosol composition for all seeded experiments, and (3) the observed aggregate gas-particle partitioning coefficient (Kp) for all seeded experiments. The observed AN yields for the different peroxy radical (RO2) loss pathways help to interpret the oxidation mechanism; we expect that under hydroperoxy (HO2)-dominated bimolecular loss conditions, we will form more organic peroxides, while under RO2-dominated bimolecular loss conditions, we will favor dimer formation, and under lower concentrations, we will favor unimolecular decomposition which could enable auto-oxidation via intramolecular H-shift reactions. On the other hand, the formation of an alkoxy radical (RO) is possible from all bimolecular reactions. The Kp can be compared to theoretical calculations of partition coefficients to estimate the functionality of the major products and can be compared to other experimentally derived partitioning coefficients to compare volatilities. Better understanding of the gas-particle partitioning and SOA yields can improve model predictions of global aerosol.
Figure 1.
NO3 + isoprene reactions, showing the major initial pathways of RO2 reaction. This study explored varying RO2 fate regimes, seed composition, and RH.
2. Experimental Methods
2.1. SAPHIR Chamber Experiments
The SAPHIR chamber is a double-walled 250 μm-thick Teflon-FEP cylindrical cavity, 5 m in diameter and 18 m long with an approximate 270 m3 volume. The chamber is operated with synthetic air, and chamber pressure is kept at 35 Pa (overpressure) above ambient pressure to avoid contamination from external air. The chamber is inside of an aluminum structure with maneuverable shutters that can be opened to simulate day time chemistry. Further description of the SAPHIR chamber can be found in other studies.24,25 The campaign described here included 1 month of chamber experiments in August 2018.26
NO3 was formed in these experiments by the reaction of NO2 + O3 and, in one case, from the dissociation of N2O5 supplied from a solid sample in a cold trap. In all experiments, NO3 and NO2 will exist in equilibrium with N2O5. Experiments for the NO3Isop campaign were characterized by temperatures between 15 and 40 °C, most typically 20–25 °C, and under varying humidity conditions (ranging from 0 to 80% relative humidity). Ozone was injected to keep a chamber mixing ratio of approximately 100 ppbv, while the NO2 and isoprene concentrations varied. NO2 injections were varied to achieve mixing ratios of 5 to 25 ppbv. Isoprene was added in injections that achieved approximately 3 or 10 ppbv. Generally, O3 and NO2 were introduced at the same time and isoprene was added shortly after. This was repeated periodically throughout some experiments to continue buildup of products; the number of injections was not uniform across all experiments.
In experiments aiming to favor RO2 + HO2 reactions, an OH scavenger, usually carbon monoxide (CO), and an HO2 source, propene (via ozonolysis), were added (09 August and 21 August). To favor RO2 isomerization, isoprene and oxidant concentrations were kept lower to keep the concentration of the radicals low, so that RO2 would be produced more slowly and would be more likely to undergo unimolecular reactions due to the lower concentrations of potential bimolecular reaction partners. This can be seen in experiments from 7 August, 10 August, 16 August, and 18 August. In an effort to favor RO2 + RO2, higher concentrations of isoprene were added to increase the RO2 production rate, as on 08 August, 13 August, 14 August, 15 August, and 20 August. On 19 August, N2O5 was used as a NO3 source to avoid any contribution from ozonolysis to an RO2 + RO2 regime experiment. Some experiments studied the night-to-day transition chemistry by opening the shutters after all reactants had been added. This transition can be seen in experiments from 6 August, 12 August, 16 August, and 18 August. A full list of experiments and experimental parameters can be found in the Supporting Information section in Table S1.
Seeded experiments also had the addition of ammonium sulfate seed before the oxidants were introduced. Typically, approximately 60 μg m–3 seed aerosol was added at the start of experiments before any gas-phase reagent additions. Ammonium sulfate was used as the inorganic seed compound, while some experiments also had β-caryophyllene and O3 added to coat the seed with an organic coating produced from the rapid ozonolysis of caryophyllene. In these experiments, NO3 production and isoprene oxidation were started only after β-caryophyllene had reacted away with ozone.
An overview of the instruments used for the analyses below is shown in Table S2, alongside key parameters for these experiments.
2.2. TD–CRDS Measurements at SAPHIR
We deployed a thermal dissociation–cavity ring-down spectrometer (TD–CRDS) for the measurements of NO2, total peroxynitrates (ΣPNs), total alkyl nitrates (ΣANs), and HNO3, in both the gas phase and particle phase. This instrument27 couples a custom-built thermal dissociation oven inlet system with a commercial Los Gatos Research Inc. (model #907-0009) cavity ring-down spectrometer. To measure the various classes of organonitrates, the four inlet ovens are held at room temperature, 130, 385, and 700 °C.
At the SAPHIR chamber, the TD–CRDS was housed in one of the trailers beneath the chamber, with a 5 m-long 1/4” Teflon inlet line running through the floor into the chamber. This necessarily relatively long inlet line appears to have resulted in some inlet memory effects that were apparent in measurements during this chamber campaign. At the instrument flow of 1.2 lpm, this inlet length results in a residence time of 3.1 s in the line.
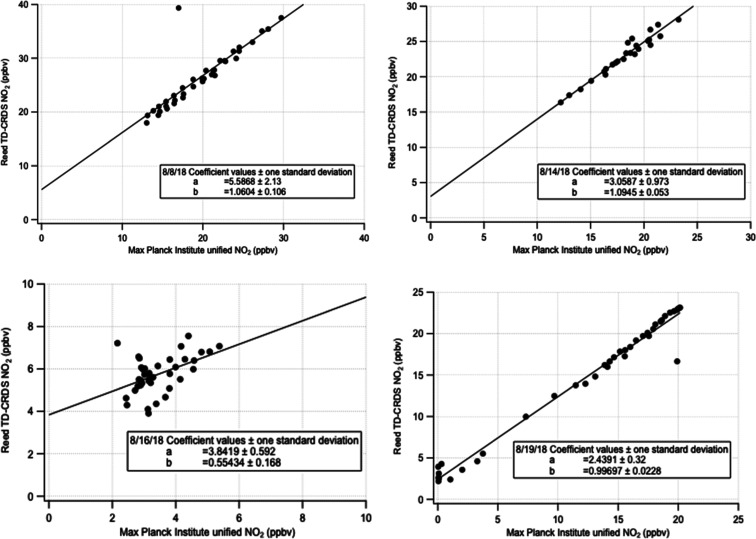
During the NO3Isop campaign, TD–CRDS NO2 measurements were compared to those from other instruments measuring NO2. A unified NO3Isop campaign NO2 data set was created from NO2 measurements from two independent custom-built thermal dissociation cavity ring-down NO2 spectrometers operated by the Max Planck Institute.28 This is used as the abscissa in Figure 2, which illustrates comparisons made for several illustrative days. The Reed TD–CRDS instrument typically measured higher values, exhibiting substantial and varying positive intercepts, suggesting background NO2 from inlet memory effects. The corresponding NO2 time-series comparisons for these four illustrative days are shown in the Supporting Information, Figure S1. The slopes of the intercomparison typically range from 1 to 1.1 but in some (especially low concentration) cases is much more poorly constrained due to high scatter. The four comparisons show that experiments spanning a large range of NO2 mixing ratios have the best defined slopes. Only the slope variability is relevant to the uncertainty of the AN measurement, since it is a subtractive measurement and any varying NO2 background will be removed. Based on these slope differences in multiple days’ comparisons of independent measurements of NO2 concentrations, we make the assessment that the uncertainty in ANs measured by TD–CRDS during these experiments is 10%, and we flag several experiments with more poorly defined NO2 correlations as questionable and thus omit them from the overall AN yield calculation.
Figure 2.
NO2 comparisons from SAPHIR chamber experiments in Julich, Germany, in 2018 (experiments from 08 August, 14 August, 16 August, and 19 August). This figure shows illustrative scatter plots of the TD–CRDS NO2 against the unified NO2 data set from three independent Max Planck Institute run cavity ring-down measurements. These instruments have slightly varying relationships to one another day-to-day, suggesting the presence of inlet memory effects. Slopes were, for the most part, consistent within 10%, resulting in an estimated uncertainty of the AN measurements used here of 10%. Several days (August 9, 12, 16, and 21) had more scatter and thus poorly defined slopes with differences of up to 50%; these are indicated by italics in Table 1.
There are several corrections that can be applied to the data from the various measurement channels in the TD–CRDS:27 denuder breakthrough of various species on the aerosol channels, radical recombination in the PAN oven, and O3 pyrolysis in the HNO3 oven. Because we are only using the gas-phase ΣANs measurement for this study, the data do not require corrections. The instrument was zeroed hourly (by diversion of the inlet to the CRDS through an NO2 scrubber) during the campaign. This scrubber was baked immediately prior to the campaign to remove any potential background signal.
We note that the TD–CRDS instrument can, in principle, measure aerosol-phase organic nitrates. However, because only a small amount of produced ANs partitioned into the aerosol phase across all experiments and because a 5 m Teflon inlet line was required, which will transmit gas-phase ANs well but allow losses of particles, we found that aerosol-phase ANs were below the detection limit of TD–CRDS for this campaign. Therefore, as described below, we use the aerosol mass spectrometry (AMS) organic nitrate aerosol measurements. For these experiments, our singular focus on the ΣAN measurements obviates the need to make ozone pyrolysis or recombination or denuder breakthrough corrections. A representative AN thermogram (ramping oven temperature) on the SAPHIR chamber mix of isoprene + NO3 products is shown in Supporting Information, Figure S2.
2.3. AN Yield Determination
ANs are predicted and observed to be the majority of products for the NO3 radical-initiated oxidation of isoprene. To calculate the total AN yield for each experiment, a measurement of the total ANs (ΣANs) was used from a thermal dissociation–cavity ring-down spectrometer (TD–CRDS) and divided by the amount of isoprene consumed by NO3 during the experiment. Wall loss corrections were applied to the ΣAN measurements, using a wall loss rate measured for ΣANs during a previous chamber study in the SAPHIR chamber (2.2 × 10⁻⁵ s–1; Rollins et al.9). Unfortunately, we do not have an experimental determination of wall losses from this campaign period; using this older determined rate assumes that wall losses in the SAPHIR chamber do not change significantly over time. For the longest experiment, 10 August (∼7 h), we can see that the maximum cumulative wall losses for these experiments would result in a final concentration corrected upward by 25%. The more typical 3 h experiments had a maximum wall-loss-corrected concentration difference of 7%.
The amount of isoprene that reacted with NO3 was calculated using the measured isoprene loss (VOCUS, see Table S2) and subtracting from that the losses due to dilution and reaction with O3. The VOCUS isoprene data were corrected with an empirical factor of 0.7 for the dry days, an adjustment based on comparison to another proton transfer reaction mass spectrometry used during this campaign, as well as the change in measured OH and NO3 reactivity at the point in time at which isoprene was injected.26 The dilution loss rate was derived from the measured inflow required to keep the chamber at constant pressure relative to the total chamber volume, and the loss to ozonolysis was calculated from the measured O3 concentration using the IUPAC-recommended rate coefficient29 [1.05 × 10⁻¹⁴ × exp (−2000/T)]. Losses due to the reaction with OH are not included, since the OH concentration was below the limit of detection. The resulting amount of isoprene consumed by reaction with NO3 remains an upper limit of the actual value, since the contribution of OH radicals could not be determined because their concentration was below the limit of detection. Instead, the given uncertainty (the larger of 10% or 0.5 ppbv) includes the amount of isoprene that would have been consumed, had the concentration of OH radicals been exactly at the detection limit. Further discussion of uncertainty propagation to the ANs and SOA yields is shown below in Sections 3.1 and 3.2.
The AN yields reported here represent the molar fraction of isoprene that reacted with NO3 and subsequently produced an AN product. We assume negligible contributions from nitrates other than from NO3 + isoprene; we note slightly larger AN yields under the RO2 + HO2 regime, suggesting that there may be some contribution from nitrates from NO3 + propene (which was present in all HO2 experiments; modeling suggests that approximately the same amount of propene as isoprene reacts with NO3). The AN molar yield was calculated for each experiment day by determining the slope of the wall-loss-corrected measured AN concentrations versus the isoprene consumed by NO3 (see Figure 3 for a representative example).
Figure 3.
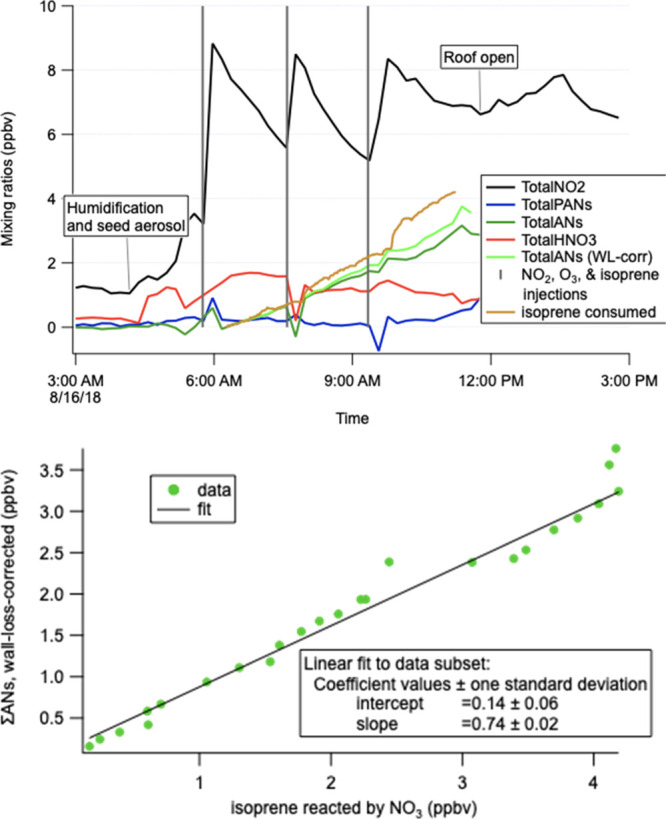
Representative example of AN molar yield calculation, using the experiment of 16 August. Wall-loss-corrected total AN concentration over the full time series of each experiment (including multiple isoprene, NO2, and O3 injections) is regressed against isoprene reacted; the slope is converted to % to be the yield. This plot shows a 74% molar yield.
2.4. AMS Measurements and SOA Yield Calculations
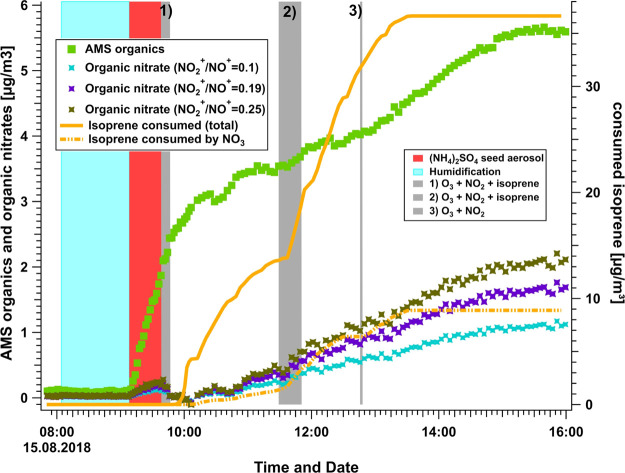
A high-resolution time-of-flight AMS (HR-ToF-AMS, Aerodyne Research Inc., USA) instrument was used to measure total mass concentrations and size distribution of nonrefractory chemical composition of the PM1 (including ammonium (NH4+), nitrate (NO3–), sulfate (SO42–), chloride (Cl–), and organic compounds) inside the SAPHIR chamber. The high-resolution measurements were also used to determine and track the changes in the oxygen to carbon ratio (O:C) of the SOA during the cause of each experiment. Details of the instrument are described in previous publications.30,31 Only instrument parameters and settings specific to this campaign will be given here. Two calibrations were performed (at the beginning and the end of the campaign) using size-selected 350 nm dried NH4NO3 particles and a condensation particle counter (CPC, model 3786, TSI, USA), as described in previous studies.32 An average ionization efficiency of (8.15 ± 0.26) × 10–8 was determined. Relative ionization efficiencies (RIE) for NH4+ and SO42– were determined during the standard calibration procedures as well. The RIE of Org, NH4+, NO3–, SO42–, and Cl– were 1.4, (3.78 ± 0.12), 1.1, (1.13 ± 0.04), and 1.3, respectively. AMS collection efficiency was determined by comparing AMS and scanning mobility particle sizer (SMPS) data and was found to be ∼0.5. Aerosol mass concentrations were corrected for wall losses using the decrease in the sulfate mass concentration of AMS. SO42– originates only from the seed aerosols on which the products from the oxidation of isoprene will condense. Therefore, one can assume that the loss in aerosol due to dilution and wall loss can be corrected using SO42– as an inert tracer for the loss processes in the chamber. Particulate organic nitrate mass concentrations (pOrgNO3) were calculated using the approach of determining the ratio of the NO2+ to NO+ ion signal, discussed in more detail below. The resulting mass loading of OrgNO3part refers only to the mass of the nitrate moiety, with the organic portion of the ANs detected as OA. To determine SOA yields, experiments were selected where after initiating the reaction and subsequent increase in the organic mass fraction on the seed aerosol, stable conditions were reached and no more increase in organic mass on the seed aerosol could be observed. An example for a typical experiment is shown in Figure 4.
Figure 4.
Time-series data for 15 August experiment, showing the AMS organics and calculated organic nitrates using different NO2+/NO+ ion ratios on the left axis. The calculated isoprene consumed by NO3 and total consumed isoprene are shown on the right axis. Colored bars indicate the start and duration of additions to the chamber such as water, seed aerosols, NO2, O3, and isoprene.
The introduction of seed aerosol prior to the start of the oxidation leads to an increase not only in the sulfate mass concentration but also in the organic mass concentration. This increase is likely due to the repartitioning of organics from the Teflon foil of the chamber and condensing onto the seed aerosols. The amount of the organic background mass concentration was determined for each experiment prior to the start of the oxidation and considered to be constant and only affected by dilution and wall losses. The AMS organic mass concentration was corrected by subtracting the determined background concentration.
For these experiments, the SOA yields were calculated based on eq 1, using the background-corrected AMS mass concentrations, either the organic nitrate SOA (ΔSOA = ΔOrgNO3part) or a combined organic and organic nitrate SOA (ΔSOA = ΔOA + ΔOrgNO3part,max) for the numerator, in both cases using the calculated isoprene consumed by NO3 as the denominator (Δisoprene = isoprene consumed by NO3).
| 1 |
Total nitrate contribution in HR-ToF-AMS measurements is derived primarily by the signal of the NO2+ and NO+ ion. However, it is possible to distinguish the fractional contribution of organic nitrate to the total observed signal of nitrate. The organic nitrate fraction is determined using the ratio of the NO2+/NO+ ions,33 which is different for pure inorganic ammonium nitrate (typically between 0.3 to 0.5, e.g., Xu et al.34) than for pure organic nitrates (typically between 0.08 and 0.2). As the AMS instrument is calibrated with NH4NO3 particles, the ratio for the instrument for inorganic nitrate is known. The ratio for HR-ToF-AMS used in this study for inorganic nitrate is 0.41. Conservatively, the ratio to determine the fraction of organic nitrate is often chosen to be in the range of 0.1 (e.g., Kiendler-Scharr et al.35). However, recent studies36 have shown that the organic nitrate ratio for isoprene nitrates can be much higher and can reach up to about 0.4, closer to the inorganic ratio. The exact values for the ratios of NO2+/NO+ ions to distinguish between organic and inorganic nitrates vary between instruments and tuning of the instrument. While the ratio for inorganic nitrates is determined regularly during calibration of the AMS instrument, we additionally determined the organic nitrate ratio for isoprene and limonene nitrate SOA in the laboratory. While the results for the isoprene organic nitrates showed high ratios as seen in recent studies, the results were not sufficiently stable to unambiguously use the determined ratio. However, the limonene nitrate NO2+/NO+ ion ratios could be determined to be 0.19. Although we did not do an extensive laboratory characterization of different organic nitrates from different BVOCs, the determined ratio for organic nitrate would also be comparable with the “ratio of ratios” approach.37 Using the stable ratio for inorganic nitrate of 0.41 and the determined ratio for organic nitrate from lab experiments of 0.19, the ratio χ can be determined to be
| 2 |
which is comparable to previously shown ratios.37 Therefore, in the present study, we assume, for the isoprene organic nitrate ratio, at least a value of 0.19. We note that the ratio is likely higher for isoprene organic nitrates, so this reflects a lower limit. To explore the full range of possible organic nitrate formation in the SAPHIR chamber experiments, the range of organic nitrates was calculated by assuming ion ratios of 0.15 (a conservative lower estimate), 0.19, and 0.25, providing the range of the possible SOA yields for all experiments. The ratio of NO2+/NO+ = 0.25 as an upper limit was chosen based on the assumption that all measured nitrate with AMS is explained by organic nitrate, that is, the total nitrate concentration measured equals the derived organic nitrate concentration. For all experiments except one, the ratio of 0.25 explains the upper limit of mass yields of organic nitrates, not accounting for possible heterogeneous reactions and formation and partitioning of HNO3 into the aerosols. To determine total SOA mass yields, that is, yields for organic and organic nitrate partitioning to the aerosols, the organic nitrate yields determined for the ratio of 0.25 was used and added to the organic mass concentration to calculate an upper limit of total SOA mass yield for each experiment.
2.5. Gas-Particle Partitioning Coefficient Determination
For each seeded experiment, we can calculate an aggregate gas-particle partitioning coefficient for the total ANs. For this calculation, we again use the TD–CRDS measurements of total ANs, in combination with the measurements of aerosol-phase organic nitrate from the aerosol mass spectrometer described above and SMPS measurements of total aerosol volume, which is converted to mass loading. The AMS organic nitrate aerosol time series are reported in micrograms per cubic meter (μg m–3); in order to make compatible with total AN concentrations in ppbv, these AMS measurements were converted to mixing ratios (ppbv) using the molecular weight of the nitrate fragment (62 g/mol). A measure of the total aerosol in the chamber throughout the experiments was obtained using a scanning mobility particle spectrometer (SMPS, TSI Classifier 3080 and TSI CPC 3787 low flow), which measured in the size range 0 to 431 nm-diameter particles. SMPS data were reported in cubic nanometers per cubic centimeters (nm3 cm–3) and were converted to micrograms per cubic meter by assuming a density of 1.76 g cm–3, the measured density of ammonium sulfate,38 which is the dominant component of the aerosol (>90%) for all experiments. The aggregate absorptive partitioning coefficient for each experiment was then calculated as
| 3 |
This Kp equation is adapted from gas-particle partitioning coefficient equations.39 A period of stability toward the end of each experiment was selected for the Kp determination (see Figure 5 for an example). The average TD–CRDS gas-phase AN signal during this period was used as the cgas, the AMS OrgNO3 was used as the caero, and the SMPS mass loading (μg m–3) was used as the Mt. We use the wall-loss-corrected data for cgas and caero but use measured SMPS data without wall loss correction for Mt; this assumes that the semi-volatile AN species remain available for repartitioning from the walls but that aggregate gas/aerosol partitioning of these nitrates depends on the aerosol mass suspended in the chamber, not including seed aerosol that has deposited onto the chamber walls. Both wall-loss-corrected and uncorrected SMPS traces are shown in Figure 5 to enable evaluation of the potential effect of this assumption.
Figure 5.
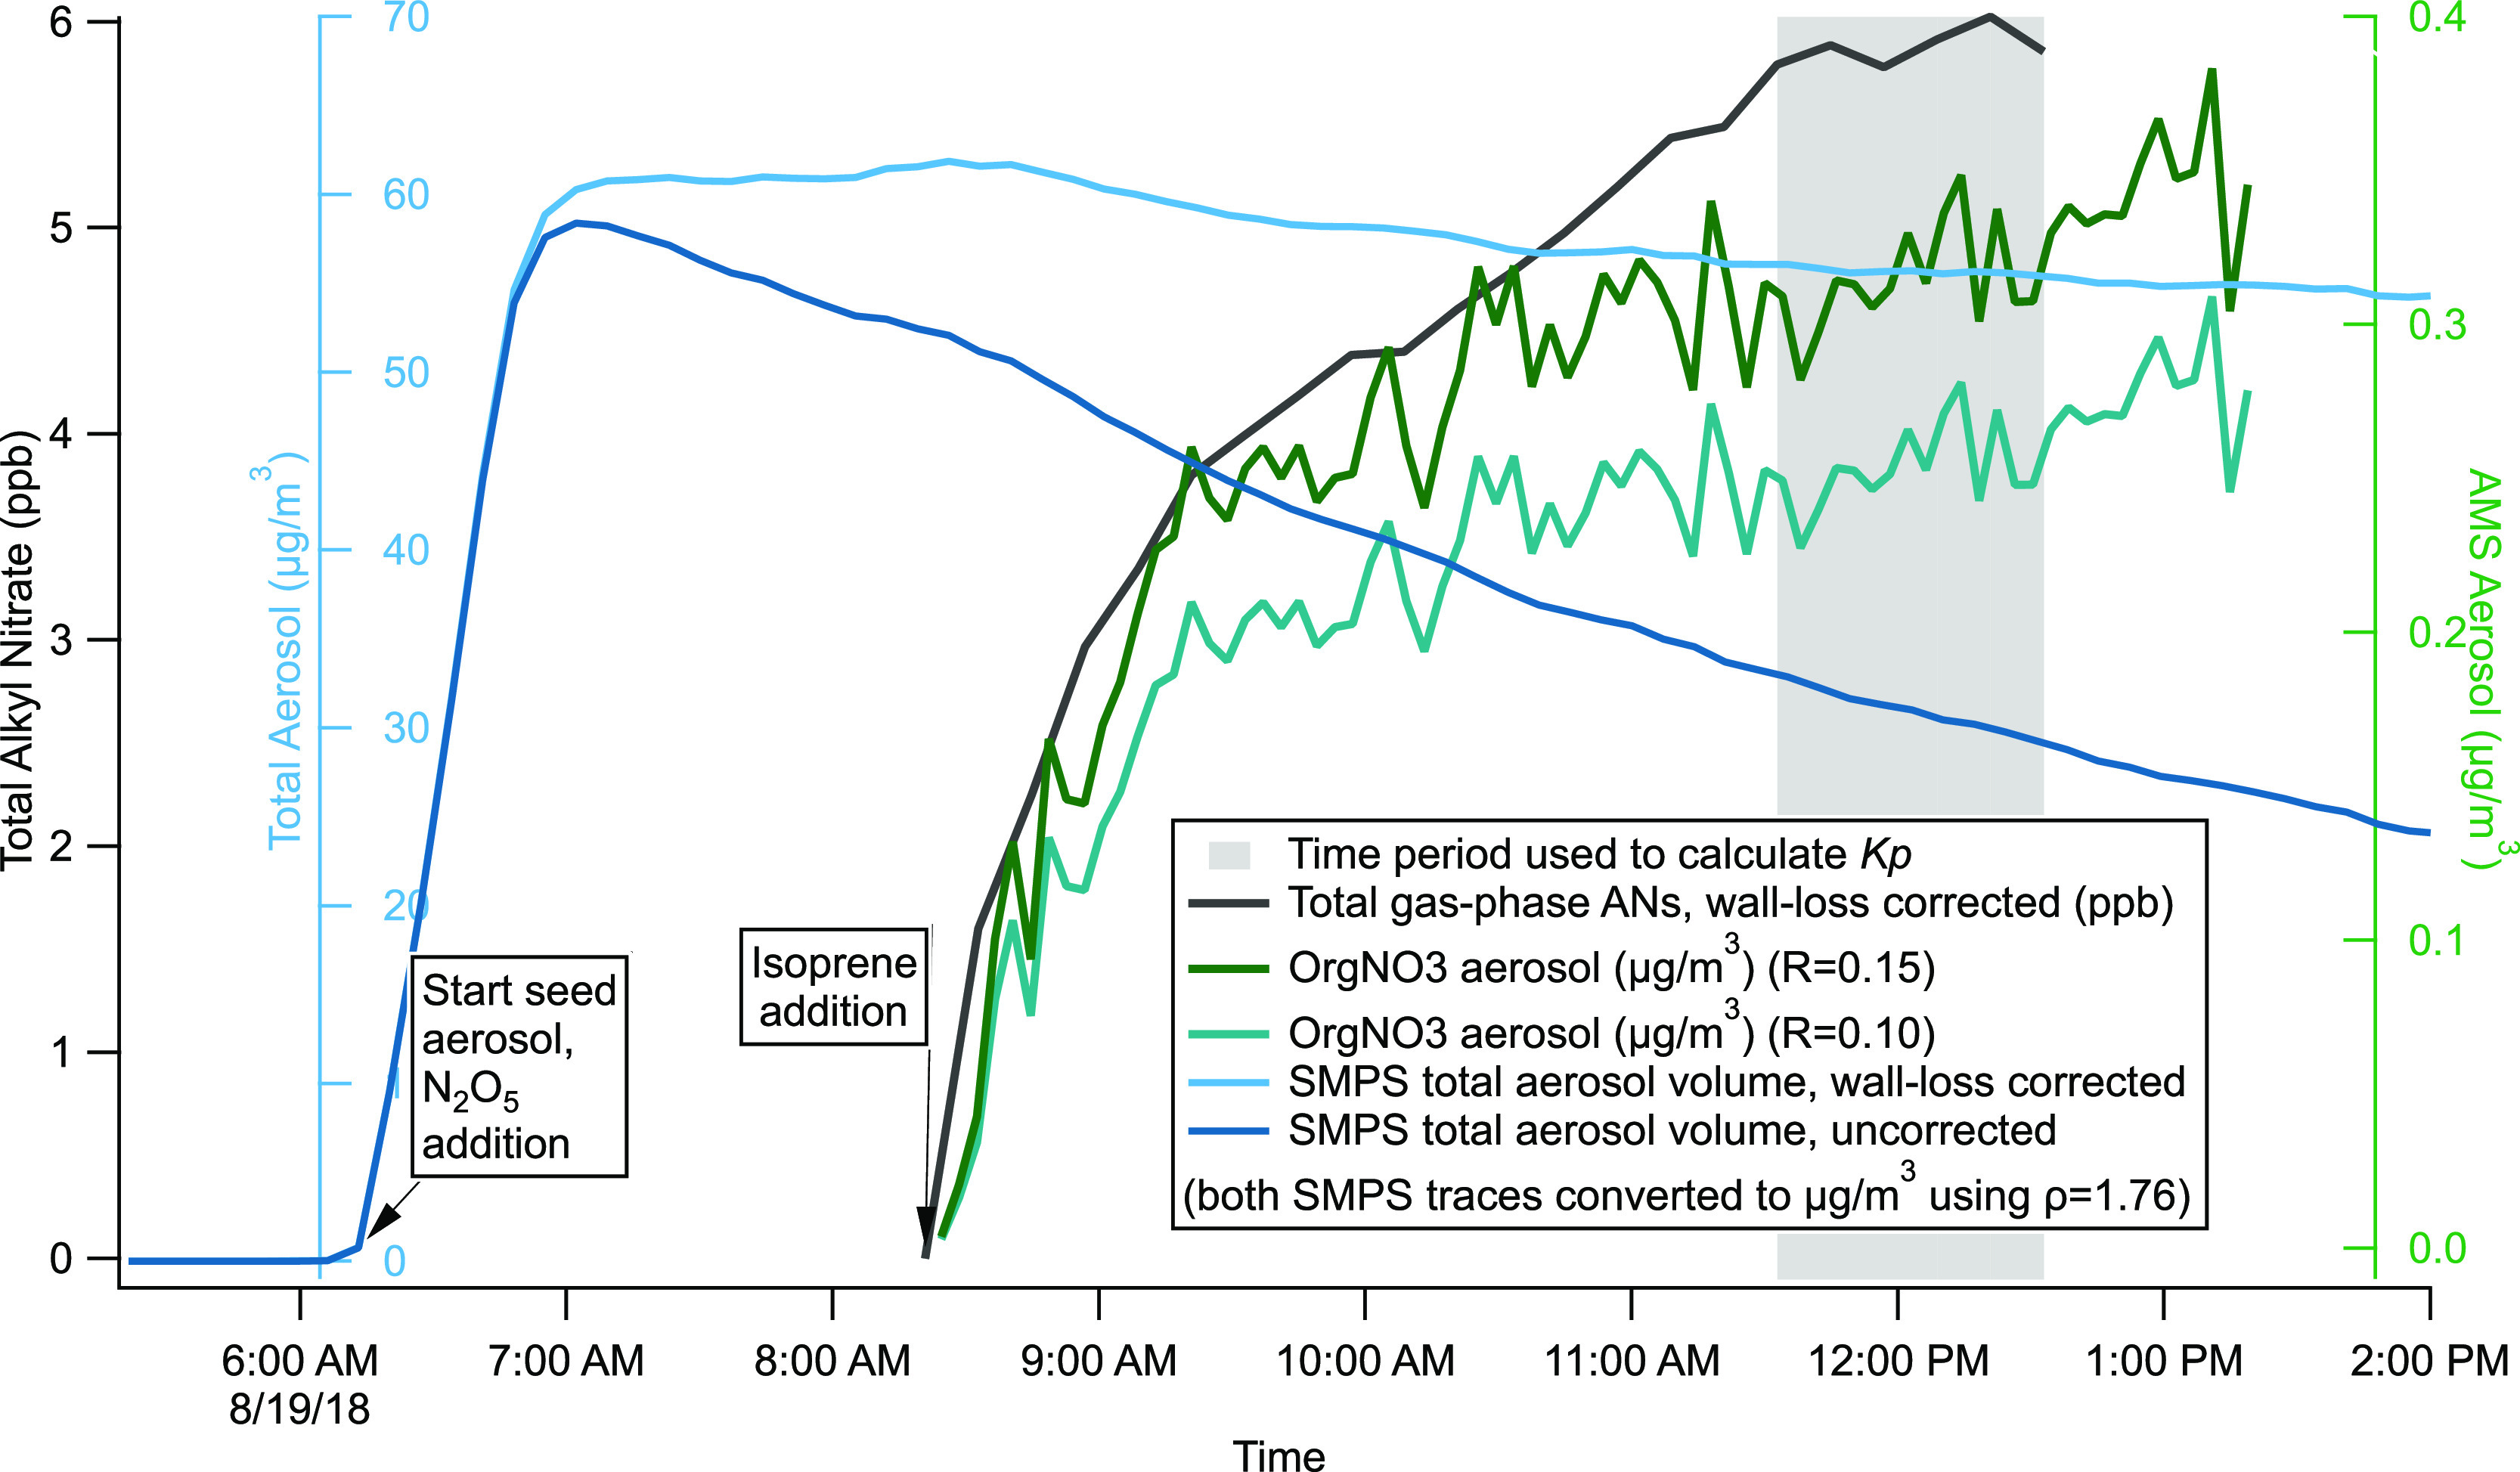
Data from 19 August 2018 experiment demonstrate how data was analyzed to calculate partitioning coefficients (Kp). This graph shows the AMS data for two different NO2+:NO+ ratio assumptions. These two nitrate measurements were used to calculate the upper and lower limits for the Kp values (see Table 3).
We note that because the SMPS size range (0–431 nm diameter) is smaller than the AMS size range (PM1), all SMPS-based Mt measurements may be slightly low. The (small) magnitude of this effect can be seen in Figure 5, where the dilution and wall-loss corrected SMPS trace nevertheless decreases slightly (<10%) over the latter 5 h of the experiment. We do not attempt to correct for this, since as mentioned above, we assume that only the still-suspended measured aerosol mass should be included in Mt. Based on the observed decrease in the corrected SMPS trace, we expect that this would be a less than 10% effect.
3. Results and Discussion
These experiments sought to explore product yields and gas-particle partitioning in NO3 + isoprene reaction under different chemical regimes. Experiments were run with differing initial concentrations of isoprene, NO2, and O3 in an effort to explore regimes favoring different dominant RO2 loss pathways from the initially produced isoprene nitrato-peroxy radicals. Recent computational modeling46 based on this same chamber campaign has explored the fates of initially produced RO2 in more detail. Using the latest structure–activity relationships for rate constants, this study found that the dominant nitrato-peroxy radical actually has a very slow reaction rate with other RO2, so while some experiments did have larger RO2 + RO2 branching, this reaction was never dominant (see Table S3 for % RO2 reaction via unimolecular loss, HO2, NO3, and RO2, for four representative experiments). We therefore designate RO2 regimes for the various experiments as “RO2 + HO2,” “RO2 enhanced,” and “isomerization enhanced,” the latter two of which, as shown in Table S3, actually feature a mix of RO2 reaction paths. A major finding of this paper is that AN yields, SOA yields, and gas/aerosol partitioning of ANs all seem to be largely independent of the initial conditions explored (Table S1).
3.1. AN Yields and Comparison of Bulk to Speciated Nitrate Time Series
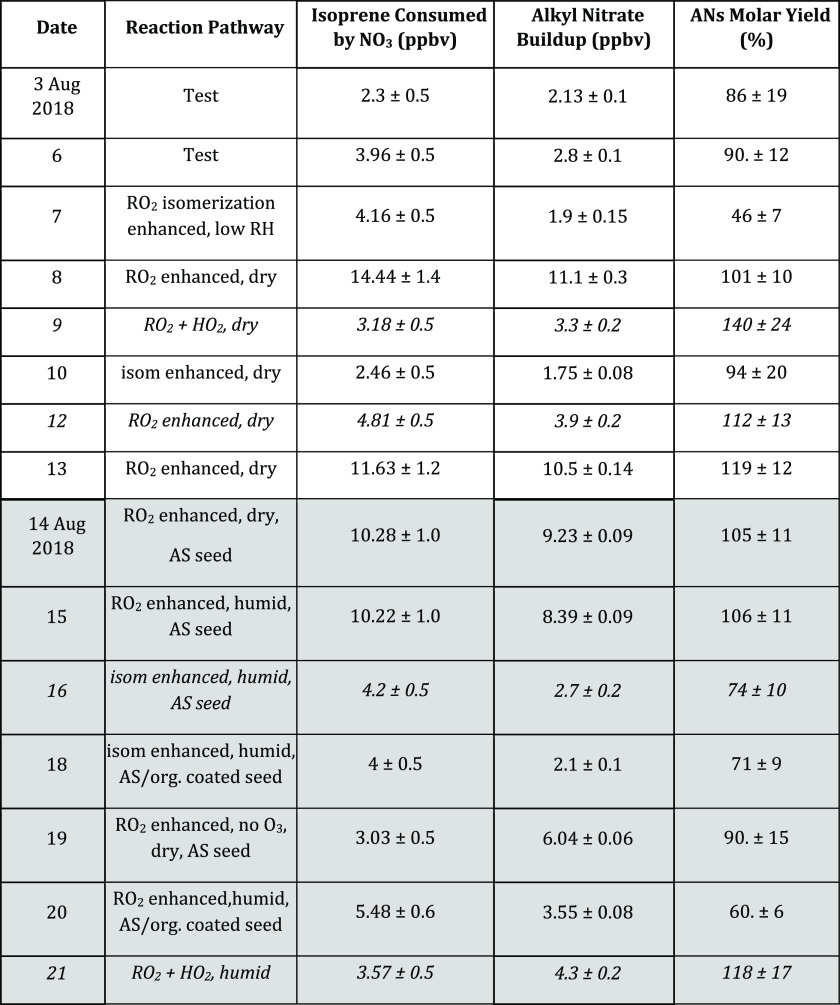
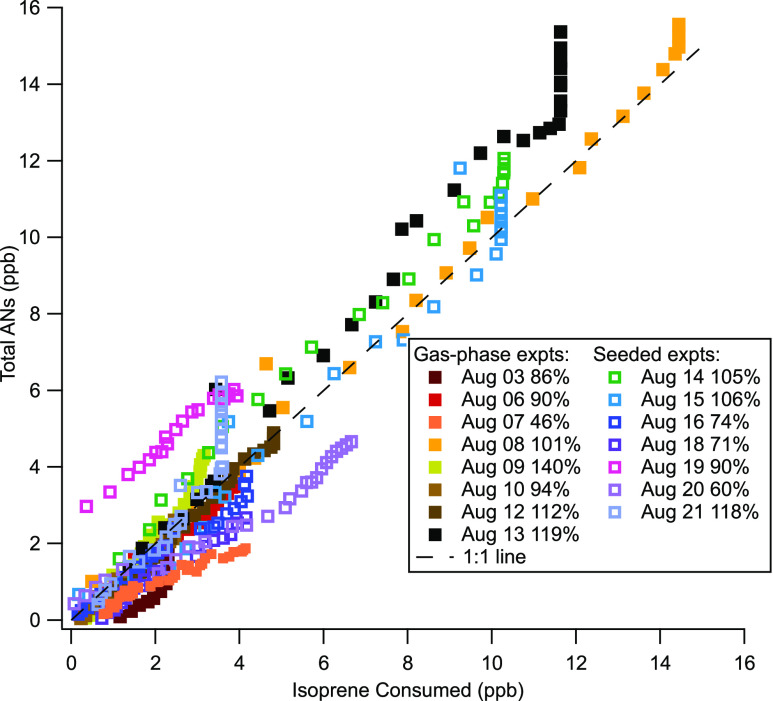
AN yields for all 15 experiments are listed in Table 1. Figure 6 shows the total wall-loss-corrected AN measurements for each experiment, plotted against the corresponding isoprene consumed (calculated as described above). As these data are both in ppb, the slope of these lines give the molar yield of ANs from the NO3 + isoprene reaction. The aggregate campaign data plotted here show that while there is some scatter among the individual experiments, the data taken all together suggest nominally 100% molar yield of ANs from the NO3 + isoprene reaction (see the 1:1 line on the plot). There are no clear differences in these yield curves across seeded/unseeded experiments or across RH (Figure S3). Across RO2 regimes (Figure S4), small differences do emerge. Within the RO2 + RO2 regime experiments, substantial scatter is observed, but the two RO2 + HO2 regime experiments appear to have higher yields, possibly due to contribution from NO3 + propene ANs, and the isomerization experiments appear to have lower yields, potentially due to some loss of NO2 from isomerization products.
Table 1. AN Yields by Experiment Datea.
White background rows are gas-phase experiments, and gray background rows are seeded. These AN yields were calculated as the slope of wall-loss-corrected total ANs vs calculated isoprene consumed by NO3. See the text for discussion of the uncertainties on each variable. The four entries that are italicized indicate dates on which the TD–CRDS instrument NO2 measurement showed poor correlation with the unified NO2 data set produced by the MPI CRD instrument (see discussion around Figure 2).
Figure 6.
Wall-loss-corrected total ANs versus the isoprene consumed by NO3. The dashed line is the 1:1 line. In aggregates, this shows that AN molar yields are similar across gas-phase and seeded experiments and are all close to 100% yield. A global fit of these data from all experiments has a slope corresponding to a molar yield of (108 ± 2)%, when the vertical portions are removed (these presumably represent dinitrate formation). Adding in the uncertainty of the ANs measurements and isoprene consumed, we determine a molar yield of (108 ± 15)%. An uncertainty-weighted average of the individual yields gives a molar yield of (90 ± 40)%. See the Supporting Information for versions of this plot split by RH and RO2 regimes.
A global fit to all data is shown in Figure 6, with the vertical portions of presumably later generation dinitrate formation removed (see the text below). The linear fit equation is y = (1.08 ± 0.02)x + (−0.34 ± 0.09). Because these global fit slope uncertainties are smaller than our inferred 10% uncertainty in the AN concentration measurement and on the isoprene measurement (see Section 2.2), we apply as our relative error 14% (based on both the numerator and denominator having a 10% relative uncertainty) and conclude that the molar AN yield based on this global fit is 108 ± 15%. An alternative way to determine the overall AN yield is to average the yields determined from individual experiments, propagating their uncertainties. This approach, omitting the four italicized flagged as uncertain yield data points, gives an overall yield range of 90 ± 40% and, including all yield data points, gives 90 ± 50%.
This molar AN yield is larger than previous observations of 65–80%9,40−45 but is consistent with aggregated chemical mechanisms of isoprene + NO3 oxidation, for example, the master chemical mechanism (http://mcm.leeds.ac.uk/MCM/browse.htt?species=C5H8), in which none of the major NO3 + isoprene products lose the initially added NO3 group. A recent review13 found that while most of the stable products from RO2 + RO2 or RO2 + HO2 contain a nitrate group, some RO2 isomers preferentially form MVK + NO2, which would reduce AN yields. Recent modeling and quantum chemical results46 indicate that the published MVK formation is biased high. These experimental results also support the conclusion that in fact, very few of the originally formed nitrato-peroxy radicals decompose, losing the NO2 moiety.
An AN yield of nominally 100% suggests that organonitrate hydrolysis is not rapid on the timescale of these experiments. Previous studies have found the hydrolysis lifetime of organic nitrates from NO3 oxidation of monoterpenes to be on the order of hours under ambient conditions,47 with the slower rate for NO3 versus OH products arising because the NO3-initiated oxidation reactions are likely to produce mostly primary and secondary organonitrate groups, while the tertiary nitrates are the fastest to hydrolyze.48,49 A recent chamber study of NO3 oxidation products of α- and β-pinene finds much more rapid hydrolysis (<30 min), albeit with only a small fraction of the organonitrate products hydrolyzable (9–17%).50 To our knowledge, the hydrolysis rates of the nitrates formed from NO3 + isoprene have not been measured, although Vasquez et al.51 observed rapid hydrolysis of the tertiary nitrates formed by OH-initiated oxidation in the presence of NO.
For several experiments (08 August, 13 August, 14 August, 15 August, and 21 August), vertical portions of the plot are visible in Figure 6, suggesting that ANs continue to be produced after the isoprene was fully consumed. This is likely due to oxidation of the second double bond in isoprene, resulting in dinitrate formation. The oxidation of the two double bonds appears to proceed at significantly different enough rates that instead of observing an upward curvature in the yield curves, we see mostly linear correlations until the isoprene precursor is depleted, and only then does the second double bond begin to oxidize. However, we do observe some upward curvature later in the experiments which may be the reason for the >100% yield. We interpret this as meaning that averaged across all experiments, essentially all of the NO3-reacted isoprene produces an AN product, and on the timescale of these experiments, some of those first-generation products will be further oxidized to dinitrates. We note that these experiments were not uniformly run for a consistent period of time after the isoprene was consumed, so we caution the interpretation of the presence or absence of this vertical portion of the yield curves as definitive.
Figure 7 shows two CIMS data sets compared to the total AN measurements from the 10 August 2018 dry, unseeded, and RO2 isomerization regime experiment to investigate this interpretation. Although this is not a date for which the largest effect was observed in the AN yield curve, this is evidence of the ubiquity of some contribution of second-generation chemistry. Both I– CIMS (upper) and Br– CIMS (lower) summed signals show general agreement with the total AN time-series shape. Also, in both CIMS analyses, we observe an increase in dinitrates at later times and after additional NO3 additions.
Figure 7.
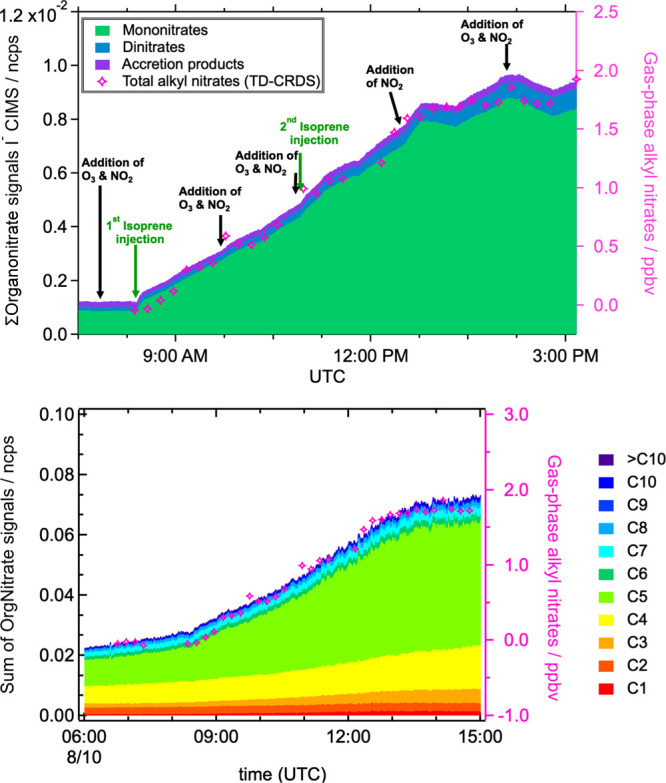
Upper panel: time series of classes of summed organonitrates measured by I– CIMS (normalized counts per second), compared to total AN time series. Lower panel: time series of organic nitrate signals of various carbon numbers measured by Br– CIMS (normalized counts per second), compared to total AN time series. All data are uncorrected for wall losses. These comparisons show some later formation of dinitrates that may be responsible for the larger than 100% AN yield.
We note that the variable magnitude of the vertical (secondary) portion of the yield curves could arise not only from chemical variability but also from differing lengths of experiment; we observe it in some but not all RO2-enhanced and HO2-enhanced experiments (see Figure S4). We also note that the amplitude of the vertical sections of the yield curves in Figure 6 is highly dependent on the wall loss correction factor used, since these losses compound and are the largest at the end of the experiments, and in many cases, the experimental conditions were changed (e.g., roof opened to initiate photo-oxidation) or terminated shortly after isoprene was consumed, omitting most secondary nitrate formation. Thus, we cannot quantify the AN yield of this second double-bond oxidation.
All yields are reported in Table 1, alongside reaction regime, isoprene consumed, and final AN buildup levels, to show differences between experiments. More details about each experiment can be found in Supporting Information, Table S1. Yields are determined as the slope of a linear fit to ANs versus isoprene consumed (see Figure 3). The uncertainty on each experiment’s yield based on the slope error is typically below 5% because the fits are quite linear with little scatter. Thus, we make a more conservative estimate of the individual AN yield uncertainty, by propagating the uncertainties on the final AN buildup and final isoprene consumed at the end of each experiment (see Table 1) and applying this relative error to the AN yield from the individual experiment slopes. Uncertainties reported on AN buildup are based on the standard deviation of the AN measurements at the end of each experiment. Uncertainties in isoprene consumed are harder to determine, in large part because the OH concentration in most experiments was below the detection limit, leaving this variable contribution to isoprene loss rates unknown. The resulting estimated uncertainties in isoprene consumed are 10% relative uncertainty or 0.5 ppbv, whichever is larger. This is a maximum error which allows for OH concentrations at the limit of detection of the laser-induced fluorescence instrument. These relative errors are propagated in quadrature to obtain an estimate of each individual experiments’ yield uncertainty. In the global fit to all yield data (Figure 6), we conclude that the slope error encompasses the scatter observed across experiments and thus represents a good estimate of the aggregate uncertainty.
Figure S5 shows several plots of AN yields as a function of various experimental parameters, to investigate whether any dependencies exist that explain the observed variability in individual experiment yields. We see generally more variability in the lower concentration experiments, lower isoprene consumed, lower final AN buildups, and more variability in higher-RH experiments, but no clear trends. This observation underpins our decision to collectively fit all yield data together to obtain the best estimate of AN yield and accompanying uncertainty.
3.2. SOA Yields
All SOA yields calculated for the seeded experiments are reported in Table 2 (SOA was only measurable for the seeded experiments). SOA yields for organic nitrates (ratio of ΔSOA = ΔOrgNO3part to isoprene consumed by NO3 radicals) were calculated (Eq 1) using different ratios for NO2+/NO+ of 0.1, 0.19, and the maximum ratio (ranging from 0.15 to 0.27) for each experiment which explains all measured nitrate as organic nitrate (OrgNO3 = max) and are shown in columns 6 to 8 in Table 2. These are shown to illustrate the variability due to the choice of the NO2+/NO+ ratio; the boldface, gray background column 5 includes all organic + OrgNO3 aerosol mass (ratio of ΔSOA = ΔOA + ΔOrgNO3part,max to isoprene consumed by NO3 radicals) and is our recommended estimate for the SOA mass yield, representing isoprene nitrate partitioning to the aerosol phase (which consisted of typically ∼50 μg m–3 ammonium sulfate seed aerosol and ∼2–5 μg m–3 SOA). The total SOA mass yields range from 4.0 to 15.2% with most total SOA mass yields ranging between 13 to 15% (at a total SOA mass of ∼2–5 μg m–3; the low mass yields of 4% correspond to total SOA mass <1 μg m–3). Our results can be compared to and put into perspective with previous studies determining SOA yields from nitrate radical reactions with isoprene.8,9
Table 2. SOA Yields for All Seeded Experimentsa.
| date | reaction pathway | VOC reacted (ppb) | total SOA mass (μg m–3) | SOA yield (OA + OrgNO3max) % | SOA yield (%) OrgNO3 with different R (NO2+:NO+): |
||
|---|---|---|---|---|---|---|---|
| R = 0.1 | 0.19 | OrgNO3 = max (0.15 to 0.27) | |||||
| 14 August 2018 | RO2 enhanced, dry,AS seed | 12.1 | 5.4 | 15.2 ± 3.4 | 3.9 ± 0.9 | 5.8 ± 1.3b | 5.8 ± 1.3 |
| 15 August 2018 | RO2 enhanced, humid, AS seed | 12.5 | 5.0 | 13.3 ± 2.3 | 3.4 ± 0.3 | 5.2 ± 1.1 | 6.4 ± 1.5 |
| 16 August 2018 | isom enhanced, humid, AS seed | 5.8 | 2.2 | 12.9 ± 2.2 | 2.4 ± 0.5 | 3.5 ± 0.7 | 5.8 ± 1.1 |
| 19 August 2018 | RO2 enhanced no O3, dry, AS seed | 4.3 | 0.5 | 4.0 ± 0.8 | 2.5 ± 0.5 | 3.2 ± 0.6 | 3.2 ± 0.6 |
| 21 August 2018 | RO2 + HO2, humid, AS seed | 3.5 | 0.36c | 3.5 ± 0.6c | 1.7 ± 0.3 | 2.5 ± 0.4 | 3.5 ± 0.6 |
In the OA + OrgNO3 column, yields reported were determined as the ratio of the sum of OA and maximum OrgNO3 to either (measured/modeled) Δisoprene. In the OrgNO3 columns, the ΔSOA is determined based on the OrgNO3 signal alone, with varying ratios as described in the text. The uncertainty is determined by assuming a 20% variation in the accuracy of the AMS mass concentration and a 10% error for the concentration of the consumed isoprene.
This yield uses R = 0.15, which is the maximum in this case.
Change in OA mass was not discernible, so these are based on maximum OrgNO3 mass only.
In Ng et al.,8 total SOA mass yields range between 4.3 and 23.8%, for VOC reacted from 18.4 to 101.6 ppb, and total SOA mass concentrations of 100–180 μg m–3 (significantly higher than this study). Ng et al. performed the experiments under dry conditions and varied the amount of the oxidation with regard to what is called “typical,” “slow isoprene injection,” and “slow N2O5 injection” in SOA yield experiments. The “slow N2O5 injection” reaction condition is targeted to enhance the RO2 + RO2 reaction, which should lead to a significantly higher production of condensable isoprene products. Our experiments in this study do not reproduce the same high yields for the RO2-enhanced chemical regimes, perhaps because we never achieved sufficiently high RO2 concentrations to truly favor RO2 + RO2 reactions (see Supporting Information, Table S3). The major differences between the experiments is the large difference in isoprene precursor concentrations (18 to 203 ppbv in Ng et al.; 5 to 20 ppbv in this work) and the resulting differences in organic aerosol mass (5 to 70 μg m–3 in Ng et al.; 0.5 to 5 μg m–3 in this work).
The chamber SOA yields from Rollins et al.9 are most comparable to our study since the experimental conditions are similar and performed in the same chamber. Rollins et al. determined an SOA mass yield of 2% where first-generation chemistry should be the dominant contributor and 14% ± 6% including secondary generation oxidation reactions. Therefore since, in this work, only the maximum SOA yield was calculated, it should be compared to the results including secondary chemistry, and the results agree within error margins (13 to 15% here vs 14% ± 6% in Rollins, et al.). The exceptions are the 19 August and 21 August experiments, both of which had substantially lower total organic aerosol mass (<0.5 μg m–3) and lower SOA yields of ∼4%.
This work additionally extends the complexity and the chemical regimes tested with regard to SOA mass yield compared to both previous studies. As can be seen from Tables 2 and S1, with the exception of lower yields for the experiments with lower total organic aerosol loading, no clear trend or variability can be observed for the SOA mass yield. Yields seem to be mostly independent of the initial reaction pathways. This indicates that although different products of the isoprene oxidation are very likely formed due to the different initial conditions, there does not seem to be an effect on the overall amount of condensable material with regard to the amount of consumed precursor. This is similar to the observation for AN yields, where also no significant trend with regard to the different regimes could be observed.
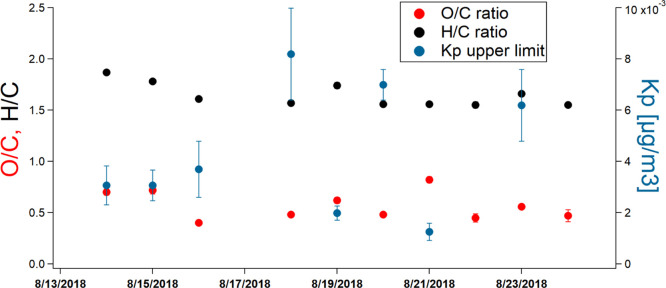
Furthermore, no relationship is found between AN yields and SOA mass yields (Figure S6). Using the high-resolution information of AMS, the O:C ratio of the aerosol was determined for the same time period and the yields were calculated (Figure 8). Similar to what was observed for the SOA mass yields, the bulk chemical composition with regard to O:C ratios is not showing any observable trend with regard to different chemical regimes. Either the product distribution of the condensable species is very similar and does not affect the overall composition with regard to carbon and oxygen content or this method is not sensitive enough to detect potentially minor differences due to a different product spectrum in the aerosol.
Figure 8.
There are no major differences across seeded experiments in terms of bulk aerosol composition, as assessed by elemental ratios. Being plotted against the observed partitioning coefficients (Kp) demonstrates that SOA composition does not explain any of this variability.
We note that while broadly agreeing with previous chamber experiments, these chamber-measured SOA yields from NO3 + isoprene are lower than the yields inferred from two recent field studies. In Fry et al.,10 the NO3 + isoprene SOA mass yield was estimated to be (27 ± 14)%, based on power plant plume intercepts during night flights in the 2013 SENEX campaign. In Zaveri et al.,52 NO3 + isoprene SOA mass yields are estimated to range from 0 to 55%, based on morning flights in the residual layer during the 2010 CARES campaign. These field-based estimates of NO3 + isoprene SOA mass yield are of course subject to various assumptions about the fraction of OA that is due to this chemistry, model-based estimates of isoprene consumed, and so forth; however, the fact that these field yields were substantially higher suggests that chamber experiments might have not yet explored the chemical regime responsible for ambient SOA production from NO3 + isoprene.
3.3. Gas-Particle Partitioning of ANs
To obtain a range of possible bulk Kp values to describe the gas-aerosol partitioning of total ANs, two different aerosol organic nitrate data sets from AMS were used, in conjunction with total ANs measured by TD–CRDS and total aerosol mass determined via SMPS. The two AMS data sets were different fractions of the full measurement defined by different ratios of how much product was in the particle phase: the upper limit and the “best estimate” of Kp values was determined using the OrgNO3 signal using R = 0.19 to partition the organic nitrate and the lower limit estimate of Kp was calculated using the OrgNO3 determined with R = 0.10, both using the method described above in Section 2.5. The resulting experimental Kp values are reported in Table 3.
Table 3. Experimentally Determined Kp Values ( ) for Seeded Experiments.
| date | Regime | Kp (m3 μg–1) “lower limit estimate” of OrgNO3 assuming R = 0.10 | Kp (m3 μg–1) OrgNO3 “best estimate” assuming R = 0.19 or 0.15 |
|---|---|---|---|
| 14 August 2018 | RO2 enhanced | 1.6 ± 0.4 × 10⁻³ | 2.4 ± 0.6 × 10⁻³ |
| 15 August 2018 | RO2 enhanced | 1.6 ± 0.3 × 10⁻³ | 2.4 ± 0.5 × 10⁻³ |
| 16 August 2018 | isom enhanced | 2.0 ± 0.6 × 10⁻³ | 3.0 ± 0.9 × 10⁻³ |
| 18 August 2018 | isom enhanced | 4.3 ± 1.0 × 10⁻³ | 6.5 ± 1.5 × 10⁻³ |
| 19 August 2018a | RO2 enhanced | 1.3 ± 0.2 × 10⁻³ | 1.6 ± 0.2 × 10⁻³ |
| 20 August 2018a | RO2 enhanced | 4.5 ± 0.4 × 10⁻³ | 5.6 ± 0.5 × 10⁻³ |
| 21 August 2018 | RO2 + HO2 | 6.8 ± 1.8 × 10⁻⁴ | 1.0 ± 0.3 × 10⁻³ |
Noted experiments (19th and 20 August) were calculated using R = 0.15 as the maximum OrgNO3 to determine caero instead of R = 0.19. All others used R = 0.19.
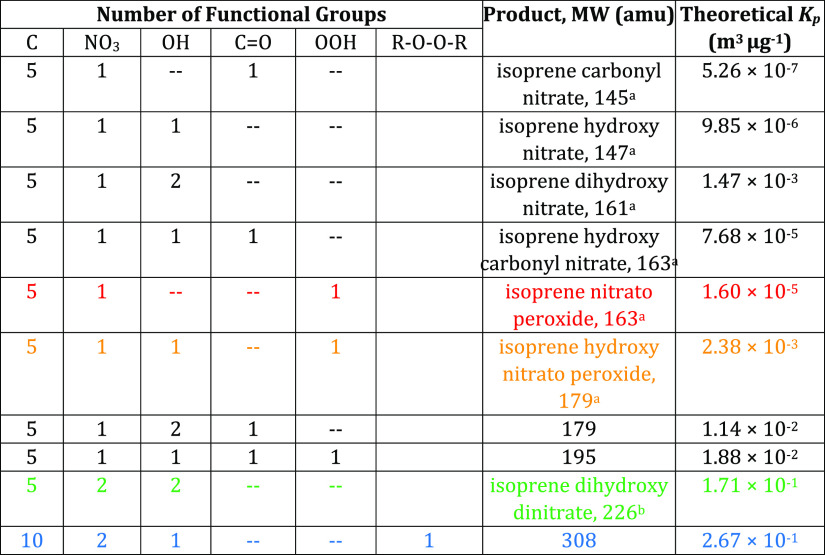
In order to interpret the empirically observed bulk Kp’s, theoretical Kp values were calculated using predicted vapor pressure pL0 from a simplified group contribution method (SIMPOL.1, Pankow and Asher53). The SIMPOL group contribution predicts the vapor pressure based on the number and type of the functional group on a molecule, and vapor pressures were then converted to Kp using eq 4, as described in Pankow.39 A few possible likely structures and the corresponding calculated Kp values can be found in Table 4 below.
| 4 |
Table 4. Theoretical Kp Valuesa.
The highlighted red product is a monomer, the green is a dinitrate, and the blue is a dimer. The experimentally determined average volatility corresponds most closely to a trifunctional monomer (orange). Product names listed are from referenced papers.
Structures mechanistically predicted by Schwantes et al. (2015).
Structures mechanistically predicted by Rollins et al. (2009).
In the Pankow equation, Kp is the partitioning coefficient, fom is the weight fraction that is the organic material phase and is assumed to be 1, T is the temperature, 295 K, MWom is the molecular weight, in g/mol, of the organic compound, ζ is the activity coefficient and also assumed to be 1, and pL0 is the vapor pressure in atm, which was predicted using the group contribution method. The smaller theoretical Kp values indicate higher volatility and less product in the aerosol phase. Another forthcoming NO3Isop paper (Wu et al.54) investigates the volatility of individual organonitrate compounds, finding a broad range of volatilities that span the range observed here but also include a small fraction (<2%) of much lower volatility, highly oxidized dimers.
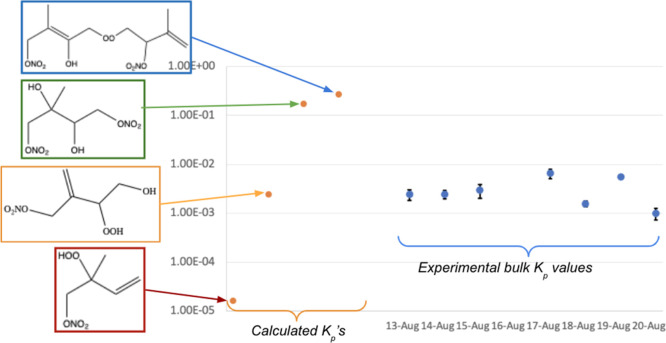
The average aggregate experimental Kp value (∼10–3 m3 μg–1) is closest to the value of the theoretical Kp of a trifunctional monomer structure, suggesting that most of the AN products are C5 species. Figure 9 visualizes the experimental aggregate partitioning coefficient values, compared to the group contribution-calculated theoretical Kp values from different structures. We note that while this “average” AN product represents the majority of the products formed from the NO3 + isoprene reaction, it is likely that less abundant, but substantially lower-volatility, products contribute disproportionately to the species partitioning to the particle phase. Because of how we calculate this aggregate partitioning coefficient, it represents all of the AN products, the majority of which do not contribute to SOA.
Figure 9.
Group contribution calculated partitioning coefficients (left, color-coded to Table 4) for four potential representative isoprene + NO3 product structures, compared to the experimentally measured bulk Kp values from the currently reported set of seeded experiments. The empirical Kp values were calculated using OrgNO3 for an NO2+:NO+ ratio of 0.19.
The I– CIMS measurements of individual nitrates (example spectra are shown from 8 August and 10 August experiments in Figure 10) indicate that mononitrates are the dominant products, with dinitrates and dimers also observed. Compared to theoretical partitioning coefficients (Table 4) for the major observed mononitrate (C5H9NO5: 1.60 × 10⁻⁵ m3 μg–1), dinitrate (C5H6N2O8: 1.71 × 10⁻¹ m3 μg–1), and dimer (C10H16N2O9: 2.67 × 10⁻¹ m3 μg–1), we see that the empirically observed bulk Kp’s (Table 3, Figure 9) falling in the 10–3 m3 μg–1 range suggest a substantially more volatile mix of organonitrates than the CIMS data, possibly indicating differential sensitivities to the classes of nitrates, or partitioning that is not driven by absorptive partitioning.
Figure 10.
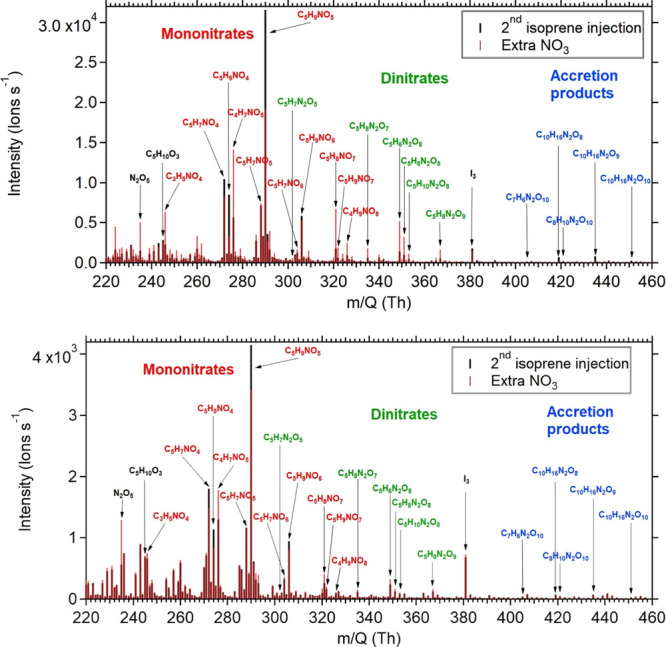
Representative I-CIMS data from 8 August (upper) and 10 August (lower) experiments. Gas-phase fragments detected include many nitrates.
Another report of volatility of SOA from NO3 and isoprene is used in Pye et al.47 based on Rollins et al.9 The reported partitioning coefficient for the dinitrates assumed to be responsible for SOA formation in that study is Kp = 0.112 m3 μg–1 (the inverse of the reported saturation concentration of C* = 8.9 μg m–3). This partitioning coefficient, because it represents a dinitrate, is significantly larger than the bulk partitioning coefficients calculated for these experiments. If this larger partitioning coefficient is assumed for the aggregate isoprene nitrate products, it would suggest that more products would partition into the particle phase than observed in these experiments.
4. Conclusions
A series of experiments at the SAPHIR chamber examined the oxidation of isoprene by NO3. AN molar yield from NO3 + isoprene is found to be (108 ± 15) %, SOA mass yields for the OA + OrgNO3 mass are found to be 13 to 15%, and aggregated AN partitioning coefficients are consistent with average volatility corresponding to a trifunctional C5 nitrate. The experiments described here were conducted under approximately ambient conditions of precursor concentrations and seed aerosol and provide a significant additional body of evidence for the substantial SOA yields from the NO3 + isoprene reaction.
Overall, we conclude that AN yield is nominally 100% and that the organic nitrate partitioning coefficient, bulk aerosol composition, and SOA yields are largely independent of the chemical regime. Two exceptions are an observed slightly higher AN yield (120 to 140%, 2 experiments) in the HO2 regime, potentially due to interfering propene nitrate, and slightly lower yield in the RO2 isomerization regime (46 to 94%, 4 experiments), potentially due to some loss of the NO2 group.
SOA mass yields are observed to be 13 to 15%, which is in general agreement with other chamber experiments conducted in similar regimes to those used in this study. Despite a significant variation in initial night-time oxidation conditions, the tested regimes cannot explain or identify unique conditions which could be responsible for the significantly higher SOA mass yields inferred for NO3 + isoprene in aircraft measurements.10,52
Acknowledgments
This project has received funding from the European Research Council (ERC) under the European Union’s Horizon 2020 research and innovation programme (SARLEP grant agreement no. 681529) and from the European Commission (EC) under the European Union’s Horizon 2020 research and innovation programme (Eurochamp 2020 grant agreement no. 730997). The authors thank the Forschungszentrum Jülich for travel support under the project “Seed Money”. BB acknowledges the Reed College Opportunity Grant program for travel funding; JLF acknowledges the Fulbright U.S. Scholar Program (Netherlands) for enabling the origination and planning of this campaign. The CIMS analysis was supported by the Swedish Research Council (grant numbers 2014-05332 and 2018-04430) and Formas (grant number 942-2015-1537). We acknowledge valuable discussion with John Crowley, Patrick Dewald, Justin Shenolikdar, and Niels Friedrich.
Supporting Information Available
The Supporting Information is available free of charge at https://pubs.acs.org/doi/10.1021/acsearthspacechem.0c00311.
Experimental parameters; key instruments used for the alkyl nitrate and aerosol analysis; breakdown of the reactive fate of the initially formed nitrate peroxy radicals; scatterplot NO2 comparisons; thermogram on a chamber mix of isoprene + NO3 products; total alkyl nitrate yield plots; AN yields plotted against several experimental variables; and SOA mass yield measurements (PDF)
The authors declare no competing financial interest.
Supplementary Material
References
- Guenther A. B.; Jiang X.; Heald C. L.; Sakulyanontvittaya T.; Duhl T.; Emmons L. K.; Wang X. The Model of Emissions of Gases and Aerosols from Nature Version 2.1 (MEGAN2.1): An Extended and Updated Framework for Modeling Biogenic Emissions. Geosci. Model Dev. 2012, 5, 1471–1492. 10.5194/gmd-5-1471-2012. [DOI] [Google Scholar]
- Monson R. K.; Jones R. T.; Rosenstiel T. N.; Schnitzler J.-P. Why Only Some Plants Emit Isoprene. Plant, Cell Environ. 2013, 36, 503–516. 10.1111/pce.12015. [DOI] [PubMed] [Google Scholar]
- Starn T. K.; Shepson P. B.; Bertman S. B.; Riemer D. D.; Zika R. G.; Olszyna K. Nighttime Isoprene Chemistry at an Urban-Impacted Forest Site. J. Geophys. Res.: Atmos. 1998, 103, 22437–22447. 10.1029/98JD01201. [DOI] [Google Scholar]
- Beaver M. R.; Clair J. M. S.; Paulot F.; Spencer K. M.; Crounse J. D.; LaFranchi B. W.; Min K. E.; Pusede S. E.; Wooldridge P. J.; Schade G. W.; Park C.; Cohen R. C.; Wennberg P. O. Importance of Biogenic Precursors to the Budget of Organic Nitrates: Observations of Multifunctional Organic Nitrates by CIMS and TD-LIF during BEARPEX 2009. Atmos. Chem. Phys. 2012, 12, 5773–5785. 10.5194/acp-12-5773-2012. [DOI] [Google Scholar]
- Sander S. P.; Friedl R. R.; Ravishankara A. R.. Chemical Kinetics and Photochemical Data for Use in Atmospheric Studies Evaluation Number 14; JPL Publication, 2011. [Google Scholar]
- Calvert J. G.; Atkinson R.; Becker K. H.; Kamens R. M.; Seinfeld J. H.; Wallington T. H.; Yarwood G.. The Mechanisms of Atmospheric Oxidation of the Aromatic Hydrocarbons; Oxford University Press, 2002. [Google Scholar]
- Brown S. S.; Osthoff H. D.; Stark H.; Dubé W. P.; Ryerson T. B.; Warneke C.; de Gouw J. A.; Parrish D. D.; Fehsenfeld F. C.; Ravishankara A. R. Aircraft Observations of Daytime NO3 and N2O5 and Their Implications for Tropospheric Chemistry. J. Photochem. Photobiol., A 2005, 176, 270–278. 10.1016/j.jphotochem.2005.10.004. [DOI] [Google Scholar]
- Ng N. L.; Kwan A. J.; Surratt J. D.; Chan A. W. H.; Chhabra P. S.; Sorooshian A.; Pye H. O. T.; Crounse J. D.; Wennberg P. O.; Flagan R. C.; Seinfeld J. H. Secondary Organic Aerosol (SOA) Formation from Reaction of Isoprene with Nitrate Radicals (NO3). Atmos. Chem. Phys. 2008, 8, 4117–4140. 10.5194/acpd-8-3163-2008. [DOI] [Google Scholar]
- Rollins A. W.; Kiendler-Scharr A.; Fry J. L.; Brauers T.; Brown S. S.; Mensah A.; Mentel T. F.; Rohrer F.; Tillmann R.; Wegener R.; Wooldridge P. J.; Cohen R. C. Isoprene Oxidation by Nitrate Radical: Alkyl Nitrate and Secondary Organic Aerosol Yields. Atmos. Chem. Phys. 2009, 9, 6685–6703. [Google Scholar]
- Fry J. L.; Brown S. S.; Middlebrook A. M.; Edwards P. M.; Campuzano-Jost P.; Day D. A.; Jimenez J. L.; Allen H. M.; Ryerson T. B.; Pollack I.; Graus M.; Warneke C.; de Gouw J. A.; Gilman J.; Lerner B. M.; Dubé W. P.; Liao J.; Welti A.; Welti A. Secondary Organic Aerosol (SOA) Yields from NO3 Radical + Isoprene Based on Nighttime Aircraft Power Plant Plume Transects. Atmos. Chem. Phys. 2018, 18, 11663–11682. 10.5194/acp-18-11663-2018. [DOI] [Google Scholar]
- Hoyle C. R.; Berntsen T.; Myhre G.; Isaksen I. S. A. Secondary Organic Aerosol in the Global Aerosol - Chemical Transport Model Oslo CTM2. Atmos. Chem. Phys. 2007, 7, 5675–5694. 10.5194/acp-7-5675-2007. [DOI] [Google Scholar]
- Schwantes R. H.; Teng A. P.; Nguyen T. B.; Coggon M. M.; Crounse J. D.; St Clair J. M.; Schilling K. A.; Seinfeld J. H.; Wennberg P. O. Isoprene NO3 Oxidation Products from the RO2 + HO2 Pathway. J. Phys. Chem. A 2015, 119, 10158–10171. 10.1021/acs.jpca.5b06355. [DOI] [PubMed] [Google Scholar]
- Wennberg P. O.; Bates K. H.; Crounse J. D.; Dodson L. G.; McVay R. C.; Mertens L. A.; Nguyen T. B.; Praske E.; Schwantes R. H.; Smarte M. D.; St Clair J. M.; Teng A. P.; Zhang X.; Seinfeld J. H. Gas-Phase Reactions of Isoprene and Its Major Oxidation Products. Chem. Rev. 2018, 118, 3337–3390. 10.1021/acs.chemrev.7b00439. [DOI] [PubMed] [Google Scholar]
- Carlton A. G.; Wiedinmyer C.; Kroll J. H. A Review of Secondary Organic Aerosol (SOA) Formation from Isoprene. Atmos. Chem. Phys. 2009, 9, 4987–5005. 10.5194/acp-9-4987-2009. [DOI] [Google Scholar]
- Chung S. H.; Seinfeld J. H. Global Distribution and Climate Forcing of Carbonaceous Aerosols. J. Geophys. Res. 2002, 107, 4407. 10.1029/2001JD001397. [DOI] [Google Scholar]
- Myhre G.; Shindell D.; Bréon F.-M.; Collins W.; Fuglestvedt J.; Huang J.; Koch D.; Lamarque J.-F.; Lee D.; Mendoza B.; Nakajima T.; Robock A.; Stephens G.; Zhang H.; Aamaas B.; Boucher O.; Dalsøren S. B.; Daniel J. S.; Forster P.; Granier C.; Haigh J.; Hodnebrog Ø.; Kaplan J. O.; Marston G.; Nielsen C. J.; O’Neill B. C.; Peters G. P.; Pongratz J.; Ramaswamy V.; Roth R.; Rotstayn L.; Smith S. J.; Stevenson D.; Vernier J.-P.; Wild O.; Young P.; Jacob D.; Ravishankara A. R.; Shine K.. Anthropogenic and Natural Radiative Forcing. Climate Change 2013: The Physical Science Basis. Contribution of Working Group I to the Fifth Assessment Report of the Intergovernmental Panel on Climate Change; Cambridge University Press, 2013; pp 659–740. [Google Scholar]
- Pope C. A.; Dockery D. W. Health effects of fine particulate air pollution: lines that connect. J. Air Waste Manag. Assoc. 2006, 56, 709–742. 10.1080/10473289.2006.10464485. [DOI] [PubMed] [Google Scholar]
- Lelieveld J.; Evans J. S.; Fnais M.; Giannadaki D.; Pozzer A. The Contribution of Outdoor Air Pollution Sources to Premature Mortality on a Global Scale. Nature 2015, 525, 367–371. 10.1038/nature15371. [DOI] [PubMed] [Google Scholar]
- Hallquist M.; Wenger J. C.; Baltensperger U.; Rudich Y.; Simpson D.; Claeys M.; Dommen J.; Donahue N. M.; George C.; Goldstein A. H.; Hamilton J. F.; Herrmann H.; Hoffmann T.; Iinuma Y.; Jang M.; Jenkin M. E.; Jimenez J. L.; Kiendler-Scharr A.; Maenhaut W.; McFiggans G.; Mentel T. F.; Monod A.; Prevot A. S. H.; Seinfeld J. H.; Surratt J. D.; Szmigielski R.; Wildt J. The Formation, Properties and Impact of Secondary Organic Aerosol: Current and Emerging Issues. Atmos. Chem. Phys. 2009, 9, 5155–5236. [Google Scholar]
- Marais E. A.; Jacob D. J.; Jimenez J. L.; Campuzano-Jost P.; Day D. A.; Hu W.; Krechmer J.; Zhu L.; Kim P. S.; Miller C. C.; Fisher J. A.; Travis K.; Yu K.; Hanisco T. F.; Wolfe G. M.; Arkinson H. L.; Pye H. O. T.; Froyd K. D.; Liao J.; McNeill V. F. Aqueous-Phase Mechanism for Secondary Organic Aerosol Formation from Isoprene: Application to the Southeast United States and Co-Benefit of SO2 Emission Controls. Atmos. Chem. Phys. 2016, 16, 1603–1618. 10.5194/acp-16-1603-2016. [DOI] [PMC free article] [PubMed] [Google Scholar]
- Kroll J. H.; Ng N. L.; Murphy S. M.; Flagan R. C.; Seinfeld J. H. Secondary Organic Aerosol Formation from Isoprene Photooxidation. Environ. Sci. Technol. 2006, 40, 1869–1877. 10.1021/es0524301. [DOI] [PubMed] [Google Scholar]
- Liu J.; D’Ambro E. L.; Lee B. H.; Lopez-Hilfiker F. D.; Zaveri R. A.; Rivera-Rios J. C.; Keutsch F. N.; Iyer S.; Kurten T.; Zhang Z.; Gold A.; Surratt J. D.; Shilling J. E.; Thornton J. A. Efficient Isoprene Secondary Organic Aerosol Formation from a Non-IEPOX Pathway. Environ. Sci. Technol. 2016, 50, 9872–9880. 10.1021/acs.est.6b01872. [DOI] [PubMed] [Google Scholar]
- Surratt J. D.; Lewandowski M.; Offenberg J. H.; Jaoui M.; Kleindienst T. E.; Edney E. O.; Seinfeld J. H. Effect of Acidity on Secondary Organic Aerosol Formation from Isoprene. Environ. Sci. Technol. 2007, 41, 5363–5369. 10.1021/es0704176. [DOI] [PubMed] [Google Scholar]
- Fuchs H.; Simpson W. R.; Apodaca R. L.; Brauers T.; Cohen R. C.; Crowley J. N.; Dorn H.-P.; Dubé W. P.; Fry J. L.; Häseler R.; Kajii Y.; Kiendler-Scharr A.; Labazan I.; Matsumoto J.; Mentel T. F.; Nakashima Y.; Rohrer F.; Rollins A. W.; Schuster G.; Tillmann R.; Wahner A.; Wooldridge P. J.; Brown S. S. Comparison of N2O5 Mixing Ratios during NO3Comp 2007 in SAPHIR. Atmos. Meas. Tech. 2012, 5, 2763–2777. 10.5194/amt-5-2763-2012. [DOI] [Google Scholar]
- Fuchs H.; Novelli A.; Rolletter M.; Hofzumahaus A.; Pfannerstill E. Y.; Kessel S.; Edtbauer A.; Williams J.; Michoud V.; Dusanter S.; Locoge N.; Zannoni N.; Gros V.; Truong F.; Sarda-Esteve R.; Cryer D. R.; Brumby C. A.; Whalley L. K.; Stone D.; Seakins P. W.; Heard D. E.; Schoemaecker C.; Blocquet M.; Coudert S.; Batut S.; Fittschen C.; Thames A. B.; Brune W. H.; Ernest C.; Harder H.; Muller J. B. A.; Elste T.; Kubistin D.; Andres S.; Bohn B.; Hohaus T.; Holland F.; Li X.; Rohrer F.; Kiendler-Scharr A.; Tillmann R.; Wegener R.; Yu Z.; Zou Q.; Wahner A. Comparison of OH Reactivity Measurements in the Atmospheric Simulation Chamber SAPHIR. Atmos. Meas. Tech. 2017, 10, 4023–4053. 10.5194/amt-10-4023-2017. [DOI] [Google Scholar]
- Dewald P.; Liebmann J. M.; Friedrich N.; Shenolikar J.; Schuladen J.; Rohrer F.; Reimer D.; Tillmann R.; Novelli A.; Cho C.; Xu K.; Holzinger R.; Bernard F.; Zhou L.; Mellouki W.; Brown S. S.; Fuchs H.; Lelieveld J.; Crowley J. N. Evolution of NO3 Reactivity during the Oxidation of Isoprene. Atmos. Chem. Phys. 2020, 1–29, 10459–10475. 10.5194/acp-2020-360. [DOI] [Google Scholar]
- Keehan N. I.; Brownwood B.; Marsavin A.; Day D. A.; Fry J. L. Thermal Dissociation Cavity Ring-down Spectrometer (TD-CRDS) for Detection of Organic Nitrates in Gas and Particle Phase. Atmos. Meas. Tech. 2020, 13, 6255–6269. 10.5194/amt-13-6255-2020. [DOI] [Google Scholar]
- Sobanski N.; Schuladen J.; Schuster G.; Lelieveld J.; Crowley J. N. A Five-Channel Cavity Ring-down Spectrometer for the Detection of NO2, NO3, N2O55, Total Peroxy Nitrates and Total Alkyl Nitrates. Atmos. Meas. Tech. 2016, 9, 5103–5118. 10.5194/amt-9-5103-2016. [DOI] [Google Scholar]
- IUPAC . Task Group on Atmospheric Chemical Kinetic Data Evaluation. http://iupac.pole-ether.fr/ (accessed April 22, 2020).
- Canagaratna M. R.; Jayne J. T.; Jimenez J. L.; Allan J. D.; Alfarra M. R.; Zhang Q.; Onasch T. B.; Drewnick F.; Coe H.; Middlebrook A.; Delia A.; Williams L. R.; Trimborn A. M.; Northway M. J.; DeCarlo P. F.; Kolb C. E.; Davidovits P.; Worsnop D. R. Chemical and Microphysical Characterization of Ambient Aerosols with the Aerodyne Aerosol Mass Spectrometer. Mass Spectrom. Rev. 2007, 26, 185–222. 10.1002/mas.20115. [DOI] [PubMed] [Google Scholar]
- DeCarlo P. F.; Kimmel J. R.; Trimborn A.; Northway M. J.; Jayne J. T.; Aiken A. C.; Gonin M.; Fuhrer K.; Horvath T.; Docherty K. S.; Worsnop D. R.; Jimenez J. L. Field-Deployable, High-Resolution, Time-of-Flight Aerosol Mass Spectrometer. Anal. Chem. 2006, 78, 8281–8289. 10.1021/ac061249n. [DOI] [PubMed] [Google Scholar]
- Jimenez J. L.; Jayne J. T.; Shi Q.; Kolb C. E.; Worsnop D. R.; Yourshaw I.; Seinfeld J. H.; Flagan R. C.; Zhang X.; Smith K. A.; Morris J. W.; Davidovits P.. Ambient Aerosol Sampling Using the Aerodyne Aerosol Mass Spectrometer. J. Geophys. Res.: Atmos. 2003, 108 (). 10.1029/2001JD001213. [DOI] [Google Scholar]
- Farmer D. K.; Matsunaga A.; Docherty K. S.; Surratt J. D.; Seinfeld J. H.; Ziemann P. J.; Jimenez J. L. Response of an Aerosol Mass Spectrometer to Organonitrates and Organosulfates and Implications for Atmospheric Chemistry. Proc. Natl. Acad. Sci. U.S.A. 2010, 107, 6670–6675. 10.1073/pnas.0912340107. [DOI] [PMC free article] [PubMed] [Google Scholar]
- Xu L.; Suresh S.; Guo H.; Weber R. J.; Ng N. L. Aerosol Characterization over the Southeastern United States Using High Resolution Aerosol Mass Spectrometry: Spatial and Seasonal Variation of Aerosol Composition, Sources, and Organic Nitrates. Atmos. Chem. Phys. 2015, 15, 10479–10552. 10.5194/acpd-15-10479-2015. [DOI] [Google Scholar]
- Kiendler-Scharr A.; Mensah A. A.; Friese E.; Topping D.; Nemitz E.; Prevot A. S. H.; Äijälä M.; Allan J.; Canonaco F.; Canagaratna M.; Carbone S.; Crippa M.; Dall Osto M.; Day D. A.; De Carlo P.; Di Marco C. F.; Elbern H.; Eriksson A.; Freney E.; Hao L.; Herrmann H.; Hildebrandt L.; Hillamo R.; Jimenez J. L.; Laaksonen A.; McFiggans G.; Mohr C.; O’Dowd C.; Otjes R.; Ovadnevaite J.; Pandis S. N.; Poulain L.; Schlag P.; Sellegri K.; Swietlicki E.; Tiitta P.; Vermeulen A.; Wahner A.; Worsnop D.; Wu H.-C. Ubiquity of Organic Nitrates from Nighttime Chemistry in the European Submicron Aerosol: Organic Nitrates in European PM1. Geophys. Res. Lett. 2016, 43, 7735–7744. 10.1002/2016GL069239. [DOI] [Google Scholar]
- He Q.; Tomaz S.; Li C.; Zhu D.; Meidan D.; Riva M.; Laskin A.; Brown S. S.; George C.; Wang X.; Rudich Y. Optical Properties of Secondary Organic Aerosol Produced by Nitrate Radical Oxidation of Biogenic Volatile Organic Compounds. Environ. Sci. Technol. 2021, 55 (5), 2878–2889. 10.1021/acs.est.0c06838. [DOI] [PMC free article] [PubMed] [Google Scholar]
- Fry J. L.; Draper D. C.; Zarzana K. J.; Campuzano-Jost P.; Day D. A.; Jimenez J. L.; Brown S. S.; Cohen R. C.; Kaser L.; Hansel A.; Cappellin L.; Karl T.; Hodzic Roux A.; Turnipseed A.; Cantrell C.; Lefer B. L.; Grossberg N. Observations of Gas- and Aerosol-Phase Organic Nitrates at BEACHON-RoMBAS 2011. Atmos. Chem. Phys. 2013, 13, 8585–8605. 10.5194/acp-13-8585-2013. [DOI] [Google Scholar]
- Sarangi B.; Aggarwal S. G.; Sinha D.; Gupta P. K. Aerosol effective density measurement using scanning mobility particle sizer and quartz crystal microbalance with the estimation of involved uncertainty. Atmos. Meas. Tech. 2016, 9, 859–875. 10.5194/amt-9-859-2016. [DOI] [Google Scholar]
- Pankow J. F. An Absorption Model of the Gas/Aerosol Partitioning Involved in the Formation of Secondary Organic Aerosol. Atmos. Environ. 1994, 28, 189–193. 10.1016/1352-2310(94)90094-9. [DOI] [Google Scholar]
- Barnes I.; Bastian V.; Becker K. H.; Tong Z. Kinetics and Products of the Reactions of Nitrate Radical with Monoalkenes, Dialkenes, and Monoterpenes. J. Phys. Chem. 1990, 94, 2413–2419. 10.1021/j100369a041. [DOI] [Google Scholar]
- Skov H.; Hjorth J.; Lohse C.; Jensen N. R.; Restelli G. Products and Mechanisms of the Reactions of the Nitrate Radical (NO3) with Isoprene, 1,3-Butadiene and 2,3-Dimethyl-1,3-Butadiene in Air. Atmos. Environ., Part A 1992, 26, 2771–2783. 10.1016/0960-1686(92)90015-D. [DOI] [Google Scholar]
- Skov H.; Benter T.; Schindler R. N.; Hjorth J.; Restelli G. Epoxide Formation in the Reactions of the Nitrate Radical with 2,3-Dimethyl-2-Butene, Cis- and Trans-2-Butene and Isoprene. Atmos. Environ. 1994, 28, 1583–1592. 10.1016/1352-2310(94)90304-2. [DOI] [Google Scholar]
- Kwok E. S. C.; Aschmann S. M.; Arey J.; Atkinson R. Product Formation from the Reaction of the NO3 Radical with Isoprene and Rate Constants for the Reactions of Methacrolein and Methyl Vinyl Ketone with the NO3 Radical. Int. J. Chem. Kinet. 1996, 28, 925–934. . [DOI] [Google Scholar]
- Perring A. E.; Wisthaler A.; Graus M.; Wooldridge P. J.; Lockwood A. L.; Mielke L. H.; Shepson P. B.; Hansel A.; Cohen R. C. A Product Study of the Isoprene + NO3 Reaction. Atmos. Chem. Phys. 2009, 9, 4945–4956. 10.5194/acp-9-4945-2009. [DOI] [Google Scholar]
- Kwan A. J.; Chan A. W. H.; Ng N. L.; Kjaergaard H. G.; Seinfeld J. H.; Wennberg P. O. Peroxy Radical Chemistry and OH Radical Production during the NO3 -Initiated Oxidation of Isoprene. Atmos. Chem. Phys. 2012, 12, 7499–7515. 10.5194/acp-12-7499-2012. [DOI] [Google Scholar]
- Vereecken L.; Carlsson P.; Bernard F.; Brown S. S.; Cho C.; Friedrich N.; Fuchs H.; Liebmann J. M.; Mellouki W.; Novelli A.; Reimer D.; Tillmann R.; Zhou L.; Kiendler-Scharr A.; Wahner A. Theoretical and Experimental Study of Peroxy and Alkoxy Radicals in the NO3-Initiated Oxidation of Isoprene. Phys. Chem. Chem. Phys. 2021, 10.1039/d0cp06267g. [DOI] [PubMed] [Google Scholar]; , accepted
- Pye H. O. T.; Luecken D. J.; Xu L.; Boyd C. M.; Ng N. L.; Baker K. R.; Ayres B. R.; Bash J. O.; Baumann K.; Carter W. P. L.; Edgerton E.; Fry J. L.; Hutzell W. T.; Schwede D. B.; Shepson P. B. Modeling the Current and Future Roles of Particulate Organic Nitrates in the Southeastern United States. Environ. Sci. Technol. 2015, 49, 14195–14203. 10.1021/acs.est.5b03738. [DOI] [PubMed] [Google Scholar]
- Darer A. I.; Cole-Filipiak N. C.; O’Connor A. E.; Elrod M. J. Formation and Stability of Atmospherically Relevant Isoprene-Derived Organosulfates and Organonitrates. Environ. Sci. Technol. 2011, 45, 1895–1902. 10.1021/es103797z. [DOI] [PubMed] [Google Scholar]
- Hu K. S.; Darer A. I.; Elrod M. J. Thermodynamics and Kinetics of the Hydrolysis of Atmospherically Relevant Organonitrates and Organosulfates. Atmos. Chem. Phys. 2011, 11, 8307–8320. 10.5194/acp-11-8307-2011. [DOI] [Google Scholar]
- Takeuchi M.; Ng N. L. Chemical Composition and Hydrolysis of Organic Nitrate Aerosol Formed from Hydroxyl and Nitrate Radical Oxidation of α -Pinene and β -Pinene. Atmos. Chem. Phys. 2019, 19, 12749–12766. 10.5194/acp-19-12749-2019. [DOI] [Google Scholar]
- Vasquez K. T.; Crounse J. D.; Schulze B. C.; Bates K. H.; Teng A. P.; Xu L.; Allen H. M.; Wennberg P. O. Rapid hydrolysis of tertiary isoprene nitrate efficiently removes NOx from the atmosphere. Proc. Natl. Acad. Sci. U.S.A. 2020, 117, 33011–33016. 10.1073/pnas.2017442117. [DOI] [PMC free article] [PubMed] [Google Scholar]
- Zaveri R. A.; Shilling J. E.; Fast J. D.; Springston S. R. Efficient Nighttime Biogenic SOA Formation in a Polluted Residual Layer. J. Geophys. Res.: Atmos. 2020, 125, e2019JD031583 10.1029/2019JD031583. [DOI] [Google Scholar]
- Pankow J. F.; Asher W. E. SIMPOL.1: A Simple Group Contribution Method for Predicting Vapor Pressures and Enthalpies of Vaporization of Multifunctional Organic Compounds. Atmos. Chem. Phys. 2008, 8, 2773–2796. 10.5194/acp-8-2773-2008. [DOI] [Google Scholar]
- Wu R.; Vereecken L.; Tsiligiannis E.; Kang S.; Albrecht S. R.; Hantschke L.; Zhao D.; Novelli A.; Fuchs H.; Tillmann R.; Hohaus T.; Carlsson P.; Shenolikar J.; Bernard F.; Crowley J. N.; Fry J. L.; Brownwood B.; Thornton J. A.; Brown S. S.; Kiendler-Scharr A.; Wahner A.; Hallquist M.; Mentel T. F.. Molecular Composition and Volatility of Multi-Generation Products Formed from Isoprene Oxidation by Nitrate Radical. Atmos. Chem. Phys. 2020, under review. [Google Scholar]
Associated Data
This section collects any data citations, data availability statements, or supplementary materials included in this article.


