Significance Statement
Clinical studies have suggested that metabolic acidosis (MA) aggravates tubular damage in patients with both AKI and CKD, but the mechanisms were unknown. Intravital live cell imaging and other complementary techniques demonstrated in the mouse kidney that MA induces acute changes in the mitochondrial NAD redox state, respiratory chain function, and lipid metabolism, which collectively lead to tubular cell damage. Intravenous injection of bicarbonate increases blood pH and improves tubular function, whereas pretreatment with an NAD precursor is highly protective. Thus, changes in cell metabolism explain the harmful effects of MA on kidney tubules, which therapeutic strategies that are viable in humans can substantially ameliorate.
Keywords: acidosis, acute renal failure, metabolism, mitochondria, proximal tubule
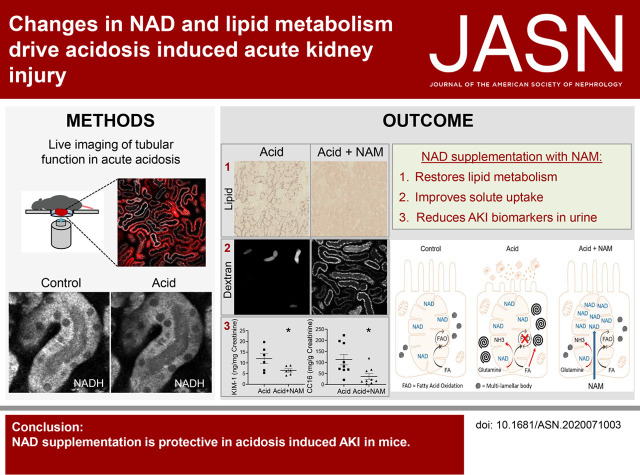
Visual Abstract
Abstract
Background
The kidney plays an important role in maintaining normal blood pH. Metabolic acidosis (MA) upregulates the pathway that mitochondria in the proximal tubule (PT) use to produce ammonia and bicarbonate from glutamine, and is associated with AKI. However, the extent to which MA causes AKI, and thus whether treating MA would be beneficial, is unclear.
Methods
Gavage with ammonium chloride induced acute MA. Multiphoton imaging of mitochondria (NADH/membrane potential) and transport function (dextran/albumin uptake), oxygen consumption rate (OCR) measurements in isolated tubules, histologic analysis, and electron microscopy in fixed tissue, and urinary biomarkers (KIM-1/clara cell 16) assessed tubular cell structure and function in mouse kidney cortex.
Results
MA induces an acute change in NAD redox state (toward oxidation) in PT mitochondria, without changing the mitochondrial energization state. This change is associated with a switch toward complex I activity and decreased maximal OCR, and a major alteration in normal lipid metabolism, resulting in marked lipid accumulation in PTs and the formation of large multilamellar bodies. These changes, in turn, lead to acute tubular damage and a severe defect in solute uptake. Increasing blood pH with intravenous bicarbonate substantially improves tubular function, whereas preinjection with the NAD precursor nicotinamide (NAM) is highly protective.
Conclusions
MA induces AKI via changes in PT NAD and lipid metabolism, which can be reversed or prevented by treatment strategies that are viable in humans. These findings might also help to explain why MA accelerates decline in function in CKD.
Severe metabolic acidosis (MA, pH <7.2) occurs in >5% of patients in intensive care and has a >50% mortality rate.1 MA is often associated with AKI; however, to what extent MA is a cause or consequence of AKI was unclear. Recent clinical studies have suggested that treating MA with bicarbonate in critically ill patients prevents AKI.2 Moreover, it can also slow the progression of CKD.3,4 Thus, MA may induce adverse changes in kidney tubules that initiate or potentiate damage in disease states.
Mitochondria in the proximal tubules (PT) play a key role in the response to MA by generating ammonia and bicarbonate from the breakdown of glutamine (ammoniagenesis). Ammonia is secreted into the tubular lumen to increase urinary excretion of acid. During MA, PT glutamine uptake is increased, and ammoniagenesis is massively upregulated.5 Of note, glutamine breakdown requires a continuous supply of the oxidized form of the metabolic cofactor NAD+, which is thus a potential rate-limiting factor,6 and in classic studies increases in NAD+ to NADH ratio were reported at the whole-tissue level in the rat kidney during MA.7 More recently, NAD depletion has been identified as a key step in the pathogenesis of AKI induced by ischemia and cisplatin.8 NAD is crucial for the renal metabolism of lipids,9 which are the preferred fuel of PTs in vivo,10 and defective fatty acid oxidation and lipid accumulation in PTs are the hallmarks of AKI.9,11–14 However, the acute effects of MA on mitochondrial metabolism in the PT are not well understood, due to a lack of suitable methods and cell models to study this.
We have previously shown that live cell imaging with multiphoton microscopy allows real-time assessment of mitochondrial NAD redox state within tubular cells in intact kidney tissue.15 Here, using this approach and other complementary techniques, we provide evidence that MA induces a shift toward NAD oxidation in PT mitochondria, and that this is associated with a switch to increased respiratory chain (RC) complex I activity, and a major decrease in lipid metabolism. These changes result in an AKI phenotype in PTs, which can be partially reversed with bicarbonate and substantially ameliorated with NAD supplementation. Thus, we show that the relationship between MA and AKI is probably causal, but amenable to treatment strategies that are viable in humans.
Methods
Reagents
Unless stated otherwise, all reagents were purchased from Sigma Aldrich (Buchs, Switzerland).
Dyes
All of the dyes were purchased prelabeled from the manufacturer (albumin from BSA, Alexa Fluor 488 conjugate #A13100, dextran, Alexa Fluor 647; 10,000 MW, Anionic, Fixable #D22914, rhodamine 123 #R302, tetramethylrhodamine, methyl ester, perchlorate [TMRM] #T668; Thermo Fisher).
Animals
Experiments were performed on male C57BL mice who were 6–14 weeks old (supplied by Janvier), in accordance with the regulations of the Zurich cantonal veterinary office (License No. 194/2016).
Acute Acid Challenge
Mice were maintained on standard diets with ad libitum access to food and water. Animals were gavage fed either water or 1.5 M ammonium chloride (NH4Cl, 800 mg/kg).16 After gavage, groups of mice were anesthetized with isoflurane gas anesthesia (1.5%–5%) and oxygen (600 ml/min), venous blood was collected at various time points, and animals were perfused-fixed via the abdominal aorta with 3% paraformaldehyde (PFA) in 0.1 M phosphate buffer. Kidney tissue was collected for freezing in liquid propane, paraffin embedding or electron microscopy (EM) preparation. Intravital imaging of animals was performed between 3 and 5 hours after gavage.
Bicarbonate Treatment
Then 2 hours after acidosis was induced, mice were injected with 8.4% sodium bicarbonate (NaHCO3, 420 mg/kg) into the tail vein. Further, 3 hours after the NaHCO3 treatment, animals were anesthetized and venous blood was collected or intravital imaging was performed.
Nicotinamide Supplementation
Nicotinamide (NAM) was given in saline by intraperitoneal injections of 400 mg/kg,9 24 and 2 hours before the induction of acidosis. Then 2 hours after gavage with water or NH4Cl, kidneys were collected and immersion-fixed with 4% PFA in 0.1 M phosphate buffer overnight, or intravital imaging was performed.
Blood and Bicarbonate Measurements
Immediately after collection, blood was analyzed for pH, blood gases and bicarbonate concentration on a Radiometer ABL80 FLEX (Radiometer; Brønshøj, Denmark).
Urine Biomarkers
Spot urine was collected between 2 and 5 hours after gavage with water or NH4Cl and analyzed for the AKI biomarker KIM-1 and excretion of the low mol wt protein clara cell protein 16 (CC16) using a mouse TIM-1/KIM-1/HAVCR Quantikine ELISA Kit (MKM100; R&D Systems, McKinley Place NE, MN) and a mouse CC16 ELISA Kit (EKU03200; Biomatik, Ontario, Canada), respectively. Obtained values were normalized to creatinine, which was measured either with a UniCel DxC 800 Synchron Clinical System (Beckman Coulter, High Wycombe, UK) or with a Jaffe determination method.
Isolation of Tubules and Oxygen Consumption Measurements
Animals were perfused with 15 ml of Leibovitz medium containing collagenase II at 300 U/ml (Worthington Biochemical Corp., Lakewood, NJ). Kidneys were removed, cortical tissue was minced and transferred to aerated collagenase II–containing medium for 20 minutes incubation at 37°C. After digestion, the tubule suspension was centrifuged for 5 minutes at 1500 rpm to separate a pellet of intact tubules from lighter subcellular debris that remained largely in the supernatant. The tubule pellet was gently resuspended at 4°C in a physiologic slice buffer adjusted to pH 7.4 and gassed with carbogen (95% O2/5% CO2), containing: 118 mM NaCl, 4.7 mM KCl, 1.2 mM KH2PO4, 1.8 mM CaCl2, 1.44 mM MgSO4, 5 mM glucose, 10 mM NaHCO3, 15 mM HEPES, 5 mM sodium pyruvate, 2.5 mM sodium butyrate, and 2.5 mM sodium lactate. The suspension was recentrifuged and the resulting pellet was resuspended in slice buffer at 37°C. Tubules were counted in 50 µl of volume and seeded (25–40 PTs per well) to Seahorse microplates coated with Cell Tak adherent (Corning, NY).
Oxygen consumption rate (OCR) measurements were performed using a Seahorse Bioscience XFp Extracellular Flux Analyzer instrument (Agilent Technologies AG, Basel, Switzerland). For each measurement, cartridges were hydrated overnight according to the manufacturer’s instructions in a non-CO2 incubator. For a standard mitochondrial oxygen consumption measurement, we used sequential injections of vehicle control (slice buffer) or 0.1% HCl, carbonyl cyanide-4-(trifluoromethoxy)phenylhydrazone (final concentration 1 µM), and rotenone/antimycin (final concentration 1 µM). For complex I inhibition, sequential injections of rotenone (final concentration 0.5 µM) and cyanide (final concentration 2 mM) were applied. The cartridge XFp, containing 0.1% HCl and the RC drugs, was loaded into the Seahorse Bioscience XFp Extracellular Flux Analyzer instrument for calibration of the cartridge sensor. After calibration, the utility plate was replaced with the cell culture plate containing the freshly isolated PTs. The measurement cycle consisted of an equilibration step, 2-minute mix, and a 2-minute measurement. OCR was normalized to baseline oxygen consumption of each well.
Total NAD Assay
Total NAD was measured in mouse kidney slices by an NAD Quantitation Colorimetric Kit according to the manufacturer’s recommendations (BioVision, Milpitas, CA). Briefly, 100 µm–thick cortical kidney sections were incubated in slice buffer at pH 7.4 or 6.5 for 20 minutes at 37°C. Tissue was lysed on ice and homogenized with Ultrasonic homogenizator (UW 2070; Bandelin Sonopuls, Berlin, Germany) for 10 seconds. Homogenization was performed in the extraction buffer supplied with the reaction kit. Tissue lysate was immediately loaded on the assay plate and reaction mix was added. Absorbance was recorded at 450 nm after 45 minutes using a 96-well microplate reader (BioTek GmbH, Sursee, Switzerland). NAD measurements reflect total NAD+ plus NADH. NAD(H) content was normalized to protein levels from the same samples.
Histologic and Immunofluorescence Staining
Oil red O (ORO) solution was prepared by dissolving 0.5 g of ORO in 100 ml isopropanol. Frozen kidney tissue from perfused animals was cut into 5 µm–thick sections and stained with ORO on room temperature for 10 minutes, then rinsed in running tap water for 2 minutes. PFA-fixed, paraffin-embedded blocks were sectioned at 4 µm. Paraffin sections were then dewaxed and rehydrated, and hematoxylin and eosin or immunofluorescence staining was performed. For immunofluorescence staining, after permeabilization with 0.1% TritonX-100 (Surfact-Amps detergent solution; Thermo Fisher Scientific) for 5 minutes, tissue sections were blocked with 1% BSA and 10% donkey or goat serum, before incubation overnight at 4°C with the following primary antibodies: rabbit polyclonal anti-PMP70 (1:100, PA1–650; Thermo Fisher) and rat monoclonal anti-LAMP1 (1:100, ab25245; Abcam, Cambridge, UK). After washing with PBS, sections were incubated at room temperature for 2 hours with the following secondary antibodies: donkey anti-rabbit-A488 (1:500, 711–546–152; Jackson ImmunoResearch Europe Ltd., Cambridgeshire, UK) and goat anti-rat-Cy5 antibody (1:500, 112–607–003; Jackson ImmunoResearch Europe Ltd., Cambridgeshire, UK). Tissue was subsequently washed with PBS, and cellular DNA was stained with 5 μg/ml Hoechst 33342 (H1399; Molecular Probes, Eugene, OR) for 10 minutes at room temperature. Slices were mounted with Dako mounting medium (Agilent, Santa Clara, CA). ORO and hematoxylin and eosin staining was visualized on an Axio Scan.Z1 slide scanner using a Plan Apochromat 40×/0.95 air immersion objective, and confocal fluorescence imaging of the samples was performed on a Leica SP5 microscope using an HC PL APO Leica 40×/1.25 oil immersion objective.
Transmission EM
Perfusion-fixed kidneys were stored in 2.5% glutaraldehyde at 4°C until processing for transmission EM (TEM). Small pieces (1 mm3) of kidney cortex tissue were postfixed in 1% osmium tetroxide in 0.1 M cacodylate buffer for 1 hour at 4°C. To enhance contrast, the samples were incubated in 1% uranyl acetate for 1 hour, after which they were dehydrated with graded ethanol and 100% propylene oxide. The samples were incubated in 50% Epon/Araldite in propylene oxide before embedding in 100% Epon/Araldite. For toluidine blue staining, semithin sections (150 nm) were cut on an ultramicrotome (Reichert-Jung Ultracut E, Vienna, Austria) and transferred to a glass microscopic slide. The sample was stained with a drop of 1% toluidine blue/1% borate solution for 1–2 minutes at 40°C, rinsed with double distilled H2O, and air dried. The toluidine blue stained samples were visualized using an Axio Scan.Z1 slide scanner. For TEM imaging, ultrathin sections (70 nm) were cut on the ultramicrotome, mounted on formvar-coated grids, and stained with lead citrate. Images were acquired with a CM 100 TEM (FEI/Philips, Eindhoven, The Netherlands) equipped with a Gatan Orius 1000 CCD camera.
Imaging of Kidney Slices
Kidney cortex tissue slices were generated from freshly externalized organs in mice anesthetized with intraperitoneal injection of ketamine (170 mg/kg) and xylazine (10 mg/kg). After the removal of the capsule, one pole of the kidney was mounted and cut with a vibratome (Microm HM 650 V; Thermo Fisher Scientific, Waltham, MA) into 250 µm–thick sections. The tissue was kept until usage at 4°C in a physiologic slice buffer adjusted to pH 7.4 and gassed with carbogen (95% O2/5% CO2). For live imaging, slices were mounted into a heated chamber (Warner Instruments, Hamden, CT) filled with gassed slice buffer. For acute experiments, slices were equilibrated in the slice chamber at 37°C for 30 minutes before the slice buffer was changed. For incubation experiments, slices were incubated for 1 hour in slice buffer (at pH of 7.4 or 6.5) at 37°C before imaging. The pH of the buffers was set with 1M HCl. Sodium cyanide (5 mM) was administered in the slice buffer. For NAD experiments, slices were preincubated in pH 7.4 buffer containing 10 mM NAD for 30 minutes, before being transferred to pH 6.5 for 1 hour of incubation. Recordings were performed with an Olympus Fluoview 1000 MPE equipped with an XPlan N 25×/1.05 objective and an ultrafast Ti:Sapphire laser system. NAD(P)H was excited at 720 nm and visualized at 420–500 nm. To assess the mitochondrial signal, slices were incubated for 30 minutes with the mitochondria sequestered, voltage-dependent dye rhodamine 123 (50 nM), which was excited at 800 nm and visualized at 515–560 nm.
Intravital Imaging
Animals were anesthetized with isoflurane gas anesthesia (1.5%–5%) and oxygen (600 ml/min), and the left kidney was externalized for imaging as described previously.17 The internal jugular vein was cannulated to allow intravenous injections of dyes and reagents. Animals were placed on a custom-built, temperature-controlled stage and body temperature was monitored throughout experiments. Imaging was performed using a custom-built multiphoton microscope operating in an inverted mode,18 and powered by a broadband tunable laser (InSight DeepSee Dual Ultrafast Ti:Sapphire, Spectraphysics; Santa Clara, CA). Intravital imaging was performed with an XLPlan N ×25/1.05 water immersion objective (Olympus, Tokyo, Japan) and emitted light was collected through four highly sensitive gallium-arsenide-phosphide photomultiplier tubes (Hamamatsu, Japan) in a nondescanned epifluorescence detection mode. The following excitation wavelengths were used: TMRM (0.4 mg/kg) 850 nm, BSA–Alexa 488 (6 mg/kg) 950 nm, and Dextran Alexa 647 (2 mg/kg) 1120 nm. For fluorescence intensity, decay analysis images were acquired every 15 seconds.
Image Analysis
Regions of interest were drawn manually to obtain fluorescent signals from mitochondria, tubular lumens, or blood vessels. The quantitative analysis for dextran and BSA uptake was performed by a researcher blinded to the intervention, and each field of view (900 µm2) was captured using the same imaging setting. All image processing was carried out in FIJI.19 The nuclear signal was removed by applying a lower threshold. For better visualization of the images, contrast and brightness were modified, and applied to all parts of the figures equally. Some images were postprocessed to improve the quality, using the FIJI gaussian blur.
Statistical Analyses
Data are presented as mean values (±SEM). All data were analyzed using GraphPad Prism software. Mann–Whitney, unpaired, and paired t tests were used to compare two groups. One-way ANOVA and two-way ANOVA with Tukey’s multiple comparison test were used to compare more than two different groups. P values <0.05 were considered statistically significant. The number of tubules, slices, and animals used are provided in the figure legends.
Results
Acidosis Induces a Redox Change in NAD in PTs
To investigate the acute effects of MA on mitochondrial function, we performed multiphoton imaging of freshly cut slices of mouse kidney cortex tissue. This approach allows tight control of extracellular fluid pH and substrate concentration. The autofluorescence signal from mitochondrial NAD(P)H is detectable under specific excitation/emission conditions, and provides a readout of redox state.15 Acutely decreasing the pH of the buffer to 6.5 induced an acute (within 20 minutes) decrease in NAD(P)H signal (Figure 1A), signifying a shift to an oxidized state, because the molecule is only fluorescent when reduced.20 This response was specific to PTs, because a similar decrease was not observed in neighboring distal tubules, even after 1 hour (Figure 1B).
Figure 1.
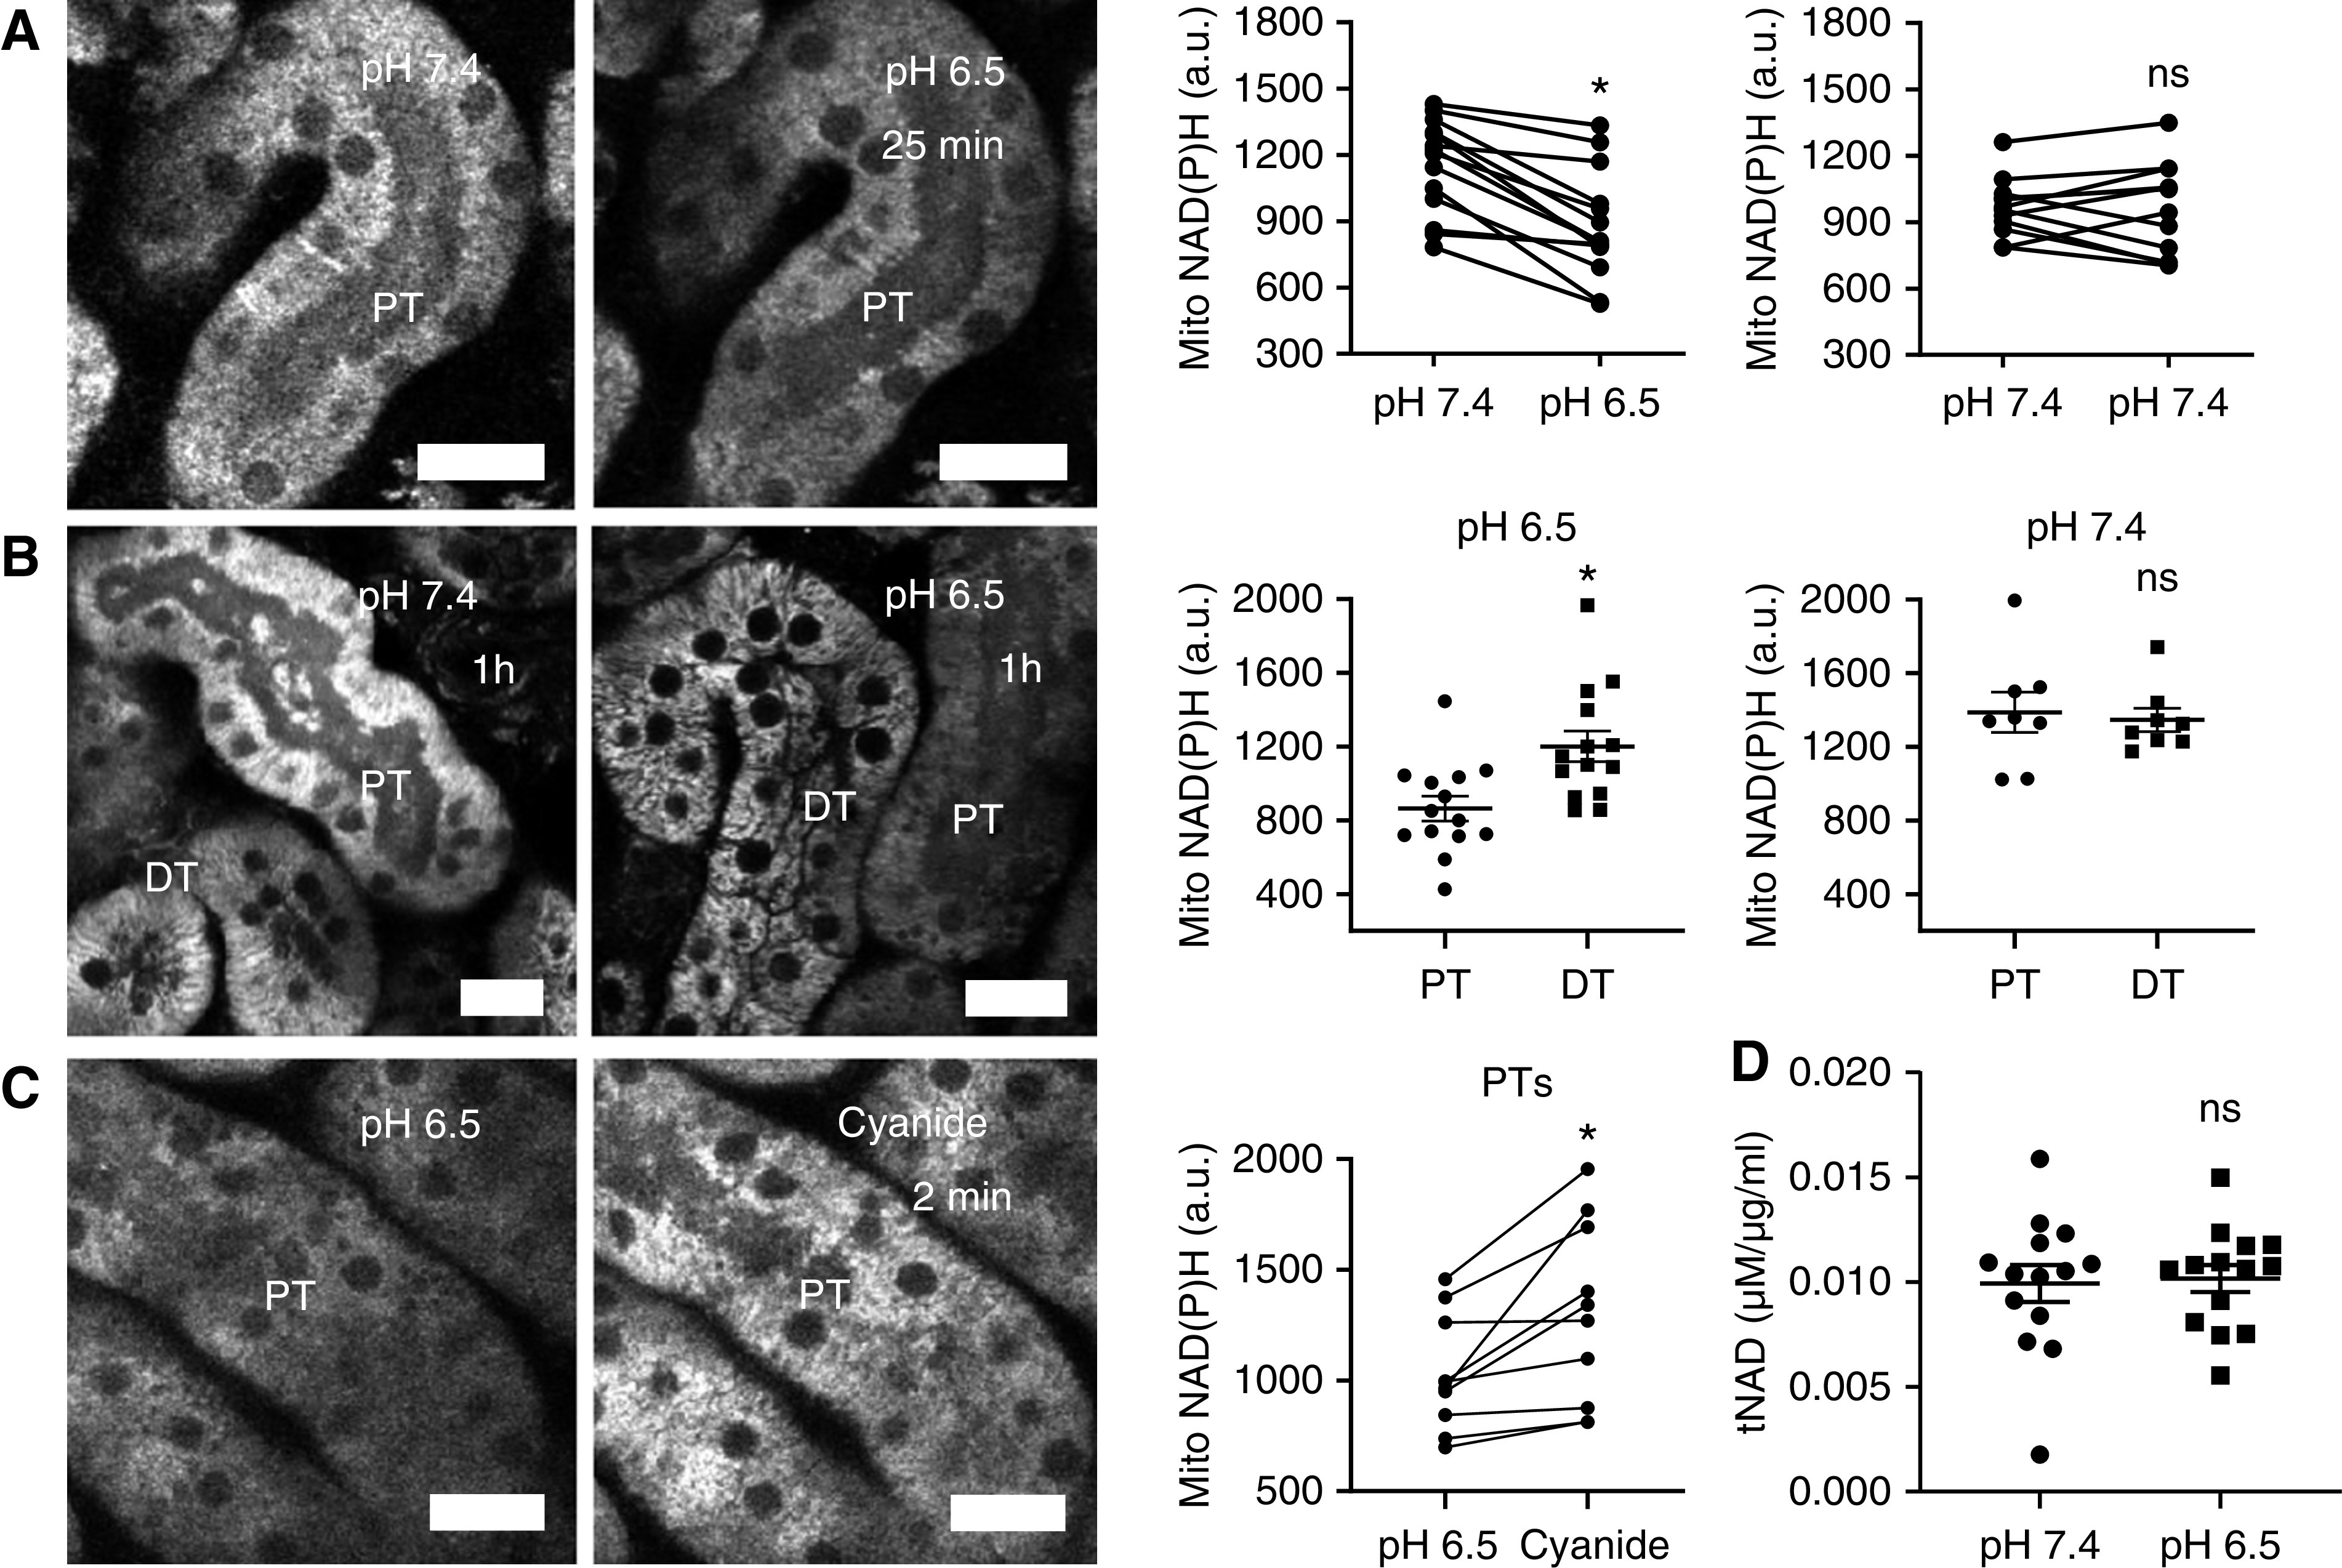
Acidosis drives NAD redox changes in the PTs. (A) Mitochondrial NAD(P)H signal in the PT decreased in response to acute acidosis. Data are presented as fluorescence intensity values before and 25 minutes after change of buffer with pH 6.5 or 7.4 (n=12–14 PTs from three to five kidney slices from three to four different animals). P<0.01 for pH 7.4 versus pH 6.5, and P=0.9 for pH 7.4 versus pH 7.4 after paired t tests. (B) After 1 hour of incubation at pH 6.5, NAD(P)H signal in PTs was lower than in distal tubules (DTs). Data are presented as fluorescence intensity values after incubation in pH 7.4 or pH 6.5 buffer (n=8–14 PTs from six to seven kidney slices from six different animals). P<0.01 for PT versus DT at pH 6.5, and P=0.9 for PT versus DT at pH 7.4 after unpaired t tests. (C) After 1 hour of acidosis, inhibiting the RC with cyanide (5 mM) caused an abrupt increase in mitochondrial NAD(P)H signal. Data are presented as fluorescence intensity values before and after cyanide (n=10 PTs from five kidney slices from four different animals). P<0.05 for pH 6.5 versus cyanide after paired t test. (D) Total NAD levels, measured in control and acid-treated slices after 25 minutes, remained unchanged (n=14 kidney slices from four different animals). P=0.8 for pH 7.4 versus pH 6.5 after unpaired t test. Scale bars = 20 µm. a.u., arbitrary units.
NAD(P)H fluorescence increased abruptly in PTs response to cyanide, which inhibits the RC and prevents it oxidizing NAD (Figure 1C). Moreover, as expected from the known t1/2,8 total NAD—measured with a colorimetric assay in whole kidney cortex tissue—did not change within the timeframe of the decrease in NAD(P)H fluorescence (Figure 1D). To exclude a direct effect of pH on NAD(P)H fluorescence, we measured fluorescence signal intensity emitted by NADH dissolved in the same physiologic buffer used for slice experiments, across a range of different pH values. Using this approach, we did not observe any significant change in emission from pH 6.5 to 7.8, suggesting that pH changes are unlikely to explain decreases in mitochondrial NAD(P)H signal during acidosis (Supplemental Figure 1). Taken together, these findings suggest that MA induces a change in mitochondrial NAD redox state (toward oxidation) in PTs.
Acidosis Induces a Switch toward Increased Complex I Activity
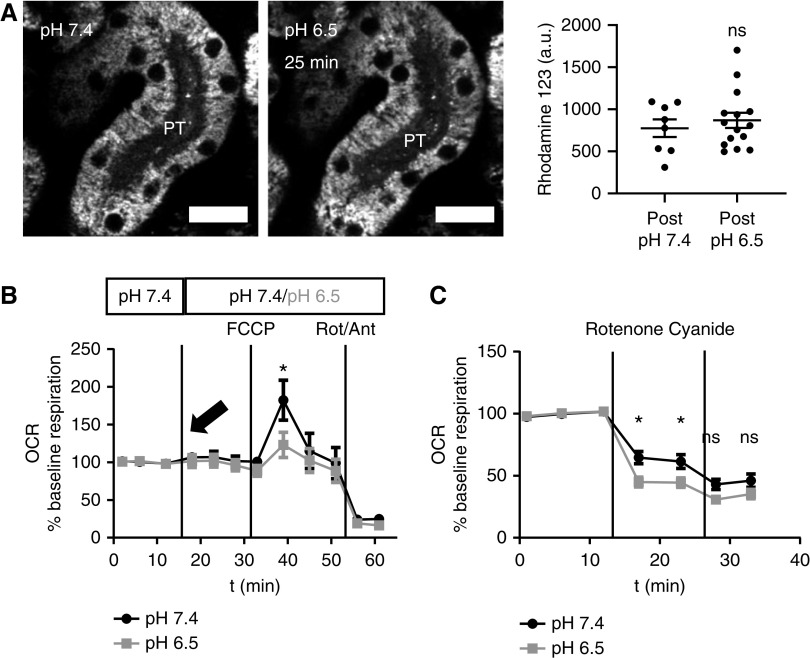
To further investigate the effects of MA on mitochondrial function, we loaded kidney slices with the voltage-dependent dye rhodamine 123, which provides a readout of mitochondrial energization state. Using this approach, we did not observe any difference in mitochondrial membrane potential between PTs incubated at pH 6.5 or 7.4 (Figure 2A). Moreover, acutely inducing acidosis with 0.1% HCl did not change baseline OCR in isolated PTs (Figure 2B). However, the maximal OCR achieved with the RC uncoupler carbonyl cyanide-4-(trifluoromethoxy)phenylhydrazone was significantly lower under acidotic conditions, implying a decrease in respiratory capacity.
Figure 2.
Acidosis induces a switch toward increased complex I activity. (A) Mitochondrial rhodamine 123 signal in the PTs did not change in response to acute acidosis. Data are presented as fluorescence intensity values 25 minutes after changing the pH of the buffer to 7.4 or 6.5 (n=8–14 PTs from four kidney slices from three different animals). P=0.5 for pH 7.4 versus pH 6.5 after unpaired t test. (B) OCR in isolated PTs did not change with acute pH change to 6.5 (arrow); however, maximum respiration capacity, measured using the RC uncoupler carbonyl cyanide-4-(trifluoromethoxy)phenylhydrazone (1 µm), was significantly decreased in PTs exposed to acidic pH. OCR was normalized to baseline oxygen consumption of each well (n=10 wells per group from four different animals). P<0.05 for pH 7.4 versus pH 6.5 after two-way ANOVA (Tukey’s multiple comparison test). (C) Selective inhibition of complex I with rotenone (1 µm) produced a bigger decrease in OCR in isolated PTs incubated in pH 6.5 than in PTs incubated in pH 7.4 (n=20 wells per group from seven different animals). P<0.05 and P<0.01 for pH 7.4 versus pH 6.5 after two-way ANOVA (Tukey’s multiple comparison test). Complete blockade of RC function with cyanide (2 mM) decreased OCR in both groups to the same levels. P=0.4 and P=0.6 for pH 7.4 versus pH 6.5 after two-way ANOVA (Tukey’s multiple comparison test). Scale bar = 20 µm. a.u., arbitrary units.
Previous studies have suggested that lipids provide the main metabolic fuel for PTs,10 and that electrons enter the RC predominantly via complex II and the electron transfer flavoprotein.21–23 We reasoned that our findings in acidosis could be consistent with a switch toward complex I, because NADH is the substrate for this enzyme. To verify this, we applied the specific complex I inhibitor rotenone and observed a significantly greater decrease in OCR in tubules incubated at pH 6.5 when compared with control conditions, consistent with increase in complex I activity in acidosis (Figure 2C).
Acidosis Induces a Decrease in Lipid Metabolism in PTs
After the decrease in NAD(P)H signal, we noticed the appearance of numerous vacuoles in PTs, which were confined to the second (S2) segment (Figure 3A). S1 and S2 segments can be distinguished in live imaging studies by their characteristic autofluorescence signals, particularly in the green range (Supplemental Figure 2).15,24 These vacuoles also appeared when slices were incubated at pH 7, but after a longer time period (3 hours) than at pH 6.5, and were again associated with a decrease in NAD(P)H signal (Figure 3B). We suspected that these vacuoles might signify a change in lipid metabolism, and to investigate this further we used an established in vivo model, whereby acute MA was induced by oral gavage of ammonium chloride.16 As expected, treated animals displayed low blood pH and bicarbonate levels (Figure 3C), and vacuoles were observed in PTs in histologic sections. We used antibody staining for the lysosomal marker Lamp125 and the peroxisomal marker PMP-7024 to identify S1 and S2 segments, respectively, and confirm that vacuoles occurred in the latter (Figure 3, D and E, Supplemental Figure 3).
Figure 3.
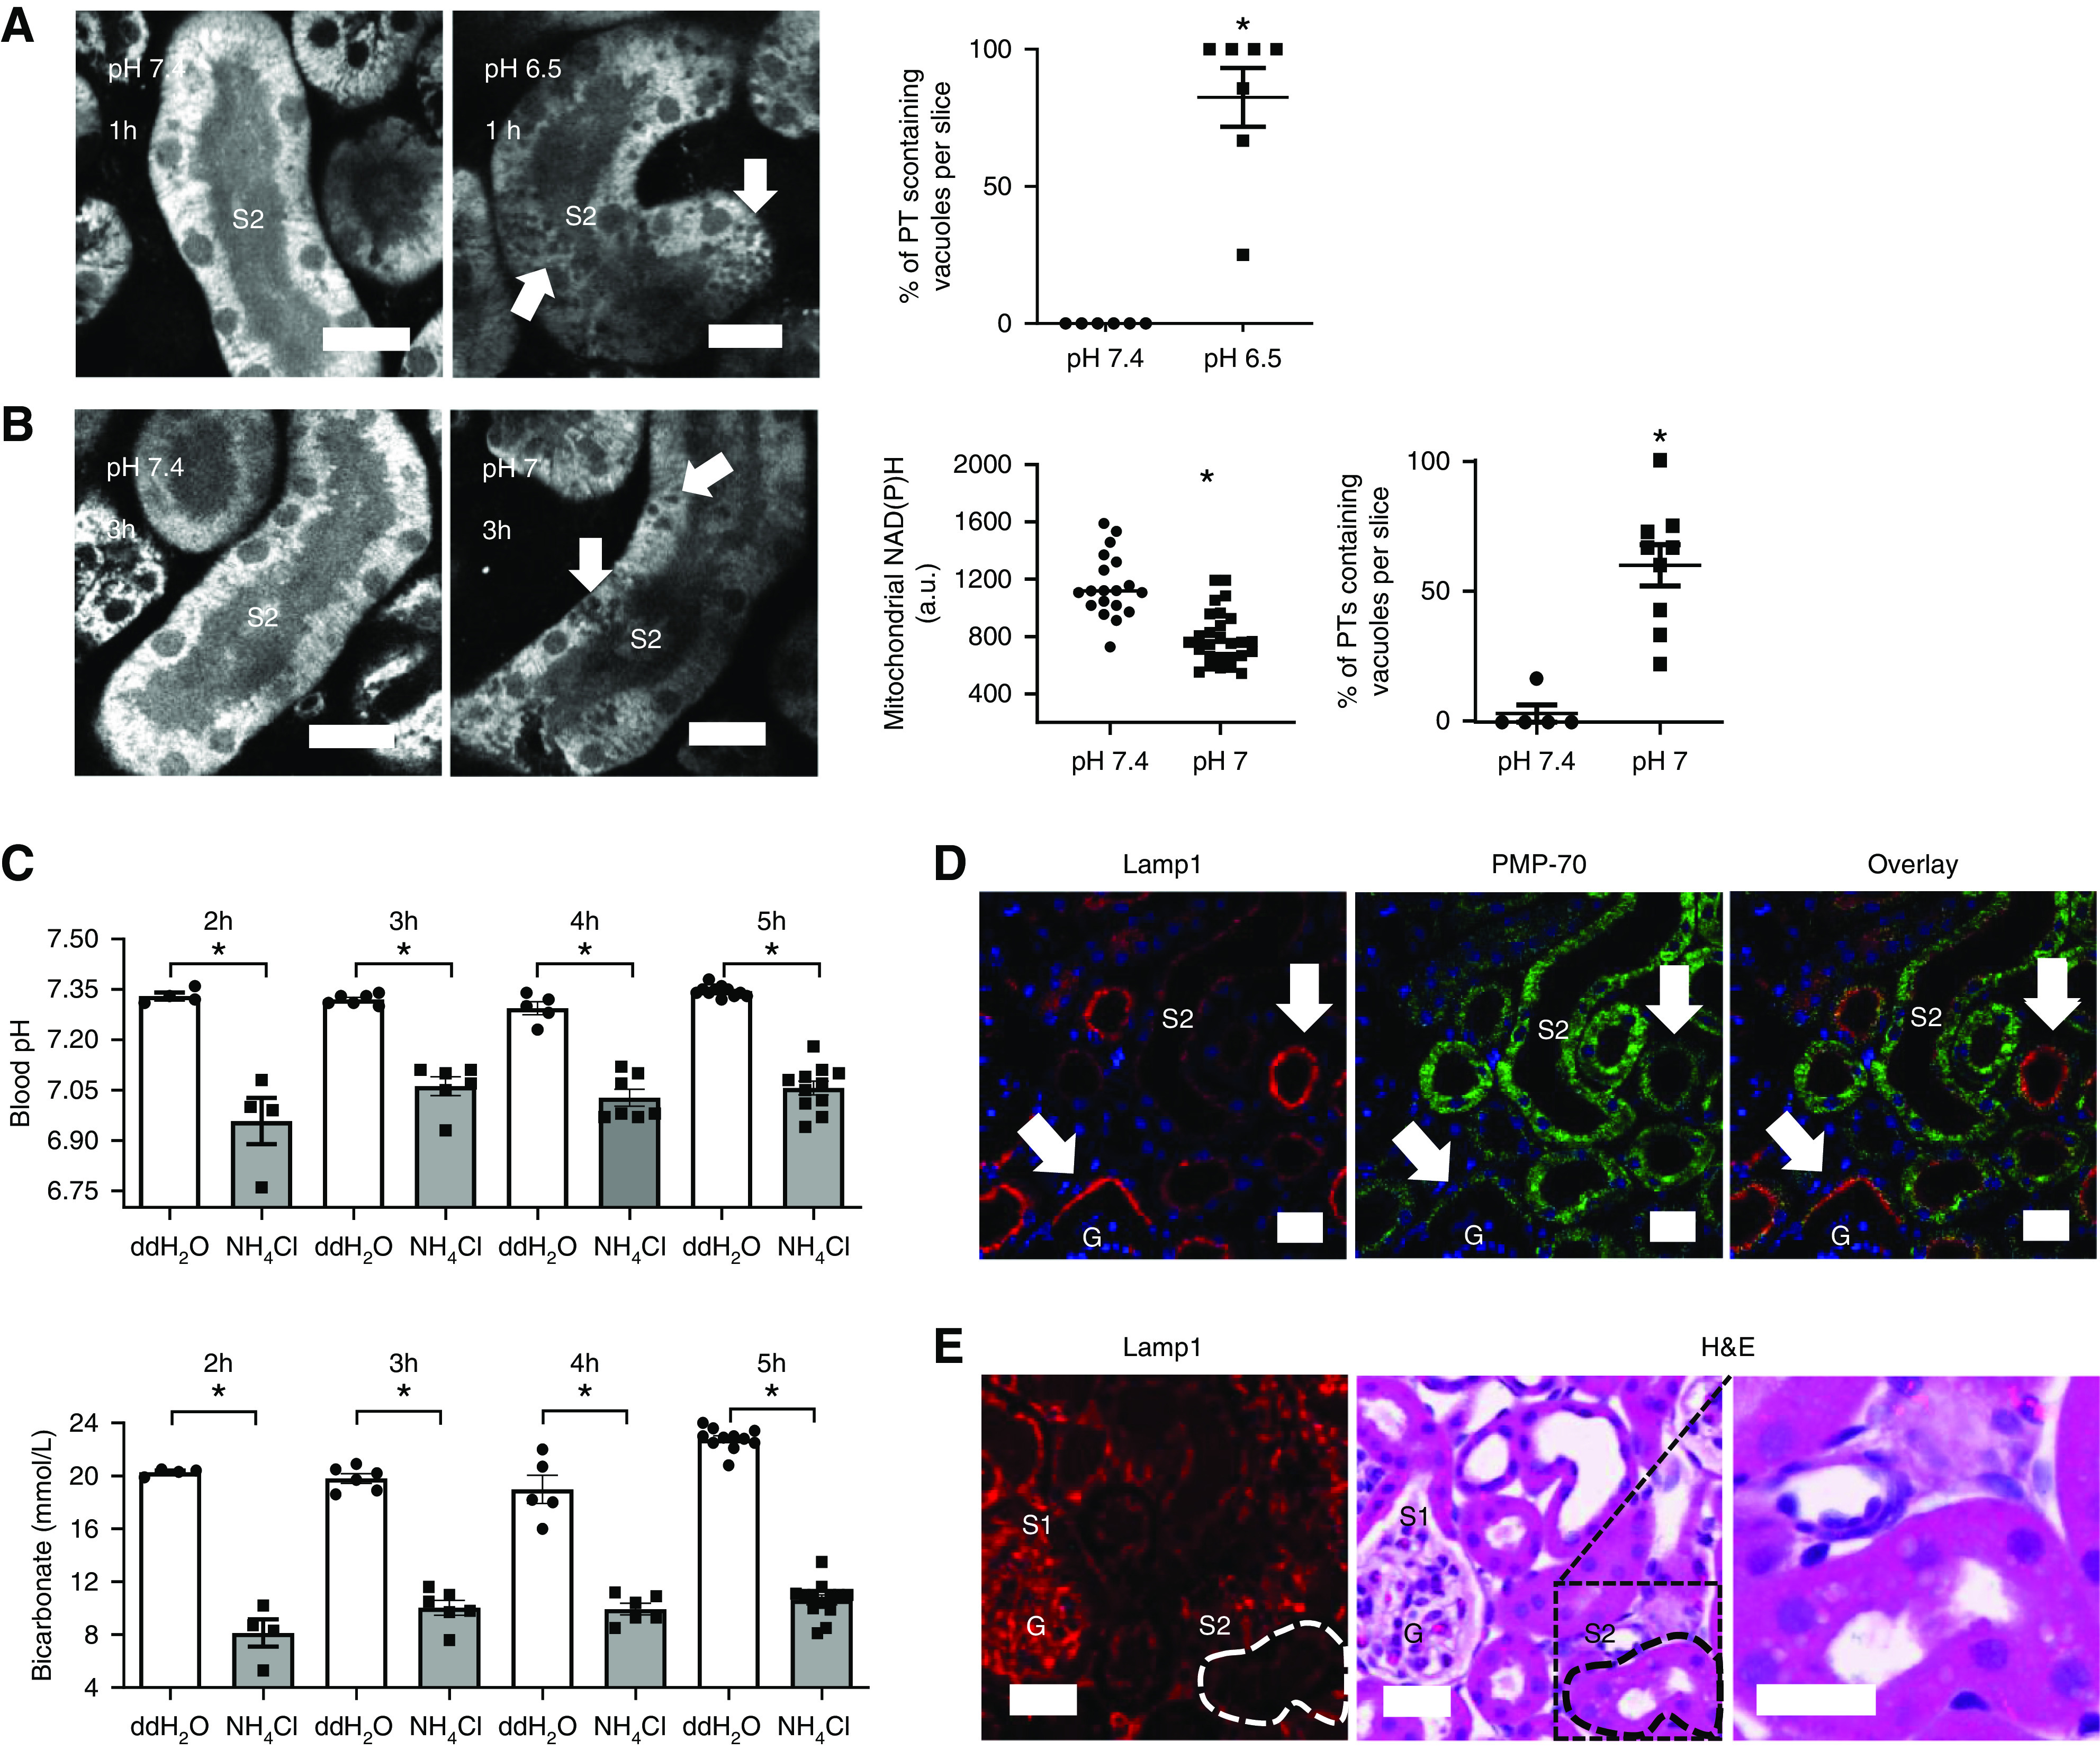
Acidosis induces the appearance of vacuoles in the PT. (A) Live imaging of NAD(P)H signal in kidney slices, showing the appearance of vacuoles (arrows) in S2 segments of PTs after 1-hour incubation in pH 6.5 (n=6–7 different slices from five different animals). P<0.01 for pH 7.4 versus pH 6.5 after Mann–Whitney U test. (B) Mitochondrial NAD(P)H signal was significantly lower in PTs incubated at pH 7 for 3 hours when compared with controls. Data are presented as fluorescence intensity values after incubation in pH 7.4 or pH 7 buffer (n=19–27 PTs from five to eight kidney slices from four different animals). P<0.01 for pH 7.4 versus pH 7 after unpaired t test. Vacuoles (arrows) were also observed after 3 hours of incubation at pH 7 (n=5–8 different slices from four different animals). P<0.01 for pH 7.4 versus pH 7 after Mann–Whitney U test. (C) Blood pH and blood bicarbonate concentration, measured in animals 2, 3, 4, and 5 hours after acidosis was induced with 1.5 M NH4Cl, were significantly lower in comparison with control-treated animals (double-distilled (dd) H2O) (n=4–11 animals per group). Blood pH and bicarbonate (for all of the timepoints): P<0.01 for double-distilled (dd) H2O versus NH4Cl after unpaired t tests. (D) Antibody staining for the lysosomal marker LAMP1 and peroxisome-specific antibody PMP-70 was used to identify S1 (arrows) and S2 PT segments, respectively, in fixed kidney tissue. (E) Hematoxylin and eosin (H&E)-stained tissue 5 hours after induction of acidosis, showing vacuoles in PT segments, identified as S2 by a low LAMP1 signal. Scale bars = 20 µm. G, glomerulus.
To identify the nature of these vacuoles we proceeded to EM, which revealed them to be grossly enlarged multilamellar bodies (MLBs) (Figure 4, A–C). These whirl-like structures are thought to consist of complex lipids and have been described previously in the PTs of animals fed high-fat diets.26 MLBs in acid-treated animals stained positively with toluidine blue, confirming their lipid content (Figure 4D). Further support for a major change in lipid metabolism in PTs was provided by intense staining for ORO in acid-treated mice (Figure 4E). Moreover, lipidomics measurements of kidney cortex tissue using liquid chromatography–mass spectrometry revealed an increase in phospholipids and sphingolipids in acidotic animals (Supplemental Figure 4), both of which are major components of MLBs.26
Figure 4.
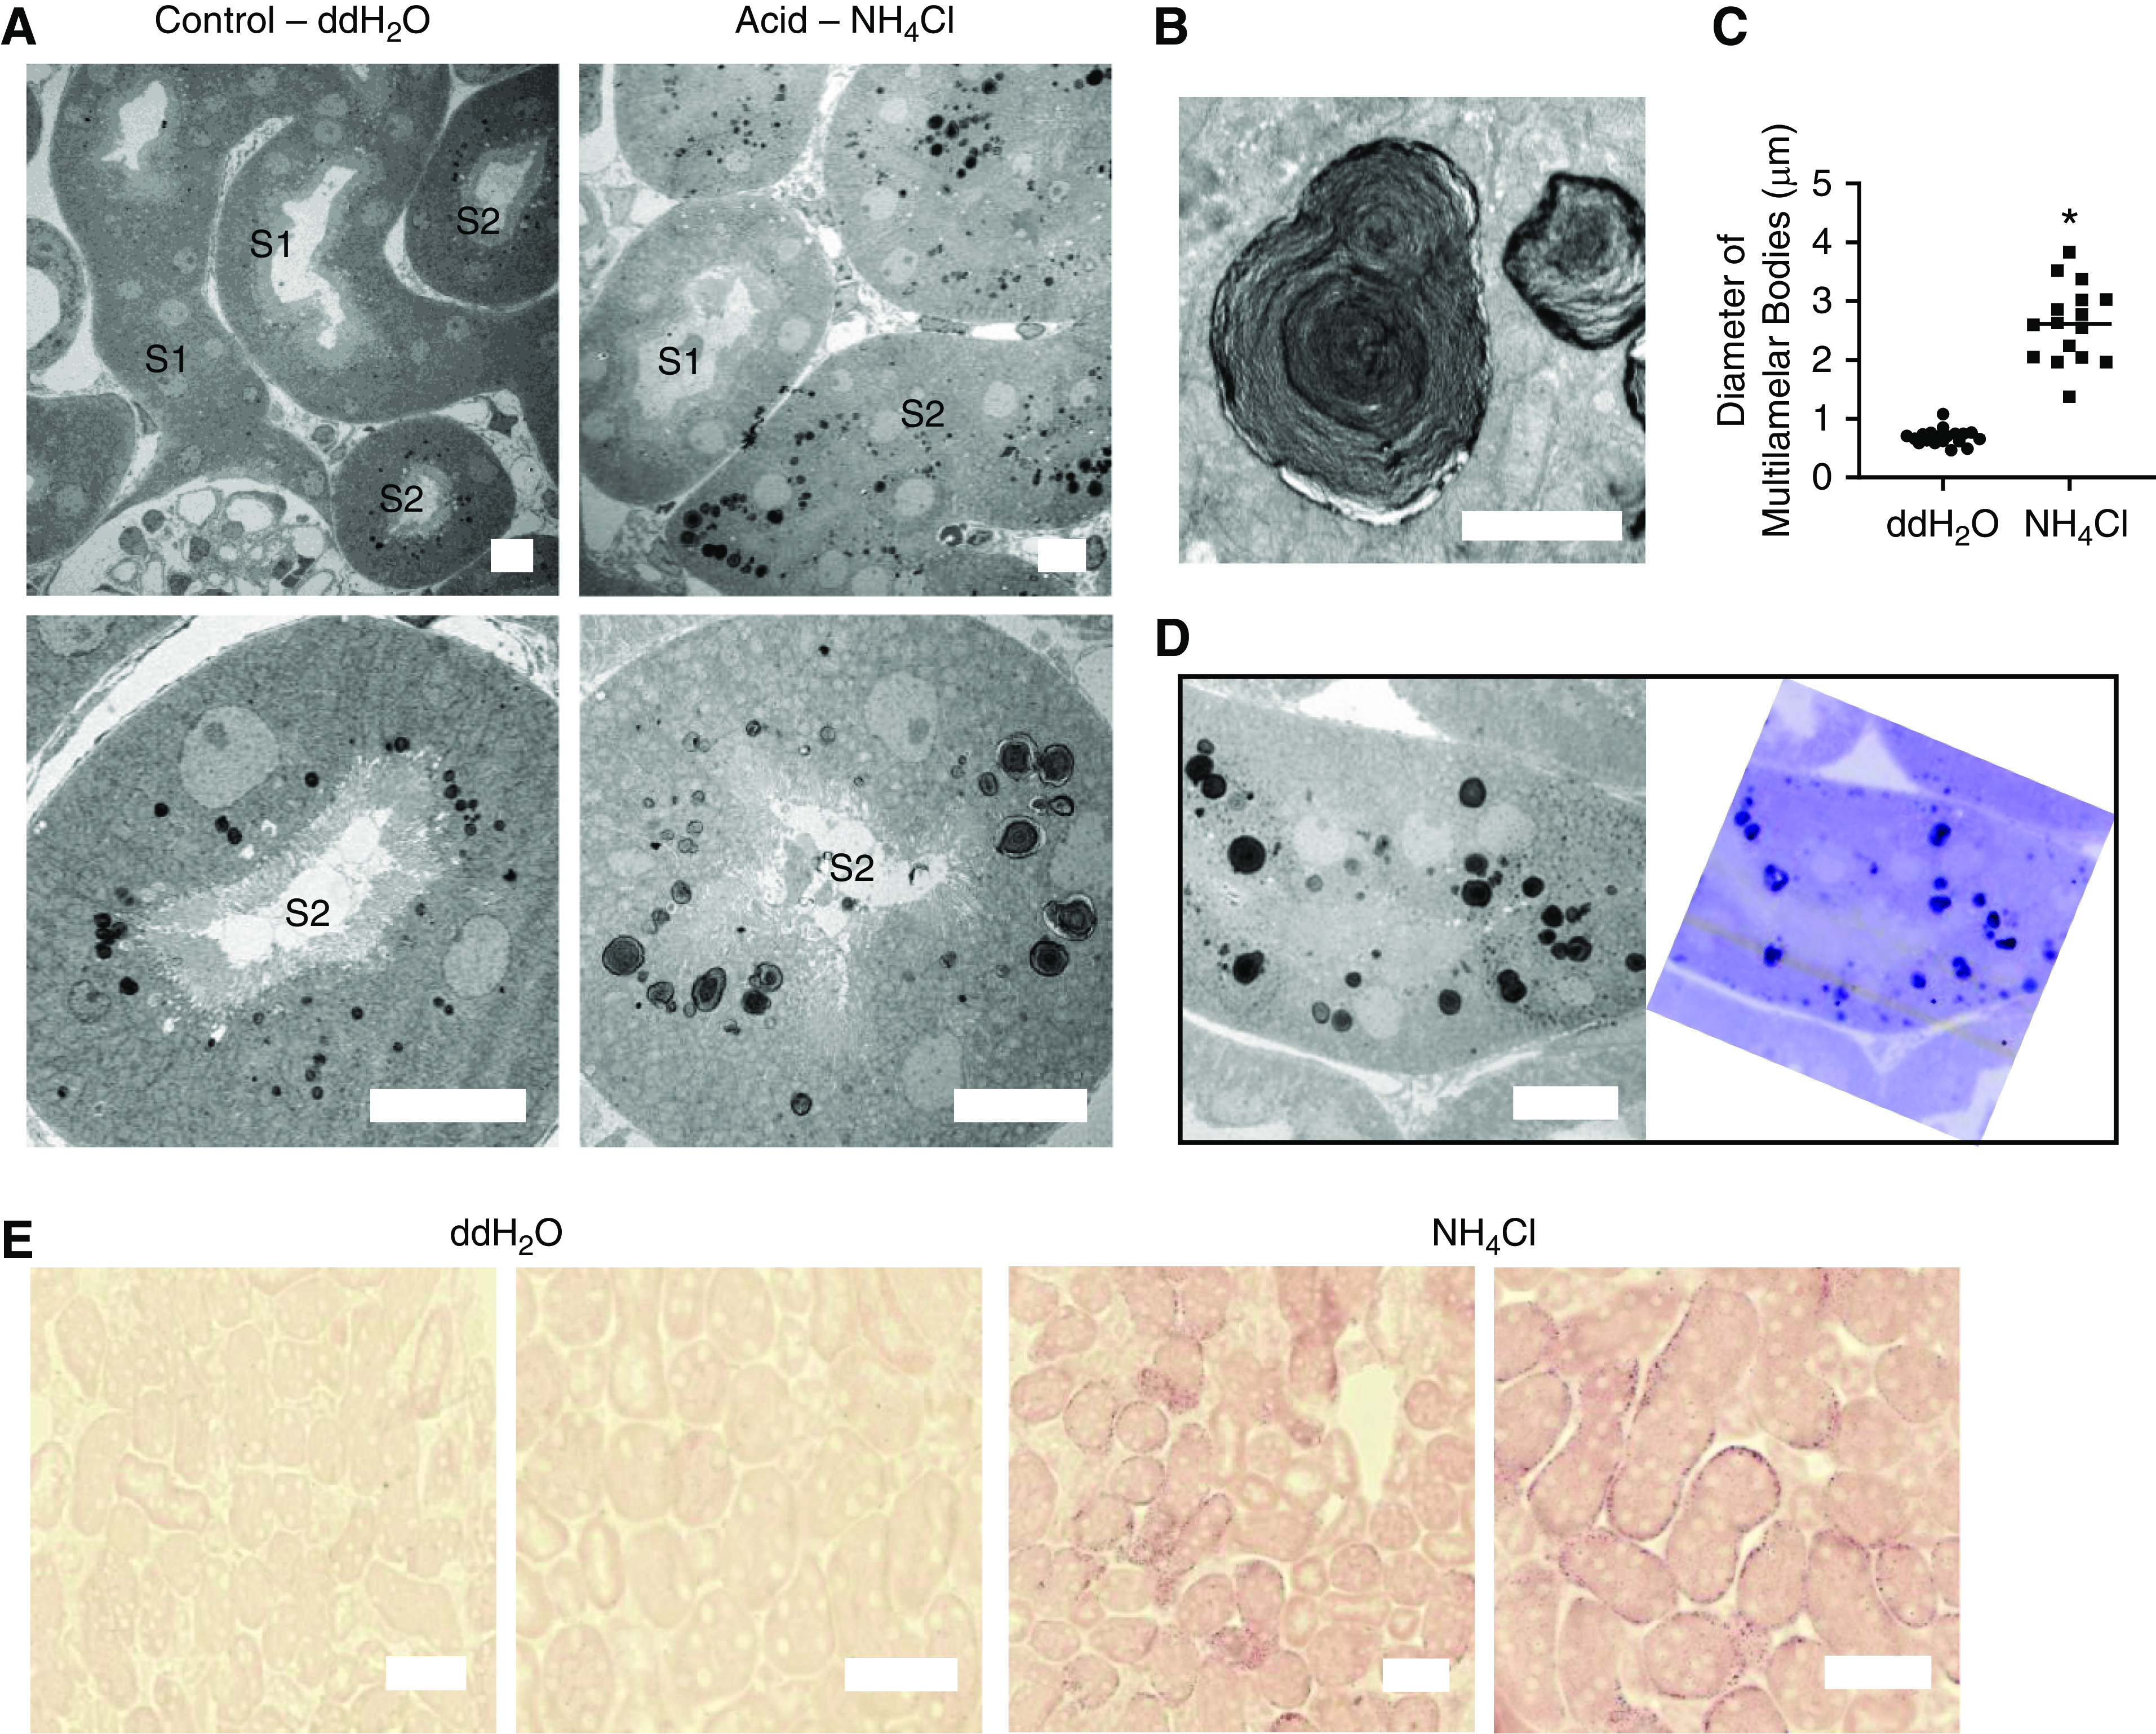
Acidosis causes changes in PT lipid metabolism. (A) EM images of PTs 5 hours after gavage, showing enlargement of MLBs in S2 segments of acid-fed mice. Scale bars = 10 µm. (B) Zoomed-in images of MLBs, demonstrating the whirl-like structure. Scale bar = 2 µm. (C) Measurement of diameter of MLBs in control- and acid-treated animals (n=16–19 MLBs from three different areas from five different animals). P<0.01 for double-distilled (dd) H2O versus NH4Cl. (D) Corresponding EM (left) and toluidine blue–stained (right) images, showing a high phospholipid content of the MLBs. Scale bar = 10 µm. (E) ORO staining intensity 2 hours after gavage was much higher in PTs of acid-fed animals. Scale bars = 50 µm.
Evidence for a Functional Link Between NAD Redox State and Lipid Metabolism in PTs
We next explored whether changes in NAD redox state and lipid metabolism occurring during acidosis might be functionally related. We have previously found the NAD redox state can be manipulated in PTs in tissue slices by applying either pyruvate or lactate, which push the NAD pool into an oxidized or reduced state, respectively.15 When kidney tissue was incubated under acidotic conditions with pyruvate, NAD(P)H fluorescence in PTs was low and numerous vacuoles appeared. In contrast, incubation with lactate produced a much higher PT NAD(P)H signal under acidosis, and the appearance of vacuoles was almost completely abolished (Figure 5A). Reversing pH back to 7.4 also increased NAD(P)H signal and vacuoles subsequently disappeared (Figure 5B). Taken together, these results provide evidence for a functional link between pH, NAD redox state, and lipid metabolism during MA.
Figure 5.
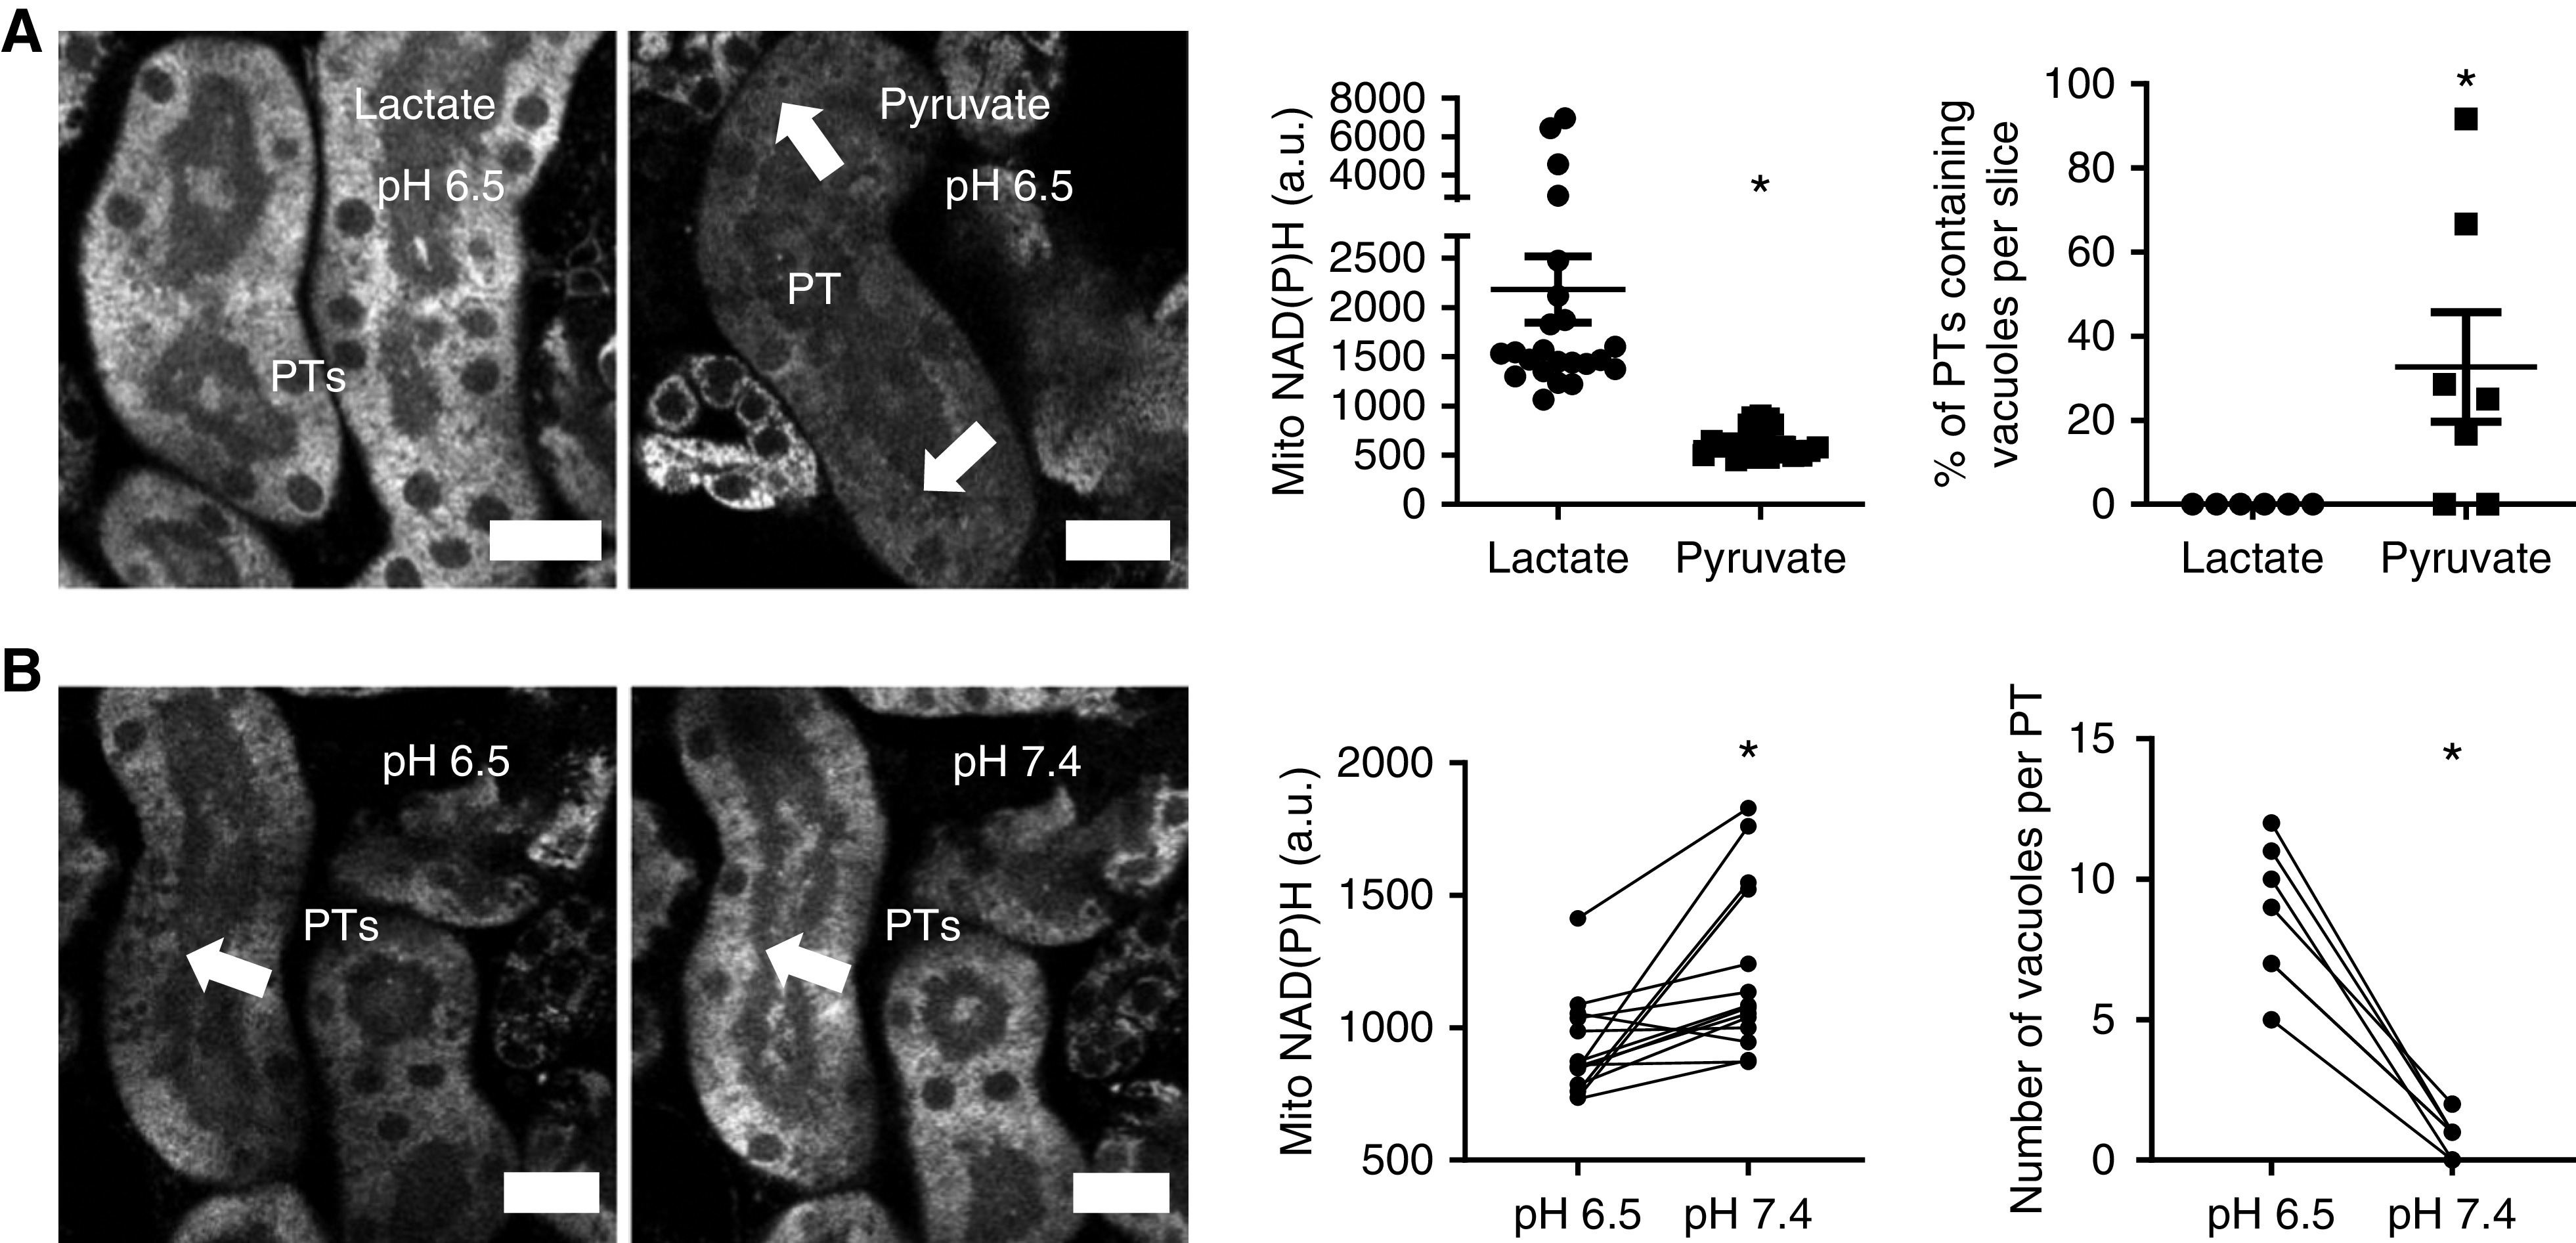
Acidosis-induced effects are sensitive to NAD redox state and reversible. (A) After incubation at pH 6.5 for 1 hour, NAD(P)H signal was significantly higher in PTs in kidney slices incubated in lactate (10 mM) than in pyruvate (10 mM) (n=22 PTs from four different slices, from two different animals). P<0.01 for lactate versus pyruvate after Mann–Whitney U test. Conversely, vacuole formation (arrows) was significantly lower in lactate incubated tissue (n=6–7 different slices from three to five different animals). P<0.05 for lactate versus pyruvate after Mann–Whitney U test. (B) After 1 hour of acidosis, increasing pH back to 7.4 caused an increase in mitochondrial NAD(P)H signal (n=14 PTs from nine different slices from five different animals; P<0.01 for pH 6.5 versus pH 7.4 after paired t test) and disappearance of lipid vacuoles (arrow) (n=7 PTs from seven different slices from five different animals; P<0.01 for pH 6.5 versus pH 7.4 after paired t test). a.u., arbitrary units.
Acidosis Causes Acute Tubular Injury In Vivo
Next, we investigated whether MA is injurious for PTs in vivo. Histologic analysis of kidneys from acidotic mice revealed clear evidence of thin tubules, apical shedding of material, and luminal debris (Figure 6A, Supplemental Figure 5), all classic features of AKI.27 To assess kidney function in vivo, we injected a small (10 kDa) fluorescently labeled dextran intravenously, and followed its passage through the kidney in real time using intravital multiphoton microscopy. Quantitative analysis of the decay of signal in blood did not reveal evidence of a defect in glomerular filtration in acidotic animals (Figure 6B), suggesting there was no major change in vascular perfusion. Moreover, the transit time in PT lumens was also not affected (Figure 6B), signifying preserved tubular flow. However, the uptake of filtered dextran was markedly reduced in acid-treated mice, denoting a severe defect in solute reabsorption (Figure 6, C and D). In contrast, uptake of the mitochondrial voltage-dependent dye TMRM was similar to controls (Figure 6, C and E), supporting our ex vivo finding that mitochondria in PTs remain active and energized during acidosis. Taken together, our results suggest that MA is directly harmful to kidney tubules and induces an AKI phenotype, in the absence of major hemodynamic disturbances.
Figure 6.
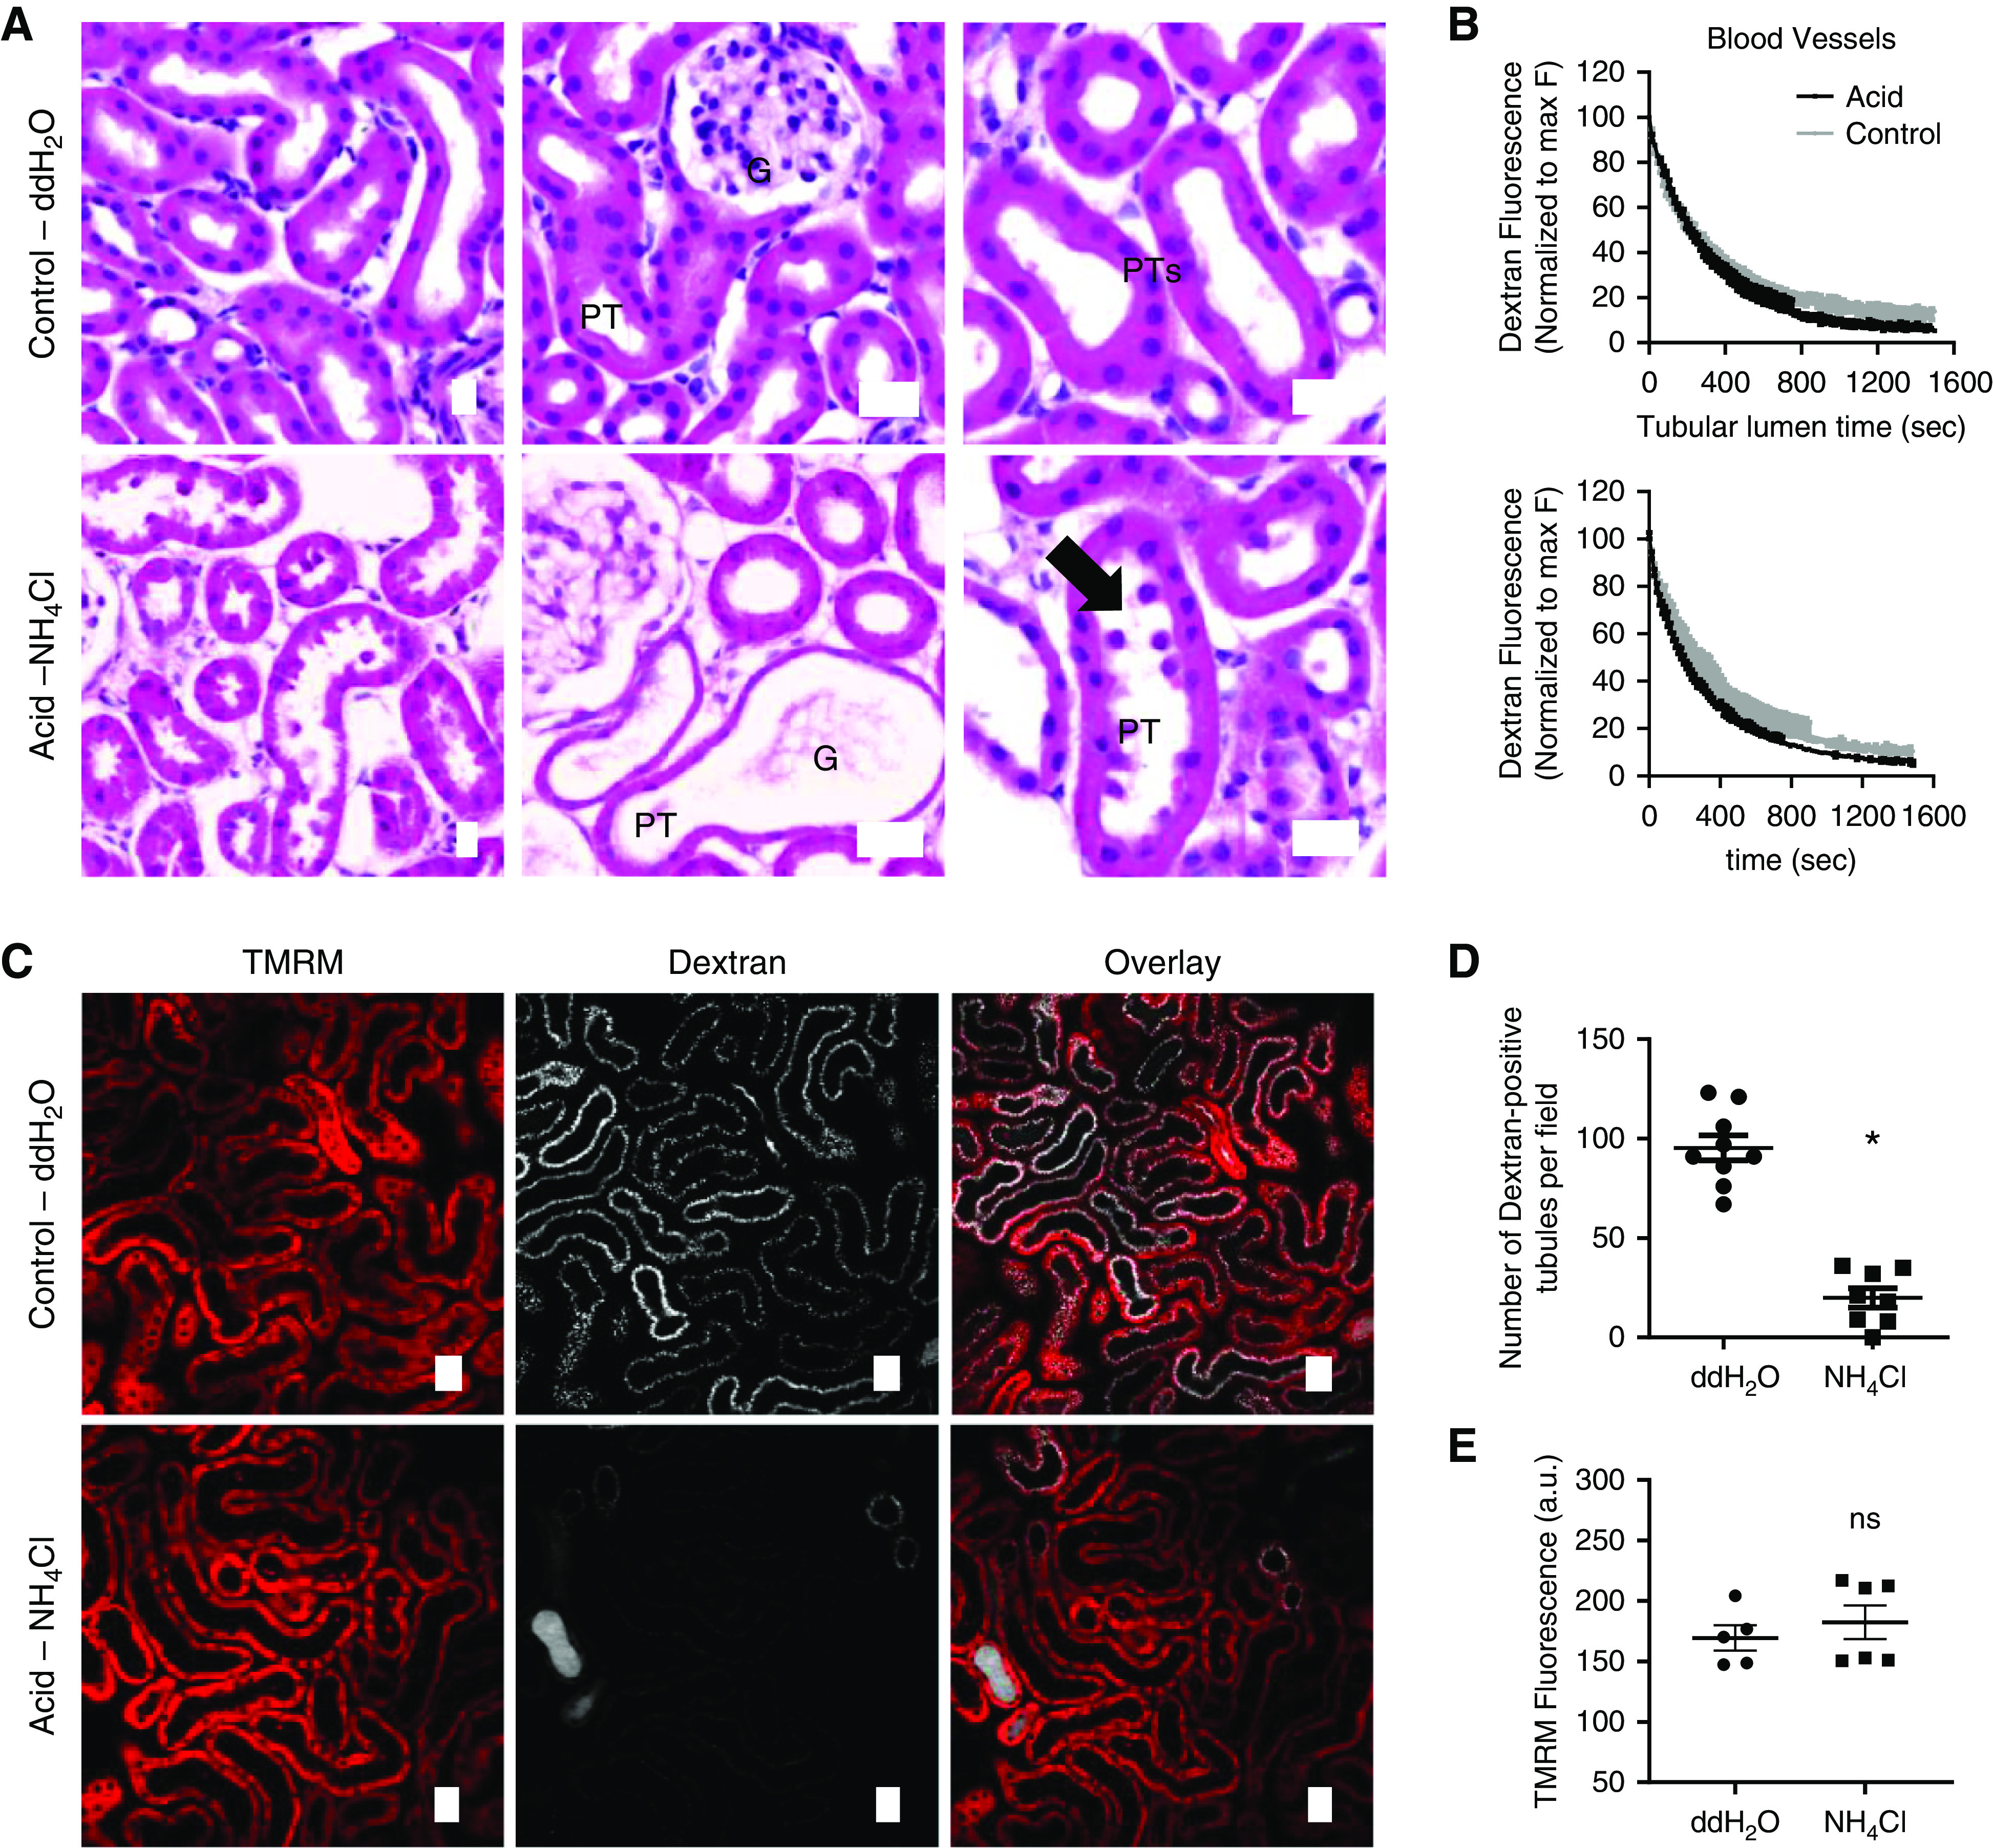
Acidosis induces an AKI phenotype in PTs. (A) Hematoxylin and eosin (H&E) staining in acid-fed mice revealed thinning of PTs and shedding of cellular debris (arrow), consistent with AKI. (B) Dextran fluorescence intensity decay curves, acquired using intravital microscopy, from blood vessels (reflecting GFR) and PT lumens (reflecting luminal flow) did not reveal differences between control and acid-treated animals. Two-phase model fitted well to the entire data points and was the same for both data sets. (C–E) Uptake of filtered dextran in PTs was drastically reduced in acid-treated mice (n=8–9 different areas from three different animals per group; P<0.01 for double-distilled (dd) H2O versus NH4Cl after unpaired t test), whereas the PT mitochondrial TMRM signal did not differ from control animals (n=6 different areas from three different animals per group; P=0.5 for ddH2O versus NH4Cl after unpaired t test). Scale bars = 20 µm. a.u., arbitrary units; G, glomerulus.
Bicarbonate Treatment Reverses Acid-Induced Damage in Kidney Tubules
To investigate whether the harmful effects of MA on PT function are reversible, 2 hours after induction of MA animals were injected intravenously with bicarbonate (420 mg/kg), which produced an expected rise in blood pH and bicarbonate concentration (Figure 7A). This was associated with a significant increase in dextran uptake in PTs in comparison to acidotic animals treated with sodium chloride (Figure 7B). To validate the results with dextran, we also injected mice with fluorescently labeled albumin, which is a physiologic ligand for transport in the PT.28 Again, we found that uptake was markedly improved by bicarbonate, suggesting this can at least partially reverse the damage caused by MA (Figure 7C).
Figure 7.
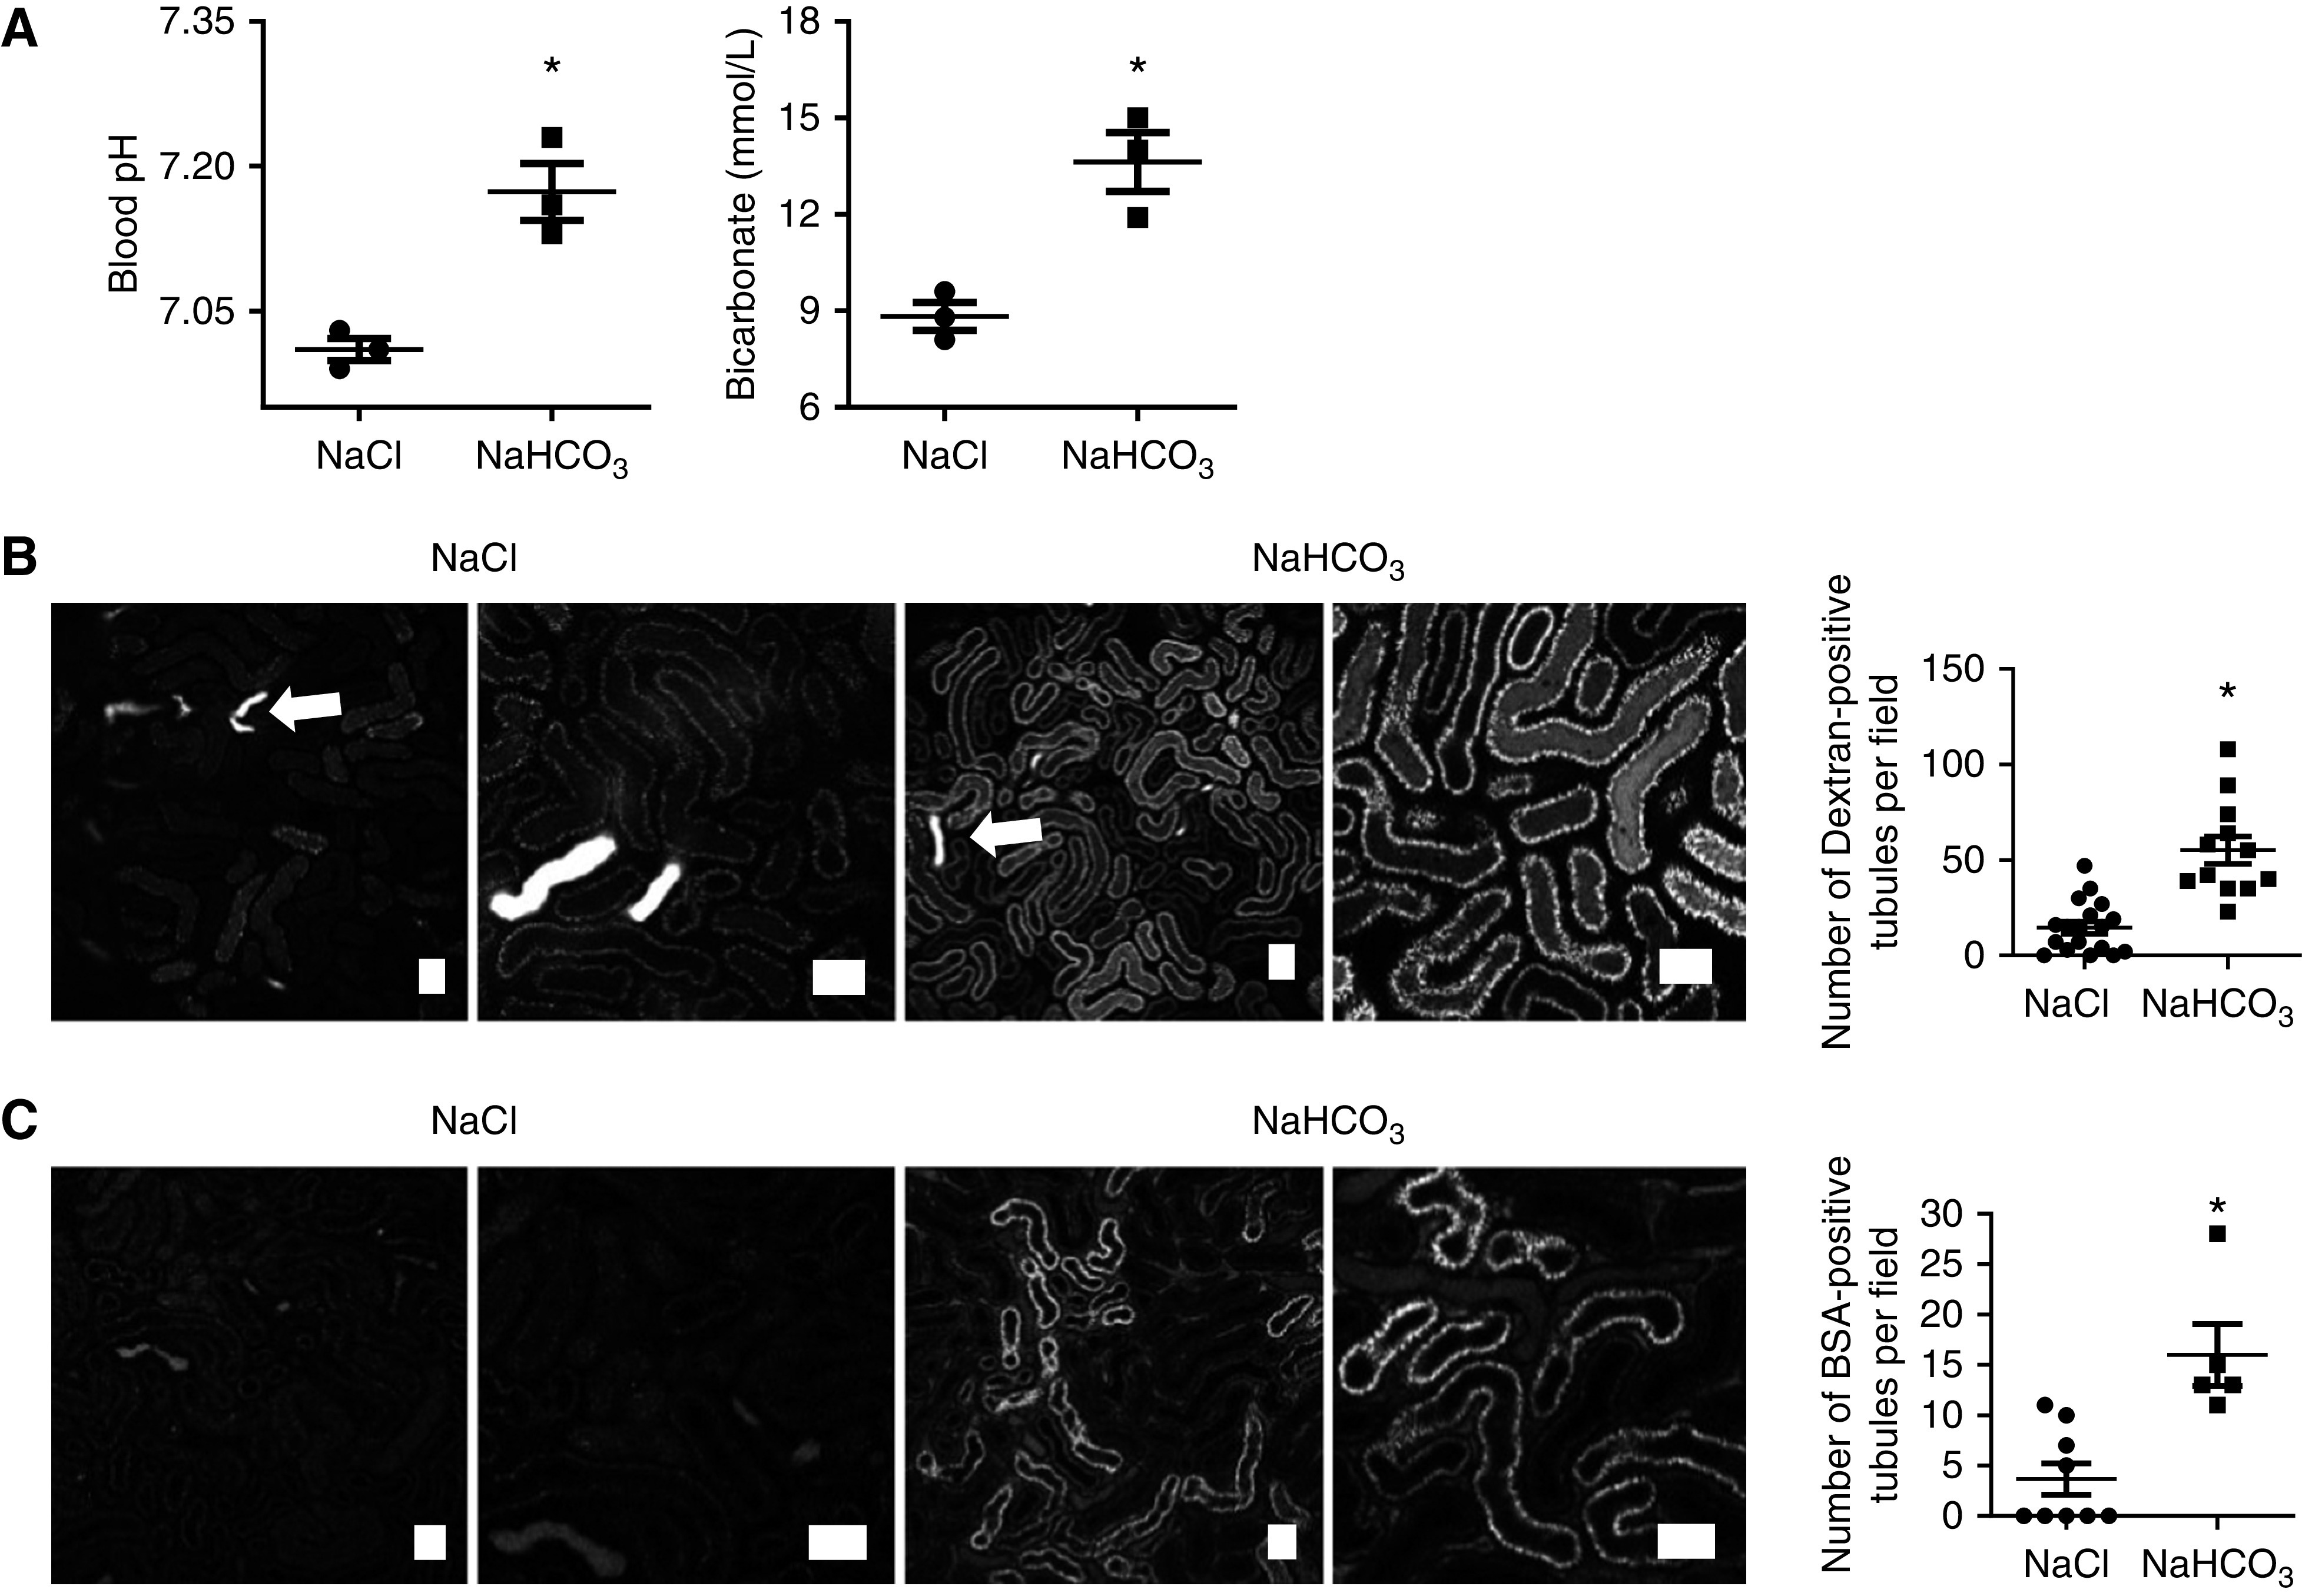
Bicarbonate partially reverses acidosis-induced effects in proximal tubular function. (A) Treatment with bicarbonate 2 hours after the induction of acidosis led to an increase in both pH and bicarbonate concentrations, in comparison to control (NaCl) treatment (n=3 different animals per group pH). Blood pH: P<0.05 for NaCl versus NaHCO3 after unpaired t test. Bicarbonate: P<0.05 for NaCl versus NaHCO3 after unpaired t test). (B) Intravital microscopy revealed a significant increase in dextran uptake in S1 and S2 PTs in bicarbonate treated animals (n=12–16 different areas from four different animals per group). Luminal wasting of concentrated dextran (arrows) can be observed in the distal tubules. Images were acquired 30 minutes after injection. P<0.01 for NaCl versus NaHCO3 after unpaired t test. (C) BSA uptake in S1 PTs was also increased (n=5–9 different areas from three different animals per group). Images were acquired 30 minutes after injection. P<0.01 for NaCl versus NaHCO3 after unpaired t test. Scale bars = 50 µm.
Supplementation with an NAD Precursor is Protective Against Acidosis-Induced Kidney Injury
Finally, we investigated whether NAD supplementation could ameliorate damage induced by acidosis. Addition of NAD 10 mM caused an acute increase in PT NAD(P)H signal in kidney slices, which was transient, suggesting that a new equilibrium was reached (Supplemental Figure 6). After incubation for 1 hour at pH 6.5, the number of vacuoles in PTs was significantly lower in kidney slices treated with 10 mM NAD, compared with those exposed to acid alone (Figure 8A). To supplement NAD in vivo, mice were given two intraperitoneal injections of the precursor NAM (400 mg/kg) 24 hours and 2 hours before gavage with ammonium chloride, according to a previously established protocol.9 ORO staining was markedly reduced in PTs in fixed kidney tissue from NAM-treated animals (Figure 8B), whereas uptake of dextran was substantially increased (Figure 8C). Moreover, urine analysis revealed significant decreases in the tubular injury biomarker KIM-1 and the small protein CC16, which is normally filtered by glomeruli and reabsorbed in the PT (Figure 8D).
Figure 8.
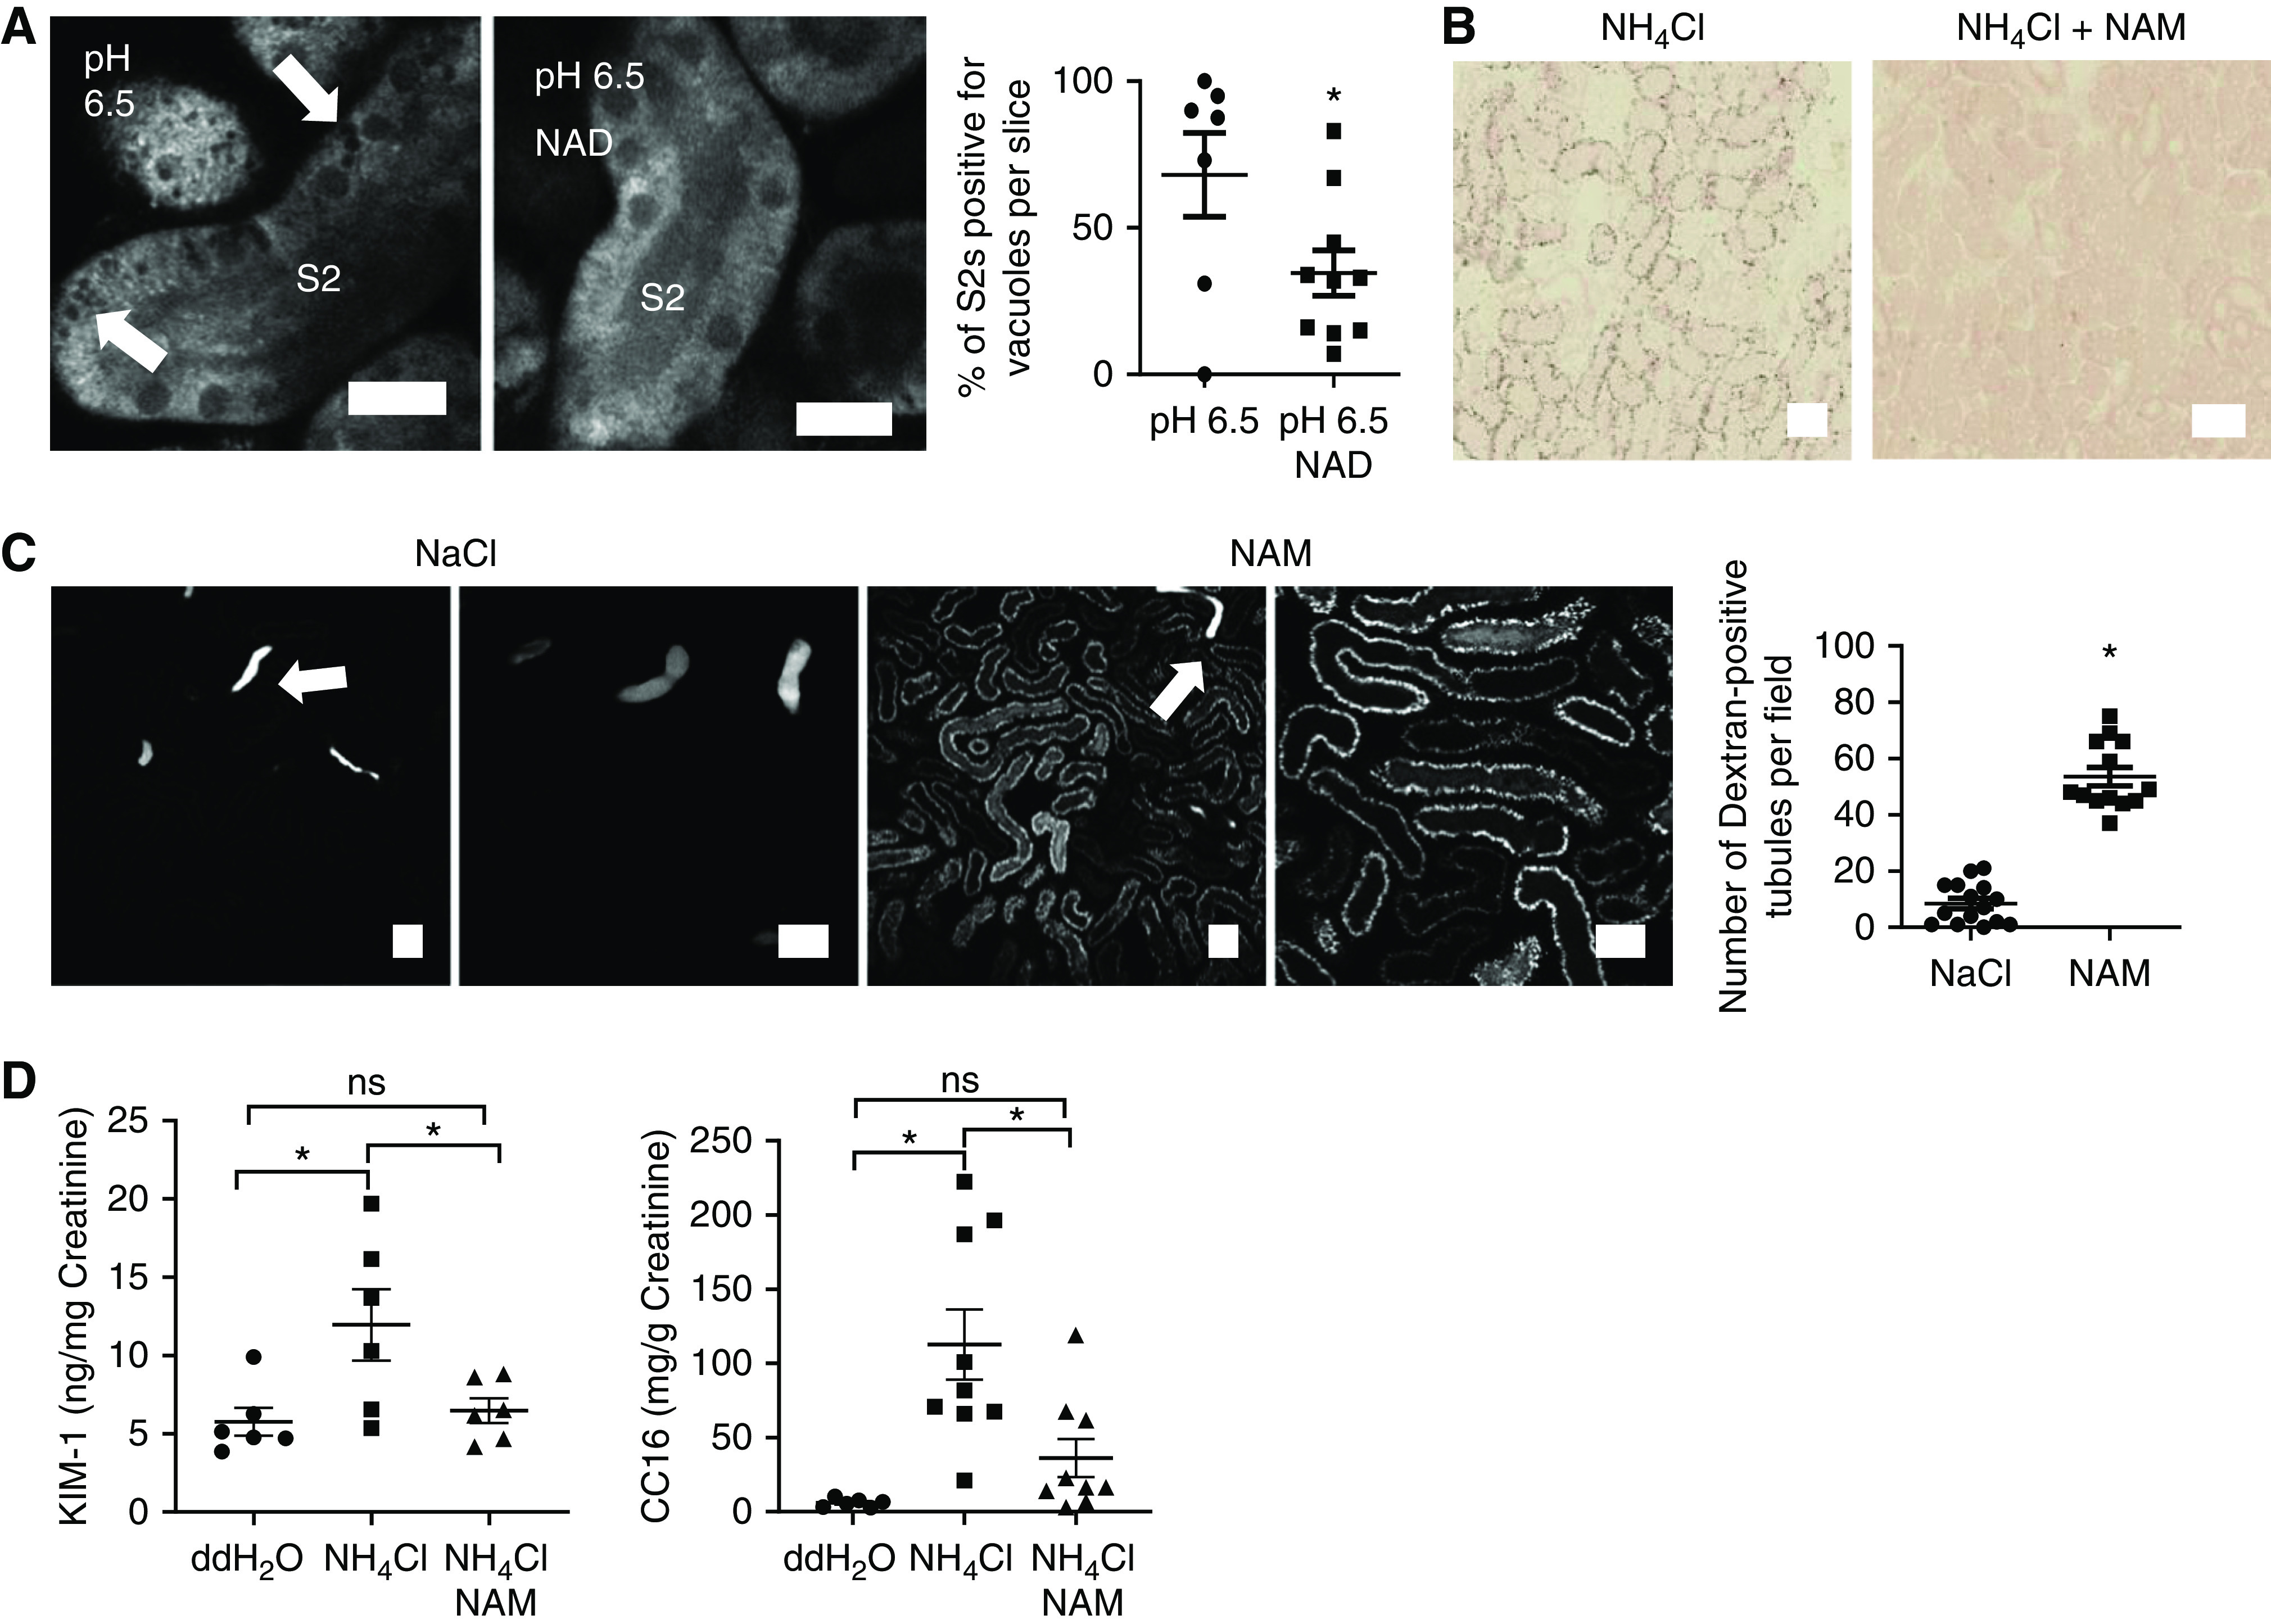
NAD supplementation is protective against acidosis-induced AKI. (A) 1 hour of incubation of kidney slices with NAD (10 mM) at pH 6.5 significantly reduced the number of S2 PTs positive for vacuoles (arrows) (n=7–10 slices from five to seven different animals). P<0.05 for pH 6.5 versus pH 6.5 NAD after unpaired t test. Scale bars = 20 µm. (B–D) NAM supplementation (400 mg/kg BW) in acid-fed mice reduced ORO-staining intensity in PTs in fixed kidney tissue (B), increased uptake of fluorescently labeled dextran (images acquired 30 minutes after injection using intravital microscopy, n=13–15 different areas from four different animals per group; P<0.01 for NaCl versus NAM after unpaired t test; luminal wasting of concentrated dextran (arrows) can be observed in distal tubules) (C), and decreased urinary content of the AKI biomarker KIM-1 (n=6 animals per group; P<0.05 for double-distilled (dd) H2O versus NH4Cl; P=0.9 for ddH2O versus NH4Cl+NAM and P<0.05 for NH4Cl versus NH4Cl+NAM after one-way ANOVA, Tukey’s multiple comparisons test) and the small protein CC16 (n=6–9 animals per group; P<0.01 for ddH2O versus NH4Cl; P=0.5 for ddH2O versus NH4Cl+NAM and P<0.05 for NH4Cl versus NH4Cl+NAM after one-way ANOVA, Tukey’s multiple comparisons test) (D). Scale bars = 50 µm.
In summary, these results further support the notion that changes in NAD metabolism are central to the pathogenesis of MA-induced AKI, and that this represents a viable target for therapeutic intervention.
Discussion
MA is a frequent finding in critically ill patients with AKI, but it was previously unclear to what extent MA can cause or potentiate AKI, and whether treatment is beneficial.29 In this study, we have provided evidence that MA is indeed directly harmful to the kidney, producing an AKI state, and that reversing pH back toward the normal physiologic range improves tubular function. Moreover, we have identified changes in NAD and lipid metabolism as being mechanistically central to the process, and that NAD supplementation is protective. These findings have potentially important implications for understanding kidney tubular physiology and cellular mechanisms of AKI.
PTs are densely packed with mitochondria, which are major targets for AKI causing insults such as ischemia, toxins, and sepsis.30,31 NAD depletion has recently emerged as a decisive event in the pathogenesis of AKI, which is amenable to intervention, including in humans.8,32,33 Our findings suggest the redox state of NAD is also important, even in the absence of changes in total NAD. Nevertheless, we also found benefit of NAD supplementation, implying the size of the NAD pool is probably a critical rate-limiting factor for aerobic metabolism in PTs.
Although fatty acids are thought to be the major fuel under normal conditions, PT mitochondria can metabolize a range of different substrates, which might compete for essential metabolic cofactors.34 In the case of ammoniagenesis, which is massively upregulated during MA, the breakdown of glutamine necessitates a supply of oxidized NAD. Indeed, older studies suggested that ammoniagenesis is dependent on aerobic respiration, and is increased by RC uncouplers,35 which push the NAD pool into a maximally oxidized state. Our imaging studies now localize NAD redox changes to PT mitochondria, and reveal they are rapid and highly dynamic, and are associated with a switch toward complex I activity, decreased lipid metabolism, and tubular injury.
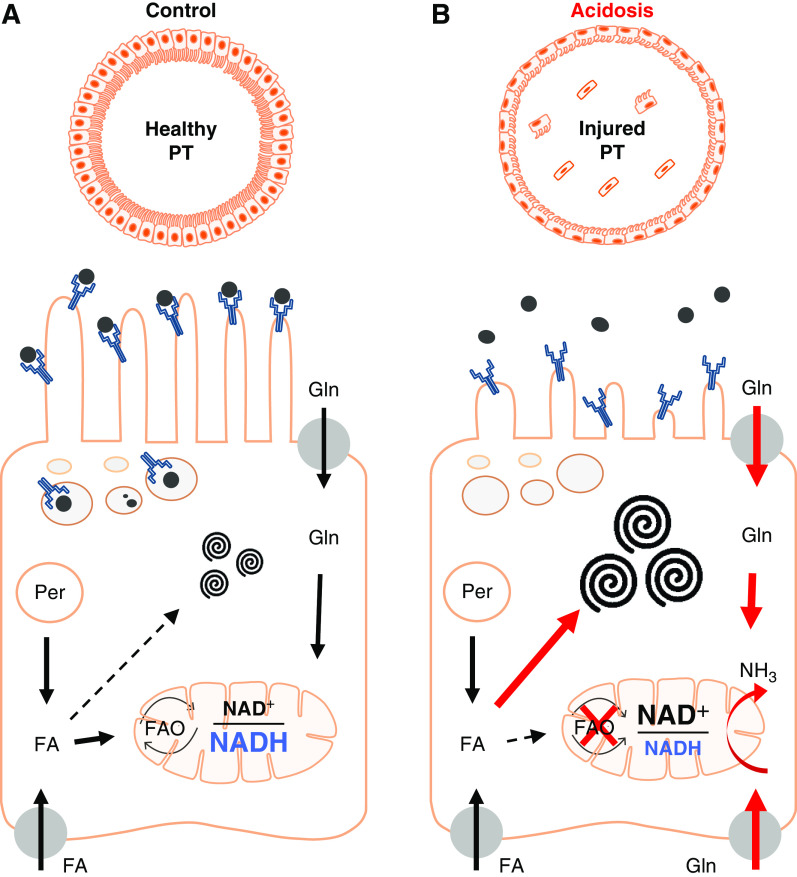
Although glutamine metabolism will also produce ATP, the yield is likely to be substantially decreased compared with beta oxidation. Thus, AKI in MA can be considered as a functional phenomenon, whereby mitochondria are actively respiring, but production of ammonia and bicarbonate is prioritized over solute transport (Figure 9). In support of this concept, mitochondria in damaged PTs during MA remained normally energized, which is a striking difference from other AKI-causing insults, such as ischemia36 and cisplatin.37 Because NAD is also required for beta oxidation (and NADP for lipid synthesis), competition from ammoniagenesis for this cofactor probably causes the major changes in lipid metabolism that occur during MA (Figure 9). Moreover, this explains why NAD supplementation or inhibiting ammoniagenesis (by pushing the NAD pool into a reduced state with lactate) both prevent lipid vacuole formation.
Figure 9.
Proposed working model of acidosis-driven AKI in the PT. (A) PT cells take up fatty acids (FAs) from the blood via basolateral organic transporters. Peroxisomes (Per) also generate FAs, which are normally metabolized in mitochondria via complex II to generate ATP. Excess FAs can be converted to phospholipids and sphingolipids, and stored in specialized MLBs. (B) In response to acidosis, uptake and metabolism of glutamine (Gln) increases dramatically to generate ammonia (NH3). Complex I activity also increases to provide oxidized NAD required for ammoniagenesis, which leads to a decrease in FA oxidation, enlargement of MLBs, and defects in solute uptake. Thus, prioritization of ammoniagenesis leads to functional AKI. Schematic image was produced using scientific illustration toolkits from Motifolio. FAO, fatty acid oxidation.
Our findings further support the notion that complex I plays a critical role in redox regulation of metabolic cofactors within mitochondria.38 Additional studies will be required to reveal how exactly acidosis induces a switch to complex I, but possible explanations include the pH sensitivity of some metabolic enzymes,39 or a decrease in reverse electron flow from complex II when lipid metabolism is downregulated.40 Because NAD(P)H is involved in a number of different mitochondrial redox reactions, it is possible that other NAD(P)H-dependent pathways might also be altered in acidosis. For example, an increase in alpha ketoglutarate production could induce reverse activity of isocitrate dehydrogenase, which would also push the NAD(P)H pool into an oxidized state.41 Moreover, under certain circumstances the stability of NADH itself can be pH dependent.42
There is an emerging consensus that MA accelerates decline in renal function in patients with CKD; however, it remains far from clear mechanistically why MA is harmful.43 Recent work has suggested CKD in general is characterized by a shift away from fatty acid metabolism in PTs, which may then trigger signaling mechanisms that drive interstitial fibrosis.10,44–46 Our results provide a potential explanation for this phenomenon, because the residual nephrons have to excrete a proportionally higher acid load, which will increase competition for NAD. Moreover, because it is thought to be a major site of reactive oxygen species production, increased RC complex I activity could lead to oxidative stress, and thus explain the induction of mitophagy47 and increased expression of antioxidant genes48 that occur in the kidney after acidosis.
Our findings could potentially also explain other previous observations in MA. For example, tubular damage could underlie acute changes in urinary solute excretion described in acid-loaded rodents and humans,49,50 which in turn might contribute to the high incidence of electrolyte and mineral disturbances in critically ill patients, such as hypophosphatemia.51 Furthermore, a decrease in NAD-dependent sirtuin activity could drive the widespread increase in protein acetylation reported in the PTs of acidotic animals.52
A previous study mentioned the appearance of vacuoles in PTs in response to MA,16 which we have now identified as MLBs. These also occur in animals fed high-fat diets26 and in gentamicin-induced AKI (phospholipidosis).53 In the case of drug toxicity, this is thought to be due to inhibition of lysosomal phospholipases, causing a decreased conversion of phospholipids to fatty acids, and a build up of the former within MLBs.54 We cannot exclude that a similar inhibition might also contribute to the lipid changes observed in acidosis, and this could be further investigated in future studies. The reasons why MLBs are localized to the S2 segment are unclear, but we note that the high density of peroxisomes and organic anion transporters in this region, implying a high level of lipid transport and metabolism. It has been postulated that MLBs might represent a storage vehicle to limit cytosolic rises in potentially harmful free fatty acids.26
Finally, from a translational standpoint, it should be considered that MA in humans is usually a secondary phenomenon, typically occurring in the context of other major metabolic disturbances, such as uncontrolled diabetes, sepsis, or tissue ischemia. Further studies will therefore be required to establish whether interventions targeted at blood pH or NAD metabolism are still of benefit for renal tubules under these conditions.
In summary, we have provided new insights into the adverse effects of MA on the kidney, the metabolic changes that underlie these, and how they might be reversed or prevented.
Disclosures
All authors have nothing to disclose.
Funding
A. Hall is supported by The Swiss National Centre for Competence in Research Kidney Control of Homeostasis and a Swiss National Science Foundation project grant (310030_184688). J. Martins is a IKPP2 fellow funded by the European Union’s Seventh Framework Programme for research, technological development, and demonstration under the grant agreement 608847.
Supplementary Material
Acknowledgments
The authors acknowledge support from The Zurich Centre for Microscopy and Image Analysis, and The Zurich Centre for Integrative Human Physiology, and would like to thank Dr. Sebastian Streb from The Functional Genomics Centre Zurich for help in performing the lipid analysis. The authors are most grateful to Svende Pfundstein for her invaluable assistance with tail-vein injections and to Nadine Nägele for performing the creatinine measurements. The authors also wish to thank the lab of Prof. Olivier Devuyst from the Institute of Physiology, University of Zurich, for kindly gifting the CC16 ELISA kit and the lab of Prof. Carsten Wagner from the Institute of Physiology, University of Zurich, for providing determination chemicals for creatinine measurements.
Dr. Milica Bugarski, Dr. Joana R. Martins, and Dr. Andrew M. Hall designed the study; Dr. Milica Bugarski, Dr. Susan Ghazi, Mr. Marcello Polesel, and Dr. Joana R. Martins performed the experiments and analyzed the data; Dr. Andrew M. Hall wrote the manuscript; and all authors read and commented on various drafts of the manuscript.
Footnotes
Published online ahead of print. Publication date available at www.jasn.org.
Supplemental Material
This article contains the following supplemental material online at http://jasn.asnjournals.org/lookup/suppl/doi:10.1681/ASN.2020071003/-/DCSupplemental.
Supplemental Figure 1. Effect of pH on NADH fluorescence.
Supplemental Figure 2. Identification of proximal tubule segments in kidney slices.
Supplemental Figure 3. Acidosis induces the appearance of vacuoles in S2 segments of the proximal tubule.
Supplemental Figure 4. Lipidomic analysis (LC-MS) of kidney cortex from mice subjected to water or acid gavage.
Supplemental Figure 5. Acidosis-induced damage in proximal tubules.
Supplemental Figure 6. Supplementation with NAD induces an acute increase in proximal tubular NAD(P)H signal in kidney slices.
References
- 1.Jung B, Rimmele T, Le Goff C, Chanques G, Corne P, Jonquet O, et al.; AzuRea Group: Severe metabolic or mixed acidemia on intensive care unit admission: Incidence, prognosis and administration of buffer therapy. A prospective, multiple-center study. Crit Care 15: R238, 2011 [DOI] [PMC free article] [PubMed] [Google Scholar]
- 2.Jaber S, Paugam C, Futier E, Lefrant JY, Lasocki S, Lescot T, et al.; BICAR-ICU Study Group: Sodium bicarbonate therapy for patients with severe metabolic acidaemia in the intensive care unit (BICAR-ICU): A multicentre, open-label, randomised controlled, phase 3 trial [published correction appears in Lancet 392: 2440, 2018 10.1016/S0140-6736(18)33040-X]. Lancet 392: 31–40, 2018 [DOI] [PubMed] [Google Scholar]
- 3.Navaneethan SD, Shao J, Buysse J, Bushinsky DA: Effects of treatment of metabolic acidosis in CKD: A systematic review and meta-analysis. Clin J Am Soc Nephrol 14: 1011–1020, 2019 [DOI] [PMC free article] [PubMed] [Google Scholar]
- 4.Goraya N, Wesson DE: Clinical evidence that treatment of metabolic acidosis slows the progression of chronic kidney disease. Curr Opin Nephrol Hypertens 28: 267–277, 2019 [DOI] [PMC free article] [PubMed] [Google Scholar]
- 5.Nowik M, Lecca MR, Velic A, Rehrauer H, Brändli AW, Wagner CA: Genome-wide gene expression profiling reveals renal genes regulated during metabolic acidosis. Physiol Genomics 32: 322–334, 2008 [DOI] [PubMed] [Google Scholar]
- 6.Preuss HG: Pyridine nucleotides in renal ammonia metabolism. J Lab Clin Med 72: 370–382, 1968 [PubMed] [Google Scholar]
- 7.Preuss HG: Renal glutamate metabolism in acute metabolic acidosis. Nephron 6: 235–246, 1969 [DOI] [PubMed] [Google Scholar]
- 8.Ralto KM, Rhee EP, Parikh SM: NAD+ homeostasis in renal health and disease. Nat Rev Nephrol 16: 99–111, 2020 [DOI] [PMC free article] [PubMed] [Google Scholar]
- 9.Tran MT, Zsengeller ZK, Berg AH, Khankin EV, Bhasin MK, Kim W, et al.: PGC1α drives NAD biosynthesis linking oxidative metabolism to renal protection. Nature 531: 528–532, 2016 [DOI] [PMC free article] [PubMed] [Google Scholar]
- 10.Kang HM, Ahn SH, Choi P, Ko YA, Han SH, Chinga F, et al.: Defective fatty acid oxidation in renal tubular epithelial cells has a key role in kidney fibrosis development. Nat Med 21: 37–46, 2015 [DOI] [PMC free article] [PubMed] [Google Scholar]
- 11.Matthys E, Patel Y, Kreisberg J, Stewart JH, Venkatachalam M: Lipid alterations induced by renal ischemia: Pathogenic factor in membrane damage. Kidney Int 26: 153–161, 1984 [DOI] [PubMed] [Google Scholar]
- 12.Feldkamp T, Kribben A, Roeser NF, Senter RA, Weinberg JM: Accumulation of nonesterified fatty acids causes the sustained energetic deficit in kidney proximal tubules after hypoxia-reoxygenation. Am. J. Physiol Renal Physiol 290: F465–F477, 2006 [DOI] [PubMed] [Google Scholar]
- 13.Li S, Nagothu KK, Desai V, Lee T, Branham W, Moland C, et al.: Transgenic expression of proximal tubule peroxisome proliferator-activated receptor-α in mice confers protection during acute kidney injury. Kidney Int 76: 1049–1062, 2009 [DOI] [PMC free article] [PubMed] [Google Scholar]
- 14.Chiba T, Peasley KD, Cargill KR, Maringer KV, Bharathi SS, Mukherjee E, et al.: Sirtuin 5 regulates proximal tubule fatty acid oxidation to protect against AKI. J Am Soc Nephrol 30: 2384–2398, 2019 [DOI] [PMC free article] [PubMed] [Google Scholar]
- 15.Bugarski M, Martins JR, Haenni D, Hall AM: Multiphoton imaging reveals axial differences in metabolic autofluorescence signals along the kidney proximal tubule. Am J Physiol Renal Physiol 315: F1613–F1625, 2018 [DOI] [PMC free article] [PubMed] [Google Scholar]
- 16.Sorrell SL, Golder ZJ, Johnstone DB, Frankl FEK: Renal peroxiredoxin 6 interacts with anion exchanger 1 and plays a novel role in pH homeostasis. Kidney Int 89: 105–112, 2016 [DOI] [PMC free article] [PubMed] [Google Scholar]
- 17.Schuh CD, Haenni D, Craigie E, Ziegler U, Weber B, Devuyst O, et al.: Long wavelength multiphoton excitation is advantageous for intravital kidney imaging. Kidney Int 89: 712–719, 2016 [DOI] [PubMed] [Google Scholar]
- 18.Mayrhofer JM, Haiss F, Haenni D, Weber S, Zuend M, Barrett MJP, et al.: Design and performance of an ultra-flexible two-photon microscope for in vivo research. Biomed Opt Express 6: 4228–4237, 2015 [DOI] [PMC free article] [PubMed] [Google Scholar]
- 19.Schindelin J, Arganda-Carreras I, Frise E, Kaynig V, Longair M, Pietzsch T, et al.: Fiji: An open-source platform for biological-image analysis. Nat Methods 9: 676–682, 2012 [DOI] [PMC free article] [PubMed] [Google Scholar]
- 20.Mayevsky A, Chance B: Oxidation-reduction states of NADH in vivo: From animals to clinical use. Mitochondrion 7: 330–339, 2007 [DOI] [PubMed] [Google Scholar]
- 21.Kwong LK, Sohal RS: Age-related changes in activities of mitochondrial electron transport complexes in various tissues of the mouse. Arch Biochem Biophys 373: 16–22, 2000 [DOI] [PubMed] [Google Scholar]
- 22.Benard G, Faustin B, Passerieux E, Galinier A, Rocher C, Bellance N, et al.: Physiological diversity of mitochondrial oxidative phosphorylation. Am J Physiol Cell Physiol 291: C1172–C1182, 2006 [DOI] [PubMed] [Google Scholar]
- 23.Johnson DT, Harris RA, Blair PV, Balaban RS: Functional consequences of mitochondrial proteome heterogeneity. Am J Physiol Cell Physiol 292: C698–C707, 2007 [DOI] [PubMed] [Google Scholar]
- 24.Kalakeche R, Hato T, Rhodes G, Dunn KW, El-Achkar TM, Plotkin Z, et al.: Endotoxin uptake by S1 proximal tubular segment causes oxidative stress in the downstream S2 segment. J Am Soc Nephrol 22: 1505–1516, 2011 [DOI] [PMC free article] [PubMed] [Google Scholar]
- 25.Schuh CD, Polesel M, Platonova E, Haenni D, Gassama A, Tokonami N, et al.: Combined structural and functional imaging of the kidney reveals major axial differences in proximal tubule endocytosis. J Am Soc Nephrol 29: 2696–2712, 2018 [DOI] [PMC free article] [PubMed] [Google Scholar]
- 26.Rampanelli E, Ochodnicky P, Vissers JPC, Butter LM, Claessen N, Calcagni A, et al.: Excessive dietary lipid intake provokes an acquired form of lysosomal lipid storage disease in the kidney. J Pathol 246: 470–484, 2018 [DOI] [PubMed] [Google Scholar]
- 27.Bonventre JV, Yang L: Cellular pathophysiology of ischemic acute kidney injury. J Clin Invest 121: 4210–4221, 2011 [DOI] [PMC free article] [PubMed] [Google Scholar]
- 28.Dickson LE, Wagner MC, Sandoval RM, Molitoris BA: The proximal tubule and albuminuria: Really! J Am Soc Nephrol 25: 443–453, 2014 [DOI] [PMC free article] [PubMed] [Google Scholar]
- 29.Kraut JA, Madias NE: Metabolic acidosis: Pathophysiology, diagnosis and management. Nat Rev Nephrol 6: 274–285, 2010 [DOI] [PubMed] [Google Scholar]
- 30.Bhargava P, Schnellmann RG: Mitochondrial energetics in the kidney. Nat Rev Nephrol 13: 629–646, 2017 [DOI] [PMC free article] [PubMed] [Google Scholar]
- 31.Clark AJ, Parikh SM: Mitochondrial metabolism in acute kidney injury. Semin Nephrol 40: 101–113, 2020 [DOI] [PMC free article] [PubMed] [Google Scholar]
- 32.Katsyuba E, Mottis A, Zietak M, De Franco F, van der Velpen V, Gariani K, et al.: De novo NAD+ synthesis enhances mitochondrial function and improves health. Nature 563: 354–359, 2018 [DOI] [PMC free article] [PubMed] [Google Scholar]
- 33.Poyan Mehr A, Tran MT, Ralto KM, Leaf DE, Washco V, Messmer J, et al.: De novo NAD+ biosynthetic impairment in acute kidney injury in humans. Nat Med 24: 1351–1359, 2018 [DOI] [PMC free article] [PubMed] [Google Scholar]
- 34.Preuss HG, Weiss FR: Rate-limiting factor in rat kidney slice ammoniagenesis. Am J Physiol 221: 458–464, 1971 [DOI] [PubMed] [Google Scholar]
- 35.Preuss HG, Baird K, Goldin H: Oxygen consumption and ammoniagenesis in isolated dog renal tubules. J Lab Clin Med 83: 937–946, 1974 [PubMed] [Google Scholar]
- 36.Hall AM, Rhodes GJ, Sandoval RM, Corridon PR, Molitoris BA: In vivo multiphoton imaging of mitochondrial structure and function during acute kidney injury. Kidney Int 83: 72–83, 2013 [DOI] [PMC free article] [PubMed] [Google Scholar]
- 37.Martins J, Haenni D, Bugarski M, Figurek A, Hall AM: Quantitative intravital calcium imaging maps single cell behavior to kidney tubular structure. Am J Physiol Renal Physiol 319: F245–F255, 2020 [DOI] [PubMed] [Google Scholar]
- 38.To TL, Cuadros AM, Shah H, Hung WHW, Li Y, Kim SH, et al.: A compendium of genetic modifiers of mitochondrial dysfunction reveals intra-organelle buffering. Cell 179: 1222–1238.e17, 2019 [DOI] [PMC free article] [PubMed] [Google Scholar]
- 39.Nadtochiy SM, Schafer X, Fu D, Nehrke K, Munger J, Brookes PS: Acidic pH is a metabolic switch for 2-Hydroxyglutarate generation and signaling. J Biol Chem 291: 20188–20197, 2016 [DOI] [PMC free article] [PubMed] [Google Scholar]
- 40.Chouchani ET, Pell VR, Gaude E, Aksentijević D, Sundier SY, Robb EL, et al.: Ischaemic accumulation of succinate controls reperfusion injury through mitochondrial ROS. Nature 515: 431–435, 2014 [DOI] [PMC free article] [PubMed] [Google Scholar]
- 41.Mullen AR, Wheaton WW, Jin ES, Chen PH, Sullivan LB, Cheng T, et al.: Reductive carboxylation supports growth in tumour cells with defective mitochondria. Nature 481: 385–388, 2011 [DOI] [PMC free article] [PubMed] [Google Scholar]
- 42.Rover Júnior L, Fernandes JCB, de Oliveira Neto G, Kubota LT, Katekawa E, Serrano SHP: Study of NADH stability using ultraviolet-visible spectrophotometric analysis and factorial design. Anal Biochem 260: 50–55, 1998 [DOI] [PubMed] [Google Scholar]
- 43.Wesson DE, Buysse JM, Bushinsky DA: Mechanisms of metabolic acidosis–induced kidney injury in chronic kidney disease. J Am Soc Nephrol 31: 469–482, 2020 [DOI] [PMC free article] [PubMed] [Google Scholar]
- 44.Chen W, Zhang Q, Cheng S, Huang J, Diao G, Han J: Atgl gene deletion predisposes to proximal tubule damage by impairing the fatty acid metabolism. Biochem Biophys Res Commun 487: 160–166, 2017 [DOI] [PubMed] [Google Scholar]
- 45.Jao TM, Nangaku M, Wu CH, Sugahara M, Saito H, Maekawa H, et al.: ATF6α downregulation of PPARα promotes lipotoxicity-induced tubulointerstitial fibrosis. Kidney Int 95: 577–589, 2019 [DOI] [PubMed] [Google Scholar]
- 46.Kruger C, Nguyen TT, Breaux C, Guillory A, Mangelli M, Fridianto KT, et al.: Proximal tubular cell–specific ablation of carnitine acetyltransferase causes tubular disease and secondary glomerulosclerosis. Diabetes 68: 819–831, 2019 [DOI] [PMC free article] [PubMed] [Google Scholar]
- 47.Namba T, Takabatake Y, Kimura T, Takahashi A, Yamamoto T, Matsuda J, et al.: Autophagic clearance of mitochondria in the kidney copes with metabolic acidosis. J Am Soc Nephrol 25: 2254–2266, 2014 [DOI] [PMC free article] [PubMed] [Google Scholar]
- 48.Lister A, Bourgeois S, Imenez Silva PH, Rubio-Aliaga I, Marbet P, Walsh J, et al.: NRF2 regulates the glutamine transporter Slc38a3 (SNAT3) in kidney in response to metabolic acidosis. Sci Rep 8: 5629, 2018 [DOI] [PMC free article] [PubMed] [Google Scholar]
- 49.Throssell D, Harris KPG, Bevington A, Furness PN, Howie AJ, Walls J: Renal effects of metabolic acidosis in the normal rat. Nephron 73: 450–455, 1996 [DOI] [PubMed] [Google Scholar]
- 50.Krapf R, Vetsch R, Vetsch W, Hulter HN: Chronic metabolic acidosis increases the serum concentration of 1,25-dihydroxyvitamin D in humans by stimulating its production rate. Critical role of acidosis-induced renal hypophosphatemia. J Clin Invest 90: 2456–2463, 1992 [DOI] [PMC free article] [PubMed] [Google Scholar]
- 51.Suzuki S, Egi M, Schneider AG, Bellomo R, Hart GK, Hegarty C: Hypophosphatemia in critically ill patients. J Crit Care 28: 536.e9–536.e19, 2013 [DOI] [PubMed] [Google Scholar]
- 52.Freund DM, Prenni JE, Curthoys NP: Response of the mitochondrial proteome of rat renal proximal convoluted tubules to chronic metabolic acidosis. Am J Physiol Renal Physiol 304: F145–F155, 2013 [DOI] [PMC free article] [PubMed] [Google Scholar]
- 53.Giuliano RA, Paulus GJ, Verpooten GA, Pattyn VM, Pollet DE, Nouwen EJ, et al.: Recovery of cortical phospholipidosis and necrosis after acute gentamicin loading in rats. Kidney Int 26: 838–847, 1984 [DOI] [PubMed] [Google Scholar]
- 54.Anderson N, Borlak J: Drug-induced phospholipidosis. FEBS Lett 580: 5533–5540, 2006 [DOI] [PubMed] [Google Scholar]
Associated Data
This section collects any data citations, data availability statements, or supplementary materials included in this article.


