

INTRODUCTION
By 2030, the proportion of adults older than 65 years is expected to exceed 20% in the United States.1 With this aging population, an increasing number of older adults will undergo surgical procedures.2 Although older adults represent 40% of all inpatient operations, they account for more than 60% of all postoperative deaths and a similarly disproportionate share of postoperative complications due to decreased functional reserve and therefore reduced capacity to recover from postoperative complications.3,4 The unique challenges older adults face when considering surgery has led to the American College of Surgeons Geriatric Surgery Verification Program, which established standards aimed at improving surgical care and outcomes among this vulnerable population.5
However, this initiative is informed by few studies examining the extent to which undergoing surgery impacts lasting functional and cognitive outcomes.6,7 Further, no prior studies evaluate whether complications after surgery impact the trajectory of these outcomes. Although prior studies demonstrate that at least 10% of patients 65 years and older require discharge to skilled nursing facilities following major surgery, this measure is a crude characterization of functional and cognitive disability.8–10 Rudimentary measures such as discharge destination do not optimally inform patients making complex decisions around surgery. Moreover, in patients who experience functional and cognitive declines after surgery, the impact on long-term abilities and survival have not been studied beyond 12 months.7,11–13 Finally, even less is known about the impact on overall cost and healthcare utilization as a result of such limitations after surgery.
In this context, we sought to evaluate the longitudinal effects of high-risk surgery and serious complications on function, cognition and survival among older adults. Further, we aimed to evaluate the economic impact of functional and cognitive decline in such patients. We hypothesized that surgery and complications would significantly worsen function and cognition, and such disabilities would be associated with worse survival and increased health care utilization.
METHODS
Data Source
Health and Retirement Study (HRS) Survey Data:
The HRS is an ongoing longitudinal study, which represents a cohort of community-dwelling U.S. residents > 50 years old. Since 1992, more than 43,000 individuals have participated in biennial interviews with a follow-up rate greater than 90%. The HRS uses multistage probability sample to identify participants, and is broadly representative of the older U.S. population with regard to sociodemographics. Detailed information about sociodemographics, family, wealth and income, and health status are provided by the respondents.14
HRS-Linked Medicare Claims:
Greater than 85% of Medicare-eligible HRS respondents (patients ≥ 65 years old) consent to linkage of their administrative Medicare claims to their survey. We used data from the Centers for Medicare and Medicaid services Master Beneficiary Summary, Part B Carrier, Medicare Provider Analysis and Review (MedPAR), hospice cost report, inpatient, and outpatient files. Patient-level data include age, sex, race/ethnicity, comorbidities (principal and secondary diagnosis codes), procedural codes, 30-day morbidity and mortality, and information on length of stay.
National Death Index (NDI):
The NDI is one of the most frequently used source of data for mortality in the U.S. Funded by the Centers for Disease Control.15
Patient Population
Our study sample included surgical patients who satisfied the following criteria: (1) have claims-based data on 1 of 163 elective operations defined as high-risk (i.e., inpatient mortality of at least 1%) for patients ≥ 65 years using the International Classification of Diseases, Ninth Revision, Clinical Modification (ICD-9) codes16; (2) have at least one survey conducted through HRS prior to the elective operation (baseline survey); and (3) have at least one survey conducted through HRS after the elective operation (follow-up survey).
Our study sample also included patients who did not undergo surgery (i.e., nonsurgical patients) selected as controls for the surgical patients. For each surgical patient included in our study sample, we selected three controls: HRS respondents who did not undergo major surgery and were matched on their propensity to receive surgery.
Major complications occurring within 30-days after the index operation are identified in the Medicare-linked data by ICD-9 codes for the following categories: pulmonary failure, pneumonia, myocardial infarction, deep venous thrombosis/pulmonary embolism, renal failure, surgical site infection, gastrointestinal bleeding, and hemorrhage.17
Frailty was determined by a claims-based frailty index (CFI) described by Kim et al. using the Medicare-linked data.18
Measures
Functional status using HRS data was determined by the sum of Activities of Daily Living (ADLs: walking, dressing, bathing, eating, getting into and out of bed, and toileting) and Instrumental Activities of Daily Living (IADLs: preparing hot meals, grocery shopping, making telephone calls, taking medicines, and managing money) needing assistance. Functional classes were defined as 0 = no limitations; 1–3 = mild to moderate limitations; and ≥ 4 = severe limitations.19
Cognitive status using HRS data was determined by a 27-point scale administered at the time of the interview, a modified version of the Telephone Interview for Cognitive Status (TICS) includes: 1) immediate and delayed 10-word recall test; 2) serial 7 subtractions; 3) backward counting; and 4) naming and orientation. Cognitive Classes were defined as ≥ 11 = normal; 7–11 = mild cognitive impairment; and 0–6 = severe cognitive impairment. For patients who were unable to be interviewed, proxies were interviewed using a validated Informant Questionnaire on Cognitive Decline in the Elderly, which were defined as “excellent,” “very good” or “good” = mild cognitive impairment and “fair” or “poor” = severe cognitive impairment.19–21
Functional and Cognitive Decline was defined as a worsened functional or cognitive state from baseline to follow-up survey. Patients whose status remained the same or improved were considered to have no decline.
Healthcare utilization was defined as daily healthcare spending, use of health services, and days spent as an inpatient, in the intensive care unit (ICU) or at a skilled nursing facility (SNF). In order to determine daily healthcare spending (excluding prescription medications) in the year following index operation, we used the date of operation as defined by procedure codes from Medicare claims. Utilization for nonsurgical patients was measured starting on the discharge day of their matched surgical patient for a period of one year. Using established methods that account for variation in Medicare reimbursement, we then price-standardized healthcare spending.22 We identified health services use including the number of outpatient visits to primary care physicians, specialists, and emergency departments, identified in the Part B Carrier and outpatient files.23 To identify the total number of days spent as an inpatient, in an ICU, at a SNF, or “days at home,” we used data from MedPar files.
Time to death was measured as time from the follow-up survey to date of death for surgical patients and their controls. Surgical patients who died before their first follow-up surgery could not be evaluated for functional and cognitive decline, and were therefore excluded from this analysis.
Statistical Analysis
After identifying the surgical cohort, we selected three nonsurgical patients as controls for each surgical patient. These controls were selected based on how similar their propensities to undergo surgery to their surgical counterparts at the time of surgery. The propensity score was derived from a logistic regression modeling the likelihood of receiving surgery or not, as a function of sex, race, age, education, marital status, comorbidities, baseline functional and cognitive statuses, and year of survey. We then examined the balance of each covariate between matched surgical patients and their nonsurgical controls using chi-square tests for categorical variables and t tests for continuous variables. The matching was done using greedy matching techniques with more details available by Parsons.24
We first compared the covariate distributions between patients with complications and those without complications using either chi-square test or t tests among surgical patients. We then evaluated how surgery and complications were associated with patients’ functional and cognitive declines using proportions and logistic regressions. We adjusted for the following covariates that have been shown previously to correlate with functional and cognitive declines in our models: sociodemographic factors (age, sex, race/ethnicity, educational attainment, household net worth); co-existing chronic conditions (high blood pressure, heart disease, diabetes, cancer, cognitive impairment, stroke, lung disease, arthritis); and health events (hospitalizations or falls within the last two years),25 as well as baseline functional and cognitive status, frailty, time between surgery and surveys (both pre- and post-surgery), and date of operation. We then examined the proportion of patients with specific functional and cognitive limitations among individual ADLs and IADLs at baseline and follow-up among patients who experienced decline.
Next, using Cox proportional hazards regression, we examined the association between surgery and surgical complications and time-to-death, while adjusting for potential confounders for both surgical patients and their nonsurgical controls. We evaluated the proportional hazards assumptions and incorporated time and age interaction and calculated the covariate-adjusted average survival probabilities for each group. Lastly, we compared the mean of healthcare utilizations and “days at home” between patients who experienced functional or cognitive declines and those who did not using ordinary least squares regression. All analyses were performed in SAS (SAS Institute Inc., Cary, NC, Version 9.4). The University of Michigan Institutional Review Board deemed this study as exempt (HUM00157651).
RESULTS
From 21,588 HRS participants ≥ 65 years with Medicare linkage between 1992–2012, we identified 1,197 patients who underwent at least one elective high-risk surgery and had at least one follow-up survey. Of these, 696 patients did not experience a complication (i.e., surgery without complication cohort) and 501 patients did (i.e., surgery with complication cohort). Three-to-one propensity matching yielded a total of 3,591 controls who did not have surgery (i.e., nonsurgical cohort). Nonsurgical control patients were matched to surgical patients (Supplement 1). After matching, there were no significant differences in demographics, socioeconomic characteristics, and baseline functional and cognitive statuses between the surgical patients and their nonsurgical controls (Table 1). Mean interval between baseline survey and surgery was 12.5 (standard deviation (SD) 7.0) months, and between surgery and follow-up survey was 12.3 (SD 6.4) months. Mean follow-up for the entire (surgical and nonsurgical) cohort was 6.9 (SD 4.1) years.
Table 1.
Baseline Characteristics for Matched Patients Undergoing Surgery with No Surgery (n = 4,788)
| No Surgery1 N = 3,591 |
Surgery N = 1,197 |
P value2 | Surgery Without Complication N = 696 |
Surgery With Complication N = 501 |
P value3 | |
|---|---|---|---|---|---|---|
| Age at Index Operation, mean (SD), years | 74.8 (6.6) | 74.8 (6.3) | 0.7 | 74.6 (6.3) | 75.0 (6.4) | 0.26 |
| Male, N (%) | 1655 (46) | 545 (46) | 0.74 | 333 (48) | 212 (42) | 0.06 |
| Race, N (%) | 0.78 | 0.86 | ||||
| • White | 3205 (89) | 1061 (89) | 614 (88) | 447 (89) | ||
| • Black | 315 (9) | 109 (9) | 66 (9) | 43 (9) | ||
| • Other | 71 (2) | 27 (2) | 16 (2) | 11 (2) | ||
| Marital Status | 0.90 | 0.68 | ||||
| • Married | 2332 (65) | 775 (65) | 454 (65) | 321 (64) | ||
| • Not Married | 1259 (35) | 422 (35) | 242 (35) | 180 (36) | ||
| Highest Level of Education | 0.57 | 0.68 | ||||
| • < High School | 877 (24) | 309 (26) | 173 (25) | 136 (27) | ||
| • High School | 1970 (55) | 633 (53) | 372 (53) | 261 (52) | ||
| • Undergraduate | 445 (12) | 159 (13) | 91 (13) | 68 (14) | ||
| • Graduate | 299 (8) | 96 (8) | 60 (9) | 36 (7) | ||
| Elixhauser Comorbidity Score, mean (SD) | 0.45 (1.06) | 0.48 (1.14) | 0.46 | 0.45 (1.09) | 0.52 (1.21) | 0.36 |
| Baseline Functional Class, N (%)4 | 0.27 | 0.006 | ||||
| • No Impairment | 556 (71) | 825 (69) | 505 (74) | 320 (64) | ||
| • Mild to Moderate | 771 (21) | 271 (23) | 142 (21) | 132 (26) | ||
| • Severe | 264 (7) | 101 (8) | 38 (6) | 49 (10) | ||
| Baseline Cognitive Class, N (%)5 | 0.33 | 0.26 | ||||
| • No Impairment | 2650 (74) | 867 (72) | 516 (74) | 351 (70) | ||
| • Mild | 703 (20) | 257 (21) | 142 (20) | 115 (23) | ||
| • Moderate to Severe | 238 (7) | 73 (6) | 38 (5) | 35 (7) | ||
| Surgery Type | < 0.001 | |||||
| • Cardiothoracic | 543 (45) | 269 (37) | 274 (55) | |||
| • Intraabdominal (incl. gastrointestinal, hernia repair, gynecologic) | 421 (35) | 280 (38) | 141 (28) | |||
| • Peripheral Vascular | 168 (14) | 105 (15) | 63 (13) | |||
| • Other (incl. Neurological and Otolaryngological) | 65 (5) | 42 (6) | 23 (5) | |||
| Length of Stay, days, mean (SD) | 9.5 (7.7) | 6.7 (6) | 12.0 (9) | < 0.001 | ||
| Required Mechanical Ventilation, N (%) | 14 (1) | 3 (0) | 11 (2) | 0.005 | ||
| Intensive Care Unit Stay, N (%) | 725 (61) | 358 (51) | 367 (73) | < 0.001 | ||
| Required Dialysis, N (%) | 16 (1) | 8 (1) | 8 (2) | 0.51 |
No Surgery patients were matched with their surgical counterparts by their propensities to undergo surgery. Propensity scores are derived from logistic regression of receiving surgery based on patient demographics, comorbidities, baseline functional class and baseline cognitive class, and year of survey. No statistically significant differences between matched surgical and non-surgical groups were found.
P value comparing surgical patients to their nonsurgical controls.
P value comparing surgery without complication to surgery with complication.
Functional Class determined by sum of ADLs (walking, dressing, bathing, eating, getting out of bed, and toileting) and IADLs (preparing a hot meal, shopping for groceries, making telephone calls, taking medicines, and managing money); 0 = no limitations; 1–3 = mild to moderate; ≥ 4 = severe.
Cognitive Class determined by a 27-point self-administered test; ≥ 11 = normal; 7–11 = mild cognitive impairment; 0–6 = severe.
In the surgery without complication cohort, mean age was 74.6 (SD 6.3) years, 333 (48%) were male, 614 (88%) White, 505 (74%) had no functional limitations and 516 (74%) had no cognitive impairments at baseline. In the surgery with complication cohort, mean age was 75.0 (SD 6.4) years, 212 (42%) were male, 447 (89%) White, 320 (64%) had no functional limitations and 351 (70%) had no cognitive impairments at baseline. Of the entire cohort, 18.4% of patients experienced functional decline and 17.0% experienced cognitive decline. As shown in Figure 1, both types of decline varied significantly by surgery and complication status (p < 0.001): the rate of functional decline was 16.5% in nonsurgical controls, 22.4% in the surgery without complication group, and 26.4% among the surgery with complication group. With regard to cognitive decline, the rate for nonsurgical controls was 15.8%, 20.2% in the surgery without complication group, and 21.0% in the surgery with complication group.
Figure 1. Unadjusted Rates of Functional and Cognitive Decline By Surgery and Complications.
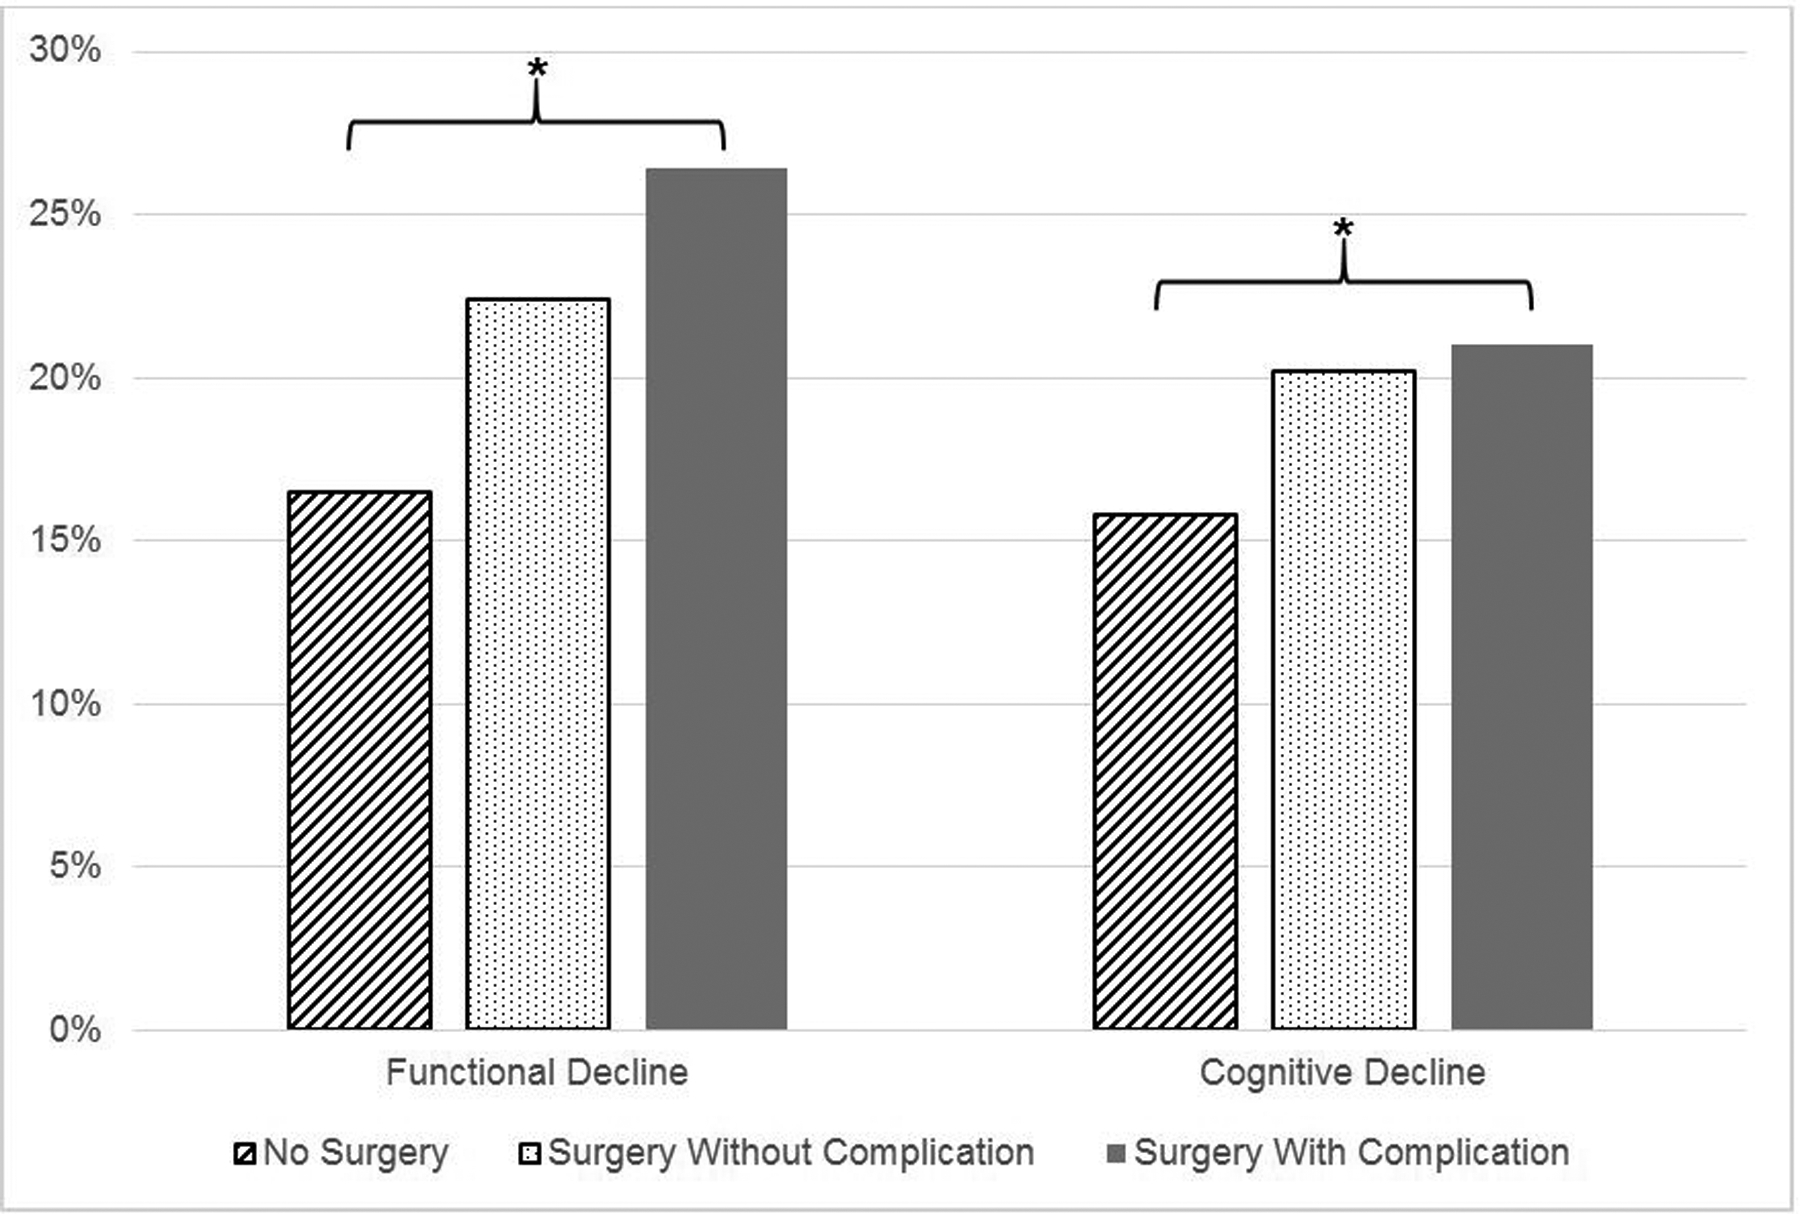
*Indicates statistical significance (p < 0.001)
Surgery without and with complication were both significantly associated with functional decline (Adjusted Odds Ratio (aOR) 1.52, 95% Confidence Interval (CI): 1.23–1.87 and aOR 1.90, 95% CI: 1.49–2.41 respectively). In addition, increasing age (aOR 1.07, 95% CI: 1.06–1.09), increasing number of comorbid conditions (aOR 1.21, 95% CI: 1.11–1.31), and mild and moderate-severe baseline cognitive statuses (aOR 1.81, 95% CI: 1.45–2.26 and aOR 3.09, 95% CI: 2.07–4.60) were significantly associated with functional decline. Married status and educational attainment greater than high school were significantly less likely to experience functional decline than their counterparts (Table 2).
Table 2.
Predictors of Functional and Cognitive Decline (n = 4,788)
| Functional Decline | Cognitive Decline | |||||
|---|---|---|---|---|---|---|
| Surgery | aOR | 95% CI | * | aOR | 95% CI | * |
| No Surgery | ref | ref | ||||
| Surgery w/o Complication | 1.52 | (1.23–1.87) | 1.32 | (1.03–1.71) | ||
| Surgery w/Complications | 1.90 | (1.49–2.41) | 1.42 | (1.15–1.76) | ||
| Female Sex | 1.21 | (0.98–1.49) | 1.11 | (0.91–1.36) | ||
| Race | * | * | ||||
| White | ref | ref | ||||
| Black | 0.99 | (0.72–1.39) | 2.00 | (1.45–2.77) | ||
| Other | 0.31 | (0.15–0.65) | 1.99 | (1.13–3.53) | ||
| Age (years) | 1.07 | (1.06–1.09) | * | 1.07 | (1.05–1.09) | * |
| Comorbidities (Elixhauser CI) | 1.21 | (1.11–1.31) | * | 1.08 | (1.00–1.17) | * |
| Married Status | 0.68 | (0.55–0.84) | * | 1.03 | (0.82–1.27) | |
| Education | * | * | ||||
| Less than High School | ref | ref | ||||
| High School | 0.73 | (0.59–0.91) | 0.63 | (0.51–0.78) | ||
| Undergraduate | 0.71 | (0.52–0.98) | 0.32 | (0.22–0.46) | ||
| Graduate | 0.52 | (0.35–0.79) | 0.23 | (0.14–0.38) | ||
| Year of Survey | 1.01 | (0.99–1.03) | 0.99 | (0.97–1.01) | ||
| Baseline Functional Class1 | * | * | ||||
| None | ref | ref | ||||
| Mild to Moderate | 0.65 | (0.52–0.82) | 1.59 | (1.29–1.98) | ||
| Severe | - | - | 2.48 | (1.69–3.65) | ||
| Baseline Cognitive Class2 | * | * | ||||
| None | ref | ref | ||||
| Mild | 1.81 | (1.45–2.26) | 0.57 | (0.44–0.72) | ||
| Moderate to Severe | 3.09 | (2.07–4.60) | - | - | ||
Indicates statistical significance (p < 0.05)
Functional Class determined by sum of ADLs (walking, dressing, bathing, eating, getting out of bed, and toileting) and IADLs (preparing a hot meal, shopping for groceries, making telephone calls, taking medicines, and managing money); 0 = no limitations; 1–3 = mild to moderate; ≥ 4 = severe.
Cognitive Class determined by a 27-point self-administered test; ≥ 11 = normal; 7–11 = mild cognitive impairment; 0–6 = severe.
Predictors of cognitive decline included both surgery without and with complication (aOR 1.32, 95% CI: 1.03–1.71 and aOR 1.42, 95% CI: 1.15–1.76, respectively), Black or other race (aOR 2.0, 95% CI: 1.45–2.77 and aOR 1.99, 95% CI: 1.13–3.53 respectively), increasing age (aOR 1.07, 95% CI: 1.05–1.09) and increasing number of comorbid conditions (aOR 1.08, 95% CI: 1.0–1.17). Mild to moderate and severe baseline functional status were also predictive of worsening cognitive status (aOR 1.59, 95% CI: 1.29–1.98 and aOR 2.48, 95% CI: 1.69–3.65 respectively). In contrast, educational attainment greater than high school was protective of cognitive decline. Of note, adjusted ORs for decline were not calculated for severe functional status and moderate to severe cognitive class due to a ceiling effect (i.e., no further decline is possible after patients reach the most severe functional and/or cognitive classes) (Table 2).
Due to incomplete diagnosis and procedure code data, frailty was available only for a subset of the cohort (n = 2,025). As such, a sensitivity analysis was performed of this subset. Greater frailty was significantly associated with functional and cognitive decline in both bivariate and multivariate analyses (p < 0.01 for all comparisons). However, inclusion of frailty in our multivariable models did not affect the significance of the other covariates. Supplement 2 details how specific complications contribute to both functional and cognitive decline. Although renal failure was a significant predictor of functional decline and pulmonary failure was a significant predictor of cognitive decline, individual complications did not change the significance of other covariates.
Figure 2 demonstrates the rates of patient-reported assistance required for specific ADLs and IADLs among patients who experienced functional decline. All measures of ADLs and IADLs were reported to need more assistance at follow-up than baseline. The increase was larger among the surgery with complications cohort than the surgery without complications cohort and nonsurgical controls, particularly for ADLs of walking, bathing, getting in and out of bed, and the IADLs of grocery shopping, preparing hot meals and managing money. Figure 3 demonstrates memory and mental status scores at baseline and follow-up. With higher numbers indicating better scores, all cohorts demonstrated worsened cognition from baseline survey to follow-up survey.
Figure 2. Specific Functional Limitations Among Those Who Experience Decline.
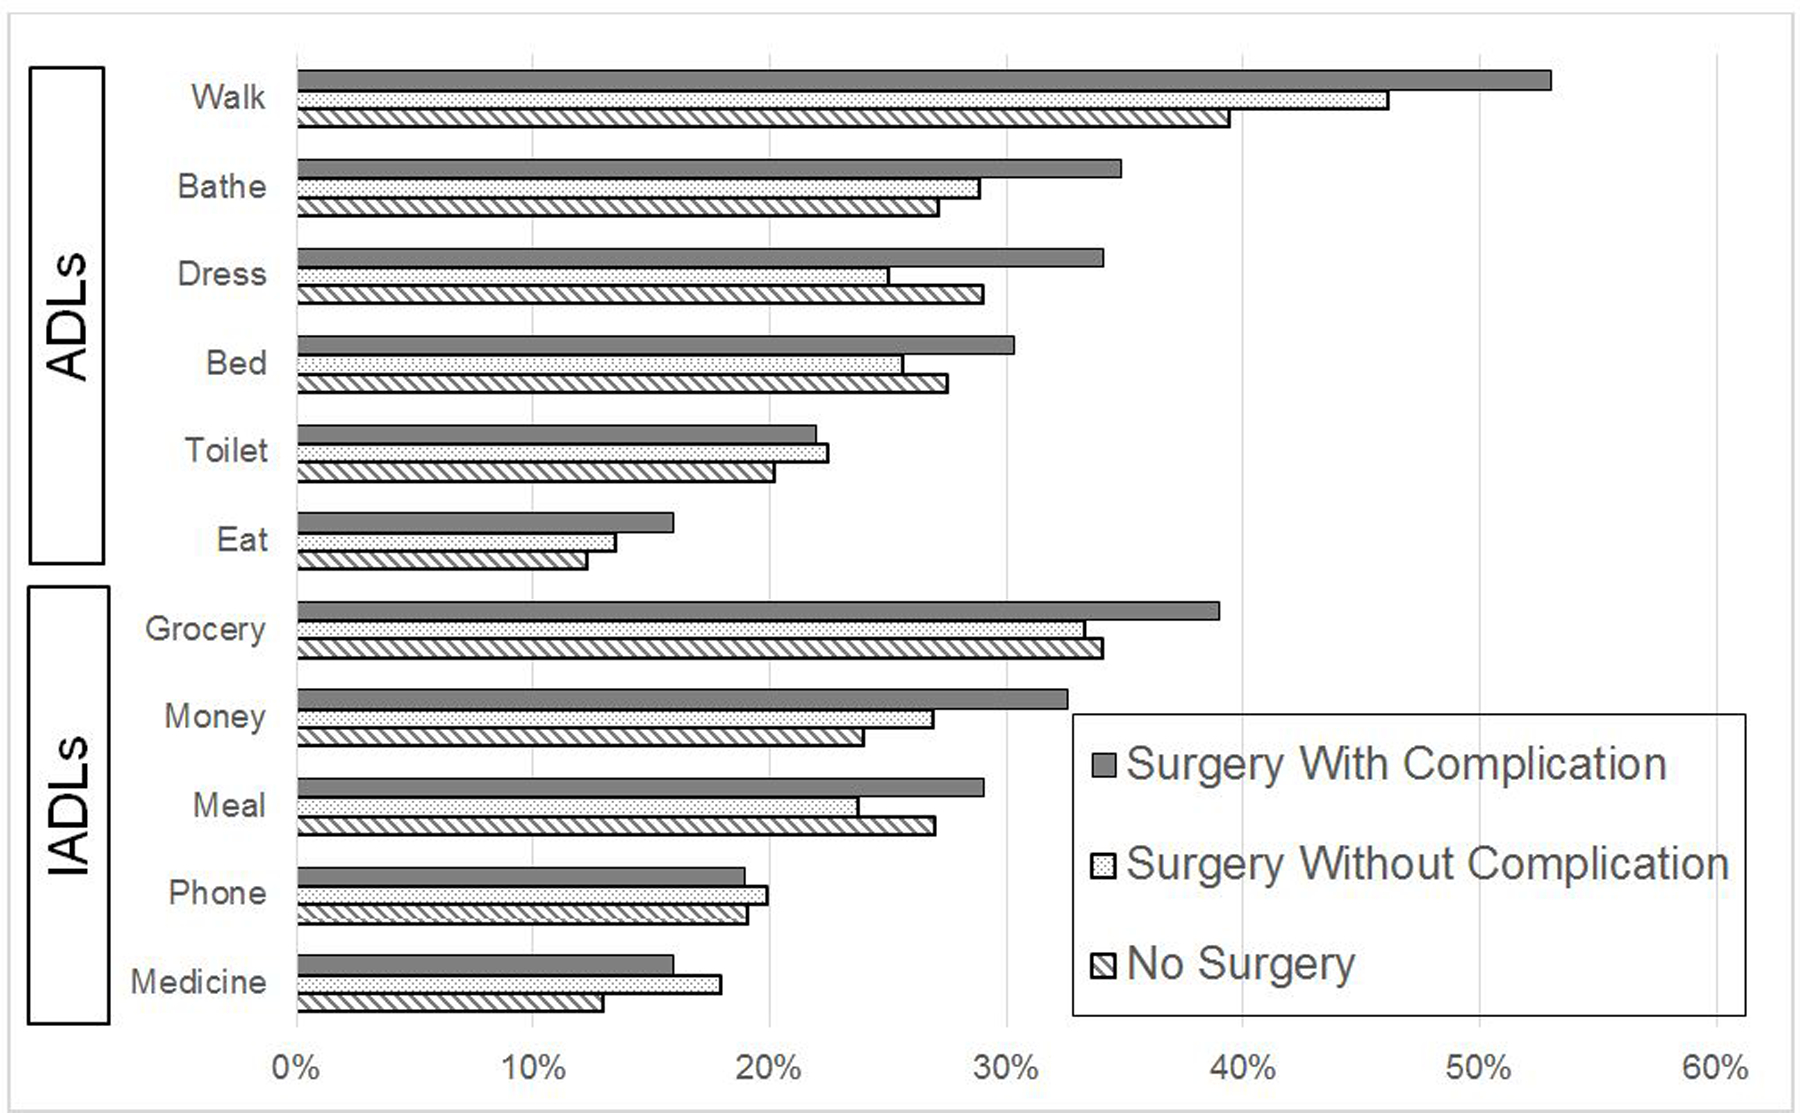
Proportion of patients requiring assistance among each of the functional measures
Figure 3. Specific Cognitive Impairments Among Those Who Experienced Decline.

Memory and mental status scores at baseline and follow-up (higher scores are better)
*Indicates statistical significance (p < 0.01)
In a survival model adjusting for covariates, poorer survival was associated with both functional (HR 1.67, 95% CI: 1.43–1.94) and cognitive (HR 1.35, 95% CI: 1.15–1.58) decline. Adjusted five-year survival was 73.7% for patients with functional decline versus 83.1% for those without. For patients with cognitive decline, adjusted five-year survival was 77.2% versus 82.7% for those without.
Finally, healthcare utilization was significantly greater in those that demonstrated functional decline ($15,650 vs. $26,099, p < 0.001) and cognitive decline ($16,497 vs. $23,473, p < 0.001). In addition, “days at home” were fewer in those that demonstrated function decline (330.9 vs. 342.2 days, p < 0.001) and cognitive decline (331.1 vs. 339.9 days, p < 0.001) (Supplement 3). Subsequent covariate adjustments were made, and these findings remained consistent.
DISCUSSION
In this nationally representative study using a robust longitudinal data source, we found that older adults undergoing high-risk surgery are at higher risk of functional and cognitive decline, and that a serious postoperative complication exacerbates this risk. In addition, increasing age, frailty, number of comorbid conditions, and worse baseline functional and cognitive statuses predicted a significantly higher risk of functional and cognitive decline, which translated to poorer long-term survival and increased healthcare utilization. With the aging population and an increasing number of older adults undergoing surgical procedures, these data have important implications.
Although substantial efforts have been made to reduce postoperative complications and mortality, particularly in older adults who have decreased physiologic reserve to recover from both the operation and any inadvertent sequelae, far less attention has been aimed at the long-term implications of surgery and complications among this vulnerable patient population.26,27 Even in older adult patients who are ‘rescued’ from death following a serious complication, the risk of prolonged recovery and potential disability are high.28 Further, ongoing care designed to prolong life among seriously-ill patients may have only short-term impact – over 40% of older adults admitted to intensive care units die within the year.19,29 Indeed, a recent systematic review and meta-analysis by Watt and colleagues identified 44 studies characterizing factors associated with postoperative complications among older adults undergoing elective surgery, and found only six studies examining functional decline and 13 measuring discharge destination.30 Fewer studies specifically examine both functional and cognitive outcomes after surgery and complications beyond the immediate postoperative period, and the majority represent patients from single institutions with no regard for the effect on survival or economic impacts.13 Here, we characterize the impact of surgery and complications on functional limitation and cognitive impairment among a broad range of individuals across the U.S., with all levels of presurgical functional and cognitive abilities, using a unique dataset that allows for detailed examination of disability. Furthermore, we found that acquired deficiencies following surgery are associated with poorer long-term survival and increased healthcare utilization.
Avoidance or minimizing complications after major surgery is critical as subsequent disability affects well-being and social involvement as well as hospital and nursing home admissions. Moreover, older adults favor quality of life (e.g., maintaining independence, living at home, not being a burden to family) over prolongation of life.31,32 However, current measures for patient-reported postoperative recovery are poor, with function and cognition rarely assessed even in primary care settings.33–35 Further, beyond cardiac and orthopedic surgery, cognitive outcomes have received almost no attention.36–38 Our study evaluated self-reported functional and cognitive outcomes after surgery in addition to specific disabilities that may be acquired. These detailed outcomes, lacking in other large datasets, are meaningful and interpretable to older adults.
Older adults may consent to procedures with unrealistic expectations due to an underappreciation for prolonged recovery and continued disability following surgery.13 As a result, patients who undergo surgery and suffer a postoperative complication or a series of complications frequently receive unwanted invasive procedures.39,40 These patients are subjected to further burdensome surgery, protracted recovery and disability, and poor quality of life or even prolonged dying.41 With this knowledge and our findings of functional and cognitive prognoses, surgeons may be better equipped to have meaningful conversations about surgery and setting realistic expectations, particularly in those most vulnerable to postoperative complications and subsequent declines. Furthermore, such knowledge enables surgeons to better anticipate the needs of patients and their families such that specific individuals may be identified who may benefit from targeted interventions, particularly among the frail, such as prehabilitation, multicomponent interventions to reduce postoperative delirium, and/or strategies to restore independence in the postoperative setting such as intensive therapy in rehabilitation hospitals; all of which have been associated with better long-term outcomes.42,43 This may also be an important opportunity to introduce nonsurgical options and/or initiate discussions with palliative care.44 Finally, knowledge of these outcomes allows for better resource utilization and planning.10
We acknowledge the limitations to our study including the lack of granularity inherent to large data sets including details about decision-making and unmeasured factors including different measures of frailty and socioeconomic disadvantage, which are well known to negatively impact surgical and health outcomes.45,46 However, we were able to examine an important patient-centered outcomes, “days at home,” between those who experience and those who do not experience decline, which is of great consequence to older adults.47 In addition, the HRS linked with Medicare data permits data on functional and cognitive ability while ensuring accuracy in receipt of surgery and healthcare use. Using a nationally-representative sample strengthens the generalizability of our results. Second, self-reported measures may be subject to bias but multiple landmark studies utilize self-reported ADLs and IADLs, which are acceptable in the geriatric literature.7,48,49 Furthermore, the frequency of surveys may not capture immediate postoperative disability and recovery, which may influence long-term outcomes, and those who were lost to follow-up or died may underestimate our results.50 However, the frequency of these surveys allows us to capture lasting, rather than self-limited, disability. Finally, we identified only those having undergone high-risk elective surgery and may have excluded patients who underwent lower risk surgery and still experienced a postoperative complication and subsequent decline, further underestimating the effect of surgery. Despite these limitations however, the goal of this study was to evaluate meaningful and person-centered effects of surgery over time.
We identified those most vulnerable to worsening disability and ultimate death following high-risk surgery. Although we may not be able to avoid surgery, we may be able improve patient selection and mitigate perioperative risk. Furthermore, knowledge of these longitudinal outcomes after surgery allows for more informed surgical decision-making and provides critical insight into how to better anticipate and manage the needs of older adults undergoing surgery. Finally, understanding the magnitude of healthcare utilization allows for resource planning. Together, this will allow for tailoring to specific needs and better inform surgeons and patients during the perioperative period when the risk of complications is high and the opportunity for meaningful recovery becomes less likely.
Supplementary Material
Supplement 1. Derivation of Patient Cohorts
Supplement 2. Specific Complications
A. Frequency of Complications Among Surgical Patients
B. Impact of Specific Complications on Functional and Cognitive Decline
Supplement 3. Healthcare Utilization Between No Decline and Decline
Funding:
This project was funded by the Thomas R. Russell Faculty Research Fellowship from the American College of Surgeons
REFERENCES
- 1.Ortman JM VV, Hogan H. An aging nation: the older population in the United States. United States Census Bureau. Published 2014. Accessed January 4, 2016. [Google Scholar]
- 2.Ghignone F, van Leeuwen BL, Montroni I, et al. The assessment and management of older cancer patients: A SIOG surgical task force survey on surgeons’ attitudes. Eur J Surg Oncol. 2015. [DOI] [PubMed] [Google Scholar]
- 3.Finlayson EV, Birkmeyer JD. Operative mortality with elective surgery in older adults. Eff Clin Pract. 2001;4(4):172–177. [PubMed] [Google Scholar]
- 4.Turrentine FE, Wang H, Simpson VB, Jones RS. Surgical risk factors, morbidity, and mortality in elderly patients. J Am Coll Surg. 2006;203(6):865–877. [DOI] [PubMed] [Google Scholar]
- 5.American College of Surgeons GSVQIP. Optimal Resources for Geriatric Surgery. In. Chicago, IL: 2019. [Google Scholar]
- 6.Hshieh TT, Saczynski J, Gou RY, et al. Trajectory of Functional Recovery After Postoperative Delirium in Elective Surgery. Ann Surg. 2017;265(4):647–653. [DOI] [PMC free article] [PubMed] [Google Scholar]
- 7.Lawrence VA, Hazuda HP, Cornell JE, et al. Functional independence after major abdominal surgery in the elderly. J Am Coll Surg. 2004;199(5):762–772. [DOI] [PubMed] [Google Scholar]
- 8.Legner VJ, Massarweh NN, Symons RG, McCormick WC, Flum DR. The significance of discharge to skilled care after abdominopelvic surgery in older adults. Ann Surg. 2009;249(2):250–255. [DOI] [PubMed] [Google Scholar]
- 9.Sacks GD, Lawson EH, Dawes AJ, Gibbons MM, Zingmond DS, Ko CY. Which Patients Require More Care after Hospital Discharge? An Analysis of Post-Acute Care Use among Elderly Patients Undergoing Elective Surgery. J Am Coll Surg. 2015;220(6):1113–1121.e1112. [DOI] [PubMed] [Google Scholar]
- 10.Balentine CJ, Naik AD, Berger DH, Chen H, Anaya DA, Kennedy GD. Postacute Care After Major Abdominal Surgery in Elderly Patients: Intersection of Age, Functional Status, and Postoperative Complications. JAMA Surg. 2016;151(8):759–766. [DOI] [PubMed] [Google Scholar]
- 11.Kwon S, Symons R, Yukawa M, Dasher N, Legner V, Flum DR. Evaluating the association of preoperative functional status and postoperative functional decline in older patients undergoing major surgery. Am Surg. 2012;78(12):1336–1344. [PMC free article] [PubMed] [Google Scholar]
- 12.Stabenau HF, Becher RD, Gahbauer EA, Leo-Summers L, Allore HG, Gill TM. Functional Trajectories Before and After Major Surgery in Older Adults. Ann Surg. 2018;268(6):911–917. [DOI] [PMC free article] [PubMed] [Google Scholar]
- 13.Rangel EL, Cooper Z, Olufajo OA, et al. Mortality after emergency surgery continues to rise after discharge in the elderly: Predictors of 1-year mortality. J Trauma Acute Care Surg. 2015;79(3):349–358. [DOI] [PubMed] [Google Scholar]
- 14.Fisher GG, Ryan LH. Overview of the Health and Retirement Study and Introduction to the Special Issue. Work Aging Retire. 2018;4(1):1–9. [DOI] [PMC free article] [PubMed] [Google Scholar]
- 15.Cowper DC, Kubal JD, Maynard C, Hynes DM. A primer and comparative review of major US mortality databases. Ann Epidemiol. 2002;12(7):462–468. [DOI] [PubMed] [Google Scholar]
- 16.Schwarze ML, Barnato AE, Rathouz PJ, et al. Development of a list of high-risk operations for patients 65 years and older. JAMA Surg. 2015;150(4):325–331. [DOI] [PMC free article] [PubMed] [Google Scholar]
- 17.Weingart SN, Iezzoni LI, Davis RB, et al. Use of administrative data to find substandard care: validation of the complications screening program. Med Care. 2000;38(8):796–806. [DOI] [PubMed] [Google Scholar]
- 18.Kim DH, Schneeweiss S, Glynn RJ, Lipsitz LA, Rockwood K, Avorn J. Measuring Frailty in Medicare Data: Development and Validation of a Claims-Based Frailty Index. J Gerontol A Biol Sci Med Sci. 2018;73(7):980–987. [DOI] [PMC free article] [PubMed] [Google Scholar]
- 19.Iwashyna TJ, Ely EW, Smith DM, Langa KM. Long-term cognitive impairment and functional disability among survivors of severe sepsis. JAMA. 2010;304(16):1787–1794. [DOI] [PMC free article] [PubMed] [Google Scholar]
- 20.Jorm AF. The Informant Questionnaire on cognitive decline in the elderly (IQCODE): a review. Int Psychogeriatr. 2004;16(3):275–293. [DOI] [PubMed] [Google Scholar]
- 21.Fisher G H H, Faul J, Rodgers W, Weir D. Health and Retirement Study Imputation of Cognitive Functioning Measures: 1992–2014. http://hrsonline.isr.umich.edu/modules/meta/xyear/cogimp/desc/COGIMPdd.pdf?_ga=2.176140961.225475549.1560445792-446556014.1560445792. Accessed July 10, 2019.
- 22.Gottlieb DJ ZW, Song Y, Andrews KG, Skinner JS, Sutherland JM. Prices don’t drive regional Medicare spending variations. Health Aff (Millwood). 2010;29(3):537–543. [DOI] [PMC free article] [PubMed] [Google Scholar]
- 23.Services CfMM. Medicare Provider/Supplier to Healthcare Provider Taxonomy. <span style=“font-size:11.0pt.mso-bidi-language:AR-SA”>http://www.cms.gov/Medicare/Provider-Enrollment-and-Certification/MedicareProviderSupEnroll/Downloads/TaxonomyCrosswalk.pdf. Published 2015. Accessed September 1, 2016.
- 24.Parsons L. Performing a 1:N Case-Control Match on Propensity Score. 26th Annual SAS Users Group International Conference; 2004; Montreal, Canada. [Google Scholar]
- 25.Gill TM, Gahbauer EA, Han L, Allore HG. Trajectories of disability in the last year of life. N Engl J Med. 2010;362(13):1173–1180. [DOI] [PMC free article] [PubMed] [Google Scholar]
- 26.Tang VL, Dillon EC, Yang Y, et al. Advance Care Planning in Older Adults With Multiple Chronic Conditions Undergoing High-Risk Surgery. JAMA Surg. 2018. [DOI] [PMC free article] [PubMed] [Google Scholar]
- 27.Thomas DR, Ritchie CS. Preoperative assessment of older adults. J Am Geriatr Soc. 1995;43(7):811–821. [DOI] [PubMed] [Google Scholar]
- 28.Cooper Z, Mitchell SL, Gorges RJ, Rosenthal RA, Lipsitz SR, Kelley AS. Predictors of Mortality Up to 1 Year After Emergency Major Abdominal Surgery in Older Adults. J Am Geriatr Soc. 2015;63(12):2572–2579. [DOI] [PMC free article] [PubMed] [Google Scholar]
- 29.Nabozny MJ, Kruser JM, Steffens NM, et al. Constructing High-Stakes Surgical Decisions: It Is Better to Die Trying. Ann Surg. 2015. [DOI] [PMC free article] [PubMed] [Google Scholar]
- 30.Watt J, Tricco AC, Talbot-Hamon C, et al. Identifying older adults at risk of harm following elective surgery: a systematic review and meta-analysis. BMC Med. 2018;16(1):2. [DOI] [PMC free article] [PubMed] [Google Scholar]
- 31.Rubin EB, Buehler AE, Halpern SD. States Worse Than Death Among Hospitalized Patients With Serious Illnesses. JAMA Intern Med. 2016;176(10):1557–1559. [DOI] [PMC free article] [PubMed] [Google Scholar]
- 32.Fried TR, Bradley EH, Towle VR, Allore H. Understanding the treatment preferences of seriously ill patients. N Engl J Med. 2002;346(14):1061–1066. [DOI] [PubMed] [Google Scholar]
- 33.Fiore JF, Figueiredo S, Balvardi S, et al. How Do We Value Postoperative Recovery?: A Systematic Review of the Measurement Properties of Patient-reported Outcomes After Abdominal Surgery. Ann Surg. 2018;267(4):656–669. [DOI] [PubMed] [Google Scholar]
- 34.Bogardus ST, Towle V, Williams CS, Desai MM, Inouye SK. What does the medical record reveal about functional status? A comparison of medical record and interview data. J Gen Intern Med. 2001;16(11):728–736. [DOI] [PMC free article] [PubMed] [Google Scholar]
- 35.Calkins DR, Rubenstein LV, Cleary PD, et al. Failure of physicians to recognize functional disability in ambulatory patients. Ann Intern Med. 1991;114(6):451–454. [DOI] [PubMed] [Google Scholar]
- 36.O’ Brien H, Mohan H, Hare CO, Reynolds JV, Kenny RA. Mind Over Matter? The Hidden Epidemic of Cognitive Dysfunction in the Older Surgical Patient. Ann Surg. 2017;265(4):677–691. [DOI] [PubMed] [Google Scholar]
- 37.Saczynski JS, Marcantonio ER, Quach L, et al. Cognitive trajectories after postoperative delirium. N Engl J Med. 2012;367(1):30–39. [DOI] [PMC free article] [PubMed] [Google Scholar]
- 38.Witlox J, Slor CJ, Jansen RW, et al. The neuropsychological sequelae of delirium in elderly patients with hip fracture three months after hospital discharge. Int Psychogeriatr. 2013;25(9):1521–1531. [DOI] [PubMed] [Google Scholar]
- 39.Khuri SF, Henderson WG, DePalma RG, et al. Determinants of long-term survival after major surgery and the adverse effect of postoperative complications. Ann Surg. 2005;242(3):326–341; discussion 341–323. [DOI] [PMC free article] [PubMed] [Google Scholar]
- 40.Ferraris VA, Bolanos M, Martin JT, Mahan A, Saha SP. Identification of patients with postoperative complications who are at risk for failure to rescue. JAMA Surg. 2014;149(11):1103–1108. [DOI] [PubMed] [Google Scholar]
- 41.Cooper Z, Koritsanszky LA, Cauley CE, et al. Recommendations for Best Communication Practices to Facilitate Goal-concordant Care for Seriously Ill Older Patients With Emergency Surgical Conditions. Ann Surg. 2016;263(1):1–6. [DOI] [PubMed] [Google Scholar]
- 42.Barberan-Garcia A, Ubré M, Roca J, et al. Personalised Prehabilitation in High-risk Patients Undergoing Elective Major Abdominal Surgery: A Randomized Blinded Controlled Trial. Ann Surg. 2018;267(1):50–56. [DOI] [PubMed] [Google Scholar]
- 43.Siddiqi N, Harrison JK, Clegg A, et al. Interventions for preventing delirium in hospitalised non-ICU patients. Cochrane Database Syst Rev. 2016;3:CD005563. [DOI] [PMC free article] [PubMed] [Google Scholar]
- 44.Ballou JH, Brasel KJ. Palliative Care and Geriatric Surgery. Clin Geriatr Med. 2019;35(1):35–44. [DOI] [PubMed] [Google Scholar]
- 45.Lin HS, Watts JN, Peel NM, Hubbard RE. Frailty and post-operative outcomes in older surgical patients: a systematic review. BMC Geriatr. 2016;16(1):157. [DOI] [PMC free article] [PubMed] [Google Scholar]
- 46.Kind AJ, Jencks S, Brock J, et al. Neighborhood socioeconomic disadvantage and 30-day rehospitalization: a retrospective cohort study. Ann Intern Med. 2014;161(11):765–774. [DOI] [PMC free article] [PubMed] [Google Scholar]
- 47.Myles PS, Shulman MA, Heritier S, et al. Validation of days at home as an outcome measure after surgery: a prospective cohort study in Australia. BMJ Open. 2017;7(8):e015828. [DOI] [PMC free article] [PubMed] [Google Scholar]
- 48.Fried TR, Bradley EH, Williams CS, Tinetti ME. Functional disability and health care expenditures for older persons. Arch Intern Med. 2001;161(21):2602–2607. [DOI] [PubMed] [Google Scholar]
- 49.Inouye SK, Peduzzi PN, Robison JT, Hughes JS, Horwitz RI, Concato J. Importance of functional measures in predicting mortality among older hospitalized patients. JAMA. 1998;279(15):1187–1193. [DOI] [PubMed] [Google Scholar]
- 50.Wolf DA, Gill TM. Modeling transition rates using panel current-status data: how serious is the bias? Demography. 2009;46(2):371–386. [DOI] [PMC free article] [PubMed] [Google Scholar]
Associated Data
This section collects any data citations, data availability statements, or supplementary materials included in this article.
Supplementary Materials
Supplement 1. Derivation of Patient Cohorts
Supplement 2. Specific Complications
A. Frequency of Complications Among Surgical Patients
B. Impact of Specific Complications on Functional and Cognitive Decline
Supplement 3. Healthcare Utilization Between No Decline and Decline