

Summary
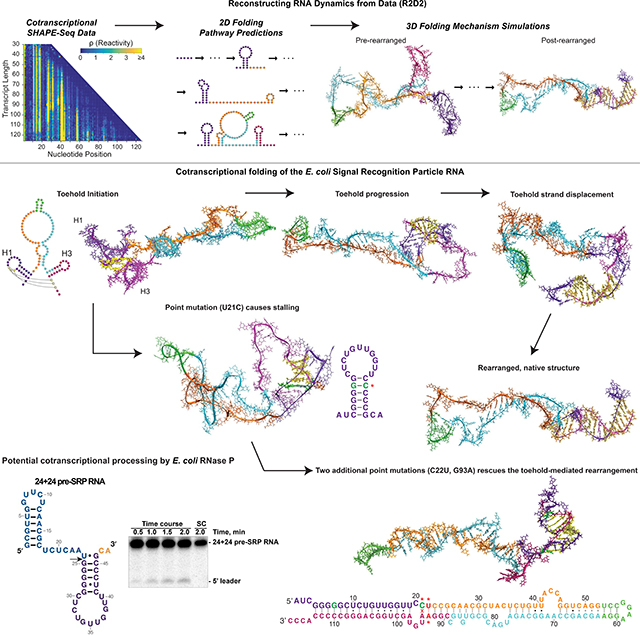
The series of RNA folding events that occur during transcription can critically influence cellular RNAs’ function. Here, we present Reconstructing RNA Dynamics from Data (R2D2), a method to uncover details of cotranscriptional RNA folding. We model the folding of the Escherichia coli signal recognition particle RNA and show that it requires specific local structural fluctuations within a key hairpin to engender efficient cotranscriptional conformational rearrangement into the functional structure. All-atom molecular dynamics simulations suggest that this rearrangement proceeds through an internal toehold-mediated strand-displacement mechanism, which can be disrupted with a point mutation that limits local structural fluctuations and rescued with compensating mutations that restores these fluctuations. Moreover, a cotranscriptional folding intermediate could be cleaved in vitro by recombinant E. coli RNase P, suggesting potential cotranscriptional processing. These results from experiment-guided multi-scale modeling demonstrate that even an RNA with a simple functional structure can undergo complex folding and processing during synthesis.
eTOC Blurb
Experimentally-guided multi-scale modeling of the cotranscriptional folding pathway of the E. coli signal recognition particle RNA reveals that it undergoes an internal toehold-mediated strand-displacement process that requires local structural fluctuations. An intermediate of this pathway is a substrate for RNase P, suggesting concurrent transcription and processing.
Graphical Abstract
Introduction
RNA structures begin to form during transcription. A nascent RNA exiting RNA polymerase (RNAP) transitions through intermediate structures that can ultimately influence the RNA’s final fold and function (Kramer and Mills, 1981). Because RNA folding generally occurs faster than transcription (Mustoe et al., 2014), the 5′ to 3′ directionality of RNA synthesis guides a cotranscriptional ‘folding pathway’ (Pan and Sosnick, 2006). Each time an RNA is transcribed, the ensuing order of folding is critical for essential catalytic RNAs to adopt a functional structure, for riboswitches to make regulatory decisions, for ribonucleoprotein complexes (e.g., ribosome) to assemble, and for RNA processing to take place with efficiency and fidelity (Al-Hashimi and Walter, 2008; Saldi et al., 2018; Serganov and Nudler, 2013). Thus, establishing the principles of cotranscriptional folding is important to understand how each RNA adopts its native structure, with additional payoffs for better appreciating the dynamic behavior that underpins RNA-based molecular machines and switches.
Despite the widespread biological importance, we still lack a complete understanding of the dynamic, non-equilibrium folding pathways that RNAs undergo during transcription. Pioneering RNA folding studies showed that the synthesis order of RNA sequence elements are important for establishing functional folds of RNA enzymes (Heilman-Miller and Woodson, 2003; Pan et al., 1999). Enzymatic RNA structure probing was then used to generate models of cotranscriptional folding processes (Wong et al., 2007). Single-molecule force spectroscopy has also been used to track in real-time the major folding events of regulatory riboswitches (Frieda and Block, 2012). To complement these approaches with higher-resolution structural information, we previously developed cotranscriptional SHAPE-seq, a chemical structure probing method that captures nucleotide-resolution flexibility data for each length of a nascent RNA in stalled transcription elongation complexes (Watters et al., 2016a). While these experimental methods are powerful, the resulting data are complex and cannot be directly used to obtain specific RNA structure models.
Computational RNA folding algorithms are important tools for generating models of RNA structure and folding. Some of these algorithms modify minimum free energy (MFE) folding calculations to capture some features of cotranscriptional folding (Proctor and Meyer, 2013) or use stochastic simulations of RNA folding with growing chain length to model cotranscriptional folding (Danilova et al., 2006; Geis et al., 2008; Hofacker et al., 2010; Xayaphoummine et al., 2005). Comparative methods utilizing multiple sequence alignments and evolutionary trees have also been developed to capture potentially conserved transient structures (Wiebe and Meyer, 2010).
We developed a method called Reconstructing RNA Dynamics from Data (R2D2) which combines nucleotide-resolution experimental RNA structure chemical probing data with computational structure prediction algorithms to reconstruct models of secondary and then tertiary RNA cotranscriptional folding pathways. We applied R2D2 to model the folding pathway of the Escherichia coli signal recognition particle (SRP, or 4.5S) RNA, a highly conserved non-coding RNA that is found in all kingdoms of life (Rosenblad et al., 2009). This SRP RNA binds to the Ffh protein to form the signal recognition particle, which recognizes nascent signal peptide sequences and delivers ribosome-nascent chain complexes to the inner membrane for translocation through docking to the SRP receptor. The SRP RNA, which fulfills this critical role in cellular protein biogenesis, consists of a single long hairpin containing several internal bulges and non-canonical base pairs (Batey et al., 2000). This tertiary fold is thought to be generated prior to removal of a 5′ leader sequence by RNase P, an essential endonuclease known primarily for its role in tRNA 5′-maturation (Bothwell et al., 1976). The E. coli SRP RNA is a valuable model for studies of nascent RNA folding because previous studies indicate that during transcription, the SRP RNA rearranges from an intermediate hairpin fold that differs substantially from the single long hairpin, into an extended helical structure (Wong et al., 2007) that resembles the functional structure (Hsu et al., 1984; Jomaa et al., 2017). We therefore applied R2D2 to this model system to uncover mechanistic insights into this rearrangement process.
Our secondary structure models of the processed form of the SRP RNA confirmed the overall rearrangement, and inspired a point mutation within an intermediate hairpin that disrupts the cotranscriptional rearrangement of the SRP RNA. We then performed all-atom molecular dynamics (MD) simulations to assess possible mechanisms for the native sequence rearrangement and gain insights into how a single mutation can disrupt this process. Upon evaluating multiple rearrangement mechanisms, the simulations suggest that the rearrangement likely proceeds via an internal toehold-mediated strand-displacement mechanism. This folding route requires local structural fluctuations within the intermediate hairpin, and the point mutation abolishes these fluctuations. We also engineered point mutations that were predicted to re-introduce flexibility into the intermediate hairpin, and indeed such a change rescued the ability of the SRP RNA to cotranscriptionally rearrange into its native fold. The presence or absence of the 5’ leader that is cleaved by RNase P was not found to affect these folding mechanisms. Interestingly, our models predicted that one of the intermediates could serve as a natural substrate for RNase P. Indeed, we found that the intermediate is cleaved in vitro by recombinant E. coli RNase P, suggesting that SRP RNA processing could occur cotranscriptionally as well as the established post-transcriptional pathway. While this work was being performed, several of our structural predictions were corroborated by an independent study that used a high-resolution optical tweezers instrument to follow in real-time and on a single-molecule scale the cotranscriptional folding of the same SRP RNA sequences (Fukuda et al., 2019).
Overall, this work presents a method for multi-scale modeling of RNA cotranscriptional folding pathways from experimental data and uncovers efficient ways by which RNAs can rearrange intermediate structures into final functional folds by exploiting toehold-mediated strand-displacement mechanisms.
Design
While in silico cotranscriptional folding predictors show great promise, the algorithms could benefit from high-resolution experimental studies to corroborate, guide, and improve their predictions. For example, RNA chemical probing data can be used as restraints in computational RNA folding algorithms to improve the agreement between equilibrium predictions and experimental measurements (Deigan et al., 2009). However, these algorithms were developed to model RNA folding under equilibrium conditions, and efforts to predict cotranscriptional secondary structure folding pathways from chemical probing data are in early stages (Li and Aviran, 2018). To address this gap, we developed R2D2 to implement experiment-guided multi-scale modeling of RNA cotranscriptional folding.
R2D2 uses nucleotide-resolution chemical probing data as input to reconstruct models of secondary and then tertiary RNA cotranscriptional folding pathways (Methods). Secondary structure modeling for each length of a growing nascent RNA begins by first sampling possible structures using RNA sequence information and cotranscriptional SHAPE-Seq data. Subsequently, using an optimized structure-to-data distance metric, sampled structures that are most consistent with the experimental data are selected resulting in a family of possible structural states, reflecting intermediate nascent RNA lengths generated during transcription. This design choice was inspired by previous methods (Ding et al., 2004; Ouyang et al., 2013; Quarrier et al., 2010) that pioneered 2-D RNA structure sampling and selecting, but differs in the sampling and selection protocols in addition to connecting secondary structures to 3-D dynamic modeling. R2D2’s secondary structure reconstruction is then used as a starting point for all-atom molecular dynamics (MD) simulations to generate 3-D models of cotranscriptional folding transitions observed between specific predicted intermediate states.
Most prior approaches to simulate cotranscriptional RNA folding operate purely at the secondary structure level (Danilova et al., 2006; Geis et al., 2008; Hofacker et al., 2010; Xayaphoummine et al., 2005) and are therefore unable to capture the inherently 3-D nature of topological strain, multi-helix junctions, and long-range base-pairs including pseudoknots and kissing-loops. Given the disproportionate impact such interactions have on the kinetics of cotranscriptional folding of SRP, a 3-D model was clearly needed for this study. Conversely, 3-D simulations have been previously used to study the folding pathways of the SAM-1 riboswitch (Whitford et al., 2009), utilizing a Gŏ-like energy model originally developed for studying protein folding. Our approach shares the motivation of reducing folding frustration; however, the Gŏ-model approach requires a solved 3-D structure as an input, which is unavailable for the SRP pre-rearrangement complex. Furthermore, the implicit solvent- and native contact-based potential cannot be expected to accurately depict folding intermediates stabilized by non-native tertiary interactions. Therefore, there is a need for a new approach that preserved the overall efficiency of the Gŏ-like models even while retaining the general applicability of a traditional explicit solvent-based molecular dynamics simulation. We accomplished this objective by incorporation of selective R2D2-derived restraints applied to all-atom, explicit solvent model simulations capable of the de novo folding of small RNAs.
Results
A sample-and-select approach to reconstructing RNA folding pathways from experimental data
We developed a method to merge computational multi-scale RNA structure algorithms with nucleotide-resolution datasets generated from cotranscriptional SHAPE-seq experiments that probe nascent RNA structure (Figure 1). Cotranscriptional SHAPE-seq begins with in vitro transcription of a DNA template library that directs the synthesis of each intermediate length of a target RNA using RNAP roadblocks (Watters et al., 2016a). Transcription from this template library generates nascent RNAs of all intermediate lengths of the target sequence, which are rapidly probed with the fast-acting SHAPE reagent benzoyl cyanide (BzCN; self-inactivation t½ of 250 ms) to covalently modify the RNA according to its structure (Mortimer and Weeks, 2007). RNA nucleotides that are unconstrained by secondary or tertiary structure are more reactive and easily modified (Aviran et al., 2011; Bindewald et al., 2011). Library preparation, sequencing, and bioinformatics analysis is then used to generate SHAPE reactivities for each nucleotide of each nascent intermediate length RNA species (Watters et al., 2016a) (Figure 1A).
Figure 1. Overview of the Reconstructing RNA Dynamics from Data (R2D2) approach.

(A) Schematic of the secondary structure prediction method in R2D2. Cotranscriptional SHAPE-Seq is first used to determine reactivities at each nascent transcript length. These reactivities are used to generate secondary (2-D) structures along these transcript lengths. (B) 3-D simulations are then used to determine the feasibility of structural transitions between specific states within the ensemble of 2-D predictions. (C) Outline of the secondary structure prediction method. Potential RNA structures are statistically sampled for every nascent RNA length. For each length, structures are tested for consistency with the reactivity data at that length, and the most consistent structure is selected. This process is then repeated multiple times for each dataset to obtain a collection of structures over all of the nascent RNA lengths that represent structures along the cotranscriptional folding pathway that are consistent with the data. See also Table S1.
We used a sample-and-select method to reconstruct secondary structure folding intermediates within R2D2. The R2D2 sample-and-select method consists of two steps: (1) generate a set of possible structures at each nascent RNA length by sampling candidate structures from the sequences alone, and (2) computationally select the most likely structure(s) using observed experimental data (Figure 1C). Thus, R2D2 requires SHAPE-Seq data to select structures and SHAPE-Seq data is a necessary input. Comparison between SHAPE-Seq reactivities and sampled structures with a ‘distance’ metric that reflects how similar reactivity patterns are to candidate secondary structures is used to select structures that are most consistent with the data at each nascent RNA length (Figure 1C, Table S1).
To generate candidate structures, the sample method statistically examines structures with a large sample size using the partition and stochastic functions of the RNAstructure suite of computational secondary structure prediction tools (Reuter and Mathews, 2010). We applied three variations of the partition method that incorporated experimental SHAPE reactivities in different ways to sample 150,000 structures for each length to increase the diversity of structures sampled (Methods).
To select structures from this sampled set, we developed six metrics to calculate the distance between a given SHAPE-Seq reactivity spectrum and a given RNA secondary structure (Table S1, Methods). Structures with the minimum distance calculated between it and the reactivity spectrum were selected from a candidate sampled set (Figure 1C). By applying this selection at each nascent RNA length, we could reconstruct possible folding intermediates that were most consistent with the experimental data.
Benchmarking sample-and-select on equilibrium refolding data
We next assessed the accuracy of each proposed distance metric. As there are currently no established benchmarks for cotranscriptional folding predictions, we instead assessed distance metrics by predicting the equilibrium folds of an established benchmark panel of RNAs using SHAPE-Seq data (Loughrey et al., 2014). Each distance metric contains several parameter values that are used to determine how the SHAPE reactivities are compared to sampled RNA structures: ρmax and ρc determine cutoffs in reactivity values, and α weighs the contributions from paired vs. unpaired positions (Methods). For each of the six distance functions, we determined the optimal values of the three fit parameters by applying the sample-and-select method to a panel of RNAs previously used to benchmark equilibrium SHAPE-directed secondary structure prediction algorithms (Table S1). The best performing parameter sets performed comparably to the SHAPE data-based output of the Fold module of RNAstructure, a widely used RNA secondary structure prediction algorithm (Table S2, Methods).
Reconstructing the secondary structure cotranscriptional folding pathway of the E. coli SRP RNA sequence
We next applied the R2D2 sample-and-select method to our previously published SRP RNA cotranscriptional and equilibrium refolded SHAPE-seq datasets (Watters et al., 2016a), and this study further characterizes mutants designed based on R2D2 results. The SRP RNA sequence used was based on “Wong et al., 2007” who examined SRP RNA folding using a variant that has AUC in place of the 5’ native 24-nt leader. Before applying R2D2 sample-and-select to this cotranscriptional probing dataset, we removed the last 14 nt from each 3′ end of the RNA sequence to account for the RNA polymerase footprint (Komissarova and Kashlev, 1998). To compare cotranscriptional to equilibrium refolded datasets that do not contain an RNAP footprint, we compare trimmed cotranscriptional transcript lengths to equal lengths of the equilibrium-refolded RNA sequence from each experimental dataset. To visualize R2D2 predictions at each nascent RNA length, we plotted the computed free energies (ΔG) of each selected structure and connected all possible paths between selected structures for visual convenience, noting that connections do not imply transition probabilities between states (Figure 2A). Notably, we observed that distinct structures can have the same minimum distance to the experimental data, which may reflect a mixed population of RNA states at specific lengths. We therefore chose to leave these multiple structures as distinct possibilities that are equally consistent with the data.
Figure 2. R2D2 2-D pathway predictions for the E. coli SRP RNA sequence.

(A) Secondary structure predictions by R2D2 on cotranscriptional and equilibrium refolded SHAPE-Seq data of the E. coli SRP RNA sequence. For each dataset, 100 folding pathway predictions were performed and plotted according to the free energy (ΔG) of the RNA structures predicted along the cotranscriptional (purple) or equilibrium refolded (turquoise) pathway. The range of ΔG values sampled is represented by grey shading, while the ΔG of chosen structures are represented by dots. For visual convenience, dots are connected by lines to view possible free energy changes along the folding trajectory. Consensus structure lines connect ΔG of structures containing base pairs that occur in over 50% of the 100 iterations performed on the cotranscriptional (red) and equilibrium-refolded (blue) SHAPE-seq data. Black line connects the minimum free energy structures in the sampled set. Seven lengths of 2-D predictions by R2D2 are highlighted: (B) 25 nt, (C) 62 nt, (D) 81 nt, (E) 95 nt, (F) 109 nt, (G) 110 nt, and (H) 117 nt. One hundred selected structures are represented as RNAbow plots with base pairs drawn as arcs and the arc thickness indicating prevalence of the base pair amongst the selected structures. Colored arcs show base pairs that are more frequent in either cotranscriptional (purple) or equilibrium (turquoise) predictions, while grey arcs show base pairs that are shared. The consensus structures from cotranscriptional predictions are shown above each RNAbow plot. We shifted the cotranscriptional transcript lengths by 14 nt to compare equal lengths of the RNA sequence that is free to fold from each experimental dataset. Data plotted in this figure are from cotranscriptional SHAPE-Seq replicate 1. See also Figure S2, S3 and SI Movie 1.
Despite diversifying our sampling procedure 150-fold over some previous sample-and-select methods (Ding et al., 2004; Ouyang et al., 2013), we found that it is intractable to generate an exhaustively complete set of candidate structures at each length due to the slow convergence of the stochastic sampling method (Figure S1A,C). Thus, iterations of sample-and-select may generate different sets of candidate structures that can be consistent with the data. To incorporate this variability in sampling, we ran 100 iterations of R2D2 sample-and-select on each SHAPE-Seq dataset to generate a family of possible intermediate folding states (Figure 2A). We applied this method to cotranscriptional SHAPE-Seq datasets of the SRP RNA sequence, as well as SHAPE-Seq datasets from experiments performed on an equilibrium refolded population of the same SRP RNA sequence intermediates to compare out-of-equilibrium to equilibrium predictions of intermediate states (Figure 2, Figure S2). Overall, we observed that cotranscriptional and equilibrium predictions are similar for short RNA lengths, diverge as the RNA length increases, and ultimately converge near full length.
To analyze structural changes that may occur during transcription, we extracted specific structures chosen by the select method at each nascent length. We viewed the family of selected structures at each length using RNAbow software (Aalberts and Jannen, 2013), which revealed specific structural changes across the SRP RNA folding trajectory that differ between out-of-equilibrium and equilibrium datasets (Figure 2B–H, Figure S2B–E, Figure S2G–J). When the first 23–25 nt are free to fold in the cotranscriptional SHAPE-Seq predictions, we detect the formation of a 5′ helix containing 3 or more base pairs which persists through most of the folding pathway (Figure 2B–F). Interestingly, this 5′ helix differs in its make-up from the 5′ helix consisting of positions 4–10 paired to 16–22 that was inferred based on enzymatic probing experiments (Figure S3A,C) (Wong et al., 2007). Instead, we consistently predict a 5′ helix 1 (H1) where positions 3–8 are paired to 20–25, which is consistent with the previous enzymatic probing results (Figure S3B,D) but also by our cotranscriptional SHAPE-Seq data (Figure S3E). We found that H1 is present for a large portion of the folding pathway and, based on our reconstructed states, starts to rearrange into the native long helical structure at lengths 110–111 nt (Figure 2B–G, Figure S2B–D, Figure S2G–I, SI Movie 1).
The next highly persistent structure that forms is a helix created when nts 53–55 pair with 60–62 to form the apical stem-loop of the native structure (Figure 2C–G, Figure S2B–E,G–J). We note, however, that our reconstructions do not predict the formation of four non-canonical interactions that are present in the crystal structure of the E. coli SRP RNA: C49-A66, A50-C65, G51-G64, and G52-A63 (Batey et al., 2000). We attribute this to the reliance of R2D2’s sample-and-select method on RNAstructure’s partition and stochastic functions which are not able to sample structures that contain non-canonical interactions, although portions of the cotranscriptional SHAPE-Seq reactivity matrix in this region show elevated reactivities indicating this region also likely does not close on the 30 s timescale of our experiment. Despite these differences, R2D2 does reconstruct most of the mature SRP RNA sequence structure by length 117 (Figure 2H, Figure S2E,J).
Prior to folding into the final structure, the sample-and-select method also predicts 3′ hairpin structures at various transcript lengths. One such structure is between nucleotides 72 to 90, which we denote early helix 3 (eH3), and the next is between nucleotides 87 to 105, which we denote helix 3 (H3) (Figure 2E,F). Both eH3 and H3 locally insulate bases that form different pairs with nucleotides that are ultimately sequestered within H1 in the final structure. H3 was previously found by comparative analysis of SRP RNA sequences from diverse bacterial species, suggesting it may be an evolutionarily conserved transient structural feature of the SRP RNA (Zhu et al., 2013). The presence of H1 and H3 present a significant structural barrier to cotranscriptional folding in that both must be broken to form the mature extended helical fold. We note, however, that H3 and eH3 are not predicted in every selected structure indicating that additional folding pathways are likely.
Sample-and-select models differ from approaches that do not use experimental data
Based on the ΔG folding trajectory, R2D2’s sample-and-select chooses structures that are higher in free energy than the MFE predicted with or without experimental data at almost all lengths (Figure 2A, Figure S2A,F, Figure S4A). Other than MFE approaches, one of the most widely used is KineFold, which simulates cotranscriptional folding given only an input sequence and a desired transcription rate (Xayaphoummine et al., 2005). In a comparison between 100 repetitions of KineFold and R2D2, KineFold predicted different folding pathways. The key differences between the two approaches pertain to predictions of transient helices such as H1 and H3 as well as the location of structural rearrangements (Figure S4B–F). Predictions between R2D2 and KineFold differ even when simulating 40 s of transcription and stalling at each intermediate length with KineFold to test if the RNAP roadblocking strategy in cotranscriptional SHAPE-seq (30 s of transcription followed by SHAPE probing) explains differences between R2D2 and KineFold (Figure S4G–J).
A single point mutation delays the cotranscriptional rearrangement of the E. coli SRP RNA sequence
R2D2 predictions show structural variation within H1 across the folding pathway (Figure 2, Figure S2, Figure 3A), which we hypothesized is due to the GU pair within the otherwise GC-rich H1. We therefore mutated the native U21 to C21 to change the GU to a GC bp, thereby increasing the stability of H1 and disfavoring the rearrangement into the final helix structure (Figure 3B). R2D2 analysis of the cotranscriptional SRP RNA U21C dataset predicts the presence of H1 at all lengths of the folding pathway through lengths 112, 111, and 110 nt in the first, second, and third replicate, respectively (Figure 3D–H). In contrast, R2D2 shows the rearrangement into the final extended structure in U21C equilibrium-refolded data occurring earlier at length 109 nt. These differences in R2D2’s 2-D results of SRP RNA U21C cotranscriptional and U21C equilibrium-refolded SHAPE-seq reactivities are due to reactivity differences (e.g., consistent drops in H1 loop reactivities at lengths 108–109 nt of the equilibrium-refolded data; Figure 3C). DUETT, a recently developed algorithm to systematically detect reactivity changes in cotranscriptional SHAPE-seq datasets (Xue et al., 2019), detected these drops in reactivity.
Figure 3. A single point mutation disrupts cotranscriptional rearrangement of the mature E. coli SRP RNA sequence.

(A) Examples of H1 variability in 2-D predictions in the folding pathway of the mature sequence indicate potential flexibility. (B) Diagram of the SRP RNA U21C mutation in H1 and the full-length secondary structure. (C) Cotranscriptional SHAPE-Seq reactivities from the mature (left) sequence show drops in reactivities (red box) towards the end of the folding pathway. The reactivity matrix for replicate 1 of the SRP RNA U21C sequence (middle) has generally higher reactivities in these positions throughout, while equilibrium refolded SRP RNA U21C SHAPE-Seq data (right) contains decreases in reactivities in this region. Plotted below these matrices are their respective reactivities from transcript lengths 103 and 131 with H1 loop reactivities under red bracket. (D) Trajectory plot of R2D2 predictions for the U21C sequence following Figure 2. Structures from four lengths are highlighted in RNAbow plots: (E) 95 nt, (F) 109 nt, (G) 110 nt, and (H) 111 nt. See also Figure S5.
The lack of H1 predictions at near full-length RNAs (Figure S5A–B) indicate that rearrangement of H1 is possible given the experimental data but is delayed due to minimization of local fluctuations in H1 (discussed below in Uncovering potential mechanisms of the SRP RNA cotranscriptional structural rearrangement with all-atom simulations). However, we also explore the possible limitations in the Boltzmann distribution-directed sampling methods used as a reason for the predicted cotranscriptional rearrangement of U21C. Boltzmann distribution-directed sampling is naturally biased towards sampling lower free energy structures making it difficult for the algorithm to choose out-of-equilibrium structures especially with increasing RNA lengths. To investigate this possibility, we added to the selection pool structures sampled from the previous six lengths and extended them with unpaired nucleotides. With these additional structures, we find that H1 persists through lengths 113–116 nt, while rearrangement is predicted at length 117 nt in only two of the three replicates (Figure S5A–B). We also ran R2D2 using this modified sampling procedure on the native SRP RNA sequence as a control and found lengths 115–117 nt (Figure S5A–B) are predominantly predicted to be rearranged as expected. Application of the standard R2D2 sample-and-select procedure to the SRP U21C equilibrium refolded datasets showed the presence of H1 but recovered the rearrangement into the final extended helical structure after length 109 nt (Figure 3D–H). Taken together, these data demonstrate that a single point mutation can delay a key transition of the SRP RNA cotranscriptional folding pathway and kinetically trap the RNA in non-native intermediate structures.
A single GU wobble is critical for the E. coli SRP RNA cotranscriptional rearrangement into the extended final fold
Since the replacement of a single GU bp in the predicted H1 helix is enough to disrupt the cotranscriptional rearrangement of SRP RNA, we sought to test if reintroducing a GU pair in H1 would rescue the cotranscriptional rearrangement. We therefore designed a mutation (U21C, C22U, G93A) that reintroduces a GU wobble pair one position lower in the stem of H1 and maintains sequence complementarity between nt 22 and nt 93 (Figure 4A). The cotranscriptional SHAPE-Seq reactivity matrix for this mutant shows a drop in reactivities at length 119 nt (~105 nt free to fold) which was determined with automated detection of reactivity changes (Xue et al., 2019) (Figure 4B). In addition, when applied to this dataset, R2D2 sample-and-select predicts that this mutant follows a similar folding pathway as the native sequence (Figure 4C,D), and that the rearrangement occurs at lengths 110 and 111 nts between three replicates which is the same rearrangement lengths as the wildtype sequence (Figure 4E, Figure S5F). Overall, these data point to the critical requirement of a GU pair within H1 to facilitate the cotranscriptional rearrangement into the final extended helix structure.
Figure 4. Rescue mutant of SRP RNA U21C confirms the importance of flexibility in H1.

(A) Diagram of the rescue mutant U21C, C22U, G93A overlaid on H1 and the native full-length structure. The rescue mutant introduces a GU bp in the SRP RNA U21C H1 structure. (B) Cotranscriptional SHAPE-Seq reactivities from SRP RNA U21C, C22U, G93A: replicate 1 (left, top), replicate 2 (left, bottom), and replicate 3 (right, top). DUETT analysis (right, bottom) detected downswings (blue) and upswings (red) in reactivity. Events occurring up to two transcript lengths apart are indicated with green lines. (C-E) RNAbow plots of SRP RNA U21C, C22U, G93A replicate 1 (green and top) and U21C replicate 1 (purple and bottom) R2D2 predictions following Figure 2. Three lengths are highlighted: (C) 109 nt, (D) 110 nt, and (E) 111 nt. See also Figure S5.
Uncovering potential mechanisms of the SRP RNA cotranscriptional structural rearrangement with all-atom simulations
We next sought to determine the mechanism by which the SRP RNA rearranges during transcription, and the role of the H1 GU bp in this process. Paradoxically, H3 would be expected to impede this rearrangement, as both H3 and H1 need to somehow unzip and hybridize together to form the native extended helix structure. We therefore focused on mechanisms by which the three-hairpin consensus structure at 109 nt of cotranscriptional SHAPE-seq replicate 1 (Figure 2F) can rearrange into the extended helix structure at 110 nt (Figure 2G). Four distinct potential transition pathways were identified: the inside-out (Figure 5A), kissing loop (Figure 5B), late-toehold (Figure 5C), and early-toehold (Figure 5D) pathways. We used all-atom molecular dynamics simulations to characterize the relative feasibility of each of the four proposed transition pathways from the stable folding intermediate containing H1 and H3 (Figure 6A) to the mature fold (Figure 6B). Each pathway suggests that the rearrangement mechanism initiate with a different set of base-pairing interactions (Figure 5). To test each pathway, weak attractive biasing forces between specific nucleotides were sequentially added in a specific order, starting at the initial proposed interaction to facilitate transitioning to the mature fold. Eight replicate simulations were performed for each path (Methods).
Figure 5. Snapshots of possible rearrangement mechanisms tested by 3-D all-atom simulations.

R2D2-modeled secondary structures (left) were used as starting points for all-atom MD simulations (right). For each rearrangement that we tested, the pairing interactions that could seed the rearrangement into the native extended hairpin are indicated in yellow. Other nucleotides are colored for visualization: nts 1–25 (dark purple), 26–52 (orange), 53–62 (green), 63–96 (turquoise), and 97–117 (magenta). (A) The inside-out hypothesis whereby H1 and H3 progressively open and convert into the extended hairpin. (B) The kissing-loop hypothesis where H1 and H3 loops begin the rearrangement process. (C) The late-toehold hypothesis where nucleotides 106–108 downstream of H3 seed the rearrangement through a toehold with nucleotides 9–11 of H1 loop. (D) The early-toehold hypothesis where nucleotides 106–110 seed the rearrangement via a toehold with nucleotides 7–11 of H1 loop. The early- and late-toehold hypotheses differ in the structural state of the growing SRP RNA’s 3′ end before the rearrangement, with the late-toehold hypothesis considering the unraveling of H3. (E) 3-D all-atom simulation trajectory results. Simulations were used to test the potential rearrangement mechanisms in the wild-type SRP RNA, and to test the U21C mutant and its rescue with the late toehold mechanism. Eight simulations were run for each scenario. Simulations can stall when 0–3 or 4–6 bp form. Otherwise, rearrangement could progress to >9 bps or when twice the force was applied. See also SI Movie 2–4.
Figure 6. Snapshots of the toehold-mediated rearrangement pathway from molecular dynamics simulations.

(A) Pre-rearranged structure with H1 (purple) and H3 (magenta) present. (B) Rearranged structure with native base pairs (yellow) forming the extended helix. (C) Toehold progression to 6 bp of the native helix (yellow) requires unfolding of H3. (D) Further elongation to a 9-bp native helix (yellow) requires unfolding of H1. (E) In the SRP RNA U21C mutant, H1 is stabilized by a GC bp (green) that replaced the GU bp. Even if a toehold is made to form (yellow), folding stalls as the G7-C21 bp cannot be disrupted even when modest biasing forces are applied. (F) In the SRP RNA U21C, C22U, G93A mutant, the rearrangement can occur and the GC bp (green) can break. See also SI Movie 3.
The inside-out hypothesis involves simultaneously breaking H1 and H3 at their stems from the middle radiating outwards to initiate the formation of the native helix (Figure 5A, SI Movie 2). While it was technically possible to observe the inside-out pathway in the simulation with large biasing forces, it would be extremely thermodynamically unfavorable since it would involve breaking two base-pairs for every one base-pair formed for a significant portion of the pathway (Figure 5E, SI Movie 2). This pathway was possible only when stronger restraints were used, thus identifying an upper limit for the strength of the restraints for all of the other transition pathways.
The kissing loop pathway assumes that bases 17–19 of the H1 loop and bases 98–100 of the H3 loop form initial bp to seed the rearrangement (Figure 5B). These nucleotides were chosen because the resulting CG/GU/AU bp would produce a significantly stronger kissing-complex than those composed of only GU/AU bp, analogous to the 2-bp kissing complex that drives Moloney murine leukemia virus (MMLV) genome dimerization (Zhu et al., 2013). The kissing loop was not able to form in all simulations of this pathway, even when each simulation was extended multiple times for 100 ns and the strength of the long-range restraints were doubled (Figure 5E). The mismatch in length of the two helical segments effectively prevents the bases from forming hydrogen bonds in the pre-transition secondary structure.
Finally, the late-toehold pathway assumes that bases 106–108, predicted to be in an unpaired strand at the 3′ tail of the RNA at the base of H3, initially pair with bases 9–11 in the H1 loop and form a “toehold” interaction (Figure 5C, SI Movie 3). The initial toehold contacts were found to reliably form in 6/8 attempts as the 3′ tail of the nascent RNA is flexible and long enough to reach the loop of H1 (Figure 5E). All simulations that formed the initial toehold contacts proceeded through the refolding pathway to the 110-nt structure.
A decisive advantage of the toehold mechanism is the favorability of the strand exchange process that proceeds in a break-one-form-one bp manner. Once identified as a plausible mechanism, we realized that this toehold-mediated strand-displacement can also be initiated earlier in the folding trajectory before H3 forms (Figure 5D). Simulations of the “early toehold” indicate that the absence of H3 actually speeds up the rearrangement due to the greater flexibility of the longer single-stranded 3′ tail, the lack of an energetic barrier posed by H3 (Figure 5D), and the increased number of bases available to form the initial toehold. Thus, the toehold-mediated strand-displacement mechanisms are much more plausible than the other pathways considered.
A detailed examination of the productive toehold-mediated folding pathways reveals several key architectural features that facilitate the rapid folding transition (SI Movie 3). Extension of the initial toehold-seeding interaction to the full rearrangement requires fluctuations from the 11-nt loop of H1 into the stem (Figure 6C). H3, which is weaker than the GC-rich H1, readily unfolds in the simulations after the first few bp are formed, and the resulting increase in single-strandedness further facilitates flexibility in hybridization with the H1 loop (Figure 6D). In addition, the formation of C7-G110 and C8-G109 bp requires unraveling of the top of H1’s stem, which is facilitated by fluctuations of the GU bp. Only after C7-G110 and C8-G109 are formed is the H1 hairpin weak enough to open up, allowing the remaining bp of the native helix to align and zip-up in an energetically downhill process to form the fully extended fold (Figure 6B).
The results described above suggested that the SRP RNA U21C mutant minimizes the ability of H1 to fluctuate, disabling this mutant to efficiently rearrange during transcription. To directly test this hypothesis, we performed simulations of the SRP RNA U21C mutant and found that the toehold can still form between bases 7–110 and 8–109 when restraints were applied, but the mutant cannot transition into the final folded state because of the increased stability of H1 (Figure 6E, Figure 5E). The folding transition still stalled even when double-strength restraints were applied as these were insufficient to disrupt the G7-C21 bp. Finally, simulations of the rescue mutant (U21C, C22U, G93A) confirm that restoring flexibility in the upper stem of H1 recovers the ability to transition to the mature fold, albeit at a slower rate due to the extra bp that needs to be disrupted to unfold H1 (Figure 6F, Figure 5E, SI Movie 4).
Overall, our simulations strongly suggest a toehold-mediated strand-displacement rearrangement mechanism that is facilitated by bp fluctuations within the stem of H1.
Addition of the precursor sequence to the SRP RNA does not impact rearrangement
We next investigated how cotranscriptional RNA folding could affect the precursor SRP RNA and its processing by RNase P. The precursor SRP (pre-SRP) RNA contains a 5′ 24-nt leader sequence which is thought to contain a small hairpin (Figure 7A) (Peck-Miller and Altman, 1991). Interestingly, this precursor hairpin is predicted to fold independently when appended to the shorter SRP RNA lengths that fold into H1, and together form a potential RNase P substrate. We therefore tested if such partial pre-SRP RNA sequences can be processed by RNase P.
Figure 7. Processing and folding of the pre-SRP RNA.

(A) E. coli RNase P cleaves the 24+24 pre-SRP RNA correctly at the expected site (arrow). The OH and T1 ladders were generated by alkaline lysis and RNase T1 cleavage, respectively, of the 24+70 pre-SRP RNA. The cleaved 5′ leader (blue) migrated with length G25, instead of length U24, because it has a 3′-OH compared to the 2′,3′-cyclic phosphate in the RNase T1 products. The additional phosphate in the T1 ladder RNAs offsets the RNase P product by approximately one nucleotide. (B) A representative gel of the time-course assay used to determine the rate of cleavage of the 24+24 pre-SRP RNA by E. coli RNase P. The initial velocities were calculated from three replicates and the maximal cleavage did not exceed 5% of the total substrate. A turnover number of 5.4 ± 0.5 min−1 was obtained from these measurements. SC, substrate control incubated without E. coli RNase P. (C) The hairpin in the 5′ leader (blue) does not impede the toehold initiation (yellow) in R2D2 3D simulations. (D) The hairpin in the 5′ leader also does not affect the toehold-mediated rearrangement. See also Figure S5 and SI Movie 5–7.
For use as a representative substrate, we generated by in vitro transcription a pre-SRP RNA (termed 24+24) with the 24-nt leader and the first 24 nt of the mature SRP RNA. Compared to the full-length pre-SRP RNA and pre-tRNAs, the 24+24 pre-SRP RNA substrate differs in two aspects (Figure 7A). First, it has only five bp in the H1 stem, which is shorter than the typical 7-bp acceptor stem of pre-tRNAs, and much shorter than the long stem in the full-length pre-SRP RNA. Second, this short substrate has a 2-nt 3′-CA terminus, compared to the 3′-CCC of the full-length pre-SRP RNA and the 3′-CCA of pre-tRNAs. Despite these differences, the 24+24 pre-SRP RNA was efficiently cleaved by in vitro reconstituted E. coli RNase P (Figure 7A,B). Since a Km of 0.2 μM was calculated for the processing of full-length pre-SRP RNA by E. coli RNase P (Peck-Miller and Altman, 1991), we tested the rate of cleavage of the 24+24 pre-SRP RNA at 2.5 μM to ensure saturation. Our results yield a turnover number of 5.4 min−1 for the 24+24 pre-SRP RNA, compared to 37 min−1 reported for the full-length counterpart (Peck-Miller and Altman, 1991).
That the 24-nt leader sequence of the E. coli pre-SRP RNA could be cleaved both post- and co-transcriptionally motivated us to examine the effect of the leader sequence on the toehold-mediated strand-displacement mechanism. Additional all-atom simulations were conducted with the 24-nt leader sequence and its hairpin added, which was found not to interfere with the toehold-mediated rearrangement exhibited by the leaderless sequence. In one replicate of the pre-SRP RNA simulations, we observed the order of bp displacing H1 stem to be U21-A94, G25-C90, C24-G91, C23-G92, C22-G93. This finding alludes to the possibility of an ensemble of cotranscriptional folding pathways. Additionally, the U21C mutation (now U42C in pre-SRP RNA) still abrogated toehold-mediated strand displacement, and rescued with the addition of C22U and G93A (now C43U, G114A) mutations in simulations.
Discussion
We developed R2D2 to reconstruct nascent RNA folding at high resolution. Our R2D2 analysis of the SRP RNA reveals that although excursions to non-native structures could entail kinetic traps, they may also present a low free-energy path to the final native fold by minimizing structural fluctuations, as revealed here by R2D2 analysis of the SRP RNA. While ribosomal proteins have been shown to modulate rRNA dynamics and therefore the conformational ensemble (Kim et al., 2014), it appears that the same physical principles might help naked cellular RNAs traverse through non-native structures during transcription.
R2D2’s secondary structure approach builds on elements in previous RNA folding algorithms but is distinctive in its use of multi-scale modeling to reconstruct out-of-equilibrium folded states along a cotranscriptional folding pathway. Thus, R2D2 is different from MFE prediction methods, which would not uncover the importance of H1 flexibility because of H1’s stability in the SHAPE-directed MFE folding pathway (Figure S3, SI Movie 1). Specifically, the timescale of cotranscriptional folding invalidates the frequently used assumption of equilibrium RNA structural states at each nascent RNA length, making R2D2’s combination of experimental data and sample-and-select a promising approach. In this regard, the secondary structure aspect of R2D2 is similar to the recent SLEQ (Li and Aviran, 2018) and Rsample (Spasic et al., 2017) methods, although the latter are able to additionally estimate population levels of certain RNA structures. Overall, R2D2’s merging of multi-scale modeling with experimental data distinguishes it from previous computational methods to study cotranscriptional RNA folding.
We focused our studies on a particular three helix-containing intermediate structure in the SRP RNA cotranscriptonal folding pathway. Using R2D2, we propose that this three-helix structure can efficiently rearrange into a single extended helix through a toehold-mediated strand-displacement mechanism, even while recognizing that alternative folding pathways are possible due to the stochastic nature of RNA folding. Even within toehold-mediated mechanisms, multiple toehold-initiation points and rearrangements starting from eH3 or other 3′ structures are possible, suggesting various routes to attain the native fold even while centered around a key decision point. The large size of the H1 loop could be important for the increased flexibility of these bases for toehold nucleation as well as exposing a large sequence target to capture the many alternate transient 3′ end structures.
Overall, it could be that the SRP RNA has evolved to allow multiple toehold-mediated strand-displacement mechanisms to prevent the kinetic folding trap imposed by H1 and H3, which were previously identified as potential transient helices that are evolutionarily conserved (Zhu et al., 2013). Recently, it has been shown that many natural RNAs contain long-range interactions in the cell, some of which occur over 1kb away (Lu et al., 2016). Given the propensity of RNAs to form local structures cotranscriptionally, toehold-mediated strand-displacement could be one of the most efficient ways for RNAs to undergo large-scale rearrangements. Detailed in vitro studies of toehold strand-displacement reactions have demonstrated rates on the order of 106/M/s for a bimolecular strand-exchange reaction (Šulc et al., 2015; Zhang and Winfree, 2009). In addition, the elementary steps of strand exchange can be inferred to occur on the μs timescale, orders of magnitude faster than the ms timescales of nucleotide incorporation during transcription (Roberts et al., 2008). Intriguingly, to the best of our knowledge, the observation of this mechanism within the E. coli SRP RNA cotranscriptional folding pathway is the first observation of toehold-mediated strand-displacement in a naturally-derived RNA sequence.
The high evolutionary conservation of the GU wobble bp in many RNAs that participate in key cellular processes has been rationalized by the unique chemical and structural properties of this bp (Varani and McClain, 2000). As exemplified in this study, the context-dependent, conformational “softness” of the H1 GU bp may additionally allow it to act as a tripwire that triggers structural transitions of non-native to native states. Interestingly, U21 in this study is conserved in small bacterial SRP RNAs (Kalvari et al., 2017), and follow-up studies could assess if conservation of other GU bp structural intermediates are important for cotranscriptional rearrangement.
While this manuscript was being prepared, an independent study of the cotranscriptional folding pathway of the same E. coli SRP RNA sequence was performed using single-molecule optical tweezers (Fukuda et al., 2019). This study revealed several structural features consistent with our findings including the formation of H1, the formation of H3 (e.g. denoted as H4 in that study), and the effect of the U21C mutation (U18C in that study) on the folding pathway. Fukuda et al. also document ‘hopping dynamics’ near the major rearrangement, consisting of large-scale fluctuations in RNA end-to-end distances. Based on our findings, these hopping dynamics could stem from the molecular search for toehold-seeding interactions, or strand-displacement attempts that open structural elements before rearrangement. These two complementary studies highlight the power of combining orthogonal approaches to gain a deeper and more complete mechanistic view of cotranscriptional RNA folding.
A fascinating question in biology pertains to how RNAs efficiently fold into functional states and exit the kinetic traps imposed by the polarity and timescale of cotranscriptional folding in the cell. While a plethora of other interactions and processes in vivo could facilitate these structural rearrangements, it is possible that many cellular RNAs share the principles of the rearrangement pathways studied here for the E. coli SRP RNA to arrive at their respective final structure. Our demonstration of how a change in the identity of a single-nucleotide alters the folding trajectory also hints at how simple genetic changes could have spawned new functions in the early RNA world.
Limitations
R2D2 has several limitations, some of which are inherent in the underlying algorithms used to sample possible structures. Specifically, there are currently no efficient methods to sample RNA structures with pseudoknots, non-canonical base pairs, or RNA-ligand/RNA-protein interactions (Ding et al., 2004; Tan et al., 2017). Structures that can be efficiently sampled are biased to the equilibrium Boltzmann distribution, which we try to overcome by sampling 150,000 states at each RNA length instead of the more commonly used 1,000–10,000 (Kutchko et al., 2015; Li and Aviran, 2018; Ouyang et al., 2013) (Figure S1). While all-atom molecular dynamics was used to connect selected secondary structural states, it is inefficient to connect all possible sets of states together to reconstruct a full dynamic cotranscriptional folding pathway.
STAR Methods
Resource Availability
Lead Contact
Further information and requests for resources and reagents should be directed to and will be fulfilled by the Lead Contact, Julius Lucks (jblucks@northwestern.edu).
Materials Availability
The E. coli SRP RNA plasmid used in this study will be available through Addgene ID 162240.
Data and Code Availability
The mutant cotranscriptional and equilibrium-refolded SHAPE-seq datasets generated during this study are available through the Small Read Archive (SRA) under BioProject PRJNA667733. Wildtype SRP RNA data are similarly available through the SRA with accession codes: SRX2159310, SRX2159311, SRX2159312, and SRX2159316. Processed SHAPE-seq reactivity files generated in this study will be deposited in the RNA Mapping Database under accession codes SRPU21C_BZCN_0001, SRPU21C_BZCN_0002, SRPU21C_BZCN_0003, SRPU21C_BZCN_0004, SRPU21C_BZCN_0005, SRP21CR_BZCN_0001, SRP21CR_BZCN_0002, and SRP21CR_BZCN_0003. All source code will be freely available at https://github.com/LucksLab/R2D2. For a single round 2D folding pathway prediction with 2 processors, the walltime used is around 4 hours and used around 26 GB memory. We run this 100 times before analyzing all 100 results. The 3D folding simulations of the SRP precursor went for 48 ns using 9 synchronous replicas at different temperatures and restraint strengths. Each replica took 142 hours (−5.9 days) using an entire STAMPEDE-2 Intel Xeon Phi 7250 node. Thus, the experiment took altogether 1,275 node-hours (or 53 node-days) for the one folding simulation. Each of the other pathways examined used comparable resources.
Method Details
Cotranscriptional and equilibrium-refolded SHAPE-seq
The SRP RNA sequence used to generate mutants was previously described (Watters et al., 2016a); it has an AUC sequence substituting the 24-nt leader. DNA templates for cotranscriptional SHAPE-seq were prepared as previously described (Watters et al., 2016a). DNA templates specifically targeted transcript lengths 101 to 136 for U21C and U21C, C22U, G93A mutants. Cotranscriptional SHAPE-seq experiments were performed as previously described, except that EcoRIE111Q was included at 800 nM during in vitro transcription instead of 500 nM.
RNase P assay
The 24+24 pre-SRP RNA used to examine co-transcriptional processing was generated by run-off in vitro transcription (IVT). The template for this IVT was obtained by annealing two overlapping DNA oligonucleotides 4.5S-F and 4.5S-R (Sigma-Aldrich) followed by filling-in with Phusion DNA polymerase (NEB) to obtain a double-stranded DNA that included a T7 promoter upstream of the RNA coding sequence. A portion of the transcribed 24+24 pre-SRP RNA was 5′-radiolabeled by dephosphorylating with calf intestinal phosphatase (NEB) and then phosphorylated with [γ−32P]-ATP (PerkinElmer) using polynucleotide kinase (NEB). To determine the cleavage efficiency of the 24+24 pre-SRP RNA by RNase P, E. coli RNase P was reconstituted in vitro using recombinant M1 RNA and C5 protein (Gopalan et al., 1997). In vitro transcribed M1 RNA (2 μM) was refolded in water at 50°C for 50 min, then 37°C for 10 min. An equal volume of 2x folding buffer [20 mM HEPES (pH 7.5), 800 mM NH4OAc, 20 mM Mg(OAc)2, 10% glycerol, 0.02% IGEPAL] was added, and incubation at 37°C was continued for 30 min. C5 protein was overexpressed and purified from E. coli as described previously (Vioque et al., 1988) and was stored at −80°C. Before use, the refolded M1 RNA and C5 protein were diluted to 0.1 and 1 μM, respectively, in assay buffer [1x = 20 mM Tris-HCl (pH 8), 50 mM KCl, 5 mM MgCl2, 0.1 mM EDTA, 0.2 mg/mL BSA, 1 mM DTT]. This assay buffer resembles the one used in cotranscriptional folding experiments to mimic the same condition. All following incubations were performed at 37°C in a thermal cycler. For each 20-μL reaction, a mixture containing 6 μL water, 8 μL 2x assay buffer, and 2 μL of 1 μM C5 protein (final 100 nM) was incubated for 5 min before adding 2 μL of 0.1 μM M1 RNA (final 10 nM) and continuing incubation for 10 min. The reaction was initiated by adding 2 μL of the 24+24 pre-SRP RNA, where the final concentration (10 – 2,000 nM) was made up of the unlabeled RNA and a trace amount of the radiolabeled RNA. After each specified time interval, a 3-μL aliquot of the reaction was removed and quenched with 10 μL termination dye [7 M urea, 1 mM EDTA, 0.05% (w/v) each of bromophenol blue and xylene cyanol, 10% (v/v) phenol]. The products and uncleaved substrate were then separated on an 8% (w/v) polyacrylamide/7 M urea gel. The gels were visualized by phosphorimaging on the Typhoon (GE Healthcare), and bands were quantitated using ImageQuant (GE Healthcare). As ladders to map the cleavage site, a 24+70 pre-SRP RNA was generated by IVT with a template that was PCR-amplified from p23–4.5S (Peck-Miller and Altman, 1991) using primers 4.5S-F and 4.5S(70)-R. This RNA was then 5’-radiolabeled as described above and used to make the alkaline hydrolysis ladder and the RNase T1 (Invitrogen)-generated G-ladder.
Reactivity calculation
Quantification of reactivities from cotranscriptional SHAPE-Seq data was performed using Spats v.1.0.1 (http://luckslab.github.io/spats/) as previously described (Watters et al., 2016a). The θ reactivities output by Spats were converted to ρ reactivities to allow for direct comparison of SHAPE probe accessibility between intermediate lengths of RNAs (Watters et al., 2016b). For cotranscriptional predictions where RNA polymerase occludes the last ~14 nts from folding (Komissarova and Kashlev, 1998; Watters et al., 2016a), ρ reactivities were trimmed by 14 nts and renormalized such that the reactivities average to 1. This trimming was not done for equilibrium-refolded predictions because the RNAs have already emerged from the RNA polymerase.
DUETT
Detection of Unknown Events with Tunable Thresholds (DUETT) was used to detect reactivity change events in cotranscriptional and equilibrium-refolded SHAPE-Seq datasets (Xue et al., 2019). All analyses were done with optimized parameters with window sizes of 4 for U21C and 9 for U21C, C22U, G93A.
Reconstructing RNA secondary structures
The R2D2 sample-and-select method was first developed to predict the equilibrium fold of a single RNA using equilibrium SHAPE-Seq data. A crucial step was to establish a method to select structures that are most consistent with the experiment. SHAPE-Seq reactivities, ρ, are values ≥ 0 that reflect the structural state of each nucleotide: ρ = 0 corresponds to a nucleotide that is present in a structured context (such as a base pair or stacking interaction), while ρ > 1 represents a nucleotide that is present in a flexible context (such as an unpaired region) (Bindewald et al., 2011). Thus ρ values most naturally correspond to a representation of the un-paired state of each nucleotide in an RNA secondary structure, which can be represented by a binary vector (u for ‘un-paired’) containing 0 if a nucleotide is paired and 1 if a nucleotide is un-paired (Figure 1C). Comparison between the ρ vector of reactivity data at a specific transcript length, and the u vector for a specific structure that could occur at that length can then be made with a metric that reflects their distance from each other (Figure 1C, Table S1).
We developed and tested six functions to calculate the distance between a SHAPE-seq reactivity spectra and a given RNA secondary structure (Figure 1C, Table S1). Each distance function is of the form
where is a vector calculated from the u-vector of a specific RNA secondary structure, and is calculated from the experimental SHAPE-seq reactivity data ρ vector. Reactivity is inherently a measure of accessibility of chemical probes in RNA structures, and low reactivity may not be due only to base pairing, but can be caused by other structural constraints such as stacking (Bindewald et al., 2011). To account for this possibility, we incorporated a weighting between single-stranded and paired bases in sampled structures, α, which is used to adjust the contribution to the distance from positions that are predicted to be paired.
Since unpaired vectors and ρ vectors are different types of data (binary vs. continuous) and on different numerical scales, we explored three different ways to calculate their differences specified by K, U and D, which specify the way and are calculated:
K keeps the scale of and , U makes ‘s average 1 which is a property of , and D scales to be between 0 and 1. Since certain RNA folds can result in ρ values that are much larger than one (McGinnis et al., 2012), we also explored ways to cutoff ρ values at a maximum value. This is specified by the indices cap or nocap which determine the way is calculated, with cap denoting that ρi is capped at a ρmax value and and nocap referring that the original ρi value is used. The full definitions are as follows:
The distance metrics above can be used to select structures from a candidate set that are most consistent with the observed experimental reactivity data by choosing the minimum distance structure(s) at every length (Figure 1C). To generate a candidate set of structures, the sample method statistically samples structures with a large sample size using the partition and stochastic functions of the RNAstructure suite of computational secondary structure prediction tools (Reuter and Mathews, 2010). The partition method takes as an input the RNA sequence and folding parameters, and uses them to calculate the secondary structure partition function for that sequence. The stochastic method then uses this partition function to stochastically generate RNA structures according to their equilibrium Boltzmann probabilities – i.e. lower free energy structures are generated more frequently than higher free energy structures. Thus repeated application of the stochastic method can generate a set of possible candidate structures the RNA molecule may sample during the experiment.
The goal of the sample method is to generate the greatest amount of structural diversity possible to allow more choices for the select method. An initial test of the degree to which the stochastic method can generate novel structures revealed that the method did not converge on exhausting the possibilities of different RNA structures even after 150,000 structures were drawn (Figure S1). This is not surprising since the free energy landscapes of RNA secondary structures are known to have a shallow density of states near the minimum free energy structure (Chen and Dill, 2000) indicating there are many possible RNA structures that are low in free energy and would be sampled frequently by the stochastic method. To circumvent this problem and still generate a diverse array of candidate structures without the computational burden of generating millions of structures, we employed two additional variations of the sampling procedure that used experimental SHAPE restraints to calculate a modified partition function from which we could sample. The first, called SHAPE-directed sampling, used the partition method’s ability to incorporate SHAPE reactivities as effective free energy terms in the partition function calculation with pseudofree energy parameters m = 1.1 and b = −0.3. The second, called SHAPE-forced sampling, used a SHAPE reactivity cutoff, ρc, to force nucleotides with reactivities greater than this value to be single-stranded in the partition function calculation. In total, the sample method consisted of sampling 50,000 structures from each of these methods for a total of 150,000 structures which acted as the candidate set for the select method. We note that even though the sample method uses SHAPE reactivity data to generate part of the candidate set, these are not guaranteed to be chosen as most consistent with the data by the select method. Rather, they are included to increase the diversity of the candidate set.
Software implementing this method were run with Python 2.7.12 through Anaconda 2.4.1 (64-bit) and R version 3.2.2. Images and movies were made with ffmpeg version 3.1.3, ImageMagick 7.0.3–0 Q16 ×86_64, and iMovie v10.1.2. Version 5.8.1 of RNAstructure was used for the partition and stochastic methods, and VARNA version 3.9 was used to visualize RNA secondary structures. See “Data and Software Availability” for location of code used in this study.
Benchmarking
Best parameter values were determined through a grid search of 10,404 parameter sets: all combinations of 0.7 to 4.1 by 0.1 for ρc, 0.7 to 4.1 by 0.1 for ρmax, and 0 to 1 by 0.1 for α. The best parameter set(s) was determined as the parameter set(s) with the largest sum of F1 scores (F-scores) for 18 previously published equilibrium-refolded SHAPE-Seq datasets on 6 RNAs of known crystal structures (three replicates) and no pseudoknots since RNAstructure cannot sample structures with pseudoknots (Loughrey et al., 2014). F-score is defined as follows:
For every parameter set, we sampled 50,000 structures for each of the three sampling methods, for a total of 150,000 structures (see “Reconstructing RNA secondary structures”). For each benchmark RNA and dataset, the minimum distance structure was calculated and F-score determined from the prediction and the known structure. The sum of F-scores across the panel of RNAs and datasets was then reported for that parameter set. If multiple minimum distance structures were found, then the average of their sum of F-scores were used to find the best parameter set. We ran the benchmarking for each of the 6 distance equations. ρmax is not used when no reactivity capping is used, so only 306 parameter sets were tested in these cases.
We found two different metrics were the best performing across all distance functions: DK,cap with ρc = 3.5, ρmax = 1.0 or 0.9, and α = 0.8 as well as DD,cap with ρc = 3.5, ρmax = 1.0, and α = 0.8. These two each had an average F-score of 86.32% for the 18 RNA datasets in the panel (Table S1). From this set, we chose as our parameter set DK,cap with ρc = 3.5, ρmax = 1.0, and α = 0.8, which gives a higher weight to paired positions in the sampled structures as expected, and matches common interpretations of ‘high’ reactivity values being greater than 1. We note that this is mathematically equivalent to DK,cap’s best parameter set.
We also compared the best results from the sample-and-select method to SHAPE-restrained secondary structure predictions using the same data on the same RNA panel using the Fold method of RNAstructure (Table S2). In aggregate, the sample-and-select method (average F-score of 86.32%) does not perform better than RNAstructure-Fold with SHAPE restraints (average F-score of 88.95%), but does perform better than RNAstructure-Fold without SHAPE restraints (average F-score of 77.51%). Interestingly R2D2’s sample-and-select method did outperform on the E. coli TPP riboswitch in terms of sensitivity, PPV, and F-score for all replicates (Table S2). While the accuracy of our sample-and-select method applied to equilibrium RNA structure prediction is not overall better than the best equilibrium structure prediction algorithms given the same data, it was designed to find RNA secondary structures consistent with structural probing data from out-of-equilibrium RNA folds and thus can be used to reconstruct a complete secondary structure cotranscriptional folding pathway of an RNA.
To increase PPV for more accurate 3D simulations, R2D2 filters base pairs and reduces overall positive calls compared to RNAstructure-Fold; 2D sampling is run 100 times and only pairs that occur over 50% of the time are kept and then used in the 3D simulations. We assessed this filtering step (which we call R2D2-consensus) using the benchmark panel (Supplementary Table S2). Both R2D2-consensus and RNAstructure-Fold with SHAPE perform better than RNAstructure-Fold with no SHAPE. The counts across true positives (TP), false negatives (FN), false positives (FP), and true negatives (TN) between R2D2-consensus and RNAstructure-Fold with SHAPE are statistically significant different at the 0.05 value (p-value 0.001) by multivariate 2-sample E-test of equal distributions (Supplementary Table C-3). As expected, R2D2-consensus disfavors calling positive base pairs compared to RNAstructure-Fold with SHAPE: R2D2-consensus predicts 478 base pairs across the whole panel compared to 522 base pairs by RNAstructure-Fold with SHAPE. Importantly, R2D2-consensus, which is the first filter of positive base pairs out of two in the R2D2 algorithm, has a reduced number of FP’s when compared to RNAstructure-Fold with and without SHAPE data. R2D2-consensus also has a lower standard deviation in sensitivity, PPV, and F-score compared to RNAstructure-Fold.
However, based on the Sensitivity, PPV, and F-score metrics alone, there is no statistical difference in performance in any of these three metrics between RNAstructure-Fold with SHAPE and R2D2-consensus using paired t-test (Supplementary Table C-4). Interestingly Sensitivity, PPV, and F-score are calculated based on TP, FN, and FP counts, and there is a difference in statistical significance when examining the same prediction results at different representation levels.
Software implementing this method were run with Python 2.7.11 through Anaconda 2.3.0 (64-bit). Version 5.6 beta of RNAstructure was used for the partition and stochastic methods, and VARNA version 3.9 was used to visualize RNA secondary structures. See “Data and Software Availability” for location of code used in this study.
Application to cotranscriptional SHAPE-Seq data
We applied the method described in “Reconstructing RNA secondary structures” to each length of cotranscriptional SHAPE-Seq data available with the parameter set found in “Benchmarking”. Lengths where total mapped read counts are less than 2,000 were not used in R2D2 predictions. For each structure predicted, free energies were calculated using RNAstructure-efn2.
Software implementing this method were run with Python 2.7.12 through Anaconda 2.4.1 (64-bit) and R version 3.2.2. Images and movies were made with ffmpeg version 3.1.3, ImageMagick 7.0.3–0 Q16 ×86_64, and iMovie v10.1.2. Version 5.8.1 of RNAstructure was used for the partition, stochastic, efn2, and ct2dot methods. RNAbows was used to visualize R2D2 2D predictions (Aalberts and Jannen, 2013). See “Data and Software Availability” for location of code used in this study.
Minimum free energy folding pathway prediction
Each length of the SRP RNA sequence was folded with RNAstructure-Fold method without SHAPE restraints to generate the minimum free energy folding pathway. Images of the minimum free energy structures were made into a movie with RNAstructure-draw and ffmpeg. Free energy calculations were done with RNAstructure-efn2. The SHAPE-directed MFE folding pathway prediction was done similarly, but with ρ reactivities and m = 1.1 and b = −0.3 (Loughrey et al., 2014) for lengths where SHAPE data was available in specified datasets.
Software implementing this method were run with Python 2.7.12 through Anaconda 2.4.1 (64-bit). Images and movies were made with ffmpeg version 3.1.3, ImageMagick 7.0.3–0 Q16 ×86_64, and iMovie v10.1.2. Version 5.8.1 of RNAstructure was used for the Fold method to predict MFE structures. See “Data and Software Availability” for location of code used in this study.
KineFold predictions
KineFold cotranscriptional folding pathway predictions were performed using the KineFold executable with ‘co-transcriptional fold’ with a new base added every 20 ms, no pseudoknots, and freely crossing entanglements. KineFold executable was used and can be downloaded from: http://kinefold.curie.fr/download.html. For each structure in KineFold’s .rnm output, the free energy was calculated using RNAstructure-efn2. KineFold simulations were also performed with 40 s total simulation time to test if the RNAP roadblocking strategy in cotranscriptional SHAPE-seq (30 seconds of transcription followed by SHAPE probing) explains differences between R2D2 and KineFold. See “Data and Software Availability” for location of code used to run KineFold and analyze .rnm output.
Using R2D2 predictions to inform all-atom folding pathway simulations
To assess the feasibility of the different hypothetical folding pathways in the full three-dimensional context of the folded RNA, the R2D2 secondary structures were used to restrain all-atom molecular dynamics simulations of each proposed transition pathway. Base-pair constraints for the pre- and post-folding transition were defined using the consensus (base pairs that occur in ≥ 50% of the 100 iterations) R2D2 secondary structures at length 109 and 110 nt respectively. To avoid over-constraining the simulation, only those base-pairs that occurred in over 50% of the reconstructions were enforced with explicit folding restraints. It should be noted that non-restrained bases can still form base-pairs according to the all-atom energy potential. While all pathways start from the same 109-nt folding intermediate (Figure 2F, Figure 5A,B,C,D), each pathway then dictates a unique order in which the base pairing pattern must rearrange to arrive at the final 110-nt native fold (Figure 2G). All-atom simulations employed the GROMACS 2016 software package (Abraham et al., 2015), using the Amber-99 force field (Wang et al., 2000) with Chen-Garcia modifications for RNA bases (Chen and García, 2013), the modifications of Case and co-workers for the backbone phosphate (Steinbrecher et al., 2012), the TIP4P-EW water model (Horn et al., 2004), and the Joung & Cheatham parameters for potassium chloride ions (Joung and Cheatham, 2008).
Simulations employed truncated dodecahedral boxes of ~15 nM radius, containing the 110 base RNA, 74,428 TIP4P-EW H2O’s, 1,559 K+ and 1,450 Cl− ions to mimic 1M excess salt conditions to give a total of 304,265 atoms. Long-range interactions beyond 10 Angstroms were calculated using PME with a grid size of 0.16 nm. A constant pressure of 1 atm was maintained using the Berendsen barostat (Berendsen et al., 1984) with a time constant of 1.0 ps, and a constant temperature of 450K was maintained using the V-rescale thermostat (Bussi et al., 2007) with a time constant of 0.1 ps. The leapfrog Verlet integrator with a 2-fs timestep was used, with the total production length of each simulation being 100–500 ns, leading to a cumulative total of >5 μs of simulations.
Base-pairs were restrained using a piecewise flat-bottomed harmonic restraint of strength 0.5 kcal/mol between central H-bond donor/acceptor of natively paired bases. This restraint becomes linear at distances greater than 4 Angstroms. The strength and distance dependence of the restraints was chosen to be strong enough to facilitate formation of long-range interactions in ~100 ns simulations, but not strong enough to significantly unfold other sections of the RNA in the process. Elevated temperatures were used to increase RNA flexibility and decrease the amount of computational time needed to sample each proposed transition pathway. This arrangement ensured that individual folding attempts would simply stall if two restrained bases could not physically get close enough to form a new basepair in the 3D context of each folding intermediate.
The 110-nt RNA chain was initially equilibrated until all base pairs observed in >50% of the stable folding intermediate (109 nt R2D2 2D prediction) were stably formed. At this point, new restraints from the 110-nt natively folded transcript were added 2–3 base-pairs at a time. Each new set of restraints were simulated at least 10 ns until they were successfully formed, at which point the next set of new restraints were added. This cycle was repeated until all bases were successfully paired in the RNA’s native fold. Simulations that had still not achieved any new base-pairs within 5 successive cycles (i.e., 50 ns) after adding restraints were considered “stalled” and not simulated any further. Eight separate attempts were made to simulate each of the 4 proposed pathways and two mutants studied. Each individual folding trajectory therefore ranged from 100–500 ns depending on stalling, and successful folding pathways exhibited at least 6/8 successfully folded trajectories while pathways deemed “unfeasible” always exhibited zero successful attempts.
Four potential folding pathways were simulated. In the “inside-out” pathway, the formation of the extended native helix proceeds by extending the predicted central helix along its axis, unraveling H1 and H3 during this progression, and eliminating the need for forming an initial long-range contact between the RNA ends (Figure 5A). In the “kissing loop” mechanism, it was proposed that complementary, unpaired loop bases within the H1 and H3 hairpins could form an initial long-range “kissing complex”, which could then seed formation of the hybrid helix in a strand rearrangement process (Figure 5B). This hypothesis is attractive because kissing-loop interactions are known to be rapid and stable ways to form long-range RNA interactions in RNA gene regulation and retroviral replication (Kolb et al., 2000; Paillart et al., 2004). A toehold strand exchange mechanism was also explored, in which the free 3′ end of the nascent RNA chain initially hybridizes with unpaired bases in the loop of H1, seeding a sequential unfolding pathway where strands of H1 and H3 are exchanged with each other to rehybridize into the final extended native helix (Figure 5C). Finally, we also explored the “early toehold” mechanism which could initiate at different exposed bases of H1 before H3 is fully formed (Figure 5D).
Quantification and Statistical Analysis
Cotranscriptional SHAPE-seq reactivities were quantified based on a statistical model using Spats v.1.0.1 (http://luckslab.github.io/spats/) as described in Reactivity calculation and as previously described (Watters et al., 2016a). The RNase P assay gels were visualized by phosphorimaging on the Typhoon (GE Healthcare), and bands were quantitated using ImageQuant (GE Healthcare) as described in RNase P assay and Figure S5G.
Supplementary Material
SI Movie 1.
R2D2 2D predictions with processed E. coli SRP RNA sequence cotranscriptional SHAPE-seq replicates (top) and equilibrium-refolded SHAPE-seq (bottom), Related to Figure 2. One hundred selected structures are represented as RNAbow plots with base pairs drawn as arcs and the arc width indicating prevalence of the base pair amongst the selected structures. Colored arcs show base pairs that are more frequent in either cotranscriptional (purple) or equilibrium (turquoise) predictions, while grey arcs show base pairs that are shared.
SI Movie 2
All-atom simulation of the inside-out proposed mechanism with strong forces added, Related to Figure 5. Refer to Figure 5A for RNA coloring.
SI Movie 3
All-atom simulation of the late toehold proposed mechanism, Related to Figure 5, 6. Refer to Figure 5C for RNA coloring. Gray coloring is used here for bases 30-83.
SI Movie 4
All-atom simulation of the U21C rescue mutant, Related to Figure 5. G7 and U21C are colored green, H1 is indicated in purple, H3 is colored magenta, rearranged base pairs are colored yellow, and remaining nucleotides are colored grey.
SI Movie 5
All-atom simulation of the late toehold proposed mechanism with the wt precursor E. coli SRP RNA, Related to Figure 7. The leader sequence (nts 1-24) is colored dark blue, H1 (nts 25-46) is colored purple, H3 (nts 111-130) is colored magenta, base pairs present in the mature fold are highlighted yellow, and the remaining bases are colored for visualization: nts 47-73 (orange), 74-83 (green), and 84-110 (turquoise),
SI Movie 6
All-atom simulation of the proposed late toehold-mediated strand rearrangement hindered by the U42C precursor E. coli SRP RNA, Related to Figure 7. The leader sequence (nts 1-24) is colored dark blue, H1 (nts 25-46) is colored purple, H3 (nts 111-130) is colored magenta, rearranged base pairs are highlighted yellow, and the remaining bases are colored for visualization: nts 47-73 (orange), 74-83 (green), and 84-110 (turquoise),
SI Movie 7
All-atom simulation of the late toehold proposed mechanism with the U42C rescue precursor E. coli SRP RNA, Related to Figure 7. Refer to Movie 6 for RNA coloring details.
KEY RESOURCES TABLE.
| REAGENT or RESOURCE | SOURCE | IDENTIFIER |
|---|---|---|
| Antibodies | ||
| Bacterial and Virus Strains | ||
| NEB Turbo Competent E. coli (High Efficiency) | New England Biolabs | Cat#C2984H |
| Biological Samples | ||
| NEB Turbo Competent E. coli (High Efficiency) | New England Biolabs | Cat#C2984H |
| Chemicals, Peptides, and Recombinant Proteins | ||
| Vent (exo-) DNA Polymerase | New England Biolabs | Cat#M0257S |
| Deoxynucleotide (dNTP) Solution Mix | New England Biolabs | Cat#N9447L |
| E. coli RNA Polymerase, Holoenzyme | New England Biolabs | Cat#M0551S |
| Gln111 (EcoRI E111Q Mutant) | Lab preparation | N/A |
| Ribonucleotide Solution Set | New England Biolabs | Cat#N0466 |
| Benzoyl Cyanide | Sigma-Aldrich | Cat#115959 |
| Dimethyl Sulfoxide | Sigma-Aldrich | Cat#276855 |
| TRIzol Reagent | Thermo Fisher | Cat#15596018 |
| Isopropyl alcohol | Sigma-Aldrich | Cat#I9516 |
| Chloroform | Sigma-Aldrich | Cat#C2432 |
| Sodium Acetate | Sigma-Aldrich | Cat#S2889 |
| Glycogen, RNA grade | Thermo Fisher | Cat#R0551 |
| Ethyl alcohol, pure | Sigma-Aldrich | E7023 |
| SuperScript III Reverse Transcriptase | Thermo Fisher | Cat#18080093 |
| CircLigase ssDNA Ligase | Lucigen | Cat#CL4111K |
| Phusion High-Fidelity DNA Polymerase | New England Biolabs | Cat#M0530L |
| GeneScan 500 LIZ Size Standard | Applied Biosystems | Cat#4322682 |
| E. coli C5 protein | Gopalan et al., 1997 | pBSC5 |
| T7 RNA polymerase | Lab preparation | pQE9T7 |
| ATP | Carbosynth | Cat# NA00135 |
| CTP | Carbosynth | Cat# NC03860 |
| GTP | Carbosynth | Cat# NG01208 |
| UTP | Carbosynth | Cat# NU03863 |
| Critical Commercial Assays | ||
| Deposited Data | ||
| Signal Recognition Particle RNA cotranscriptional SHAPE-Seq, Replicate 1 | Watters et al., 2016a | SRX2159310 |
| Signal Recognition Particle RNA cotranscriptional SHAPE-Seq, Replicate 2 | Watters et al., 2016a | SRX2159311 |
| Signal Recognition Particle RNA cotranscriptional SHAPE-Seq, Replicate 3 | Watters et al., 2016a | SRX2159312 |
| Signal Recognition Particle RNA equilibrium-refolded SHAPE-Seq | Watters et al., 2016a | SRX2159316 |
| U21C Signal Recognition Particle RNA cotranscriptional SHAPE-Seq | This paper | PRJNA667733 |
| U21C Signal Recognition Particle RNA equilibrium-refolded SHAPE-Seq | This paper | PRJNA667733 |
| U21C, C22U, G93A Signal Recognition Particle RNA cotranscriptional SHAPE-Seq | This paper | PRJNA667733 |
| U21C Signal Recognition Particle RNA cotranscriptional SHAPE-Seq reactivities, Replicate 1 | This paper | SRPU21C_BZCN_0001 |
| U21C Signal Recognition Particle RNA cotranscriptional SHAPE-Seq reactivities, Replicate 2 | This paper | SRPU21C_BZCN_0002 |
| U21C Signal Recognition Particle RNA cotranscriptional SHAPE-Seq reactivities, Replicate 3 | This paper | SRPU21C_BZCN_0003 |
| U21C Signal Recognition Particle RNA equilibrium-refolded SHAPE-Seq reactivities, Replicate 1 | This paper | SRPU21C_BZCN_0004 |
| U21C Signal Recognition Particle RNA equilibrium-refolded SHAPE-Seq reactivities, Replicate 2 | This paper | SRPU21C_BZCN_0005 |
| U21C, C22U, G93A Signal Recognition Particle RNA cotranscriptional SHAPE-Seq reactivities, Replicate 1 | This paper | SRP21CR_BZCN_0001 |
| U21C, C22U, G93A Signal Recognition Particle RNA cotranscriptional SHAPE-Seq reactivities, Replicate 2 | This paper | SRP21CR_BZCN_0002 |
| U21C, C22U, G93A Signal Recognition Particle RNA cotranscriptional SHAPE-Seq reactivities, Replicate 3 | This paper | SRP21CR_BZCN_0003 |
| Experimental Models: Cell Lines | ||
| Experimental Models: Organisms/Strains | ||
| Oligonucleotides | ||
| tttttttgaattcGACCTGACCTGGTAAACAGA | IDT | EJS_F01_wt_ER1_55. |
| tttttttgaattcGGACCTGACCTGGTAAACAG | IDT | EJS_F02_wt_ER1_56. |
| tttttttgaattcCGGACCTGACCTGGTAAACA | IDT | EJS_F03_wt_ER1_57. |
| tttttttgaattcCCGGACCTGACCTGGTAAAC | IDT | EJS_F04_wt_ER1_58. |
| tttttttgaattcTCCGGACCTGACCTGGTAAA | IDT | EJS_F05_wt_ER1_59. |
| tttttttgaattcTTCCGGACCTGACCTGGTAA | IDT | EJS_F06_wt_ER1_60. |
| tttttttgaattcCTTCCGGACCTGACCTGGTA | IDT | EJS_F07_wt_ER1_61. |
| tttttttgaattcCCTTCCGGACCTGACCTGGT | IDT | EJS_F08_wt_ER1_62. |
| tttttttgaattcTCCTTCCGGACCTGACCTGG | IDT | EJS_F09_wt_ER1_63. |
| tttttttgaattcTTCCTTCCGGACCTGACCTG | IDT | EJS_F10_wt_ER1_64. |
| tttttttgaattcCTTCCTTCCGGACCTGACCT | IDT | EJS_F11_wt_ER1_65. |
| tttttttgaattcGCTTCCTTCCGGACCTGACC | IDT | EJS_F12_wt_ER1_66. |
| tttttttgaattcTGCTTCCTTCCGGACCTGAC | IDT | EJS_F13_wt_ER1_67. |
| tttttttgaattcCTGCTTCCTTCCGGACCTGA | IDT | EJS_F14_wt_ER1_68. |
| tttttttgaattcGCTGCTTCCTTCCGGACCTG | IDT | EJS_F15_wt_ER1_69. |
| tttttttgaattcGGCTGCTTCCTTCCGGACCT | IDT | EJS_F16_wt_ER1_70. |
| tttttttgaattcTGGCTGCTTCCTTCCGGACC | IDT | EJS_F17_wt_ER1_71. |
| tttttttgaattcTTGGCTGCTTCCTTCCGGAC | IDT | EJS_F18_wt_ER1_72. |
| tttttttgaattcCTTGGCTGCTTCCTTCCGGA | IDT | EJS_F19_wt_ER1_73. |
| ttttttgaattcCCTTGGCTGCTTCCTTCCGG | IDT | EJS_F20_wt_ER1_74. |
| tttttttgaattcGCCTTGGCTGCTTCCTTCCG | IDT | EJS_F21_wt_ER1_75. |
| tttttttgaattcTGCCTTGGCTGCTTCCTTCC | IDT | EJS_F22_wt_ER1_76. |
| tttttttgaattcCTGCCTTGGCTGCTTCCTTC | IDT | EJS_F23_wt_ER1_77. |
| tttttttgaattcTCTGCCTTGGCTGCTTCCTT | IDT | EJS_F24_wt_ER1_78. |
| tttttttgaattcATCTGCCTTGGCTGCTTCCT | IDT | EJS_F25_wt_ER1_79. |
| tttttttgaattcCATCTGCCTTGGCTGCTTCC | IDT | EJS_F26_wt_ER1_80. |
| tttttttgaattcTCATCTGCCTTGGCTGCTTC | IDT | EJS_F27_wt_ER1_81. |
| tttttttgaattcGTCATCTGCCTTGGCTGCTT | IDT | EJS_F28_wt_ER1_82. |
| tttttttgaattcCGTCATCTGCCTTGGCTGCT | IDT | EJS_F29_wt_ER1_83. |
| tttttttgaattcGCGTCATCTGCCTTGGCTGC | IDT | EJS_F30_wt_ER1_84. |
| tttttttgaattcCGCGTCATCTGCCTTGGCTG | IDT | EJS_F31_wt_ER1_85. |
| tttttttgaattcaCGCGTCATCTGCCTTGGCT | IDT | EJS_F32_wt_ER1_86. |
| tttttttgaattcCaCGCGTCATCTGCCTTGGC | IDT | EJS_F33_wt_ER1_87. |
| tttttttgaattcaCaCGCGTCATCTGCCTTGG | IDT | EJS_F34_wt_ER1_88. |
| tttttttgaattcCaCaCGCGTCATCTGCCTTG | IDT | EJS_F35_wt_ER1_89. |
| tttttttgaattcGCaCaCGCGTCATCTGCCTT | IDT | EJS_F36_wt_ER1_90. |
| tttttttgaattcGGCaCaCGCGTCATCTGCCT | IDT | EJS_F37_wt_ER1_91. |
| tttttttgaattcCGGCaCaCGCGTCATCTGCC | IDT | EJS_F38_wt_ER1_92. |
| tttttttgaattcCCGGCaCaCGCGTCATCTGC | IDT | EJS_F39_wt_ER1_93. |
| tttttttgaattcCCCGGCaCaCGCGTCATCTG | IDT | EJS_F40_wt_ER1_94. |
| tttttttgaattcTCCCGGCaCaCGCGTCATCT | IDT | EJS_F41_wt_ER1_95. |
| tttttttgaattcATCCCGGCaCaCGCGTCATC | IDT | EJS_F42_wt_ER1_96. |
| tttttttgaattcCATCCCGGCaCaCGCGTCAT | IDT | EJS_F43_wt_ER1_97. |
| tttttttgaattcACATCCCGGCaCaCGCGTCA | IDT | EJS_F44_wt_ER1_98. |
| tttttttgaattcTACATCCCGGCaCaCGCGTC | IDT | EJS_F45_wt_ER1_99. |
| tttttttgaattcCTACATCCCGGCaCaCGCGT | IDT | EJS_F46_wt_ER1_100. |
| tttttttgaattcGCTACATCCCGGCaCaCGCG | IDT | EJS_F47_wt_ER1_101. |
| tttttttgaattcAGCTACATCCCGGCaCaCGC | IDT | EJS_F48_wt_ER1_102. |
| tttttttgaattcCAGCTACATCCCGGCaCaCG | IDT | EJS_F49_wt_ER1_103. |
| tttttttgaattcCCAGCTACATCCCGGCaCaC | IDT | EJS_F50_wt_ER1_104. |
| tttttttgaattcGCCAGCTACATCCCGGCaCa | IDT | EJS_F51_wt_ER1_105. |
| tttttttgaattcTGCCAGCTACATCCCGGCaC | IDT | EJS_F52_wt_ER1_106. |
| tttttttgaattcCTGCCAGCTACATCCCGGCa | IDT | EJS_F53_wt_ER1_107. |
| tttttttgaattcCCTGCCAGCTACATCCCGGC | IDT | EJS_F54_wt_ER1_108. |
| tttttttgaattcCCCTGCCAGCTACATCCCGG | IDT | EJS_F55_wt_ER1_109. |
| tttttttgaattcGCCCTGCCAGCTACATCCCG | IDT | EJS_F56_wt_ER1_110. |
| tttttttgaattcGGCCCTGCCAGCTACATCCC | IDT | EJS_F57_wt_ER1_111. |
| tttttttgaattcGGGCCCTGCCAGCTACATCC | IDT | EJS_F58_wt_ER1_112. |
| tttttttgaattcGGGGCCCTGCCAGCTACATC | IDT | EJS_F59_wt_ER1_113. |
| tttttttgaattcGGGGGCCCTGCCAGCTACAT | IDT | EJS_F60_wt_ER1_114. |
| tttttttgaattcTGGGGGCCCTGCCAGCTACA | IDT | EJS_F61_wt_ER1_115. |
| tttttttgaattcGTGGGGGCCCTGCCAGCTAC | IDT | EJS_F62_wt_ER1_116. |
| tttttttgaattcGGTGGGGGCCCTGCCAGCTA | IDT | EJS_F63_wt_ER1_117. |
| tttttttgaattcGGGTGGGGGCCCTGCCAGCT | IDT | EJS_F64_wt_ER1_118. |
| tttttttgaattcCGGGTGGGGGCCCTGCCAGC | IDT | EJS_F65_wt_ER1_119. |
| tttttttgaattcCCGGGTGGGGGCCCTGCCAG | IDT | EJS_F66_wt_ER1_120. |
| tttttttgaattcCCCGGGTGGGGGCCCTGCCA | IDT | EJS_F67_wt_ER1_121. |
| tttttttgaattcACCCGGGTGGGGGCCCTGCC | IDT | EJS_F68_wt_ER1_122. |
| tttttttgaattcGACCCGGGTGGGGGCCCTGC | IDT | EJS_F69_wt_ER1_123. |
| tttttttgaattcCGACCCGGGTGGGGGCCCTG | IDT | EJS_F70_wt_ER1_124. |
| tttttttgaattcCCGACCCGGGTGGGGGCCCT | IDT | EJS_F71_wt_ER1_125. |
| tttttttgaattcGCCGACCCGGGTGGGGGCCC | IDT | EJS_F72_wt_ER1_126. |
| tttttttgaattcTGCCGACCCGGGTGGGGGCC | IDT | EJS_F73_wt_ER1_127. |
| tttttttgaattcATGCCGACCCGGGTGGGGGC | IDT | EJS_F74_wt_ER1_128. |
| tttttttgaattcCATGCCGACCCGGGTGGGGG | IDT | EJS_F75_wt_ER1_129. |
| tttttttgaattcCCATGCCGACCCGGGTGGGG | IDT | EJS_F76_wt_ER1_130. |
| tttttttgaattcGCCATGCCGACCCGGGTGGG | IDT | EJS_F77_wt_ER1_131. |
| tttttttgaattcTGCCATGCCGACCCGGGTGG | IDT | EJS_F78_wt_ER1_132. |
| tttttttgaattcATGCCATGCCGACCCGGGTG | IDT | EJS_F79_wt_ER1_133. |
| tttttttgaattcGATGCCATGCCGACCCGGGT | IDT | EJS_F80_wt_ER1_134. |
| tttttttgaattcAGATGCCATGCCGACCCGGG | IDT | EJS_F81_wt_ER1_135. |
| tttttttgaattcGAGATGCCATGCCGACCCGG | IDT | EJS_F82_wt_ER1_136. |
| tttttttgaattcGGAGATGCCATGCCGACCCG | IDT | EJS_F83_wt_ER1_137. |
| tttttttgaattcTGGAGATGCCATGCCGACCC | IDT | EJS_F84_wt_ER1_138. |
| tttttttgaattcGTGGAGATGCCATGCCGACC | IDT | EJS_F85_wt_ER1_139. |
| tttttttgaattcGGTGGAGATGCCATGCCGAC | IDT | EJS_F86_wt_ER1_140. |
| tttttttgaattcAGGTGGAGATGCCATGCCGA | IDT | EJS_F87_wt_ER1_141. |
| tttttttgaattcGAGGTGGAGATGCCATGCCG | IDT | EJS_F88_wt_ER1_142. |
| tttttttgaattcGGAGGTGGAGATGCCATGCC | IDT | EJS_F89_wt_ER1_143. |
| tttttttgaattcAGGAGGTGGAGATGCCATGC | IDT | EJS_F90_wt_ER1_144. |
| tttttttgaattcGAGGAGGTGGAGATGCCATG | IDT | EJS_F91_wt_ER1_145. |
| tttttttgaattcCGAGGAGGTGGAGATGCCAT | IDT | EJS_F92_wt_ER1_146. |
| tttttttgaattcGCGAGGAGGTGGAGATGCCA | IDT | EJS_F93_wt_ER1_147. |
| tttttttgaattcCGCGAGGAGGTGGAGATGCC | IDT | EJS_F94_wt_ER1_148. |
| tttttttgaattcCCGCGAGGAGGTGGAGATGC | IDT | EJS_F95_wt_ER1_149. |
| tttttttgaattcCCGCGAGGAGGTGGAGATGC | IDT | EJS_F96_wt_ER1_150. |
| tttttttgaattcACCGCGAGGAGGTGGAGATG | IDT | EJS_F01_wt_ER1_55. |
| /5Phos/rCrUrGrArCrUrCrGrGrGrCrArCrCrArArGrGrA/3ddC/ | IDT | Linker |
| /5Biosg/gtccttggtgcccgagt | IDT | RT Primer |
| /5Phos/AGATCGGAAGAGCACACGTCTGAACTCCAGTCAC/3SpC3/ | IDT | A_Adapter_B |
| AATGATACGGCGACCACCGAGATCTACACTCTTTCCCTACACGACGCTCTTCCGATCT | IDT | PE_Forward |
| CTTTCCCTACACGACGCTCTTCCGATCTRRRYGTCCTTGGTGCCCGAG*T*c*a*g | IDT | Select (+) |
| CTTTCCCTACACGACGCTCTTCCGATCTYYYRGTCCTTGGTGCCCGAG*T*c*a*g | IDT | Select (−) |
| CAAGCAGAAGACGGCATACGAGATNNNNNNGTGACTGGAGTTCAGACGTGTGCTC | IDT | Illumina Index |
| GAGCGCGCGTAATACGACTCACTATAGCGTTGGTTCTCAACGCTCTCAATG | Sigma-Aldrich | 4.5S-F |
| TGCGGGAGAACCAACAGAGCCCCCATTGAGAGCGTTGAGAAC | Sigma-Aldrich | 4.5S-R |
| CCTTGGCTGCTTCCTTCCGG | Sigma-Aldrich | 4.5S(70)-R |
| Recombinant DNA | ||
| pJBL3664_SRP_EcoliRNAP_trp_HepD | Watters, et al., 2016a | N/A |
| p23-4.5S | Peck-Miller et al., 1991 | N/A |
| Software and Algorithms | ||
| R2D2 | This paper | https://github.com/LucksLab/R2D2 |
| Cotranscriptional SHAPE-Seq Tools | Watters et al., 2016a | https://github.com/LucksLab/Cotrans_SHAPE-Seq_Tools |
| RNAstructure | Reuter and Mathews, 2010 | https://rna.urmc.rochester.edu/RNAstructure.html |
| KineFold | Xayaphoummine et al., 2005 | http://kinefold.curie.fr/download.html |
| GROMACS 2016 | Abraham et al., 2015 | http://ftp.gromacs.org/pub/gromacs/gromacs-2016.6.tar.gz |
| Other | ||
| M1 RNA | Vioque et al., 1988 | pJA2’ |
| Detailed Protocol | This paper | Methods S1 |
Highlights.
Computational modeling of cotranscriptional folding pathways from SHAPE-Seq data
E. coli SRP RNA needs local structural fluctuations for toehold strand displacement
Point mutations can disrupt and rescue cotranscriptional RNA folding pathways
E. coli RNase P cleaves a cotranscriptional intermediate of the E. coli SRP RNA
Acknowledgements
We thank Eric Siggia (Rockefeller University) and Dave Matthews (University of Rochester) for foundational conversations, Daniel Aalberts (Williams College) for assistance with plotting RNAbow plots, Gregory Phillips and Nicholas Backes (Iowa State University) for discussions and protocols, Katherine Berman for cloning SRP RNA sequence mutants, Eric Strobel and Kyle Watters for help with cotranscriptional SHAPE-seq, and Molly Evans for SHAPE-seq protocol discussions and improvements. We also thank Shannon Yan, Shingo Fukuda, and Carlos Bustamante (University of California, Berkeley) for helpful discussions. Support for this work was provided by the Tri-Institutional Training Program in Computational Biology and Medicine (via NIH training grant T32GM083937 to AMY), the NIH [ 1DP2GM110838 to JBL, GM120582 to VG and JBL], the NSF [grant MCB1651877 to AAC and 1914567 to JBL], Searle Funds at The Chicago Community Trust [to JBL]. This work used the Extreme Science and Engineering Discovery Environment (XSEDE) [allocation TG-MCB140273 to AAC], which is supported by National Science Foundation grant number ACI-1548562, as well as the Quest high performance computing facility at Northwestern University. The content is solely the responsibility of the authors and does not necessarily represent the official views of the National Institutes of Health.
Footnotes
Declaration of Interests
The authors declare no competing interests.
Publisher's Disclaimer: This is a PDF file of an unedited manuscript that has been accepted for publication. As a service to our customers we are providing this early version of the manuscript. The manuscript will undergo copyediting, typesetting, and review of the resulting proof before it is published in its final form. Please note that during the production process errors may be discovered which could affect the content, and all legal disclaimers that apply to the journal pertain.
References
- Aalberts DP, and Jannen WK (2013). Visualizing RNA base-pairing probabilities with RNAbow diagrams. Rna 19, 475–478. [DOI] [PMC free article] [PubMed] [Google Scholar]
- Abraham MJ, Murtola T, Schulz R, Páll S, Smith JC, Hess B, and Lindahl E (2015). GROMACS: High performance molecular simulations through multi-level parallelism from laptops to supercomputers. SoftwareX 1–2, 19–25. [Google Scholar]
- Al-Hashimi HM, and Walter NG (2008). RNA dynamics: it is about time. Curr Opin Struct Biol 18, 321–329. [DOI] [PMC free article] [PubMed] [Google Scholar]
- Aviran S, Trapnell C, Lucks JB, Mortimer SA, Luo S, Schroth GP, Doudna JA, Arkin AP, and Pachter L (2011). Modeling and automation of sequencing-based characterization of RNA structure. Proc Natl Acad Sci U S A 108, 11069–11074. [DOI] [PMC free article] [PubMed] [Google Scholar]
- Batey RT, Rambo RP, Lucast L, Rha B, and Doudna JA (2000). Crystal Structure of the Ribonucleoprotein Core of the Signal Recognition Particle. Science 287, 1232. [DOI] [PubMed] [Google Scholar]
- Berendsen HJC, Postma JPM, van Gunsteren WF, DiNola A, and Haak JR (1984). Molecular dynamics with coupling to an external bath. The Journal of Chemical Physics 81, 3684–3690. [Google Scholar]
- Bindewald E, Wendeler M, Legiewicz M, Bona MK, Wang Y, Pritt MJ, Le Grice SFJ, and Shapiro BA (2011). Correlating SHAPE signatures with three-dimensional RNA structures. Rna 17, 1688–1696. [DOI] [PMC free article] [PubMed] [Google Scholar]
- Bothwell AL, Garber RL, and Altman S (1976). Nucleotide sequence and in vitro processing of a precursor molecule to Escherichia coli 4.5 S RNA. The Journal of biological chemistry 251, 7709–7716. [PubMed] [Google Scholar]
- Bussi G, Donadio D, and Parrinello M (2007). Canonical sampling through velocity rescaling. The Journal of Chemical Physics 126, 014101. [DOI] [PubMed] [Google Scholar]
- Chen AA, and García AE (2013). High-resolution reversible folding of hyperstable RNA tetraloops using molecular dynamics simulations. Proceedings of the National Academy of Sciences of the United States of America 110, 16820–16825. [DOI] [PMC free article] [PubMed] [Google Scholar]
- Chen S-J, and Dill KA (2000). RNA folding energy landscapes. Proceedings of the National Academy of Sciences 97, 646. [DOI] [PMC free article] [PubMed] [Google Scholar]
- Danilova LV, Pervouchine DD, Favorov AV, and Mironov AA (2006). RNAKinetics: a web server that models secondary structure kinetics of an elongating RNA. Journal of Bioinformatics and Computational Biology 04, 589–596. [DOI] [PubMed] [Google Scholar]
- Deigan KE, Li TW, Mathews DH, and Weeks KM (2009). Accurate SHAPE-directed RNA structure determination. Proc Natl Acad Sci U S A 106, 97–102. [DOI] [PMC free article] [PubMed] [Google Scholar]
- Ding Y, Chan CY, and Lawrence CE (2004). Sfold web server for statistical folding and rational design of nucleic acids. Nucleic Acids Res 32, W135–141. [DOI] [PMC free article] [PubMed] [Google Scholar]
- Frieda KL, and Block SM (2012). Direct observation of cotranscriptional folding in an adenine riboswitch. Science 338, 397–400. [DOI] [PMC free article] [PubMed] [Google Scholar]
- Fukuda S, Yan S, Komi Y, Sun M, Gabizon R, and Bustamante C (2019). The Biogenesis of SRP RNA Is Modulated by an RNA Folding Intermediate Attained during Transcription. Molecular Cell. [DOI] [PubMed] [Google Scholar]
- Geis M, Flamm C, Wolfinger MT, Tanzer A, Hofacker IL, Middendorf M, Mandl C, Stadler PF, and Thurner C (2008). Folding Kinetics of Large RNAs. Journal of Molecular Biology 379, 160–173. [DOI] [PubMed] [Google Scholar]
- Gopalan V, Baxevanis AD, Landsman D, and Altman S (1997). Analysis of the functional role of conserved residues in the protein subunit of ribonuclease P from Escherichia coli. J Mol Biol 267, 818–829. [DOI] [PubMed] [Google Scholar]
- Heilman-Miller SL, and Woodson SA (2003). Effect of transcription on folding of the Tetrahymena ribozyme. Rna 9, 722–733. [DOI] [PMC free article] [PubMed] [Google Scholar]
- Hofacker IL, Flamm C, Heine C, Wolfinger MT, Scheuermann G, and Stadler PF (2010). BarMap: RNA folding on dynamic energy landscapes. Rna 16, 1308–1316. [DOI] [PMC free article] [PubMed] [Google Scholar]
- Horn HW, Swope WC, Pitera JW, Madura JD, Dick TJ, Hura GL, and Head-Gordon T (2004). Development of an improved four-site water model for biomolecular simulations: TIP4P-Ew. The Journal of Chemical Physics 120, 9665–9678. [DOI] [PubMed] [Google Scholar]
- Hsu LM, Zagorski J, and Fournier MJ (1984). Cloning and sequence analysis of the Escherichia coli 4.5 S RNA gene. Journal of Molecular Biology 178, 509–531. [DOI] [PubMed] [Google Scholar]
- Jomaa A, Fu Y-HH, Boehringer D, Leibundgut M, Shan S. o., and Ban N (2017). Structure of the quaternary complex between SRP, SR, and translocon bound to the translating ribosome. Nature Communications 8, 15470. [DOI] [PMC free article] [PubMed] [Google Scholar]
- Joung IS, and Cheatham TE (2008). Determination of Alkali and Halide Monovalent Ion Parameters for Use in Explicitly Solvated Biomolecular Simulations. The Journal of Physical Chemistry B 112, 9020–9041. [DOI] [PMC free article] [PubMed] [Google Scholar]
- Kalvari I, Argasinska J, Quinones-Olvera N, Nawrocki EP, Rivas E, Eddy SR, Bateman A, Finn RD, and Petrov AI (2017). Rfam 13.0: shifting to a genome-centric resource for non-coding RNA families. Nucleic Acids Research 46, D335–D342. [DOI] [PMC free article] [PubMed] [Google Scholar]
- Kim H, Abeysirigunawarden SC, Chen K, Mayerle M, Ragunathan K, Luthey-Schulten Z, Ha T, and Woodson SA (2014). Protein-guided RNA dynamics during early ribosome assembly. Nature 506, 334–338. [DOI] [PMC free article] [PubMed] [Google Scholar]
- Kolb FA, Malmgren C, Westhof E, Ehresmann C, Ehresmann B, Wagner EG, and Romby P (2000). An unusual structure formed by antisense-target RNA binding involves an extended kissing complex with a four-way junction and a side-by-side helical alignment. Rna 6, 311–324. [DOI] [PMC free article] [PubMed] [Google Scholar]
- Komissarova N, and Kashlev M (1998). Functional topography of nascent RNA in elongation intermediates of RNA polymerase. Proceedings of the National Academy of Sciences 95, 14699. [DOI] [PMC free article] [PubMed] [Google Scholar]
- Kramer FR, and Mills DR (1981). Secondary structure formation during RNA synthesis. Nucleic Acids Research 9, 5109–5124. [DOI] [PMC free article] [PubMed] [Google Scholar]
- Kutchko KM, Sanders W, Ziehr B, Phillips G, Solem A, Halvorsen M, Weeks KM, Moorman N, and Laederach A (2015). Multiple conformations are a conserved and regulatory feature of the RB1 5’ UTR. Rna 21, 1274–1285. [DOI] [PMC free article] [PubMed] [Google Scholar]
- Li H, and Aviran S (2018). Statistical modeling of RNA structure profiling experiments enables parsimonious reconstruction of structure landscapes. Nat Commun 9, 606. [DOI] [PMC free article] [PubMed] [Google Scholar]
- Loughrey D, Watters KE, Settle AH, and Lucks JB (2014). SHAPE-Seq 2.0: systematic optimization and extension of high-throughput chemical probing of RNA secondary structure with next generation sequencing. Nucleic Acids Res 42. [DOI] [PMC free article] [PubMed] [Google Scholar]
- Lu Z, Zhang QC, Lee B, Flynn RA, Smith MA, Robinson JT, Davidovich C, Gooding AR, Goodrich KJ, Mattick JS, et al. (2016). RNA duplex map in living cells reveals higher order transcriptome structure. Cell 165, 1267–1279. [DOI] [PMC free article] [PubMed] [Google Scholar]
- McGinnis JL, Dunkle JA, Cate JH, and Weeks KM (2012). The mechanisms of RNA SHAPE chemistry. J Am Chem Soc 134, 6617–6624. [DOI] [PMC free article] [PubMed] [Google Scholar]
- Mortimer SA, and Weeks KM (2007). A fast-acting reagent for accurate analysis of RNA secondary and tertiary structure by SHAPE chemistry. J Am Chem Soc 129, 4144–4145. [DOI] [PubMed] [Google Scholar]
- Mustoe AM, Brooks CL, and Al-Hashimi HM (2014). Hierarchy of RNA Functional Dynamics. Annual review of biochemistry 83, 441–466. [DOI] [PMC free article] [PubMed] [Google Scholar]
- Ouyang Z, Snyder MP, and Chang HY (2013). SeqFold: genome-scale reconstruction of RNA secondary structure integrating high-throughput sequencing data. Genome Res 23, 377–387. [DOI] [PMC free article] [PubMed] [Google Scholar]
- Paillart J-C, Shehu-Xhilaga M, Marquet R, and Mak J (2004). Dimerization of retroviral RNA genomes: an inseparable pair. Nature Reviews Microbiology 2, 461. [DOI] [PubMed] [Google Scholar]
- Pan T, Artsimovitch I, Fang X. w., Landick R, and Sosnick TR (1999). Folding of a large ribozyme during transcription and the effect of the elongation factor NusA. Proceedings of the National Academy of Sciences 96, 9545. [DOI] [PMC free article] [PubMed] [Google Scholar]
- Pan T, and Sosnick T (2006). RNA folding during transcription. Annual Review of Biophysics and Biomolecular Structure 35, 161–175. [DOI] [PubMed] [Google Scholar]
- Peck-Miller KA, and Altman S (1991). Kinetics of the processing of the precursor to 4.5 S RNA, a naturally occurring substrate for RNase P from Escherichia coli. J Mol Biol 221, 1–5. [DOI] [PubMed] [Google Scholar]
- Proctor JR, and Meyer IM (2013). CoFold: an RNA secondary structure prediction method that takes co-transcriptional folding into account. Nucleic Acids Research 41, e102–e102. [DOI] [PMC free article] [PubMed] [Google Scholar]
- Quarrier S, Martin JS, Davis-Neulander L, Beauregard A, and Laederach A (2010). Evaluation of the information content of RNA structure mapping data for secondary structure prediction. Rna 16, 1108–1117. [DOI] [PMC free article] [PubMed] [Google Scholar]
- Reuter JS, and Mathews DH (2010). RNAstructure: software for RNA secondary structure prediction and analysis. BMC Bioinformatics 11, 129–129. [DOI] [PMC free article] [PubMed] [Google Scholar]
- Roberts JW, Shankar S, and Filter JJ (2008). RNA Polymerase Elongation Factors. Annual review of microbiology 62, 211. [DOI] [PMC free article] [PubMed] [Google Scholar]
- Rosenblad MA, Larsen N, Samuelsson T, and Zwieb C (2009). Kinship in the SRP RNA family. RNA biology 6, 508–516. [DOI] [PubMed] [Google Scholar]
- Saldi T, Fong N, and Bentley DL (2018). Transcription elongation rate affects nascent histone pre-mRNA folding and 3′ end processing. Genes & Development 32, 297–308. [DOI] [PMC free article] [PubMed] [Google Scholar]
- Serganov A, and Nudler E (2013). A Decade of Riboswitches. Cell 152, 17–24. [DOI] [PMC free article] [PubMed] [Google Scholar]
- Spasic A, Assmann SM, Bevilacqua PC, and Mathews DH (2017). Modeling RNA secondary structure folding ensembles using SHAPE mapping data. Nucleic Acids Res. [DOI] [PMC free article] [PubMed] [Google Scholar]
- Steinbrecher T, Latzer J, and Case DA (2012). Revised AMBER Parameters for Bioorganic Phosphates. Journal of Chemical Theory and Computation 8, 4405–4412. [DOI] [PMC free article] [PubMed] [Google Scholar]
- Šulc P, Ouldridge Thomas E., Romano F, Doye Jonathan P.K., and Louis Ard A. (2015). Modelling Toehold-Mediated RNA Strand Displacement. Biophysical Journal 108, 1238–1247. [DOI] [PMC free article] [PubMed] [Google Scholar]
- Tan Z, Sharma G, and Mathews DH (2017). Modeling RNA Secondary Structure with Sequence Comparison and Experimental Mapping Data. Biophys J 113, 330–338. [DOI] [PMC free article] [PubMed] [Google Scholar]
- Varani G, and McClain WH (2000). The G x U wobble base pair. A fundamental building block of RNA structure crucial to RNA function in diverse biological systems. EMBO Rep 1, 18–23. [DOI] [PMC free article] [PubMed] [Google Scholar]
- Vioque A, Arnez J, and Altman S (1988). Protein-RNA interactions in the RNase P holoenzyme from Escherichia coli. J Mol Biol 202, 835–848. [DOI] [PubMed] [Google Scholar]
- Wang J, Cieplak P, and Kollman Peter A (2000). How well does a restrained electrostatic potential (RESP) model perform in calculating conformational energies of organic and biological molecules? Journal of Computational Chemistry 21, 1049–1074. [Google Scholar]
- Watters KE, Strobel EJ, Yu AM, Lis JT, and Lucks JB (2016a). Cotranscriptional folding of a riboswitch at nucleotide resolution. Nature Structural & Molecular Biology 23, 1124. [DOI] [PMC free article] [PubMed] [Google Scholar]
- Watters KE, Yu AM, Strobel EJ, Settle AH, and Lucks JB (2016b). Characterizing RNA structures in vitro and in vivo with selective 2’-hydroxyl acylation analyzed by primer extension sequencing (SHAPE-Seq). Methods 103, 34–48. [DOI] [PMC free article] [PubMed] [Google Scholar]
- Whitford PC, Schug A, Saunders J, Hennelly SP, Onuchic JN, and Sanbonmatsu KY (2009). Nonlocal helix formation is key to understanding S-adenosylmethionine-1 riboswitch function. Biophysical journal 96, L7–L9. [DOI] [PMC free article] [PubMed] [Google Scholar]
- Wiebe NJP, and Meyer IM (2010). Transat—A Method for Detecting the Conserved Helices of Functional RNA Structures, Including Transient, Pseudo-Knotted and Alternative Structures. PLoS Computational Biology 6, e1000823. [DOI] [PMC free article] [PubMed] [Google Scholar]
- Wong TN, Sosnick TR, and Pan T (2007). Folding of noncoding RNAs during transcription facilitated by pausing-induced nonnative structures. Proceedings of the National Academy of Sciences 104, 17995. [DOI] [PMC free article] [PubMed] [Google Scholar]
- Xayaphoummine A, Bucher T, and Isambert H (2005). Kinefold web server for RNA/DNA folding path and structure prediction including pseudoknots and knots. Nucleic Acids Research 33, W605–W610. [DOI] [PMC free article] [PubMed] [Google Scholar]
- Xue AY, Yu AM, Lucks JB, and Bagheri N (2019). DUETT quantitatively identifies known and novel events in nascent RNA structural dynamics from chemical probing data. Bioinformatics 35, 5103–5112. [DOI] [PMC free article] [PubMed] [Google Scholar]
- Zhang DY, and Winfree E (2009). Control of DNA Strand Displacement Kinetics Using Toehold Exchange. Journal of the American Chemical Society 131, 17303–17314. [DOI] [PubMed] [Google Scholar]
- Zhu JYA, Steif A, Proctor JR, and Meyer IM (2013). Transient RNA structure features are evolutionarily conserved and can be computationally predicted. Nucleic Acids Research 41, 6273–6285. [DOI] [PMC free article] [PubMed] [Google Scholar]
Associated Data
This section collects any data citations, data availability statements, or supplementary materials included in this article.
Supplementary Materials
SI Movie 1.
R2D2 2D predictions with processed E. coli SRP RNA sequence cotranscriptional SHAPE-seq replicates (top) and equilibrium-refolded SHAPE-seq (bottom), Related to Figure 2. One hundred selected structures are represented as RNAbow plots with base pairs drawn as arcs and the arc width indicating prevalence of the base pair amongst the selected structures. Colored arcs show base pairs that are more frequent in either cotranscriptional (purple) or equilibrium (turquoise) predictions, while grey arcs show base pairs that are shared.
SI Movie 2
All-atom simulation of the inside-out proposed mechanism with strong forces added, Related to Figure 5. Refer to Figure 5A for RNA coloring.
SI Movie 3
All-atom simulation of the late toehold proposed mechanism, Related to Figure 5, 6. Refer to Figure 5C for RNA coloring. Gray coloring is used here for bases 30-83.
SI Movie 4
All-atom simulation of the U21C rescue mutant, Related to Figure 5. G7 and U21C are colored green, H1 is indicated in purple, H3 is colored magenta, rearranged base pairs are colored yellow, and remaining nucleotides are colored grey.
SI Movie 5
All-atom simulation of the late toehold proposed mechanism with the wt precursor E. coli SRP RNA, Related to Figure 7. The leader sequence (nts 1-24) is colored dark blue, H1 (nts 25-46) is colored purple, H3 (nts 111-130) is colored magenta, base pairs present in the mature fold are highlighted yellow, and the remaining bases are colored for visualization: nts 47-73 (orange), 74-83 (green), and 84-110 (turquoise),
SI Movie 6
All-atom simulation of the proposed late toehold-mediated strand rearrangement hindered by the U42C precursor E. coli SRP RNA, Related to Figure 7. The leader sequence (nts 1-24) is colored dark blue, H1 (nts 25-46) is colored purple, H3 (nts 111-130) is colored magenta, rearranged base pairs are highlighted yellow, and the remaining bases are colored for visualization: nts 47-73 (orange), 74-83 (green), and 84-110 (turquoise),
SI Movie 7
All-atom simulation of the late toehold proposed mechanism with the U42C rescue precursor E. coli SRP RNA, Related to Figure 7. Refer to Movie 6 for RNA coloring details.
Data Availability Statement
The mutant cotranscriptional and equilibrium-refolded SHAPE-seq datasets generated during this study are available through the Small Read Archive (SRA) under BioProject PRJNA667733. Wildtype SRP RNA data are similarly available through the SRA with accession codes: SRX2159310, SRX2159311, SRX2159312, and SRX2159316. Processed SHAPE-seq reactivity files generated in this study will be deposited in the RNA Mapping Database under accession codes SRPU21C_BZCN_0001, SRPU21C_BZCN_0002, SRPU21C_BZCN_0003, SRPU21C_BZCN_0004, SRPU21C_BZCN_0005, SRP21CR_BZCN_0001, SRP21CR_BZCN_0002, and SRP21CR_BZCN_0003. All source code will be freely available at https://github.com/LucksLab/R2D2. For a single round 2D folding pathway prediction with 2 processors, the walltime used is around 4 hours and used around 26 GB memory. We run this 100 times before analyzing all 100 results. The 3D folding simulations of the SRP precursor went for 48 ns using 9 synchronous replicas at different temperatures and restraint strengths. Each replica took 142 hours (−5.9 days) using an entire STAMPEDE-2 Intel Xeon Phi 7250 node. Thus, the experiment took altogether 1,275 node-hours (or 53 node-days) for the one folding simulation. Each of the other pathways examined used comparable resources.