

Abstract
B-cell maturation antigen (BCMA) is expressed by normal and malignant plasma cells and is targeted via anti-BCMA chimeric antigen receptor T-cell therapy (BCMA CAR T-cell therapy) in plasma cell myeloma (PCM) patients. Surface BCMA expression is required for CAR T-cell binding and killing. We determined the incidence and intensity of expression of BCMA in bone marrow PCM cells using flow cytometry (FC) and immunohistochemistry (IHC).
PCM BCMA expression was assessed by FC in 70 patients and in 43 concurrent specimens by IHC. BCMA expression was detected in 94% of patients. FC could assess BCMA expression in all specimens and expression was quantifiable (QuantiBRITE system, BD Biosciences, San Jose, CA) in 89% of cases. Expression was highly variable and could be numerically classified into dim, moderate or bright levels of expression. In the 43 specimens assessed successfully by both IHC and FC, FC showed higher positivity rate (97%) than IHC (72%), indicating that FC is more useful than IHC in detection of BCMA (p = 0.002; McNemar’s test).
We conclude that FC is more sensitive than IHC and can be used to objectively quantify BCMA expression by myeloma cells. IHC is primarily useful when there is significant infiltration of the bone marrow by myeloma and is less sensitive with low numbers of myeloma cells. Furthermore, the ability of FC to differentiate between normal and abnormal plasma cells and to quantify BCMA on these cells, makes it a useful and sensitive tool in screening patients for CAR T-cell therapy and for follow-up post therapy.
Keywords: BCMA, CAR T-cell therapy, Plasma cell myeloma, Flow cytometry
1. Introduction
Plasma cell myeloma (PCM) is a clonal plasma cell neoplasm characterized by high morbidity and mortality. Recent advances in therapy starting in the mid-1990s have improved the outcome but the 5-year survival rate is only 50.2% [1–3], indicating the need for continued development of novel therapies. Chimeric antigen receptor T-cell therapy (CAR T-cell therapy) has achieved dramatic results in multiply relapsed and/or treatment resistant B-cell lymphoma and acute B-lymphoblastic leukemia [4,5] making it an attractive therapeutic approach for PCM. Selection of an appropriate target antigen for CAR T-cell therapy is vital. The target antigen should be uniformly expressed on the cell surface of the tumor and have limited expression by normal cells [6]. B-cell maturation antigen (BCMA) is restricted to the B-cell lineage and is expressed on the cell surface of normal plasma cells and PCM cells [7–9], but not naïve or memory B-cells [10]. Current anti-BCMA CAR T-cell therapy trials are ongoing and early results are very promising [11].
Since cell surface expression of BCMA is a pre-requisite for BCMA CAR T-cell therapy and the level of expression may provide useful information, robust methodology for BCMA detection and quantitation is required. In this report, we evaluate the incidence of BCMA expression and the utility of flow cytometry (FC) and immunohistochemistry (IHC) in detection and quantitation of expression in PCM.
2. Materials and methods
2.1. Case selection
70 PCM patients (47 males and 23 females; age quartiles: 52, 57.5, 64; minimum, maximum: 34, 74) were screened for BCMA expression using FC from March 2013 to August 2017 to assess their eligibility for the BCMA CAR protocol. All enrolled patients gave informed consent. The study was approved by the Institutional Review Board of the National Cancer Institute and was registered as ClinicalTrials.gov NCT02215967. The US Food and Drug Administration permitted an Investigational New Drug Application for CAR-BCMA T cells BCMA expression of patient’s PCM was required for study enrollment. The diagnosis of PCM was based on clinical findings, serum monoclonal protein, bone marrow biopsy (BMB) morphology, CD138 IHC of BMB, and bone marrow aspirate FC and according to the International Myeloma Working Group (IMWG) criteria [12]. 43 specimens from 34 patients were also assessed for BCMA using both FC and IHC to compare methods and validate testing. In addition, 3 different cell lines with high (BCMA-K562), moderate/low (RPMI8226) and negative (NGFR-K562) expression of BCMA were used to develop and validate the FC method while 2 cell lines, namely high expressing BCMA-K562 and moderate/low expressing RPMI8226, were utilized to develop and validate the IHC method.
2.2. Morphology and immunohistochemistry
Bone marrow biopsies were fixed in B Plus fixative and decalcified in Rapid-Cal Immuno (both from BBC BioChemical), embedded in paraffin in a Tissue Tek VIP6 processor (Sakura Finetek) and 4-micron tissue sections were subjected to immunohistochemistry with anti-CD138 (Syndecan 1, B-A38, Cell Marque) and anti-BCMA (R&D Systems, Minneapolis, MN) antibodies on BenchMark Ultra stainer (Ventana Medical Systems) using Optiview detection system. The percent of plasma cells out of the total number of marrow elements in the biopsy was estimated by microscopy based upon CD138 expression. Anti-BCMA staining was validated by staining cell lines with high, and moderate/low expression of BCMA. Bone marrow sections stained only with an isotype-matched antibody served as a negative control (Supplemental Fig. 1). The expression levels of BCMA in marrow sections were visually assessed by a hematopathologist (I.M.). BCMA positivity was determined by subjective comparison of the BCMA stained slide to the isotypic control and scored according to the degree of staining in the plasma cells as negative (0), weak (1), moderate (2), and strong (3) by comparison to IHC on control cell lines (Supplemental Fig. 1). Although Golgi staining was sometimes noted, only membranous anti-BCMA staining was considered positive. Examples of scoring of IHC BCMA staining are shown in Fig. 1.
Fig. 1.
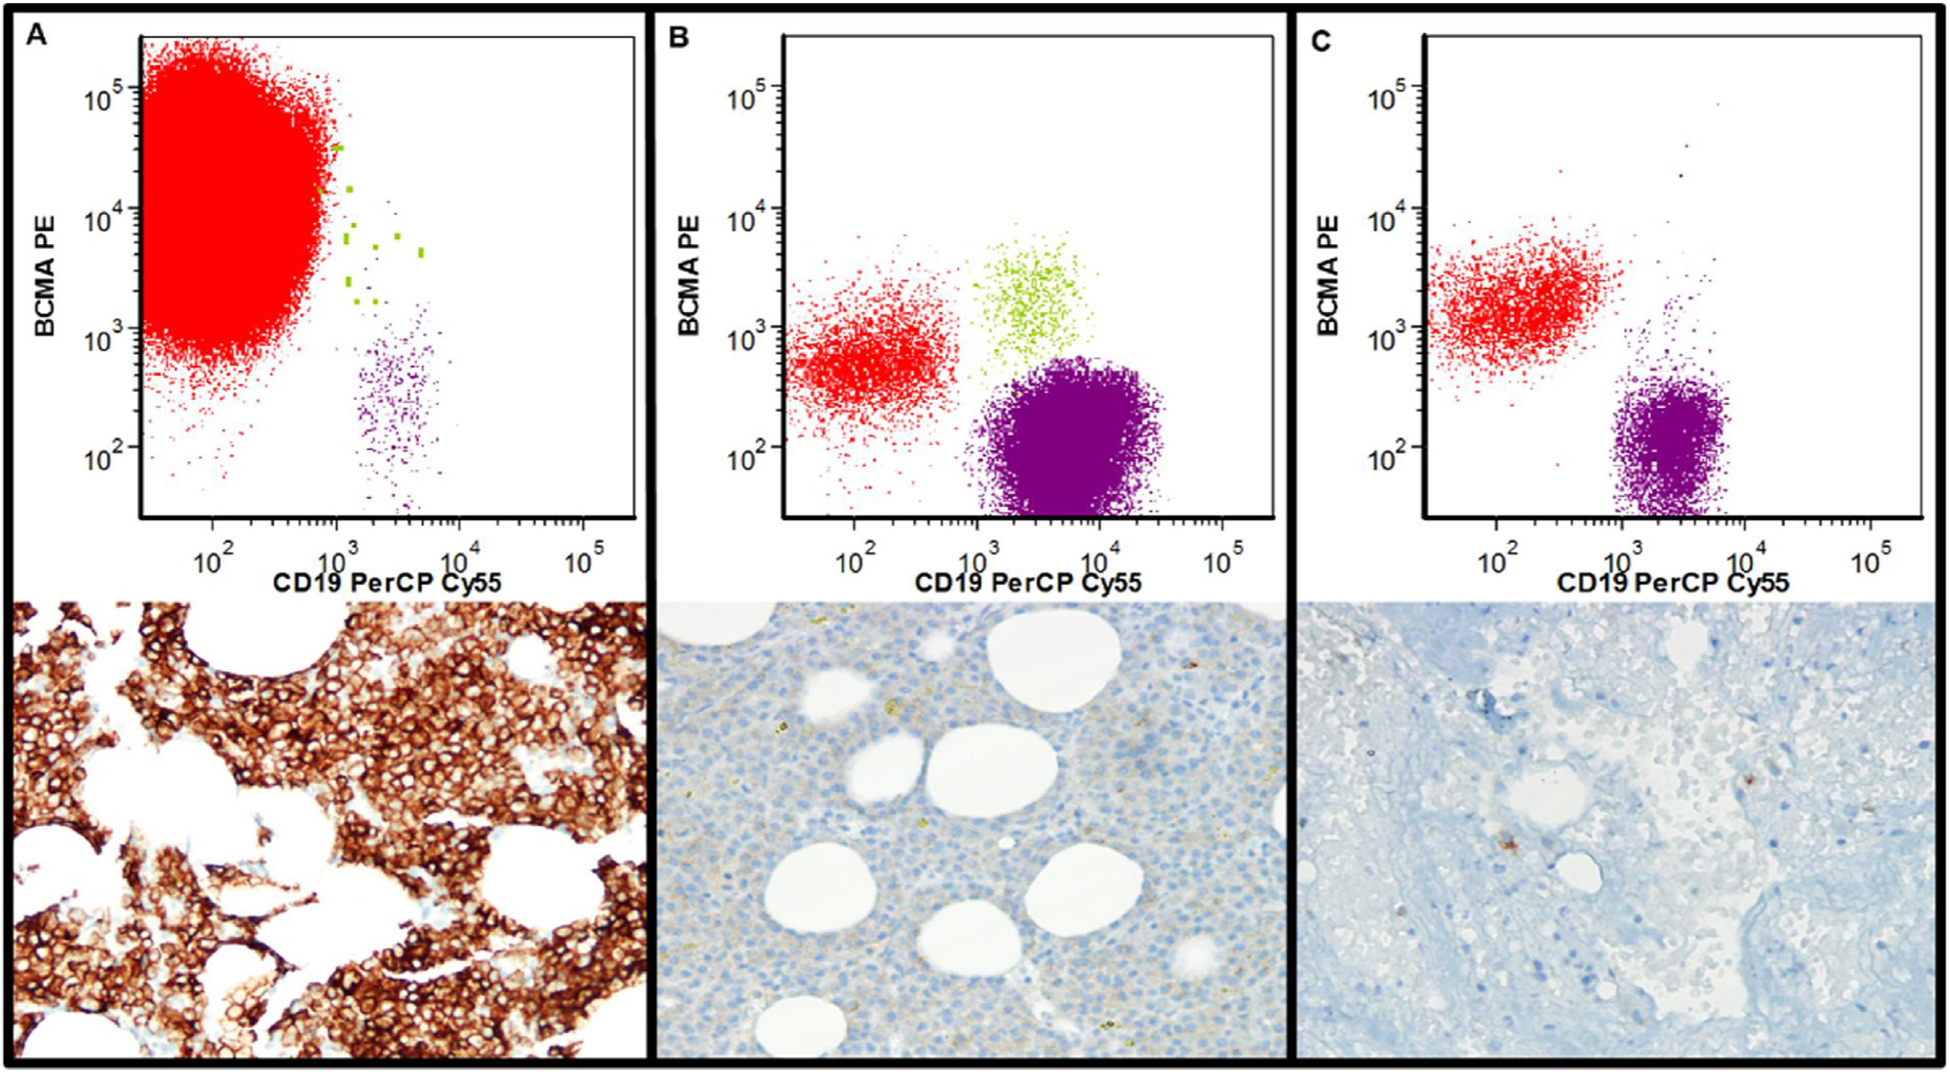
Assessment of BCMA expression using flow cytometry (FC) and immunohistochemistry (IHC) in myeloma cells: Upper Panel- FC results. Red cells are the abnormal plasma cells, green cells the normal plasma cells, and purple cells normal B-cells (delineation of populations based upon expression of CD19, CD20, CD38, CD45, CD56, CD81, and CD138). Lower Panel- IHC results. BCMA positive cells are brown.
A. Bone marrow biopsy with sheets of myeloma cells expressing bright BCMA (FC: bright expression, BCMA ABC: 7265, IHC score: 3). B. Bone marrow biopsy with sheets of myeloma cells expressing dim BCMA (FC: dim expression, BCMA ABC: 473. IHC score: 0). C. Bone marrow biopsy with scattered plasma cells (FC: bright expression, BCMA ABC: 1429. IHC score: 1).
2.3. Flow cytometric detection of BCMA expression by myeloma cells
Specimens were processed within 4 hours of collection according to International Clinical Cytometry Society/ European Society for Clinical Cell Analysis (ICCS/ESCCA) consensus guidelines and as previously described [13–16]. The diagnostic panel (Table 1) was designed in accordance with ICCS/ESCCA consensus guidelines [17]. In select cases where surface staining was not sufficiently informative, intracellular kappa and lambda light chains (Polyclonal Rabbit Anti-Human, F(ab’)2, were examined. For intracellular staining, Fix and Perm cell fixation and permealization kit (Invitrogen, Grand Island, NY) was used after surface staining. All cells were fixed in 0.5% paraformaldehyde and stored at 4 °C for up to 4 hours before acquisition. Cellular viability of lysed and washed bone marrow aspirate cells was assessed by staining with the fluorescent dye 7-Amino-Actinomycin D (7-AAD) (BD Biosciences, San Jose, CA) for 10 minutes at room temperature (7-AAD only stains non-viable cells). Specimens were acquired using BD FACSCanto™II (BD Biosciences, San Jose, CA) as previously described [14] with an acquisition goal of at least 3 × 10⁶ total events.
Table 1.
Flow Cytometry Panel for Plasma Cell Myeloma patients.
| FITC | PE | PerCP-Cy™5.5 | PE-Cy™7 | APC | APC-H7 | V450 | V500 | |
|---|---|---|---|---|---|---|---|---|
| 1. Antigen (clone) | CD81 (JS-81) | CD27 (L128) | CD138 (MI15) | CD56 (NCAM16.2) | CD19 (SJ25C1) | CD20 (L27) | CD38 (HB7) | CD45 (HI30) |
| 2. Antigen (clone) | Lambda* (Polyclonal) | Kappa* (Polyclonal) | CD138 (MI15) | CD56 (NCAM16.2) | CD19 (SJ25C1) | CD20 (L27) | CD38 (HB7) | CD45 (HI30) |
| 3. Antigen (clone) | CD81 (JS-81) | BCMA# (Polyclonal) | CD19 (SJ25C1) | CD56 (NCAM16.2) | CD138 (MI15) | CD20 (L27) | CD38 (HB7) | CD45 (HI30) |
Polyclonal light chains, Dako, Carpinteria, CA.
BCMA antibody (Polyclonal Goat IgG) R&D systems, Minneapolis, MN. All other antibodies are from BD Biosciences, San Jose, CA.
Data were analyzed using FCS Express (De Novo Software, Los Angeles, CA) as previously described [16]. Briefly, plasma cells were identified by gating on cells with CD138 positivity, strong CD38 expression and moderate to negative CD45. Light scatter properties were also examined to exclude debris, doublets and lymphocytes. The definition of normal and abnormal plasma cells is based upon the ICCS/ESCCA consensus guidelines [17–21]. Normal was defined based upon a normal pattern of expression of CD19, CD20, CD27, CD28, CD38, CD45, CD56, CD81, and CD138 as well as in select cases polyclonal intracellular light chain expression (Supplemental Fig. 2). According to validated minimal residual disease detection criteria, a discrete population of 20 or more abnormal plasma cells was required to diagnose the presence of PCM [20]. Fig. 1 shows examples of BCMA staining using FC.
2.4. Flow cytometric quantification of BCMA
Development and validation of anti-BCMA staining methodology was performed using 3 different cell lines with high, moderate/low and negative expression of BCMA. Positivity for BCMA was determined based upon internal negative (B-cells) and positive (normal plasma cells) controls. The antibody bound per cell (ABC) for the myeloma cells was determined for anti-BCMA Phycoerythrin (Polyclonal Goat IgG, R& D systems) using saturating concentrations of antibody and the BD Biosciences QuantiBRITE system (QuantiBRITE standard beads and QuantiCALC software; BD Biosciences, San Jose, CA) for fluorescence quantitation. The ABC value represents the mean value of the maximum capacity of each cell to bind the anti-BCMA antibody. QuantiBRITE PE beads are pre-calibrated standard beads containing known numbers of PE molecules bound per bead (four levels of fluorescence). The antibody combinations used in the QuantiBRITE assay are indicated (Table 1). QuantiBRITE beads were acquired on a FACSCanto™II (BD Biosciences, San Jose, CA) on the same day at the same instrument settings as the individual patient specimens. A standard curve comparing the geometric mean of fluorescence to known PE content of the QuantiBRITE beads was constructed using QuantiCALC software. The regression analysis, slope, intercept, and correlation coefficient were determined. Abnormal plasma cells and normal plasma cells were identified based upon immunophenotype (Supplemental Fig. 2) and the geometric mean fluorescence of BCMA staining in these populations detected. The measured geometric mean fluorescence is then used to determine ABC values via the QuantiBRITE standard curve [14]. Based upon previous studies on normal and malignant plasma cells and studies on BCMA staining by the internal negative control (B-cells), positive BCMA expression was defined as ABC ≥ 200 [22]. By gating based upon immunophenotype, the geometric mean fluorescence of BCMA staining was reported for both normal plasma cells and myeloma cells. The ABC values were generated from the measured geometric mean fluorescence of the gated cells using the QuantiBRITE standard curve. ABC values were only determined for populations containing 100 or greater events to achieve adequate precision as previous studies have determined this cutoff for accuracy [14].
2.5. Statistical analysis
Spearman’s rank correlation coefficient was used to estimate the association between two continuous variables. Somers’ D is provided as a general measure of association between two variables if one or both are discrete and ordered; Somers’ D can be interpreted similarly as Spearman’s correlation coefficient. McNemar’s test was used to test for agreement in sensitivity between FC and IHC. The Jonckheere-Terpstra trend test was used to test for a trend between a continuous variable and an ordered discrete variable. All reported p-values are two-sided and unadjusted for multiple comparisons. Numeric boundaries of BCMA ABC classes were selected as multiples of 100 from regions of the empirical distribution where consecutive percentage differences were relatively high and class sizes were adequate for comparison.
3. Results
3.1. BCMA qualitative and quantitative evaluation by flow cytometry
BCMA expression was assessed in 70 PCM patients as a screening method for enrollment into a BCMA CAR T-cell therapy protocol (clinical trial #NCT02215967). BCMA expression was successfully evaluated using FC in all 70 specimens; with 66 (94%) BCMA positive cases and only 4 (6%) negative cases. 7 out of 66 positive cases (11%) had dim/partial expression of BCMA. Within the 66 positive specimens, BCMA was quantifiable in 62 specimens where sufficient cell number was present. BCMA density was highly skewed and had wide variation (Table 2, Fig. 2a). We also assessed BCMA receptor density on B-cells (biological negative control) in 10 consecutive patients with adequate numbers of B cells. BCMA ABC on these BCMA negative B-cells ranged from 70 to 142 (median = 95). BCMA expression was classified into dim, moderate, and bright expression using objective numeric values (ABC < 500, 501–1100, and > 1101 respectively). The numeric boundaries of BCMA ABC classes were selected as multiples of 100 from regions of the empirical distribution where consecutive percentage differences were relatively high between the highest value in the lower class and the lowest value in the upper class (Table 2, Fig. 2b).
Table 2.
BCMA antibody binding per cell (ABC) in Plasma Cell Myeloma.
| N | Minimum, Maximum | Geometric Mean | Median | Lower, Upper quartiles | Distribution free 95% CL on median | |
|---|---|---|---|---|---|---|
| All patients | 62 | 214, 7265 | 689 | 665 | 396, 968 | 468, 806 |
| Dim(< 500) | 25 | 214, 473 | 340 | 370 | 281, 422 | 284, 421 |
| Moderate (501–1100) | 25 | 520, 1028 | 777 | 797 | 689, 924 | 720, 920 |
| Bright (> 1100) | 12 | 1169, 7265 | 2329 | 2076 | 1463, 3172 | 1429, 3576 |
BCMA; B-cell maturation antigen, N; number, CL; confidence limit.
Fig. 2.
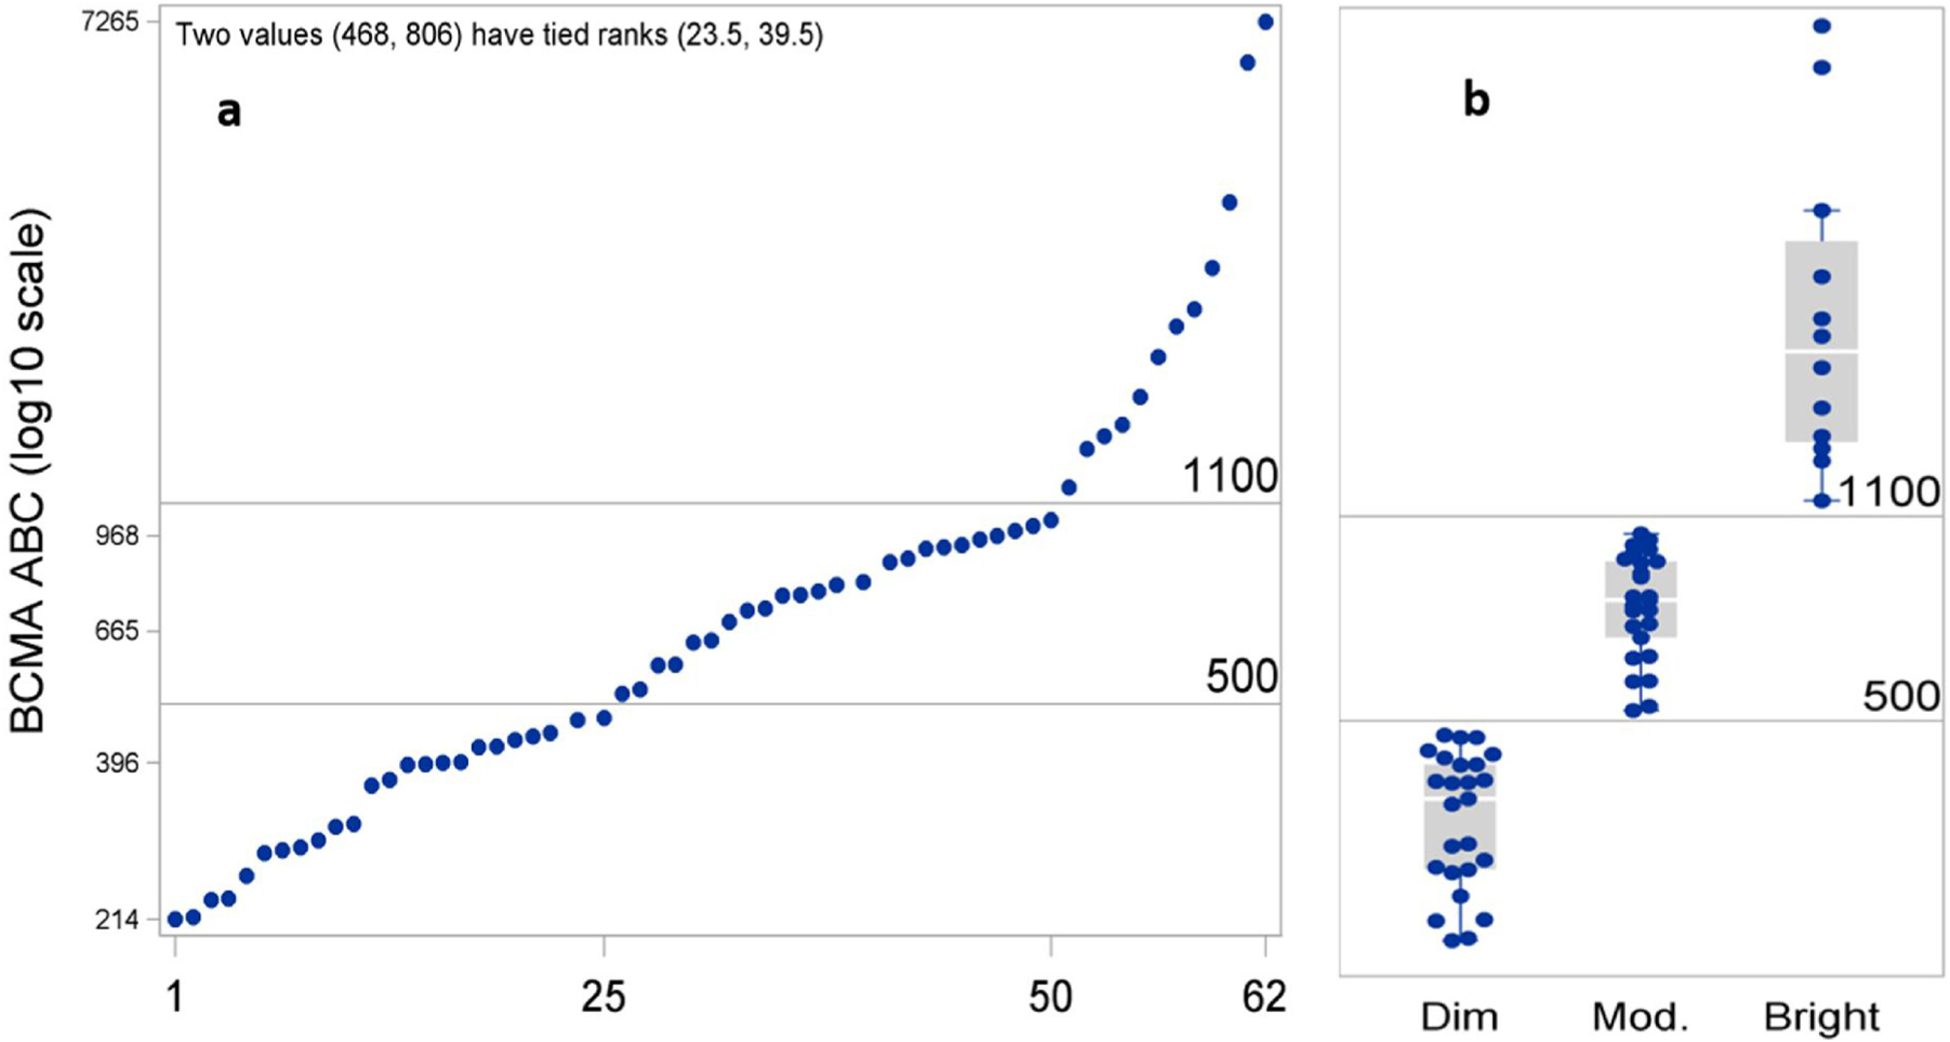
Expression level of BCMA on myeloma cells (62 specimens). (a) BCMA ABC values were highly variable (214–7265; mean 689, median 665). (b) Specimens could be classified into 3 groups with dim, moderate, and bright expression of BCMA based upon objective criteria (ABC < 500, 501–1100, and > 1101 respectively). BCMA ABC; B-cell maturation antigen antibody binding capacity.
3.2. Normal and abnormal plasma cell BCMA quantification
BCMA ABC values in myeloma cells and normal plasma cells were compared in 30 specimens (from 28 patients, 27 pre-treatment [2 duplicate specimens collected on different days] and 3 post treatment specimens) where there was a sufficient number of both populations. A weak degree of association (Spearmans’s r = 0.16; 95% CI: −0.24, 0.57) was found between BCMA ABC values on myeloma cells and normal plasma cells. The geometric mean for myeloma cells (607) was 10% lower than that for normal plasma cells (678); however, there is substantial overlap of the distributions (upper and lower quartiles: 396, 806 for myeloma, 435, 1054 for normal). Interestingly, in 10/30 specimens (33%), the BCMA ABC was higher in myeloma cells than in normal plasma cells. The normal plasma cells vs. myeloma cells difference can be assessed as the percentage difference (100*(normal-myeloma)/myeloma), with mean 36% (95% CI: 7%, 66%). The mean and wide 95% CI indicate that no comparison of BCMA ABC between normal and myeloma plasma cells is precise enough to differentiate between them (Fig. 3).
Fig. 3.
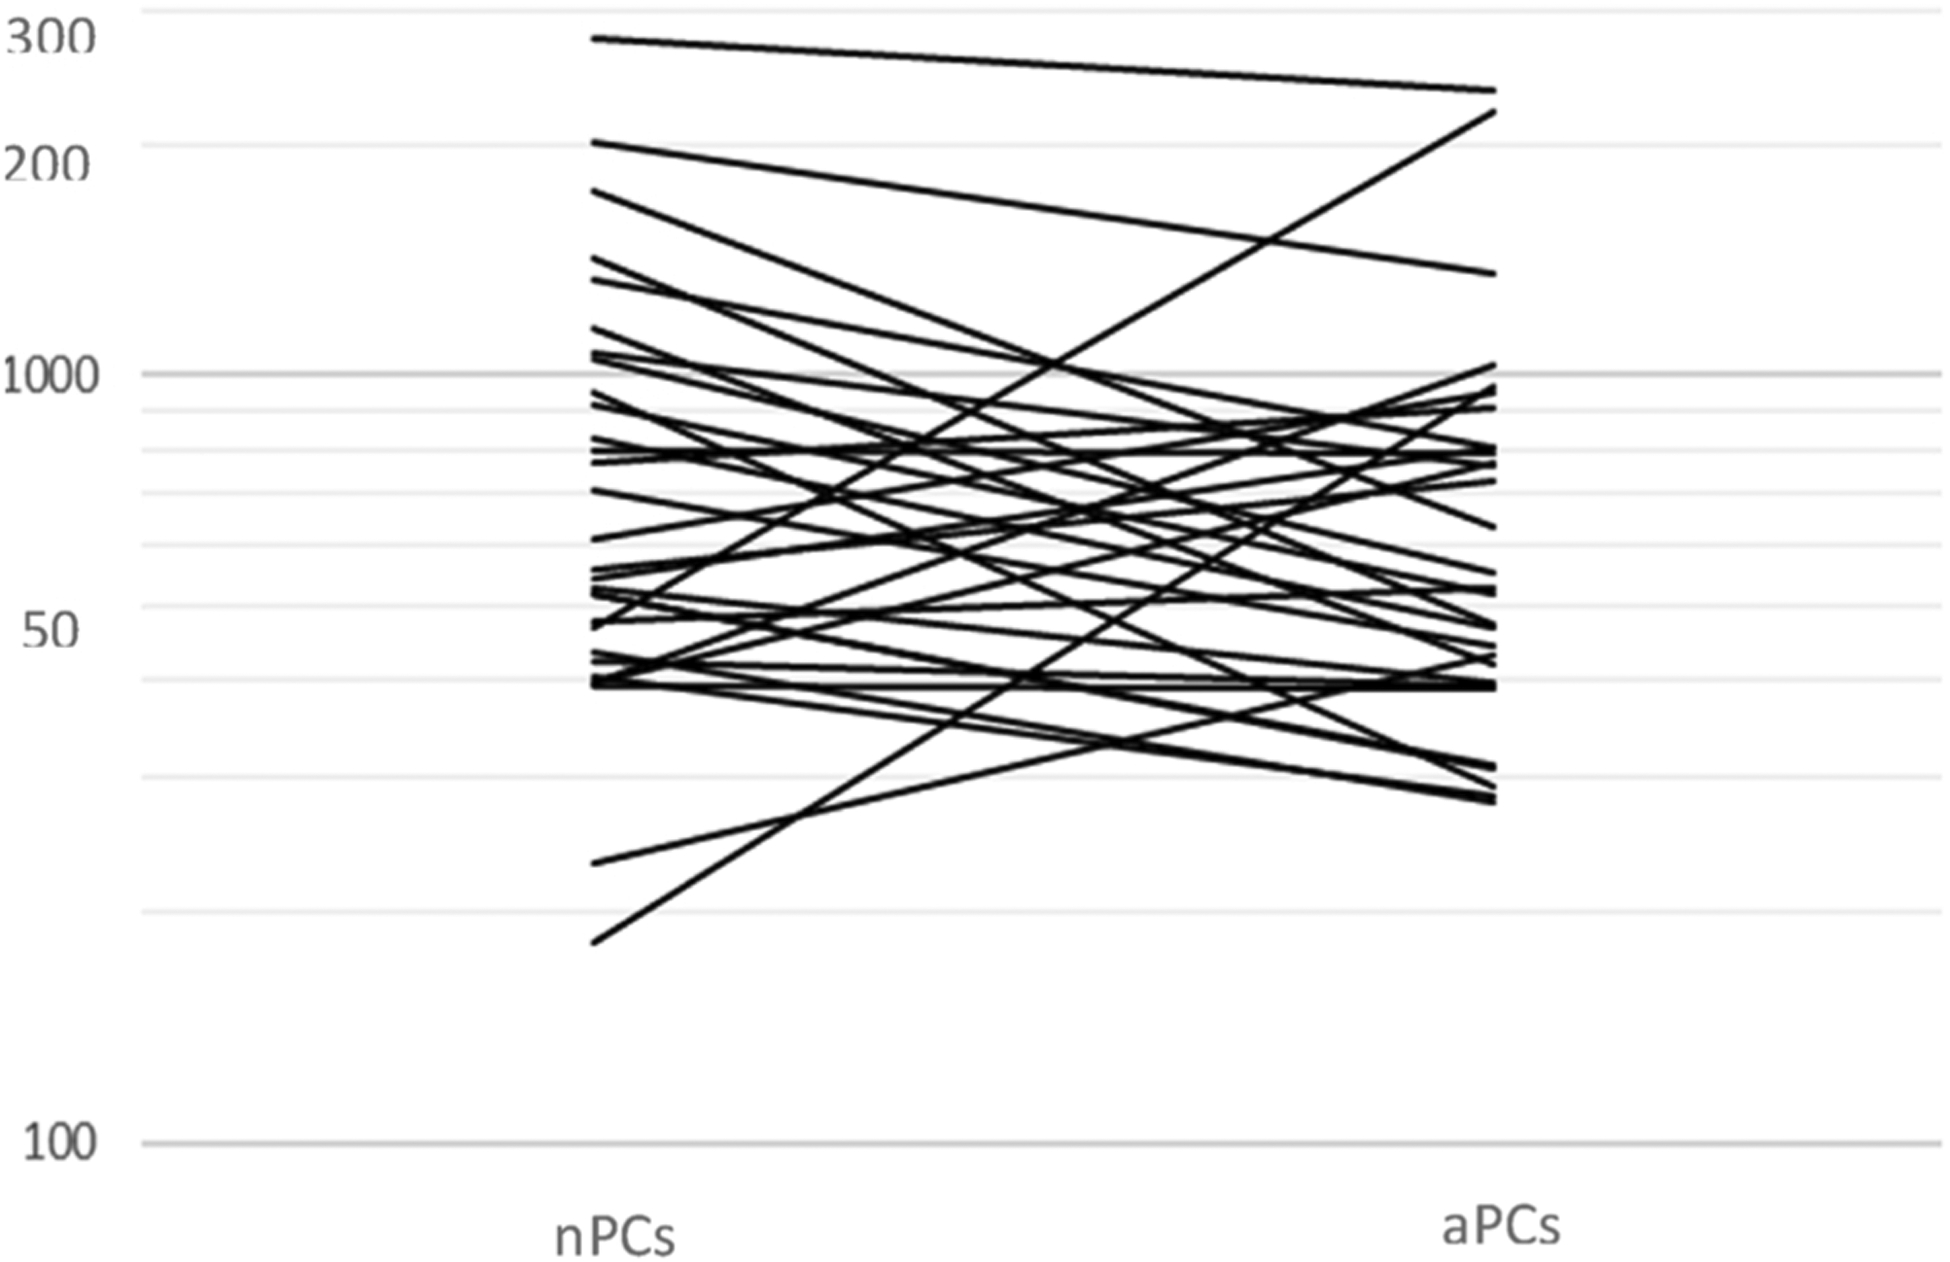
BCMA ABC values on normal (nPC) and abnormal (aPCs) plasma cell within each specimen where both populations could be evaluated.
3.3. Comparison of flow cytometry and immunohistochemistry for assessment of BCMA expression
FC and IHC assays detecting BCMA expression could be validated using cell lines with different intensities, namely BCMA-K562 (bright), RPMI8226 (moderate), and NGFR-K562 (negative).
BCMA expression was evaluated by both FC and IHC in 43 specimens from 34 patients. FC could qualitatively evaluate BCMA expression on all 43 specimens. BCMA positivity was demonstrated by FC in 41/43 specimens (95%) while 2/43 specimens (5%) were BCMA negative compared to the internal positive and negative controls (normal plasma cells and B-cells). BCMA expression could be evaluated by IHC in 39/43 cases (91%) but results were unsatisfactory in 4/43 cases (9%) due to a very low number of sparsely scattered plasma cells (3 cases) and technical difficulty caused by non-specific background staining (1 case). IHC demonstrated BCMA positivity in 28/39 cases (72%), while 11/39 cases (28%) were negative for membranous BCMA staining (Table 3). 34 of the 43 BMA specimens submitted for evaluation were baseline screening evaluations prior to therapy, while the remaining 9 were post therapy. BCMA was negative by both FC and IHC in one baseline bone marrow aspirate despite morphology revealing heavy bone marrow infiltration with sheets of myeloma cells, indicating IHC negativity was not due to myeloma cell number (true negativity). In a second case with BCMA negativity by FC, BCMA was not assessable by IHC due to the low level of residual myeloma in the biopsy. Myeloma BCMA was assessable by FC in all of the 9 post-therapy bone marrow aspirates regardless of the level of involvement, while IHC could only evaluate 8/9 post therapy specimens. There is a lower sensitivity of detection of BCMA expression by IHC than FC and this lower sensitivity is exacerbated with low level involvement by myeloma.
Table 3.
Comparison between FC and IHC in qualitative detection of BCMA in Plasma Cell Myeloma.
| FC+ | FC− | Total | |
|---|---|---|---|
| IHC+ | 28 | 0 | 28 |
| IHC− | 10 | 1 | 11 |
| IHC na | 3 | 1 | 4 |
| Total | 41 | 2 | 43 |
FC; Flow Cytometry. IHC; Immunohistochemistry, BCMA; B-cell maturation antigen, na; not applicable (could not be assessed).
Within the 39 specimens assessed successfully by both IHC and FC there was higher positivity rate achieved by FC (38/39; 97%) than IHC (28/39; 72%) (Table 3) indicating that FC is more sensitive than IHC in detection of BCMA (p = 0.002; McNemar’s test, n = 39 specimens). In the 38 cases BCMA positive by FC, only 28 were positive using IHC; indicating that the sensitivity of IHC for detection of BCMA is 74% (95% CI: 57%, 87%). Specimens from the same patient had identical FC and IHC measures, i.e., within a patient there was no variability. IHC specificity in detection of BCMA compared to FC could not be determined as there were too few FC negative cases (only 2). Fig. 1 shows examples of FC and IHC BCMA evaluation.
3.4. Comparison of flow cytometry and immunohistochemistry as quantitative/semi-quantitative methods for BCMA
Quantitative/ semi-quantitative assessment of BCMA (ABC values with FC or grading system with IHC) was performed using both techniques simultaneously in 38/43 specimens (from 31 patients; seven patients each had pre- and post-treatment specimens). This evaluation could not be assessed in 1 specimen using FC, 3 specimens using IHC, and 1 specimen using both techniques due to a low number of myeloma cells in the specimen being evaluated. Within the 38 specimens (with all infiltration patterns), we found evidence for a trend (Somers’ D (95% CI): 0.41 (0.25, 0.57); p < 0.0001) between BCMA ABC values (using FC) and the proposed grading system (IHC: 0, 1, 2, 3; n = 11, 7, 14, 6, respectively) (Supplementary Fig. 3). This trend was slightly stronger when we analyzed only specimens with heavy myelomatous infiltration (sheets of malignant cells) (Somers’ D (95% CI): 0.48 (0.29, 0.67); p = 0.0005; n = 23) and with sheets and large clusters (Somers’ D (95% CI): 0.49 (0.32, 0.66); p < 0.0001; n = 28). However, these results should be viewed cautiously because of the small sample sizes in some groups. Finally, we found a moderately high degree of correlation between the pre- and post-treatment measures (Spearman’s r (95% CI): 0.68 (−0.14, 0.95), n = 7), but the sample size is small (seven patients) and a wide confidence interval indicates low precision.
4. Discussion
Our results indicate that BCMA is expressed on the vast majority (94%) of PCM, making it an excellent therapeutic target. The fact, however, that it can be negative in select cases underscores the importance of evaluating expression of this antigen in patients being considered for BCMA targeted therapy. FC is found to be more effective than IHC in evaluating BCMA expression, successfully evaluating BCMA expression in all specimens studied for comparison while IHC could not evaluate myeloma cell BCMA expression in 9% of cases studied, primarily due to low level involvement. In specimens evaluated by both methods, FC is more sensitive than IHC in detection of BCMA (p = 0.002; McNemar’s test). The specificity of IHC BCMA detection compared to FC could not be determined as there were only 2 negative cases. In contrast, Lee et al. [23] using a double IHC staining method for BCMA and BLIMP1 reported both surface and cytoplasmic BCMA staining in a variable proportion of the plasma cells in all myeloma specimens evaluated. The use of BLIMP1 to single out plasma cells may improve IHC sensitivity, although, normal plasma cells are not excluded and would result in the case being interpreted as positive. In addition, the patients in their study were newly diagnosed or had significant relapses, while many of our patients had lower level disease. In the patients with sheeting out of myeloma cells in the bone marrow, we also found IHC to be fairly effective. Our FC method has the advantage of rapidly interrogating millions of cells, as well as the ability to simultaneously evaluate expression of other antigens, allowing segregation of plasma cells from other bone marrow elements for analysis of antigen expression as well as the ability to differentiate between normal and abnormal plasma cells. Consequently, normal plasma cells can function as an internal positive control for BCMA staining, while the ability to also detect normal B-cells provides an internal negative control for BCMA. Furthermore, the ability to evaluate the expression level of BCMA specifically by myeloma cells, without the confounding influence of normal plasma cells, provides a more accurate assessment. By using the QuantiBRITE system (BD Biosciences, San Jose, CA) to determine ABC values, FC can provide a quantitative measurement instead of a subjective assessment of dim, moderate, and bright. In addition, FC assessment of BCMA expression can not only be limited to the malignant cells, but also provide definitive evidence of surface, not cytoplasmic, expression. In contrast, IHC cannot evaluate BCMA expression with low level of involvement by myeloma and does not have the ability to distinguish between normal and abnormal plasma cells. IHC requires the presence of clusters of myeloma cells in the BMB and in our study, was not effective with a diffuse pattern or very low-level involvement. IHC, however, has the advantage of detecting BCMA expression in paraffin sections, potentially eliminating the requirement of a repeat BMB when screening for antigen targeted therapy.
Our results are consistent with previous studies which also demonstrated highly variable levels of BCMA expression [23–25]. Yong et al also identified occasional myeloma cases where BCMA expression was dim or negative [26]. In some studies, however, surface BCMA expression was observed in all myeloma cell lines and patient specimens evaluated [23–25]. This is not unexpected as the incidence of BCMA negativity in actual patient specimens is low (5.7% of cases) and sample number as well as how BCMA negativity is determined would affect results. Lee et al [23] used isotype controls as a negative control instead of the now recommended negative internal biological negative control, such as normal B-cells. Furthermore, it may be difficult to separate real negative from dim expression without the quantitative system we employed with a defined negative ABC cutoff value and the BCMA negative ABC range on the biological negative control B-cells. An important note, the methodology utilized by other authors would fail to detect the partial BCMA expression observed in 10.6% of the cases, an important factor when contemplating anti-BCMA therapy.
Surface antigen expression can be accurately and precisely quantified by FC using the QuantiBRITE system (BD Biosciences, San Jose, CA) to determine mean cell surface antigen number, expressed as ABC values [14,27]. In previous studies dim, moderate, and bright were subjectively determined based upon visual inspection of plots. This can lead to intra- and inter- observer variability in definition of expression intensity. To reduce such variability, cases were classified based upon numeric BCMA ABC values into dim, moderate, and bright expression (ABC < 500, 501–1100, and > 1101 respectively). Application of a numeric scale is recommended to reduce variability, especially in measuring BCMA expression changes post therapy. Lee et al found a similar wide range of BCMA expression quantifiable by flow cytometry. [23]. They did not, however, use high level multidimensional flow cytometry to separate normal from malignant plasma cells, measuring BCMA expression by all CD138 positive cells. We frequently found a population of normal plasma cells and these normal plasma cells had a higher BCMA expression than myeloma cells in 67% of the cases examined. We therefore recommend that contaminating normal plasma cells be excluded in analysis of myeloma for BCMA expression. For IHC we used a semi-quantitative grading system of negative (0), weak (1), moderate (2), and strong (3), based upon the subjective assessment of BCMA staining by IHC. The IHC grading system was applied by one individual and variability between individual observers was not evaluated. There was evidence of a linear trend (F-test p = 0.001) between BCMA ABC values (using FC) and grading system (by IHC) in all comparable specimens. This linear trend was further augmented when only specimens with heavy myeloma infiltration (sheets) were compared (F-test p < 0.0001). The ability of FC, however, to differentiate between normal and abnormal plasma cells and to quantitate BCMA levels independent of instrument fluctuations over time, reduces subjectivity and makes it a useful and sensitive tool in determining BCMA in these patients before, during, and after antigen directed therapy.
Objective measurement of BCMA expression in myeloma cases is important as it may have impact on the treatment response and may help in patient stratification for dose adjustment. A previous study showed that when treated with anti-BCMA antibody, myeloma cell lines with the highest BCMA expression level (subjective) showed significant killing in a shorter period compared to cell lines with moderate/low BCMA expression [23]. Further studies will be needed to clarify the impact of BCMA ABC values and the proposed classification of these values on the outcome of BCMA CAR T-cell therapy. Since modification of surface antigen expression has been previously demonstrated as a method for neoplastic cells to escape CAR T-cell therapy (e.g. development of CD19 negative ALL post CD19 CAR T-cell therapy), accurate evaluation of antigen expression during and post therapy provides useful information. FC could evaluate myeloma BCMA in all post therapy bone marrow aspirates assessed and ABC values are comparable over time as they are based upon fluorescent standards evaluated at the same time as the patient specimen. More studies will be needed to assess the utility of ABC values in detecting antigen modification post CAR T-cell therapy.
In conclusion BCMA is expressed by the vast majority of PCM. Cases of PCM that are negative for BCMA are encountered, however, and pre-therapy screening for BCMA expression is highly recommended. Although an evaluation can be performed using both FC and IHC methods, FC is more sensitive in detection of BCMA expression. FC can differentiate between BCMA expression on normal plasma cells and myeloma cells and provides accurate quantification of the antigen density on the cell surface, making it a useful and sensitive tool in screening patients for BCMA CAR T-cell therapy and monitoring possible changes in antigen expression post therapy. Its ability to detect BCMA in specimens containing very few plasma cells where IHC is in-adequate makes it the method of choice for patients with minimal bone marrow involvement. IHC is primarily successful in cases with significant myeloma infiltration of the bone marrow but does have the advantage of not requiring fresh tissue and being be applicable to evaluation of previous biopsies. Further studies are necessary to determine if BCMA ABC values as determined by quantitative FC are predictive of response to antigen directed therapy and can detect antigen modification leading to relapse.
Supplementary Material
Acknowledgement
Data / Research reported in this work was supported by the intramural program, CCR, National Cancer Institute, National Institutes of Health.
Footnotes
Declaration of interest
None.
Appendix A. Supplementary data
Supplementary material related to this article can be found, in the online version, at doi:https://doi.org/10.1016/j.leukres.2018.07.015.
References
- [1].Kumar S, Paiva B, Anderson KC, et al. , International myeloma working group consensus criteria for response and minimal residual disease assessment in multiple myeloma, Lancet Oncol. 17 (2016) e328–e346. [DOI] [PubMed] [Google Scholar]
- [2].Kazandjian D, Landgren O, A look backward and forward in the regulatory and treatment history of multiple myeloma: approval of novel-novel agents, new drug development, and longer patient survival, Semin. Oncol 43 (2016) 682–689. [DOI] [PMC free article] [PubMed] [Google Scholar]
- [3].Jemal A, Ward EM, Johnson CJ, et al. , Annual report to the nation on the Status of cancer, 1975–2014, featuring survival, JNCI: J. Natl. Cancer Inst 109 (2017) djx030–djx. [DOI] [PMC free article] [PubMed] [Google Scholar]
- [4].Lee DW, Kochenderfer JN, Stetler-Stevenson M, et al. , T cells expressing CD19 chimeric antigen receptors for acute lymphoblastic leukaemia in children and young adults: a phase 1 dose-escalation trial, Lancet 385 (2015) 517–528. [DOI] [PMC free article] [PubMed] [Google Scholar]
- [5].Kochenderfer JN, Dudley ME, Carpenter RO, et al. , Donor-derived CD19-targeted T cells cause regression of malignancy persisting after allogeneic hematopoietic stem cell transplantation, Blood 122 (2013) 4129–4139. [DOI] [PMC free article] [PubMed] [Google Scholar]
- [6].Sadelain M, Brentjens R, Riviere I, The basic principles of chimeric antigen receptor design, Cancer Discov. 3 (2013) 388–398. [DOI] [PMC free article] [PubMed] [Google Scholar]
- [7].Laabi Y, Gras MP, Brouet JC, et al. , The BCMA gene, preferentially expressed during B lymphoid maturation, is bidirectionally transcribed, Nucl. Acids Res 22 (1994) 1147–1154. [DOI] [PMC free article] [PubMed] [Google Scholar]
- [8].Gras MP, Laabi Y, Linares-Cruz G, et al. , BCMAp: an integral membrane protein in the golgi apparatus of human mature B lymphocytes, Int. Immunol 7 (1995) 1093–1106. [DOI] [PubMed] [Google Scholar]
- [9].Hatzoglou A, Roussel J, Bourgeade MF, et al. , TNF receptor family member BCMA (B cell maturation) associates with TNF receptor-associated factor (TRAF) 1, TRAF2, and TRAF3 and activates NF-kappa B, elk-1, c-Jun N-terminal kinase, and p38 mitogen-activated protein kinase, J. Immunol (Baltimore, Md: : 1950 165 (2000) 1322–1330. [DOI] [PubMed] [Google Scholar]
- [10].Novak AJ, Darce JR, Arendt BK, et al. , Expression of BCMA, TACI, and BAFF-R in multiple myeloma: a mechanism for growth and survival, Blood 103 (2004) 689–694. [DOI] [PubMed] [Google Scholar]
- [11].Ali SA, Shi V, Maric I, et al. , T cells expressing an anti-B-cell maturation antigen chimeric antigen receptor cause remissions of multiple myeloma, Blood 128 (2016) 1688–1700. [DOI] [PMC free article] [PubMed] [Google Scholar]
- [12].Kyle RA, Child JA, Anderson K, et al. , Criteria for the classification of monoclonal gammopathies, multiple Myeloma and related disorders: a report of the International Myeloma Working Group, Br. J. Haematol 121 (2003) 749–757. [PubMed] [Google Scholar]
- [13].Stetler-Stevenson M, Paiva B, Stoolman L, et al. , Consensus guidelines for myeloma minimal residual disease sample staining and data acquisition, Cytometry Part B-Clin. Cytometry 90 (2016) 26–30. [DOI] [PMC free article] [PubMed] [Google Scholar]
- [14].Jasper GA, Arun I, Venzon D, et al. , Variables affecting the quantitation of CD22 in neoplastic B cells, Cytometry B Clin. Cytom 80 (2011) 83–90. [DOI] [PMC free article] [PubMed] [Google Scholar]
- [15].Tembhare PR, Yuan CM, Venzon D, et al. , Flow cytometric differentiation of abnormal and normal plasma cells in the bone marrow in patients with multiple myeloma and its precursor diseases, Leuk. Res 38 (2014) 371–376. [DOI] [PMC free article] [PubMed] [Google Scholar]
- [16].Manasanch EE, Salem DA, Yuan CM, et al. , Flow cytometric sensitivity and characteristics of plasma cells in patients with multiple myeloma or its precursor disease: influence of biopsy site and anticoagulation method, Leuk. Lymphoma 56 (2015) 1416–1424. [DOI] [PMC free article] [PubMed] [Google Scholar]
- [17].Arroz M, Came N, Lin P, et al. , Consensus guidelines on plasma cell myeloma minimal residual disease analysis and reporting, Cytometry B Clin. Cytom 90 (2016) 31–39. [DOI] [PubMed] [Google Scholar]
- [18].Paiva B, Vidriales MB, Perez JJ, et al. , Multiparameter flow cytometry quantification of bone marrow plasma cells at diagnosis provides more prognostic information than morphological assessment in myeloma patients, Haematol.- Hematol. J 94 (2009) 1599–1602. [DOI] [PMC free article] [PubMed] [Google Scholar]
- [19].San Miguel JF, Almeida J, Mateo G, et al. , Immunophenotypic evaluation of the plasma cell compartment in multiple myeloma: a tool for comparing the efficacy of different treatment strategies and predicting outcome, Blood 99 (2002) 1853–1856. [DOI] [PubMed] [Google Scholar]
- [20].Rawstron AC, Orfao A, Beksac M, et al. , Report of the European myeloma network on multiparametric flow cytometry in multiple myeloma and related disorders, Haematol.- Hematol. J 93 (2008) 431–438. [DOI] [PubMed] [Google Scholar]
- [21].Almeida J, Orfao A, Ocqueteau M, et al. , High-sensitive immunophenotyping and DNA ploidy studies for the investigation of minimal residual disease in multiple myeloma, Br. J. Haematol 107 (1999) 121–131. [DOI] [PubMed] [Google Scholar]
- [22].Salem DAR, Korde N, Venzon DJ, et al. , Expression of the IL-6 receptor alpha-chain (CD126) in normal and abnormal plasma cells in monoclonal gammopathy of undetermined significance and smoldering myeloma, Leuk. Lymphoma 59 (2018) 178–186. [DOI] [PMC free article] [PubMed] [Google Scholar]
- [23].Lee L, Bounds D, Paterson J, et al. , Evaluation of B cell maturation antigen as a target for antibody drug conjugate mediated cytotoxicity in multiple myeloma, Br. J. Haematol 174 (2016) 911–922. [DOI] [PubMed] [Google Scholar]
- [24].Bellucci R, Alyea EP, Chiaretti S, et al. , Graft-versus-tumor response in patients with multiple myeloma is associated with antibody response to BCMA, a plasma-cell membrane receptor, Blood 105 (2005) 3945–3950. [DOI] [PMC free article] [PubMed] [Google Scholar]
- [25].Carpenter RO, Evbuomwan MO, Pittaluga S, et al. , B-cell maturation antigen is a promising target for adoptive T-cell therapy of multiple myeloma, Clin. Cancer Res 19 (2013) 2048–2060. [DOI] [PMC free article] [PubMed] [Google Scholar]
- [26].Yong KL, Germaschewski FM, Rodriguez-Justo M, et al. , Evaluation of bcma as a therapeutic target in multiple myeloma using an antibody-drug conjugate, Blood (2013) 122. [Google Scholar]
- [27].Wang L, Abbasi F, Jasper GA, et al. , Variables in the quantification of CD4 in normals and hairy cell leukemia patients, Cytometry Part B-Clin. Cytometry 80B (2011) 51–56. [DOI] [PMC free article] [PubMed] [Google Scholar]
Associated Data
This section collects any data citations, data availability statements, or supplementary materials included in this article.