

SUMMARY
Rapid alterations in cellular metabolism allow tissues to maintain homeostasis during changes in energy availability. The central metabolic regulator acetyl-CoA carboxylase 2 (ACC2) is rapidly phosphorylated during cellular energy stress by AMP-activated protein kinase (AMPK) to relieve its suppression of fat oxidation. While ACC2 can also be hydroxylated by prolyl hydroxylase 3 (PHD3), the physiological consequence thereof is poorly understood. We find that ACC2 phosphorylation and hydroxylation occur in an inverse fashion. ACC2 hydroxylation occurs in conditions of high energy and represses fatty acid oxidation. PHD3-null mice demonstrate loss of ACC2 hydroxylation in heart and skeletal muscle and display elevated fatty acid oxidation. Whole body or skeletal muscle-specific PHD3 loss enhances exercise capacity during an endurance exercise challenge. In sum, these data identify an unexpected link between AMPK and PHD3, and a role for PHD3 in acute exercise endurance capacity and skeletal muscle metabolism.
INTRODUCTION
Metabolic rewiring plays a fundamental role in maintaining energy homeostasis. In many tissues, fatty acids are oxidized to enable adaptation during conditions of energetic stress, such as nutrient deprivation, cold tolerance, oxidative stress, or exercise (Galgani and Ravussin, 2008; Woods and Ramsay, 2011; Palm and Thompson, 2017; Efeyan et al., 2015; Lee et al., 2016; Chouchani et al., 2016; Grunt, 2018; Herzig and Shaw, 2018). However, the acute molecular mechanisms that maintain low fatty acid oxidation (FAO) in response to energy-replete conditions are not completely understood.
Cellular energy stress is accompanied by a decrease in ATP levels and subsequent increase in the AMP/ATP ratio, leading to activation of AMP-activated protein kinase (AMPK) (Hardie et al., 2012; Gowans and Hardie, 2014). In response to high AMP/ATP, AMPK phosphorylates acetyl-CoA carboxylase (ACC) 1 and 2, which convert acetyl-CoA into malonyl-CoA. Phosphorylation of ACC1 and ACC2 inhibits their enzymatic activity, in part by blocking formation of the most active, oligomeric form of ACC (Wei and Tong, 2014). In the cytosol, ACC1 generates pools of malonyl-CoA thought to be important for de novo lipogenesis. ACC2, which is associated with the outer mitochondrial membrane, generates malonyl-CoA to inhibit carnitine palmitoyltransferase 1 (CPT1), which mediates the first step of long chain fatty acid transport into the mitochondria. By blocking CPT activity, ACC2 prevents substrate entry into mitochondrial FAO. Thus, by phosphorylating both ACC isoforms, AMPK coordinates the rates of cellular fat synthesis and catabolism.
We recently showed that acute myeloid leukemia cells with low PHD3 expression exhibited decreased ACC2 hydroxylation and elevated FAO (German et al., 2016), raising the possibility that PHD3 may function in normal tissues by hydroxylating ACC2 to regulate FAO directly. The prolyl hydroxylase domain family (PHDs 1-3, also called EGLN1-3) are alpha-ketoglutarate-dependent dioxygenases that hydroxylate proline residues (Epstein et al., 2001), and the hydroxylation of HIF1α has been studied extensively (Tennant and Gottlieb, 2010; Epstein et al., 2001). However, whether PHD3 affects ACC2 hydroxylation and FAO in normal physiology has not been examined and is the focus of this current study.
Here, we present the first investigation of PHD3 in skeletal muscle energy metabolism and exercise capacity. We report that PHD3 affects the level of ACC2 hydroxylation on proline 450 in response to nutrient and energy availability in mammalian cells and in mouse tissues. While ACC2 is phosphorylated in energy-deficient states, hydroxylation increased in high glucose conditions. The phosphorylation of ACC2 impedes PHD3 binding and hydroxylation of ACC2, demonstrating one potential mechanism for the inverse relationship between ACC2 phosphorylation and hydroxylation. Using whole body or muscle-specific PHD3-null mice, we probed the relevance of PHD3 during fasting and exercise challenges. PHD3 loss increases FAO in cells and in skeletal muscle. Furthermore, skeletal muscle-specific loss of PHD3 is sufficient to increase exercise capacity in mice. Thus, we elucidate a previously unidentified role for PHD3 signaling in energy homeostasis and exercise capacity.
RESULTS
ACC2 hydroxylation is sensitive to glucose and negatively regulated by AMPK
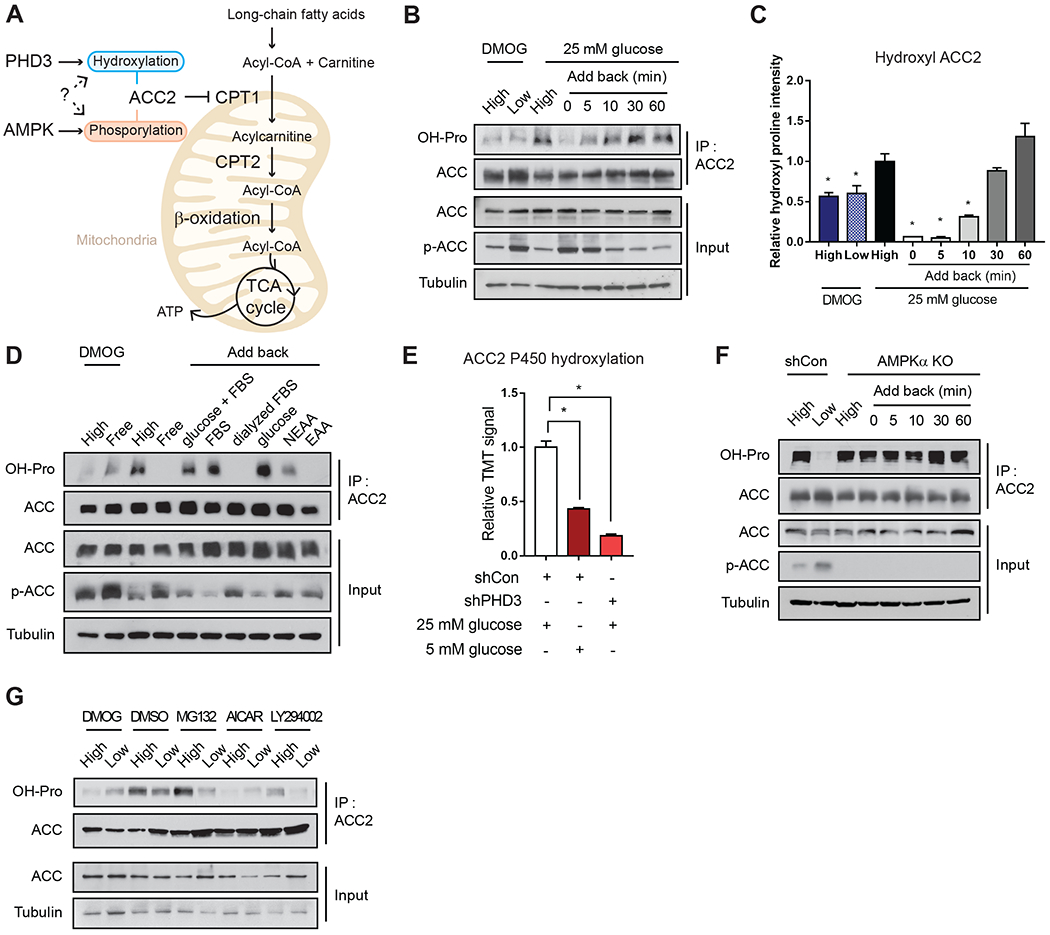
In this study, we sought to probe whether PHD3 affects ACC2 hydroxylation and FAO during acute nutrient fluctuation (Figure 1A). As PHD3 is an alpha-ketoglutarate-dependent dioxygenase and activation of ACC2 would subsequently repress FAO, we reasoned that PHD3 may hydroxylate ACC2 in response to nutrient availability. Furthermore, while both PHD3 and AMPK signaling potentially converge on ACC2 through distinct post-translational modifications (PTMs), whether these PTMs act in a concerted manner to regulate ACC2 activity has not been explored (Figure 1A). First, to examine whether PHD3 activity was sensitive to fluctuations in nutrient availability, we probed ACC2 hydroxylation in mouse embryonic fibroblasts (MEFs) cultured in the presence of low (5 mM) or high glucose (25 mM) in the presence of 10% FBS (Figure 1B). As expected, because AMPK is active in low nutrient conditions in many cell types, we observed increased ACC2 phosphorylation in low glucose (Figure 1B) (Salt et al., 1998; Laderoute et al., 2006). We observed an opposite pattern of hydroxylation in ACC2 (Figure 1B and 1C) as detected by the reactivity of immunoprecipitated ACC2 to an antibody against proline hydroxylation. Importantly, the addition of 25 mM glucose caused ACC2 hydroxylation within 5 minutes, but not in cells treated with the pan-PHD inhibitor dimethyloxalylglycine (DMOG) (Figure 1B and 1C). DMOG treatment significantly decreased hydroxyl-ACC2 levels compared to untreated control cells in high glucose media (Figure 1B and 1C). We also tested whether other energetic inputs affected ACC2 reactivity with the hydroxy-proline antibody (Figure S1A). In contrast to high glucose, the addition of amino acids, fatty acids or dialyzed serum resulted in modest to no induction of ACC2 hydroxylation (Figure 1D, Figure S1B and S1C). In sum, these data suggest a rapid induction in ACC2 hydroxylation in response to glucose.
Figure 1.
ACC2 hydroxylation is energy-sensitive and negatively regulated by AMPK.
(A) Schematic of the potential roles for ACC2 phosphorylation and hydroxylation in mitochondrial fat oxidation. (B) MEFs were cultured in high (25 mM) or low (5 mM) glucose media for 12 hr with or without DMOG (1 mM). Then, cells were cultured in 25 mM glucose for the indicated times. ACC2 hydroxylation was detected following ACC2 immunoprecipitation and western blotting with pan-hydroxyproline antibody. Whole cell lysates (input) were probed with anti-ACC2, anti-phospho-ACC or anti-tubulin antibodies. A representative blot from three independent experiments is shown. (C) Quantitation of 3 independent western blots is shown in (B). Hydroxyl ACC2 was normalized to the level of total, immunoprecipitated ACC. The ratio of hydroxyl ACC2:total ACC2 was normalized to the level of respective tubulin level (n=3). (D) ACC2 hydroxylation was assessed in cells that were cultured for 8 hours in the indicated fuel conditions (further described in Figure S1A): 1 mM DMOG; High, 25 mM glucose with serum; Free, media without Glu, FBS, or glucose; glucose+FBS, 25 mM glucose with serum; FBS, no glucose with serum; Dialyzed FBS, no glucose with dialyzed FBS; glucose, 25 mM glucose without serum; NEAA, no glucose with 1% non essential amino acids; EAA, no glucose with 1% essential amino acid. (E) Representative Tandem Mass Tag (TMT) signals identifying hydroxylated P450 on ACC2 in 293T cells in cultured in 25 mM glucose media (white), 5 mM glucose media (dark red) or PHD3 knockdown cells cultured in 25 mM glucose media (red). (F) Hydroxylation was measured from ACC2 immunoprecipitates from wild type control or AMPKα knockout MEFs cultured in 25 versus 5 mM glucose, as in panel B. (G) ACC2 hydroxylation in MEFs in high or low glucose, in the presence of DMOG (1 mM for 1 h), DMSO, MG132 (10 mM for 1 h), AICAR (1 mM for 1 h) and LY294002 (50 mM for 1 h).
We next utilized Tandem Mass Tag (TMT) labeling to quantify hydroxylation changes on specific proline residues in ACC2 in response to changes in glucose or PHD3 levels using mass spectrometry (Paulo, 2016; Navarrete-Perea et al., 2018; Berberich et al., 2018). In ACC2 immunoprecipitates from MEFs cultured in 25 mM glucose, we observed a number of proline residues modified with a +15.9949 mass shift (Figure S1D). However, only the P450 residue demonstrated increased +15.9949 mass shift in a glucose- or PHD3-dependent manner (Figure 1E, Figure S1E–G). The P450 +15.9949 mass shift was reduced by 2.3-fold in control cells cultured in 5 mM glucose compared with 25 mM glucose media. The P450 +15.9949 mass shift was diminished 5.3-fold in PHD3-knockdown (KD) cells compared with control MEFs. These data are similar in magnitude to the fold-changes observed in ACC2 hydroxylation detected by western blotting (Figure S1H).
Our data show that ACC2 was hydroxylated in glucose-rich media, whereas ACC2 is phosphorylated under low glucose conditions (Figure 1D). Thus, we aimed to understand whether AMPK influenced PHD3 activity or vice versa. First, we tested whether PHD3 activity was affected by AMPK loss of function by measuring ACC2 hydroxylation in MEFs lacking the alpha catalytic subunit of AMPK (Figure 1F). Strikingly, the loss of AMPKα led to constitutive hydroxylation of ACC2 in a manner that was insensitive to glucose levels (Figure 1F). Cells treated with 5-aminoimidazole-4-carboxamide ribonucleotide (AICAR), which leads to constitutive activation of AMPK, decreased ACC2 hydroxylation (Figure S1I). PHD3 expression was unchanged by ACC2 depletion or energy stress, and the depletion of PHD3 in MEFs did not alter ACC2 protein or mRNA levels (Figure 1B, Figure S1J–L). Likewise, PHD3-KD did not affect the levels of ACC phosphorylation in these conditions (Figure S1H and S1I).
As PI3K/AKT signaling is known to coordinate with AMPK signaling, we investigated whether modulation of this pathway likewise affected ACC2 hydroxylation (Manning and Toker, 2017; Inoki at el., 2003). Treatment with LY294002 (PI3K/AKT inhibitor) or MG132 (proteasome inhibitor) did not significantly alter ACC2 hydroxylation status compared to the DMSO control (Figure 1G), while AICAR treatment decreased hydroxylation of ACC2, assessed with a pan-hydroxyl antibody (Figure 1G). Taken together, these cellular data suggest that PI3K/AKT does not affect ACC2 hydroxylation under these conditions, and that the AMPK-mediated phosphorylation of ACC2 inhibits PHD3-mediated hydroxylation.
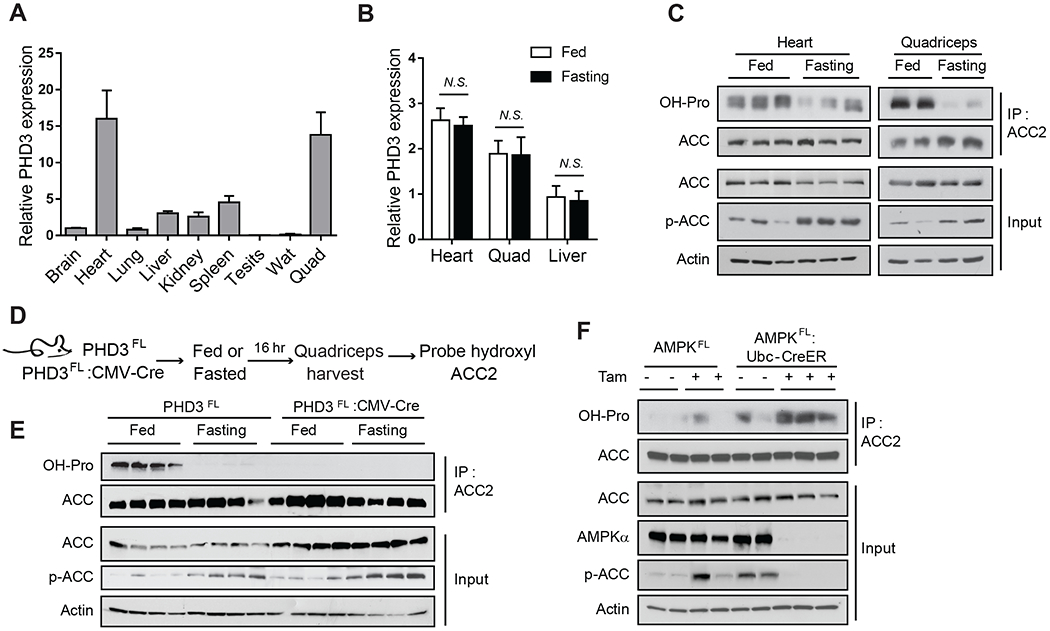
We next examined whether PHD3 and ACC2 hydroxylation were sensitive to changes in nutrient availability in vivo. ACC2 loss results in increased overall energy expenditure in mice, demonstrating a key role for fatty acid metabolism in physiological energy homeostasis (Choi et al., 2007). In order to activate AMPK in vivo, we fasted mice for 16 hours, and assessed ACC2 hydroxylation and phosphorylation levels from heart and quadriceps muscle. These tissues were probed because they expressed the highest levels of PHD3 compared to brain, lung, liver, kidney, spleen, testis and white adipose tissue (Figure 2A). Although PHD3 expression was unchanged with fasting (Figure 2B), ACC2 hydroxylation was significantly decreased in heart and quadriceps from fasted mice relative to fed mice (Figure 2C). Conversely, phosphorylated ACC2 was increased after fasting in both tissues, consistent with the reported elevated AMPK activity under these conditions (Figure 2C) (Bujak et al., 2015; Galic et al., 2018).
Figure 2.
PHD3-mediated ACC2 hydroxylation in mouse tissues.
(A) PHD3 mRNA expression in mouse brain, heart, lung, liver, kidney, spleen, testis, white adipose tissue, and quadriceps (n=4), normalized to the expression of β–actin. (B) PHD3 mRNA expression in heart, quadriceps, and liver isolated from fed or fasted (16 h) mice (n=4). (C) ACC2 hydroxylation, ACC2 level, and ACC2 phosphorylation was assessed by western blotting from heart and quadriceps muscle isolated from animals that were fed or fasted (16 h). For hydroxylation, ACC2 was immunoprecipitated from tissue lysates in the presence of DMOG, and then hydroxylation was detected using antibodies against pan-hydroxyproline and compared to the amount of immunoprecipitated ACC2. ACC2 input levels, ACC2 phosphorylation, and actin were measured in tissue lysates by immunoblotting. (D) Schematic of the detection of ACC2 hydroxylation in PHD3FL or PHD3FL:CMV-Cre mouse quadriceps under fed or fasted condition. (E) Immunoprecipitation and western blot analysis of ACC2 hydroxylation and phosphorylation in PHD3FL or PHD3FL:CMV-Cre mouse quadricep muscles from fed and fasted animals (n=4). (F) Immunoprecipitation and western blot analysis of ACC2 hydroxylation in quadriceps from AMPKFL and AMPKFL;Ubc-CreER mice. AMPKFL;Ubc-CreER mice were treated with tamoxifen (4 mg per day, for 5 days) to induce knockout of AMPK. Quadriceps were harvested 3 weeks post-tamoxifen treatment and protein was extracted.
To determine if PHD3 was required for ACC2 hydroxylation in vivo, we examined tissues from mice lacking PHD3, which were generated by crossing PHD3FL mice with CMV-Cre animals to obtain whole body PHD3-CMV-Cre knock-out (KO) animals (PHD3FL:CMV-Cre) or PHD3FL controls (Figure S2A–C) (Takeda et al., 2006). While the level of ACC2 protein did not significantly change under these conditions, PHD3FL:CMV-Cre animals demonstrated reduced ACC2 hydroxylation in quadriceps muscle (Figure 2D and 2E). Loss of PHD3 did not affect ACC2 phosphorylation, consistent with the cellular data (Figure 2E).
To determine whether AMPK signaling impacts ACC2 hydroxylation in vivo, we measured ACC2 hydroxylation in AMPKα-KO mice. AMPKFL-Ubc-CreER (AMPKα-KO) mice were treated with 4 mg of tamoxifen for 5 days to knock out AMPK, and ACC2 hydroxylation was probed in AMPKα-KO mice quadriceps (Figure 2F). ACC2 was not phosphorylated in these animals due to loss of AMPK catalytic activity (Figure 2F) and demonstrates that ACC2 is phosphorylated solely by AMPK in these conditions. Consistent with in vitro data, loss of AMPK activity in vivo increased the ACC2 hydroxylation signal compared to control mice (Figure 2F). Taken together, these findings demonstrate that the ACC2 hydroxylation signal is dependent on PHD3 in vivo, sensitive to the energy status of tissues, and repressed by AMPK.
ACC2 and PHD3 binding is disrupted by serine 222 phosphorylation of ACC2.
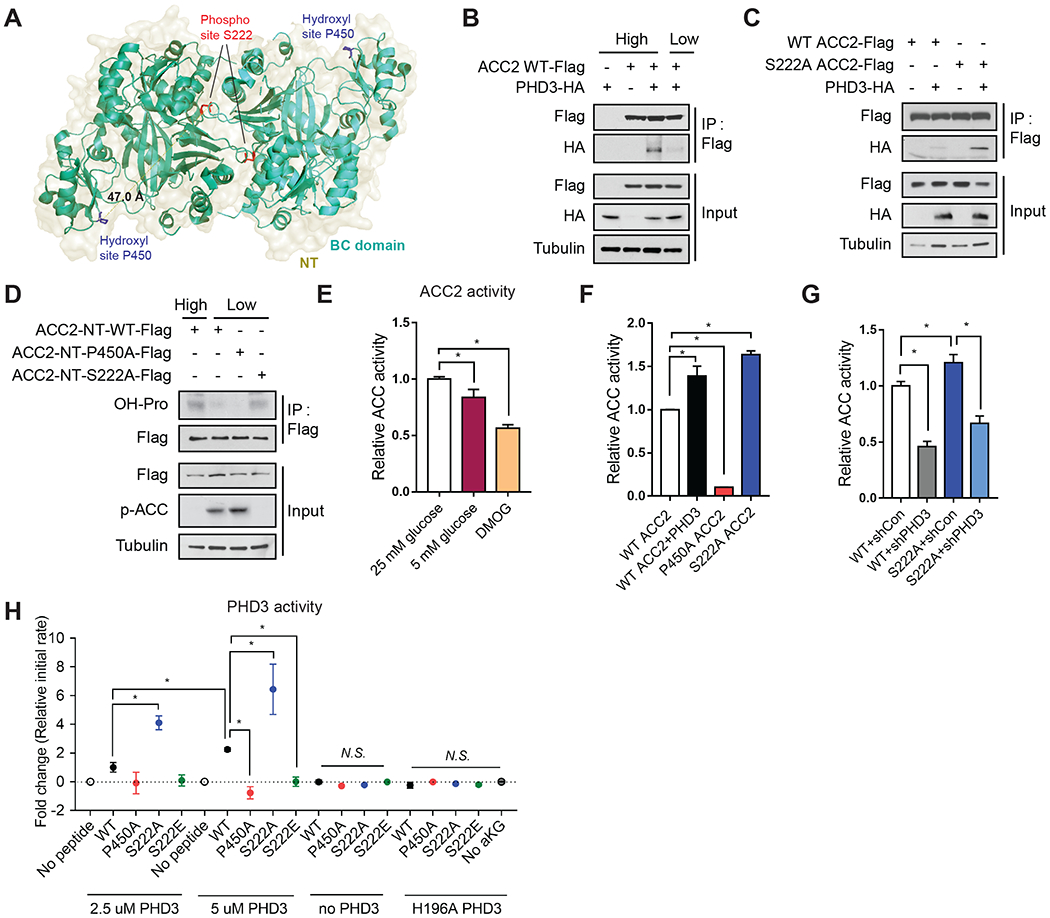
As ACC2 physically binds PHD3 (Tran et al., 2015; German et al., 2016), we postulated that this binding may be sensitive to cellular nutrient status. ACC2 is a 280 kDa multi-domain enzyme, comprised of N-terminal (NT), biotin carboxylase (BC), carboxyltransferase (CT), and biotin carboxyl carrier protein (BCCP) domains (Figure 3A, Figure S3A–B) (Tran et al., 2015; Tong et al., 2006). ACC2 residues S222 and P450 reside in the NT and BC domains, respectively (Figure 3A, Figure S3A). These domains were modeled to form a dimer with an interface adjacent to S222 phosphorylation sites, whereas P450 resides on the outside of the dimer interface (Figure 3A). In 293T cells co-expressing C-terminal-Flag-tagged ACC2 and C-terminal-HA-tagged PHD3, ACC2 and PHD3 co-immunoprecipitated in 25 mM glucose, but showed little interaction in 5 mM glucose (Figure 3B), suggesting glucose-dependent co-immunoprecipitation.
Figure 3.
The effect of ACC2 phosphorylation on ACC2 hydroxylation and activity.
(A) P450 (hydroxylation site, blue) is located in the ACC2 BC domain (green and cyan, PDB: 3JRW). The distance between S222 (phosphorylation site, red) and hydroxylation sites in this modeled structure is ~50 Å. This model was generated by superposition of human ACC2 biotin carboxylase domain (PDB: 3JRW) with the yeast cryo-electron microscopy structure of entire ACC (PDB: 5CSL). (B) HEK293T cells were transfected with ACC2-Flag and/or PHD3-HA. Cells were incubated with 25 mM (high) or 5 mM glucose (low) media for 8 h and complexes were immunoprecipitated using anti-Flag antibody and immunoblotted with the indicated antibodies. (C) IP and western blot analysis of PHD3 and ACC2 interaction from HEK293T cells overexpressing PHD3-HA, ACC2-WT-Flag, or S222A ACC2-Flag. (D) ACC2 N-terminus (NT)-WT-Flag, ACC2 NT-P450A-Flag, ACC2 NT-S222A-Flag and/or PHD3-HA were transfected into HEK293T cells. Complexes were immunoprecipitated using anti-Flag antibody and proteins were detected by immunoblotting using the indicated antibodies. (E) Endogenous ACC2 was immunoprecipitated from HEK293T cells cultured in 25 mM glucose, 5 mM glucose, or DMOG for 8 hours. ACC activity was assessed by measuring [14C]malonyl-CoA production from [14C]sodium bicarbonate and acetyl-CoA. Activity was normalized to the amount of immunoprecipitated ACC2 (n=4). (F-G) ACC activity assay was performed as described in panel in (F) MEFs overexpressing full length WT ACC2-Flag, P450A ACC2-Flag, S222A ACC2-Flag, or PHD3-HA (n = 3) and in (G) shcontrol or shPHD3 MEFs overexpressing full length WT ACC2-Flag or S222A ACC2-Flag (n=4). (H) In vitro hydroxylation assay was performed to assess PHD3 activity be measuring succinate production using recombinant PHD3 incubated with the immunoprecipitated N-terminus domain of WT ACC2-Flag (aa 1-763), P450A ACC2-Flag, S222A ACC2-Flag, or S222E ACC2-Flag, which were eluted using Flag peptide. 2.5 uM or 5 uM of PHD3 was added to reactions containing 20 uM of ACC2. Initial rates were determined and normalized using controls which contained no peptide to account for uncoupled decarboxylation. Additional negative controls included ACC2 only, lacking PHD3 and reactions with the catalytic inactive variant H196A PHD3 (n=3 independent experiments).
To gain molecular insight into this glucose dependency, we tested whether ACC phosphorylation interfered with PHD3 binding by measuring the co-immunoprecipitation of PHD3-HA with WT ACC2, S222A ACC2, or S222E ACC2 in 293T cells. PHD3 co-immunoprecipitated with the S222A variant of ACC2 with greater intensity compared to WT ACC2, demonstrating that lack of phosphorylation may increase the physical association between ACC2 and PHD3 (Figure 3C).
To begin to biochemically define the interaction between these proteins, we mapped the ACC2 domain(s) important for binding to PHD3 (Figure S3C–H). Amino acid residues S222 and P450 reside in the N- terminal domain region and the BC domain, respectively. Each domain was expressed recombinantly in E. coli with a C-terminal GST-tag, purified, and incubated in vitro with recombinant PHD3-HA-His to test their ability to co-immunoprecipitate. Importantly, structural information exists for these ACC domains, demonstrating intrinsic stability and protein folding. For example, the BC domain alone is sufficient to fold properly and retain activity (Cho et al., 2010; Wei and Tong, 2015). We observed that the BC domain co-immunoprecipitated with PHD3 in vitro, while the CT and BCCP domains demonstrated little co-immunoprecipitation in this assay (Figure S3C–E). The reciprocal immunoprecipitation with anti-HA (Figure S3F–H) also identified selective binding between PHD3 and the BC domain (Figure S3C–I) under these conditions.
Since AMPK activity represses ACC2 hydroxylation, we wondered whether the S222A ACC2 mutation, which prevents phosphorylation, would be sufficient to affect PHD3-ACC2 binding interactions. We generated constructs to overexpress the N-terminal domain of WT ACC2 containing amino acids 1-763 (ACC2-NT-WT) or an AMPK phospho-mutant (ACC2-NT-S222A) in 293T cells (Figure S3B). This truncated variant contains the BC and ATP grasp domains but migrates distinctly from full length ACC (~250 kDa), allowing us to distinguish the effect of this variant from endogenous ACC. As expected, ACC2-NT-WT co-immunoprecipitated with PHD3 and displayed elevated hydroxylation when cells were cultured in high glucose (Figure 3D, Figure S3I–J), while ACC2-NT-P450A demonstrated lower hydroxylation (Figure 3D). Finally, the constitutively dephosphorylated mutant ACC2-NT-S222A displayed elevated hydroxylation, as assessed by reactivity with a pan-hydroxyl proline antibody.
We next examined the effects of glucose, PHD3, and ACC2 modifications on the activity of immunoprecipitated ACC2 by measuring [14C]malonyl-CoA production from [14C]sodium bicarbonate and acetyl-CoA. [14C]malonyl-CoA production was decreased in 5 mM glucose and with DMOG treatment compared to WT 293T cells cultured in 25 mM glucose (Figure 3E). To test if ACC2 activity was affected by PHD3, we measured [14C]malonyl-CoA production from WT ACC2, P450A ACC2 or S222A ACC2 in PHD3 overexpressing 293T cells (Figure 3F). While P450A ACC2 demonstrated low activity, WT ACC2 activity increased with PHD3 overexpression. S222A ACC2 showed increased activity compared with WT ACC2 (Figure 3F). Furthermore, ACC2 activity was reduced by PHD3 knockdown in both conditions (Figure 3G). Taken together, these results show that PHD3 modulation affects [14C]malonyl-CoA production by ACC2.
To probe further if S222 phosphorylation directly affects ACC2 hydroxylation, we measured the activity of purified, recombinant PHD3 from E. coli using the N-terminal domains of immunoprecipitated ACC2, P450A ACC2, S222A ACC2, or S222E ACC2 as substrates. PHD3 uses oxygen and alpha-ketoglutarate to hydroxylate target proline residues, generating carbon dioxide and succinate in the process. Thus, to assess PHD3 activity, we measured the production of succinate using mass spectrometry (Figure 3H). In the presence of WT ACC2 we observed succinate production, whereas we did not observe detectable succinate production in the presence of P450A ACC2 (Figure 3H). Likewise, we observed significant succinate production in the presence of the S222A ACC2 variant N-terminal domain, but not S222E ACC2 variant, which mimics constitutive phosphorylation (Figure 3H). Thus, these findings suggest that PHD3 activity is diminished with phosphorylated ACC.
PHD3 represses fat catabolism in vivo
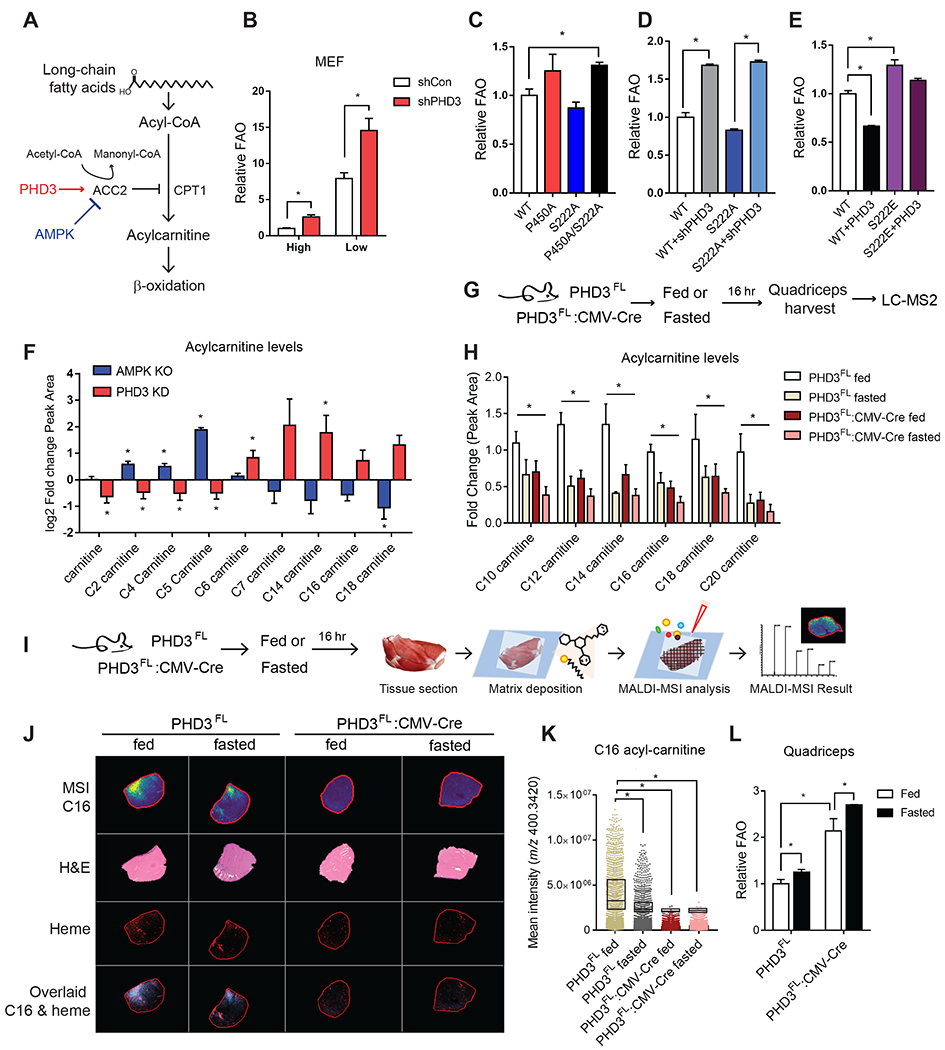
We next assessed the effect of PHD3 and ACC2 PTMs on fat catabolism. As long-chain fatty acids are prepared for the multi-step process of mitochondrial import, they must be converted to acyl-carnitines by CPT1, which is inhibited by ACC2 activity (McCoin et al., 2015) (Figure 4A). The oxidation of [9,10-3H(N)]-palmitic acid can be monitored by following the production of 3H2O. In MEFs, 5 mM glucose media increased FAO in cells. PHD3 knockdown increased FAO in both conditions when compared with control cells (Figure 4B). We repeated these experiments in C2C12 cells, which are mesenchymal stem cells, classically used as a model of muscle cells (Millay et al., 2013). Similar to HEK293Ts and MEFs, FAO increased in C2C12 cells with PHD3 silencing (shPHD3) (Figure S4A). In addition, PHD3 knockdown lowered ACC2 hydroxylation in C2C12 cells (Figure S4B). Collectively, our findings demonstrate that PHD3 modulates FAO at the level of ACC2.
Figure 4.
Loss of PHD3 results in increased fatty acid catabolism in mouse muscle.
(A) Schematic of the regulation of long-chain fatty acid oxidation by PHD3 and AMPK. (B) Palmitate oxidation in WT or PHD3 knockdown MEFs under high or low nutrient condition using FAO analysis (n = 3). (C) Palmitate oxidation assay in MEFs with overexpressed ACC2 WT, P450A ACC2, S222A ACC2 or P450A/S222A ACC2 double mutant (n = 3) using FAO analysis. (D) FAO analysis in MEFs overexpressed WT ACC2 or S222A ACC2 with PHD3 silencing (n = 3). (E) Palmitate oxidation assay in MEF cell lines with overexpression WT ACC2, S222E, or PHD3 (n=3). (F) Relative abundance of acyl-carnitines in MEFs depleted of PHD3 (red) and AMPK (blue) compared to control cells. For all comparisons two-tailed t test was used. N = 4, P < 0.05. (G) Flowchart of the metabolomic analysis using LC-MS in PHD3FL or PHD3FL:CMV-Cre mouse under fed or fasted condition. (H) The relative metabolite abundance of long chain acyl-carnitines in PHD3FL or PHD3FL:CMV-Cre mouse quadriceps under fed or fasted condition (n = 4). (I) Flowchart of the metabolomics analysis in PHD3FL or PHD3FL:CMV-Cre mouse quadriceps under fed or fasted condition. (J) Matrix-assisted laser desorption/ionization mass spectrometry imaging (MALDI-MSI) of palmitoylcarnitine (C16 acyl-carnitine, m/z 400.3420, Δppm = 1.16) in PHD3FL or PHD3FL:CMV-Cre mouse quadriceps under fed or fasted conditions, alongside H&E stained serial sections. Comparison of how distribution of different ions - acyl-carnitine distribution correlates with vasculature. (K) The scatter dot plot indicates the relative abundance of palmitoyl-carnitine under each condition. (L) Palmitate oxidation in PHD3FL or PHD3FL: CMV-Cre mice quadriceps under fed or fasted condition using [14C]-palmitate as a substrate and measuring 14CO2 capture on filter membrane as readout for FAO (n=4).
We next tested whether ACC2 phosphorylation affected the ability of PHD3 to regulate FAO. AMPK-mediated phosphorylation of ACC2 activates FAO (Cho et al., 2010; O’Neill et al., 2014). In high glucose, palmitate oxidation was not significantly altered in MEFs overexpressing the S222A ACC2 mutation compared to WT ACC2 cells cultured in high glucose (Figure 4C). As expected, MEFs overexpressing the P450A mutation displayed elevated palmitate oxidation compared with WT MEFs (Figure 4C). Cells expressing P450A/S222A ACC2 had increased FAO compared to WT (20.7%), similar to the P450A mutation alone (Figure 4C). We also measured FAO in the presence or absence of PHD3 knockdown and S222A ACC2. When PHD3 levels were reduced, FAO was increased in both ACC2 WT and S222A ACC2 expressing cells (Figure 4D). Conversely, PHD3 overexpression repressed fat oxidation (Figure 4E). Finally, based on our observation that AMPK activity repressed ACC hydroxylation, we tested whether the expression of S222E ACC2 would restore fat oxidation in the presence of PHD3 overexpression. Indeed, fat oxidation remained elevated in cells expressing both S222E ACC2 and PHD3 (Figure 4E).
As an alternate read-out of lipid catabolism, we monitored acyl-carnitine and metabolite profiles (Figure S4C–E). Compared with respective controls, PHD3-KD MEFs possessed elevated levels of long-chain acyl-carnitines, while AMPK KO MEFs showed reduced acyl-carnitine levels with an inflection point at between C14 acyl-carnitine to C18 acyl-carnitine reflecting a shift in the balance between short- and long-chain acyl-carnitines (Figure S4C and Figure 4F). ACC2 levels appeared unchanged by PHD3 loss in 293T cells (Figure S4F and S4G). Additionally, PHD3 loss did not alter mtDNA copy number or the intensity of MitoTracker staining in both 293Ts and MEFs (Figure S4H–J).
Since glucose and fatty acids can both be converted to acetyl-CoA, activated fat oxidation may suppress glycolysis (De Leiris et al., 1975; Randle et al., 1963; Jenkins et al., 2011). To examine whether PHD3 regulates glucose oxidation in addition to fat oxidation, we measured the basal oxygen consumption rate (OCR) resulting from glucose or fat oxidation in WT or PHD3-KD MEFs using a Seahorse flux analyzer (Figure S4K and S4L). Basal glucose-driven respiration was unchanged in shPHD3 MEFs under high or low nutrient conditions compared to WT cells (Figure S4L). By contrast, loss of PHD3 increased basal fat oxidation-driven respiratory activity, consistent with increased FAO (Figure S4K).
To identify the changes in lipid metabolism driven by PHD3 in vivo, we measured long-chain acyl-carnitines in PHD3FL or PHD3FL:CMV-Cre mice quadriceps using liquid chromatography–tandem mass spectrometry (LC-MS) (Figure 4G). C12, C14, C16 and C18 acyl-carnitines were decreased in PHD3FL quadriceps under these fasted conditions in PHD3FL:CMV-Cre mice compared to PHD3FL mice (Figure 4H). In quadriceps, long chain acyl-carnitines were lower in PHD3FL mice under fasted conditions compared to fed PHD3FL mice (Figure 4H). These long-chain acyl-carnitines were even lower in PHD3FL:CMV-Cre relative to PHD3FL mice and remained low irrespective of nutrient status. These findings were corroborated using matrix-assisted laser desorption/ionization mass spectrometry imaging (MALDI-MSI) to assess spatial distribution of metabolite profiles in vivo (Figure 4I). Consistent with LC-MS data, C14 acyl-carnitine, C16 acyl-carnitine, and C18 acyl-carnitine levels decreased in PHD3FL quadriceps cryosections with fasting and were constitutively low in quadriceps cryosections from PHD3FL:CMV-Cre mice (Figure 4J and 4K, Figure S4M and S4N). Heme levels, indicative of tissue vascularization and oxygenation, remained unchanged in PHD3FL:CMV-Cre tissue (Figure 4J, S4O). Interestingly, we noted that while low glucose conditions in our cell culture experiments increased the levels of FAO (Figure 4B), fasting in mice decreased C14, C16 and C18 acyl-carnitines in quadriceps muscle. One account for this discrepancy could be that these fuels might have a higher oxidization rate during fasting in vivo, which would prevent acyl-carnitine accumulation. We directly measured the rate of [14C]palmitate oxidation in quadriceps isolated from PHD3FL and PHD3FL:CMV-Cre mice as previously described (Huynh et al., 2014). Palmitate oxidation increased in PHD3FL:CMV-Cre tissue homogenates compared to PHD3FL tissue, and increased in both groups after a 16 hour fast (Figure 4L). In these assay conditions, total ATP levels were unchanged by PHD3 loss (Figure S4P–T) (Sellick et al., 2011). These alterations appeared in the absence of global changes in serum free fatty acids (FFA), triglycerides (TG), glucose, body weight or lean body mass (Figure 5A–F).
Figure 5.
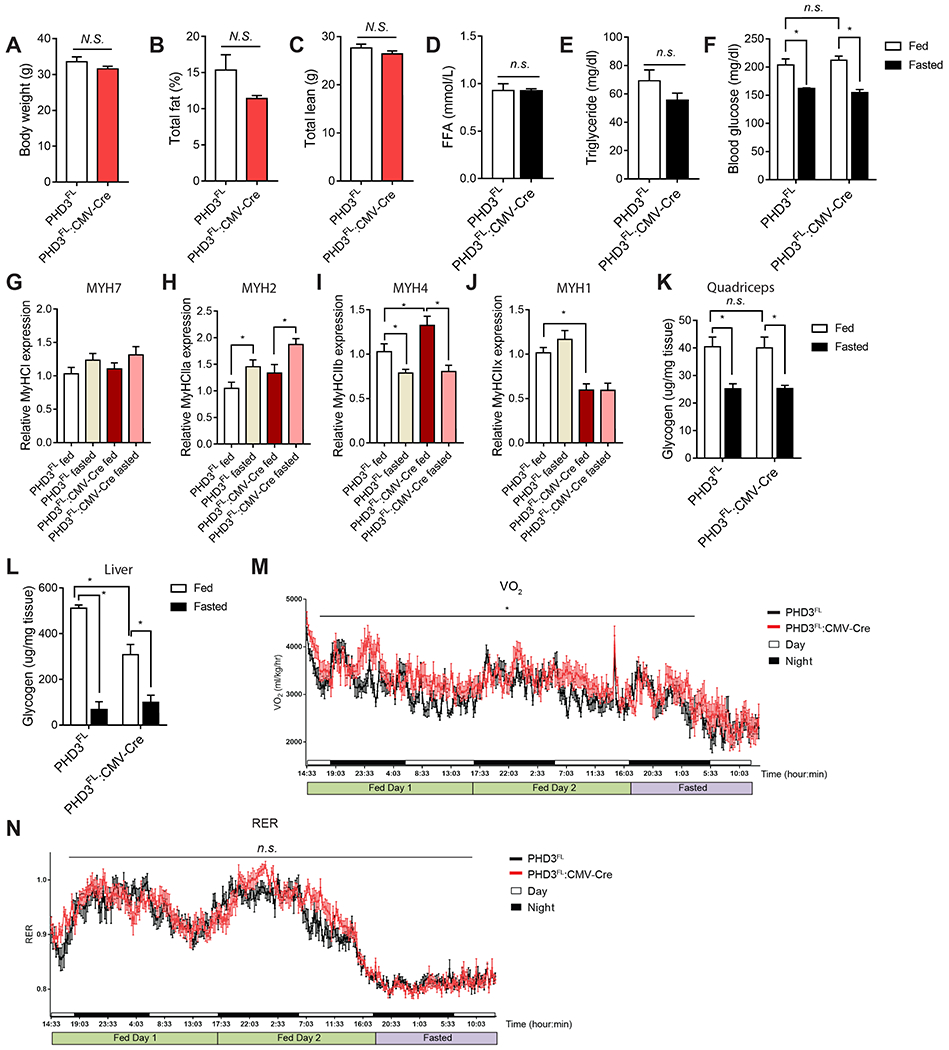
Characterization of PHD3FL:CMV-Cre mice.
Metabolic parameters were assessed in 20 week-old male PHD3FL or PHD3FL:CMV-Cre mice. Body weight (A), total fat (B), and total lean mass (C) were measured using DEXA imaging analysis (n = 9 mice per group). Blood FFA (D) and triglyceride (E) levels (n=4). (F) Blood glucose levels in PHD3FL or PHD3FL:CMV-Cre mice were measured under ad libitum feeding or after a 16 h fast (n=9 per condition). The mRNA levels of MYH7 (G), MYH2 (H), MYH4 (I) and MYH1 (J) in PHD3FL or PHD3FL:CMV-Cre mouse quadriceps under fed or fasting conditions (n = 4). Glycogen levels were measured and normalized by tissue weight of PHD3FL or PHD3FL:CMV-Cre mice quadriceps (K) or liver (L) under fed or fasted condition (n=4). (M) Mean whole body maximum oxygen consumption rate (VO2) was measured in 20 week old PHD3FL or PHD3FL:CMV-Cre mice using Comprehensive Lab Animal Monitoring System (CLAMS) (n=9). Animals were fed ad libitum for 48 hours and fasted for 16 hours. (N) Respiratory exchange ratio (RER) using CLAMS. Data represented means ± SEM. *P < 0.05.
Loss of PHD3 increases exercise capacity
Since PHD3 loss activates FAO in vitro and in vivo, and ACC2 and PHD3 are highly expressed in oxidative tissues (Figure 2A), we sought to identify physiological conditions where PHD3 function may be important. In an unbiased analysis using a publicly available human skeletal muscle dataset with 242 samples (GSE3307) (Bakay et al., 2006; Dadgar et al., 2014), PHD3 expression negatively correlated with mitochondrial and FAO-associated genes (Figure S5A). While PHD3 was highly expressed in skeletal muscle, its levels did not appear to significantly change in datasets from human skeletal muscle biopsies obtained from a post-exercise cohort in humans (GSE111551) (Figure S5B) or after a short endurance exercise challenge in mice (Figure S5C).
Next, we investigated the expression of genes associated with skeletal muscle development and physiology. Four adult myosin heavy chain (MYH, MyHC) isoforms are generally expressed in adult mouse muscle fibers, from slow twitch type to fast twitch type: myosin heavy chain 7 (MYH7, MyHC-I, type I myosin (slow) heavy chain 1), myosin heavy chain 2 (MYH2, MyHC-2a), myosin heavy chain 1 (MYH1, MyHC-2x), and myosin heavy chain 4 (MYH4, MyHC-2b) (Schiaffino, 2018). We assessed whether PHD3FL:CMV-Cre mice displayed changes in quadriceps muscle fiber type by measuring the gene expression of MYH7 and MYH2, markers of type I and type II fibers respectively (Figure 5G–J) (Bloemberg and Quadrilatero, 2012). Compared with control animals, PHD3FL:CMV-Cre mice displayed similar expression of MYH7 (Figure 5G). We observed modest changes in the expression of some MYH2 subtypes, but not all, when comparing PHD3FL and PHD3FL:CMV-Cre in fed verses fasted conditions (Figure 5H–J). We also examined the gene expression of muscle differentiation markers MyoD, which was increased, and myoglobin, which was unchanged in PHD3FL:CMV-Cre quadriceps compared to PHD3FL tissue (Figure S5D and S5E). MYH2 and ACC2 protein levels were similar in PHD3FL:CMV-Cre and PHD3FL quadriceps using immunofluorescence staining (Figure S5F–H). Distinct from the reported mitochondrial biogenesis associated with AMPK activation (Narkar et al., 2008), PHD3FL:CMV-Cre mouse quadriceps from unexercised mice showed a lack of global induction of TFB1M, TFB2M, PGC1α, cytochrome C, PDK4, and PPARα (Figure S5I).
As glycogen serves as a major source of stored energy, we also measured quadriceps and liver glycogen levels (Figure 5K and 5L). The level of glycogen in quadriceps was unchanged in PHD3FL:CMV-Cre mice compared to PHD3FL animals. In the liver, glycogen levels were reduced in fed PHD3FL:CMV-Cre mice, and became equally low in both groups upon fasting.
We next examined whole body energy homeostasis in PHD3FL:CMV-Cre animals by measuring the oxygen consumption (VO2), CO2 release (VCO2) and respiratory exchange ratio (RER) of PHD3FL and PHD3FL:CMV-Cre mice in fed versus fasted states (Figure 5M and 5N, S5J and S5K). Both VO2 and CO2 were increased in PHD3FL:CMV-Cre mice compared with PHD3FL animals, as analyzed by comprehensive lab animal monitoring system (CLAMS) (Figure 5M, S5J and S5K). As a result, RER was not significantly changed in PHD3FL:CMV-Cre animals compared to PHD3FL (Figure 5N and S5L).
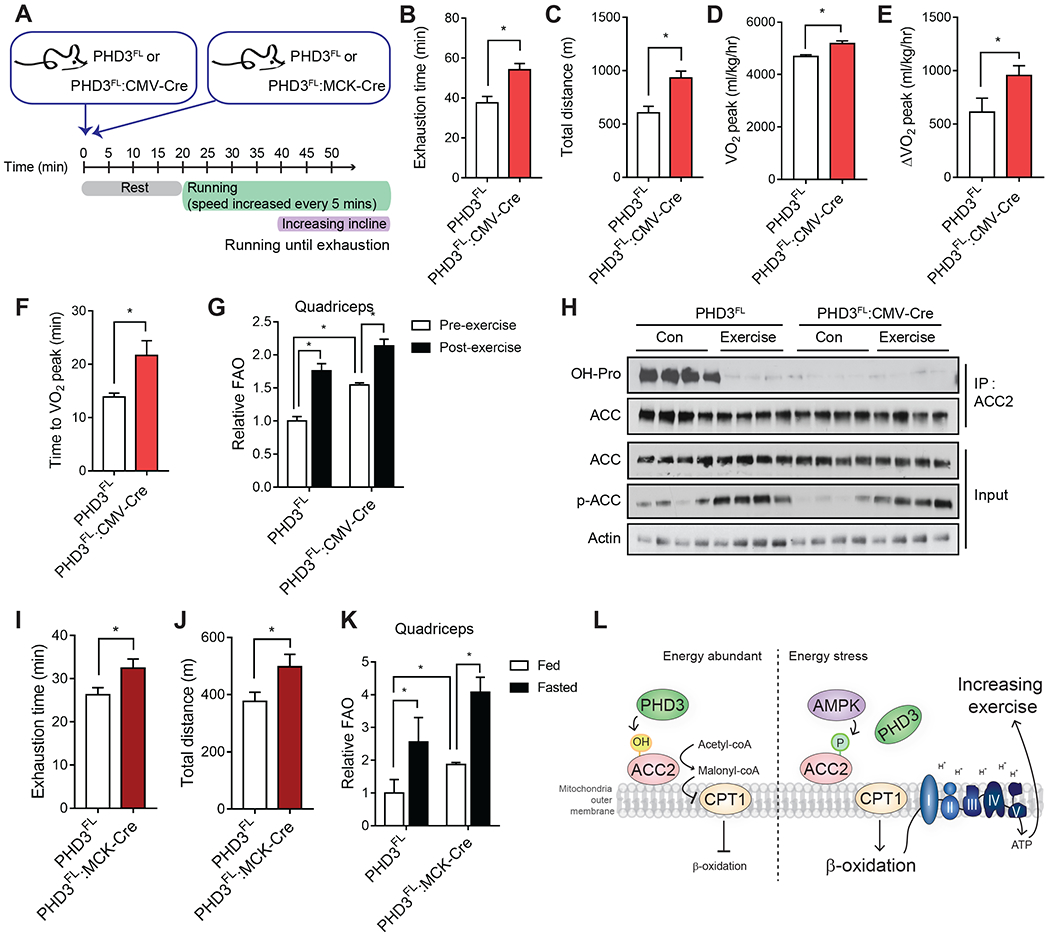
During exercise, muscle cells oxidize fatty acids, in addition to carbohydrates, to support energy demand (Spriet, 2014; Mul et al., 2015). Previous studies have shown that AMPK increases body energy expenditure through phosphorylation of ACC2 (O’Neill et al., 2014; Galic et al., 2018). Loss of ACC2 increases exercise capacity (Choi et al., 2007; Cho et al., 2010; Abu-Elheiga et al., 2003), and AMPK activators, such as AICAR, have been shown to increase exercise tolerance by up to 44%, in part by inducing mitochondrial gene expression and biogenesis (Narkar et al., 2008). Based on our biochemical, metabolic, and in vivo data supporting an inverse relationship between AMPK and PHD3, we hypothesized that PHD3 whole body knockout mice would possess increased energy expenditure and exercise capacity, and may display some features of AMPK activation in vivo. To test this idea, we analyzed exercise endurance in control and PHD3FL:CMV-Cre mice using a metabolic treadmill with a gradually increasing incline (Figure 6A, Figure S6A). PHD3FL and PHD3FL:CMV-Cre animals displayed increased VO2 consumption during exercise challenge (Figure S6B). During the exercise endurance challenge, PHD3FL:CMV-Cre mice displayed a robust and significant increase in VO2 compared with PHD3FL littermates, particularly during the high incline period (Figure S6B). In these studies, PHD3FL:CMV-Cre animals generated more VCO2 (Figure S6C), and as a result, the RER was not significantly changed compared with PHD3FL animals (Figure S6D).
Figure 6.
Loss of PHD3 increases exercise capacity.
(A) Flowchart of the endurance exercise experiments. PHD3FL:CMV-Cre mice demonstrated increased exercise tolerance compared to PHD3FL control mice after repetitive treadmill running (n = 8 mice per group). The individual exhaustion time (B), total running distance (C), mean whole body maximum oxygen consumption rate (D) of both genotypes was calculated from the individual performances during treadmill running. (E) △VO2 peak was calculated by subtracting the mean basal VO2 from the maximal VO2 peak for each indicated animal. (F) Time to maximum oxygen consumption rate. Data represent mean ± SEM. *P < 0.05. (G) Palmitate oxidation was determined in mitochondrial homogenates isolated from PHD3FL or PHD3FL: CMV-Cre mice quadriceps in pre- or post-exercise conditions using [14C]-palmitate as a substrate and measuring 14CO2 capture on filter membrane as readout for FAO (n=3). (H) Immunoprecipitation and western blotting analysis of ACC2 hydroxylation and phosphorylation in PHD3FL or PHD3FL:CMV-Cre mouse quadriceps under pre- or post-exercise conditions (n = 4). The individual exhaustion time (I), total distance for running (J) during treadmill running with PHD3FL and PHD3 muscle-specific knockout mice (PHD3FL:MCK-Cre). (K) Palmitate oxidation in mitochondrial homogenates isolated from control or PHD3FL:MCK-Cre mice quadriceps under fed or fasted condition using [14C]palmitate as a substrate and measuring 14CO2 capture on filter membrane as readout for FAO (n=4). (L) Model summary. PHD3 hydroxylates ACC2 to repress FAO. By contrast, AMPK phosphorylates ACC2 and induces FAO. Phosphorylated ACC2 is a poor PHD3 substrate. PHD3 loss of function increases exercise capacity.
Notably, the absence of PHD3 allowed mice to run 40% longer and >50% farther compared with PHD3FL littermates (Figure 6B–C). PHD3FL mice reached their maximal oxygen consumption rate (VO2max) sooner than PHD3FL:CMV-Cre animals (Fig 6F), and the VO2max was elevated in PHD3FL:CMV-Cre animals (Figure 6D–E). Thus, whole body PHD3 loss improves metabolic fitness and exercise capacity during a strenuous exercise endurance challenge.
To examine PHD3-dependent FAO changes induced by exercise, we measured the rate of [14C]palmitate oxidation from freshly isolated mitochondrial homogenates from quadriceps of PHD3FL and PHD3FL:CMV-Cre mice after endurance exercise. Parallel with hydroxylation changes, ex vivo FAO was increased in mitochondrial homogenates prepared from quadriceps of PHD3FL mice post-exercise compared to pre-exercise (Figure 6G). Furthermore, the quadriceps of PHD3FL:CMV-Cre mice displayed higher FAO compared to PHD3FL tissues (Figure 6H). Mechanistically, we tested whether ACC2 hydroxylation changed in exercised skeletal muscle. As expected, loss of PHD3 decreased ACC2 hydroxylation in quadriceps muscle (Figure 2E, Figure 6H). Strikingly, while ACC2 protein levels were unchanged, ACC2 hydroxylation was nearly undetectable in skeletal muscle isolated from mice immediately after endurance exercise. This hydroxylation was dependent upon PHD3, as PHD3-null mice demonstrated little to no ACC2 hydroxylation in either condition. As expected, the phosphorylation of ACC2 was increased by exercise, and was equally induced with similar kinetics in skeletal muscle from PHD3FL:CMV-Cre animals (Figure 6H). Interestingly, PHD3FL:CMV-Cre mouse quadriceps possessed elevated gene expression of VEGF, TFB1M, TFB2M, PGC1α, PDK4, and PPARα immediately after an endurance exercise challenge compared to PHD3FL animals (Figure S6E).
As the above exercise challenge was performed in animals lacking PHD3 in the whole body, we sought to test whether PHD3 loss in skeletal muscle was sufficient to increase exercise capacity. We generated MCK-Cre-driven PHD3-KO mice (PHD3FL:MCK-Cre) to delete PHD3 specifically in muscles. Indeed, PHD3 levels decreased in quadriceps of PHD3FL:MCK-Cre mice compared to PHD3FL (Figure S6F) muscle, but remained unchanged in the liver. When subjected to an endurance exercise challenge, PHD3FL:MCK-Cre mice remained on the treadmill for 23% longer and ran 32% farther compared with PHD3FL animals (Figure 6I and 6J). Consistent with our findings in cells and in tissues from PHD3 whole body null animals, ACC2 hydroxylation was nearly undetectable in PHD3FL:MCK-Cre quadriceps muscle, but readily detectable in control PHD3FL tissue (Figure S6G). Next, we measured FAO ex vivo in PHD3FL and PHD3FL:MCK-Cre quadriceps (Figure 6K). In both PHD3FL or PHD3FL:MCK-Cre quadriceps, FAO increased after a 16-hour fast compared to fed conditions. However, PHD3FL:MCK-Cre quadriceps displayed elevated FAO compared with PHD3FL tissue (Figure 6K). In sum, these results demonstrate that PHD3 loss in skeletal muscle alone is sufficient for increased exercise capacity.
DISCUSSION
Here, we elucidate a role for PHD3 in the control of FAO during energetic stress. AMPK and PHD3 modify ACC2 under opposing energy states. During energetic stress, AMPK phosphorylates ACC2, which interferes with the interaction between ACC2 and PHD3, consequently inhibiting ACC2 hydroxylation (Figure 6L). In contrast, changes in PHD3 activity do not affect AMPK-mediated phosphorylation of ACC2. During physiological energy challenges, such as fasting or exercise endurance, PHD3FL:CMV-Cre mice display enhanced fat oxidation and increased exercise capacity.
How do PTMs control ACC2 activity? First, oligomerization is a key regulator of ACC2 function: the monomeric form is inactive, while the dimerized and multi-oligomerized forms are active. Phosphorylation of S222 shifts ACC2 into the inactive monomeric form, demonstrating that ACC2 PTMs can affect the oligomerization state. Interestingly, recent studies have shown that oligomerization of ACC2 is mediated by the BC domain, which contains the P450 residue that is hydroxylated by PHD3 (Wei and Tong, 2014; German et al., 2016). S222 and P450 are not adjacent in the amino acid sequence; yet, when the human ACC2 biotin carboxylase domain (PDB: 3JRW) (Cho et al., 2010) was modeled and superimposed with the cryo-electron microscopy ACC structure from yeast (PDB: 5CSL) (Wei and Tong, 2015), the distance between these residues appeared to be? small (Figure 3A). Further biochemical studies are required to understand whether there is any significance to the potential proximity of S222 and P450. ACC2 phosphorylation by AMPK is increased during energy stress, such as fasting, exercise, or high-fat diet (Cho et al., 2010; O’Neill et al., 2014; Gwinn et al., 2008; Vasquez et al., 2008; Mihaylova and Shaw, 2011). Importantly, our studies do not rule out a scenario whereby AMPK signaling, as well as other energy sensitive pathways, alter PHD3 or ACC2 activity via indirect effects on metabolism. It will be interesting for future studies to determine the precise mechanism by which PHD3 influences ACC2 activity. Likewise, HIF signaling represses the expression of genes important in fatty acid catabolism (Liu et al., 2014; Du et al., 2017; Huang et al., 2014). Thus, multiple mechanisms may work in concert.
Our data demonstrate a new role for PHD3 in exercise, as whole body or skeletal muscle-specific PHD3 loss is sufficient to increase exercise endurance. We demonstrate that whole body PHD3 loss enables mice to maintain elevated VO2 during an exercise challenge and run >50% farther than littermate controls on an incline (Figure S6B and 6D–E). Both VO2 and VCO2 were similarly increased during exercise (Figure S6C), explaining the similar RER observed (Figure S6D). In addition, the difference between baseline and peak VO2 for each individual mouse (delta VO2) was also higher in PHD3FL:CMV-Cre mice compared with controls (Fig 6E). As muscle and liver glycogen levels were not elevated, increased glycogen stores do not provide a simple account for the increase in exercise capacity in PHD3FL:CMV-Cre animals (Figure 5K–L). Taken together, our studies show that PHD3 loss is beneficial for acute exercise performance and oxygen consumption during exercise in vivo.
Interestingly, our data show that ACC2 hydroxylation in heart tissue is profoundly responsive to nutrient status (Figure 2C). Therefore, the effects of whole body PHD3 loss in exercise performance might be related to cardiac function or involve other tissues. Importantly, increased exercise capacity was also observed in mice with skeletal muscle-specific deletion of PHD3, demonstrating that PHD3 loss in skeletal muscle is sufficient for the observed increased exercise phenotypes. It will be interesting for future studies to identify both direct and indirect mechanisms by which PHD3 controls exercise performance, including whether this involves other signaling mechanisms or control of HIF signaling. Along these lines, we observed changes in the expression of MyoD and some muscle fiber type markers. Thus, it will be of interest for future studies to assess how PHD3 affect skeletal muscle development.
In sum, this work reveals that PHD3 and AMPK oppositely regulate fat metabolism and exercise capacity. During energy stress, AMPK-mediated phosphorylation is sufficient to inhibit PHD3 interaction with and hydroxylation of ACC2. Upon energy replete conditions, AMPK is inactive, ACC is not phosphorylated, and PHD3 is able to hydroxylate ACC2 (Figure 6L). Collectively, these data suggest that PHD3 may provide a therapeutic target for treatment of a wide range of metabolic diseases, and that modulation of PHD3 may improve energy homeostasis and skeletal muscle performance during exercise challenge.
Limitations of Study
We revealed that ACC2 phosphorylation and hydroxylation occur in an inverse fashion, but did not quantify the stoichiometry of ACC2 post-translational modifications. Based on previous studies, the maximal stoichiometry of ACC2 phosphorylation by AMPK was measured to be 0.27 mol of 32 P per subunit of ACC2. When ACC2 is highly phosphorylated, its activity is decreased by more than 90% (Bultot et al., 2012). We have used an indirect readout for PHD3 activity in the form of succinate production. However, this endpoint does not accurately reflect hydroxylation stoichiometry as PHD enzymes may demonstrate uncoupled decarboxylation of alpha-ketoglutarate even in the absence of substrate. We have included a critical “no substrate” sample to control for uncoupled decarboxylation, as well as additional controls, such as a catalytically inactive PHD3 variant, a “no alpha-ketoglutarate” control, and two concentrations of PHD3 (Figure 3H). To assess the technical limitations of this assay regarding the accuracy of the succinate measurement by mass spectrometry, we also generated a succinate standard curve for every run. We also did not determine the actual enzyme kinetics for PHD3. Thus, it will be interesting for future studies to examine the stoichiometry of ACC2 phosphorylation and hydroxylation during dynamic changes in energy and to assess the kinetic parameters of PHD3 activity using ACC2 as a substrate. In sum, this work illustrates the inverse interplay between ACC2 hydroxylation and phosphorylation and elucidates a role for PHD3 in skeletal muscle energy metabolism during exercise challenge.
STAR METHODS
RESOURCE AVAILABILTY
Lead Contact
Further information and requests for resources and reagents should be directed to and will be fulfilled by the Lead Contact, Marcia Haigis (Marcia_Haigis@hms.harvard.edu).
Materials Availability
All unique reagents generated in this study are available from the Lead Contact without restriction.
Data and Code Availability
This study did not generate any unique datasets or code.
EXPERIMENTAL MODEL AND SUBJECT DETAILS
Cell Lines
HEK293T (human embryonic kidney, female), C2C12 (mouse mesenchymal precursor, sex of cell lines were unknown) and immortalized MEF (mouse embryonic fibroblast, sex of cell lines were unknown) cell-lines were obtained from American Type Culture Collection (ATCC). Cells were cultured at 37°C, 5% CO2 in 4.5 g/L (25 mM) glucose Dulbecco’s modified Eagle’s medium, supplemented with 10% fetal bovine serum and penicillin/streptomycin. C2C12 cell differentiation toward myoblasts was induced by 2% horse serum (Gibco) and Insulin-Transferrin-Selenium Liquid Media Supplement (Sigma) for two days. AMPK KO MEFs and WT controls were used with permission from Reuben J. Shaw (The Salk Institute for Biological Studies) (Gwinn et al., 2008).
Mice
AMPKFL;Ubc-CreER mice (129SvEv/C57BL/6 mixed) were from the laboratory of Reuben J. Shaw (The Salk Institute for Biological Studies). AMPKFL;Ubc-CreER mice were generated by crossing mice with floxed AMPKα1 and AMPKα2 alleles (provided by Benoit Viollet) to Ubc-CreER mice (Ruzankina et al., 2007). Mice were backcrossed into a FVB/n background. Experiments were started when mice were 8 weeks of age. Only male mice were used. To induce AMPK deletion, AMPKFL;Ubc-CreER mice were injected (intraperitoneal injection) with tamoxifen (Sigma) for 5 consecutive days (4 mg tamoxifen per day, suspended in 200 μl corn oil + 2% ethanol). Muscle tissue was collected 3 weeks after tamoxifen treatment and snap frozen in liquid nitrogen. For PHD3-CMV-Cre mice, Egln2tm2Fong Egln1tm2Fong Egln3tm2Fong/J mice (PHD1FL/PHD2FL/PHD3FLtriple floxed strain # 028097) (Takeda et al., 2006) were obtained from The Jackson Laboratory and housed in the New Research Building Animal Facility at Harvard Medical School. All protocols were approved by the IACUC of Harvard Medical School and were in accordance with NIH guidelines. Mice were housed at 20-22°C on a 12 h light/dark cycle with ad libitum access to food (LabDiet 5053) and water. PHD3FL mouse were obtained by breeding between Egln2tm2Fong Egln1tm2Fong Egln3tm2Fong/J mice and C57BL/6J. PHD3FL mouse were crossed with B6.C-Tg(CMV-cre)1Cgn/J mice (CMV-Cre mice # 006054) to generate PHD3FL:CMV-Cre knockout mice. Only male mice were used for experiment. To generate PHD3FL:MCK-Cre knockout mice, PHD3FL mouse were crossed with B6.FVB(129S4)-Tg(Ckmm-cre)5Khn/J mice (MCK-Cre mice #006475). Only male mice were used for experiment. Genotyping was performed by PCR using genomic DNA obtained from the tails. All animal studies were performed in accordance with protocols approved by the Institutional Animal Care and Use Committee, the Standing Committee on Animals at Harvard Medical School.
EXPERIMENTAL METHOD DETAILS
Preparation of plasmids, siRNAs and transfection
pcDNA3.1-HA-PHD3 or HA-pBabe PHD3 were previously described (Lee et al., 2005). ACC2 cDNA in pENTR223 vector was obtained from the Dana Farber/ Harvard Cancer Center Resource Core. ACC2 cDNA was cloned into pHAGE-CMV-Flag-HA-puromycin vector (obtained from Wade Harper, Harvard Medical School) using Gateway LR Clonase II Enzyme Mix according to manufacturer’s instructions. For cloning, 10 μl reactions containing 150 ng ACC2 pENTR223, 150 ng pDEST vector and 2 μl Clonase in TE buffer (pH 8.0) were incubated at 25°C for 2 hours. Site-specific mutations of ACC2 and stop codon deletion constructs were generated using PCR-based mutagenesis (QuikChange II XL Site-Directed Mutagenesis Kit, Agilent). The plasmids for C-terminus GST-tagged or Flag-tagged ACC2 fragments were re-cloned from the human ACC2 plasmid using PCR and Gibson assembly. For transient transfection with plasmids, cells at ~40% density were transfected with plasmids using Fugene HD (Roche). The transfected cells were cultured for 48 hours, and then selected with puromycin (Invivogen). Synthetic oligos for shRNAs (sequences in Table S1) were digested with Age I and EcoRI (NEB), and inserted into a pLKO-puromycin vector using T4 DNA ligase (NEB). This shRNA construct was co-transfected into HEK293T cells with pRSV-Rev, pMD2-VSVG, and pMDLg/pRRE plasmids to prepare lentiviral particles. On the 3rd day after transfection, lentiviruses were collected from the supernatant of HEK293T cells. Target cells were infected with virus for 24 hours and selected using puromycin (2 ug/ml) for 48 hours to establish stable cell lines.
Quantitative RT-PCR analysis
RNA was isolated by extraction with Trizol according to manufacturer instructions (Invitrogen) or with the RNA Clean & Concentrator Kit (Zymo Research). cDNA was synthesized using iScript cDNA synthesis kit (BioRad). Quantitative real-time PCR was performed with SYBR Green Fast Mix (Quanta Biosciences) on a Roche Lightcycler 480 and analyzed by using ΔΔCt calculations. qPCR analyses in human cell lines are relative to the reference gene B2M. qPCR analyses in mouse cell line or tissue are relative to β-Actin. The primer sequences are described in Table S1.
Immunoprecipitation, western blotting and antibodies
Western blotting was performed using antibodies against ACC (Cell Signaling Technologies (CST), ACC2 isoform (CST), actin (Sigma), AMPKα (CST), HA (CST), Flag (Sigma), hydroxyproline (Abcam), phospho-ACC (CST), phospho-AMPKα (CST), PHD3 (Novus Biologicals) and tubulin (Sigma). 1% NP40 buffer containing protease and phosphatase inhibitors was used to prepare lysates, unless otherwise indicated. For ACC hydroxylation time course studies, the pan-PHD inhibitor dimethyloxalylglycine (DMOG, Frontier Scientific, 1 mM) was added to the lysis buffer to prevent further hydroxylation in the lysate. For immunoprecipitation of endogenous ACC2, cells were lysed with buffer containing 50 mM Tris-HCl (pH 7.8), 150 mM NaCl, 1 % NP40, 0.1 mM DTT, 0.05 mM DMOG, protease inhibitors (Roche) and 100 ul of phosphatase inhibitor 2/3 (Sigma). Cell lysates were centrifuged for 15 minutes to remove debris. Then, 2 ug of ACC antibody (CST) or ACC2 antibody (CST), was added to the cleared cell lysate (500 ng of protein) and immunoprecipitated with EZview Red Protein G Affinity resin (Sigma). Transiently overexpressed HA- or Flag-tagged proteins, lysates were immunoprecipitated using EZview anti-HA Affinity resin (Sigma) or anti-Flag Affinity resin (Sigma).
In vitro protein binding assay
Recombinant ACC2-BC, ACC2-BCCP and ACC2-CT-GST domains were expressed in E. coli, purified by GSH-affinity beads, and eluted by GSH. Recombinant PHD3-HA-His protein was purified from E. coli using a nickel NTA affinity resin. For binding assays, 500 ng of ACC2 and 100 ng of PHD3 were mixed and incubated in binding buffer, containing 25 mM HEPES, 150 mM KCl, 12.5 mM MgCl2, 20 mM ZnCl2, 0.5 mM DTT, 0.1% NP40 and 10% glycerol (pH7.5) at 4°C for 1 hour, further incubated with the affinity beads at 4°C for 4 hours, spun down, and immunoblotted to test for physical association.
Molecular modeling
Using PyMol software, the biotin-carboxylase domain of human ACC2 (PDB:3JRW) (Cho et al., 2010) was superposed with the yeast cryo-electron microscopy structure of entire ACC (PDB: 5CSL) (Wei and Tong, 2015). The mapping of phosphorylation site serine 222 and hydroxylation site proline 450 site were estimated and designed by sequence homology with yeast ACC and the biotin-carboxylase domain of human ACC2 (PDB: 5CSL).
Fatty acid oxidation measurements
For FAO assays, MEF or C2C12 cells (plated in 12 well-plates) were pre-incubated for 4 hours in serum-free medium, containing 5 mM glucose and supplemented with 100 μM palmitate or hexanoate and 1 mM carnitine. Cells were switched to 600 μl medium containing 1 μCi [9,10-3H(N)]-palmitic acid (Perkin Elmer) and 1 mM carnitine for 2 hours. Medium was collected and released 3H2O was eluted in columns packed with DOWEX 1X2-400 ion exchange resin (Sigma). FAO assays in complete medium were performed in medium with serum and high (25 mM) or low (5 mM) glucose. Basal FAO assays were performed in cells not pre-incubated with fatty acids prior to FAO analysis. Counts per minute (CPM) were normalized to protein content in parallel cell plates.
For ex vivo FAO assays, we used radiolabeled palmitate with crude mitochondrial extraction from tissue, as previously described (Hirschey et al., 2010; Huynh et al., 2014). Eppendorf tubes and all buffers were degassed using nitrogen gas. 7% BSA/5 mM palmitate (5:1 molar ratio) or 7% BSA/5 mM palmitate/0.01 mCi/mL [14C]palmitate was prepared with water using a 42°C water bath. 0.4 mCi of [14C]palmitate was used per reaction for animal tissues (200 mg). Fresh tissues were homogenized in sucrose–Tris–EDTA (STE) buffer (0.25 M sucrose, 10 mM Tris–HCl and 1 mM EDTA) using a 2 mL Dounce homogenizer. Samples were centrifuged at 420 xg to isolate crude mitochondria and normalized by protein concentration ~100 mg of mitochondria were mixed with 100 mM sucrose, 10 mM Tris–HCl (pH 7.4), 5 mM KH2PO4, 0.2 mM EDTA, 80 mM KCl, 1 mM MgCl2, 2 mM L-carnitine, 0.1 mM malate, 0.05 mM coenzyme A, 2 mM ATP, 1 mM DTT and 0.7% BSA/500 mM palmitate/0.4 mCi [14C]palmitate (pH 8.0), and incubated 37°C for 30 minutes. Then, reactions were transferred into tubes containing 200 uL of 1 M perchloric acid to quench reactions and discs of Whatman filter paper (pre-treated with 20 uL of 1 M NaOH) placed in the caps to capture 14CO2.,After 1 hour incubation to allow 14CO2 capture, the paper disc or the remaining acid solution were transferred to a scintillation vial. Vials were mixed with scintillation fluid, and the average counts per minute over three minutes were measured with a standard scintillation counter. Data were normalized to protein content.
MT-DNA quantification
Mitochondrial DNA was extracted from cells and analyzed by real time quantitative PCR, as described (Errichiello et al., 2015; O’Neill et al., 2011). Briefly, 50,000 cells were pelleted and resuspended in 50 uL of MT-DNA lysis buffer (25 mM NaOH, 0.2 mM EDTA). Lysates were heated to 95°C for 15 minutes and neutralized with 50 μL MT-DNA neutralization buffer (40 mM Tris-HCl). RT-qPCR reactions were performed on 5 uL of 1:50 diluted lysate. MT-DNA quantification was performed with mitochondrial markers MT-CO2 and D-loop. MT-DNA was normalized to nuclear DNA markers β-actin and β-globin.
Mitochondrial mass quantification
50,000 cells were adapted to their respective conditions for 24 hours prior to the experiment. Cultured 293T cells or MEFs were incubated with 75 nM Mitotracker Green (Invitrogen) for at 37°C for 1 hour, washed twice with PBS, analyzed on an LSR II Flow Cytometer (BD Biosciences), gated for single cells, and assessed for fluorescence intensity.
Respiration
Respiration was assessed using the Seahorse XFe-96 Analyzer (Seahorse Bioscience). For experiments that measure the basal levels of oxygen consumption rate, 1x10⁵ of shCon or shPHD3 MEF cells were incubated with 25 mM glucose or 5 mM glucose media for 8 hours prior to the experiment. Following this incubation, media was changed to a non-buffered, serum-free Seahorse Media (Seahorse Bioscience) supplemented with 10 mM glucose, 2 mM L-glutamine and 1 mM sodium pyruvate. For basal OCR using fat, cells were incubated in serum free media overnight and incubated in serum-free Seahorse Media (Seahorse Bioscience) supplemented with 0.5 mM glucose, 1 mM L-glutamine, 0.5 mM carnitine and XF BSA-palmitate. Values were normalized to cell number.
Metabolite profiling and mass spectrometry
Metabolites were extracted from rapidly harvested cells (2.5x10⁵) or flash frozen tissues (~5 mg/ml) in 80% MeOH and analyzed on two distinct methods of hydrophilic interaction liquid chromatography coupled to mass spectrometry (HILIC-MS). In one method, electrospray ionization was tailored to negative-ion mode, and in the second method to positive-ion mode. For negative-ion mode, analytes were eluted in buffer A (20 mM ammonium acetate, 20 mM ammonium hydroxide) and buffer B (10 mM ammonium hydroxide in 75:25 acetonitrile:methanol). Samples were run on a HILIC silica (3 um, 2.1 x 150 mm) column (Waters) with a binary flow rate of 0.4 mL/min for 10 minutes on linear gradient (95% buffer B to 0% buffer B) followed by 2 minutes with (0% buffer B) and ending with a 2 minute linear gradient (0% buffer B to 95% buffer B) and holding (95% buffer B) for 13 minutes. For positive-ion mode, samples were dried down and reconstituted in a 20:70:10: acetonitrile:MeOH:water mixture. The buffers were: buffer A (10 mM ammonium formate, 0.1% formic acid in water) and buffer B (acetonitrile, 0.1% formic acid). Samples were run on a HILIC silica (3 um, 2.1 x 150mm) column (waters) with a binary flow rate of 0.25 mL/min for 10 minutes on linear gradient (95% buffer B to 40% buffer B) followed by 4.5 minutes with (40% buffer B) and ending with a 2 minute linear gradient (40% buffer B to 95% buffer B) and holding (95% buffer B) for 13 minutes. For both ion-modes, a Q Exactive hybrid quadrupole orbitrap mass spectrometer (Thermo Fisher Scientific) with a full-scan analysis over 70–800 m/z and high resolution (70,000) was used for mass detection. A targeted-method developed for 176 compounds (118 on positive and 58 on negative) was used to identify metabolites. A master mix of reference standards for metabolites in the targeted method were run immediately prior to each set of samples, such that their retention times were associated with peaks in the unknown samples run over that same column. Peaks were integrated in Tracefinder 3.3. Metabolite levels were normalized to cell number in parallel plates or protein concentration in the same amount of tissue powder samples.
GeLC-MS/MS
To quantify changes in proline hydroxylation by mass spectrometry, ACC2 was transiently overexpressed in shCon or shPHD3 293T cells under high or low glucose media and immunoprecipitated with ACC2 antibody (CST). Bound material was washed and separated by SDS-PAGE. The Coomassie stained band corresponding to ACC2 was analyzed by GeLC-MS/MS (Paulo, 2016). Eluted peptides were derivatized using TMT labeling (Navarrete-Perea et al., 2018) and analyzed using the MS3-IDQ method (Berberich et al., 2018). MS3 spectra were searched against the Uniprot Human database using Sequest with proline hydroxylation set as a variable modification (+15.9949 mass shift).
MALDI MSI
Mouse quadriceps were isolated from 8 week-old mice under either fed or fasting conditions (16 hours) and snap-frozen in liquid nitrogen. Tissue samples were stored at −80°C prior to use. Muscle tissue was cryo-sectioned at a thickness of 12 μm at −20°C, and tissue sections were thaw-mounted onto ITO-coated glass slides for MALDI MSI. Adjacent to the tissue on the slide were placed 0.5 μL dried droplets of standards of: myristoyl-L-carnitine, palmitoyl-L-carnitine and stearoyl-L-carnitine (10 μM, in water, Sigma). The slides were then coated with matrix (DHB, 160 mg/mL in 70/30 methanol/0.1% trifluoroacetic acid) using a TM-Sprayer (HTX imaging). Matrix was sprayed with a flow rate of 0.09 mL/min, a velocity of 1200 mm/min, track spacing of 2 mm, a nebulizer gas temperature of 75°C, a gas pressure of 10 psi and 2 passes of matrix. MALDI MSI data were acquired using a 9.4 Tesla SolariX XR FT-ICR MS (Bruker Daltonics) externally calibrated in electrospray ionization positive ion mode using a tuning mix solution (Agilent Technologies). MALDI MS images were acquired from both tissue and acylcarnitine standard spots, with a pixel step size of 75 μm. Spectra were acquired in positive ion mode with 250 laser shots accumulated at each location. Spectra were collected in the range m/z 50-3000 with isolation of ions using the constant accumulation of selected ions (CASI) mode, with Q1 set to 500 and an isolation window of 260. Online calibration of spectra to heme (m/z 616.17668, Δppm tolerance 200, intensity threshold 500) was applied. Also, myristoyl-carnitine (m/z 372.310835, Δppm = 0.2), palmitoyl-carnitine (m/z 400.342135, Δppm = 1.16), and stearoyl-carnitine (m/z 428.373436, Δppm = 1.34) were measured. The laser focus was set to ‘small’, the laser energy was set to 35% (arbitrary scale) with a laser frequency of 1000 Hz. MALDI MS images were displayed and analyzed using FlexImaging 5.0 and SCILS Lab (2018) (both Bruker Daltonics) software. MSI data are displayed with normalization to total ion count (TIC).
Exercise performance studies
20 week-old mice were acclimated to the treadmill 2 days prior to the experiments by running for 5 min/day at 5 m/min and 10 m/min followed by 15 m/min for 1 min. For exercise experiments, speed was increased 5 m/min every 5 min until reaching 20 m/min, and then incline was increased 5 incline every 5 minutes until exhaustion. Respiratory exchange ratio (RER), VO2, VCO2 and heat were monitored using the Oxymax Modular Treadmill System.
Histological procedures
Mouse quadriceps were isolated from 8 week-old mice between 9 and 11 am following ad libitum feeding (fed) or an overnight, 16 hour fast. Quadriceps were fixed in 10% buffered formalin, dehydrated through a series of ethanol solutions of increasing concentration and submitted to the Dana-Farber/Harvard Cancer Center Pathology Cores for embedding in paraffin, sectioning, and hematoxylin and eosin staining. Immunohistostaining was performed using anti-PHD3 antibody (Novus Biologicals). The fresh frozen quadriceps were sectioned and stained with H&E. Immunofluorescence was performed on the same samples using anti-myosin heavy chain 2 (Developmental Studies Hybridoma Bank), ACC2 (Cell Signaling Technology) and DAPI. In brief, paraffin quadriceps sections were rinsed with xylene (three times for 5 minutes each). Slides were incubated twice in 100% ethanol (10 min each) for rehydration. After rinsing with water, slides were boiled (10 minutes) with 10 mM sodium citrate buffer (pH 6.0) for antigen unmasking. The sections were washed with PBS with 0.4% Triton X-100 and blocked for 1 hour at 4°C, with PBS containing 5% normal goat serum. Slides were incubated with primary antibodies in PBS overnight at 4°C. After 3 washes with PBS, 5 min at room temperature, slides were incubated for 2 hours with goat anti-mouse IgG conjugated to the fluorescent Alexa 488 dye (1:400) and goat anti-rabbit IgG conjugated to the fluorescent Alexa 594 dye (1:400) in PBS. After 3 washes, nuclei were visualized with 1 mg/ml DAPI. Following 3 washes in PBS and 1 wash with 75% ethanol, the sections were mounted in ProLong Gold Antifade reagent (Life Technologies). Digital images of stained sections were taken using confocal microscope (Nikon TE2000 w/C1 Point Scanning Confocal).
ACC2 activity assay
Reactions were performed with 50 ug of immunoprecipitated ACC2 from 293T cell protein lysates as previously described (Goodwin and Taegtmeyer, 1999). Proteins were incubated in 83.3 mM HEPES, 1.67 mM DTT, 0.42 mM acetyl CoA, 4.17 mM ATP, 1.04 mM NaHCO3, 8.33 mM BSA, 2 mM NaCitrate, 16.67 mM MgCl2 and 6 uCi [14C]bicarbonate (ARC) at 37°C for 20 minutes. Following addition of 1 N HCl to quench reactions and convert remaining [14C]bicarbonate (ARC) to CO2, reactions were evaporated 2 h at 60°C in a thermo shaker. Activity was calculated as incorporation of [14C]bicarbonate into [14C]malonyl CoA (the acid and heat stable product) as measured by scintillation counting. Background CPMs were determined from samples lacking citrate and pre-treated with 1 N HCl to convert all [14C]bicarbonate to CO2.
Expression of recombinant PHD3 and PHD3 activity assay
HA-tagged full-length PHD3 was cloned into a maltose-binding protein construct (pMAL-c4x) and expressed as MBP-HA-PHD3 in Rosetta (DE3) pLysS E. coli cells. Cells were grown to OD600 of 0.6 at 37°C in Luria-Bertani (LB) broth, and then placed into an ice water bath for 30 minutes. Thereafter, 0.3 mM of IPTG and 1 mM a-ketoglutarate were added to the culture and grown at 16°C for 16 hours. Amylose resin (New England Biolabs) purification was carried out according to the manufacturer’s instructions, with the addition of the following steps: French press lysis was performed to lyse the cells instead of sonication, lysis supernatant was filtered through a 0.45 uM filter and incubated with the amylose resin in a Falcon tube (on a rotator) for 1 hour prior to loading onto the gravity flow column. Protein concentration was determined by UV absorbance at 280 nm (extinction coefficient = 110700 M-1 cm-1).
In vitro hydroxylation assay
PHD3 activity towards the various ACC2 N-terminus (NT)-Flag constructs was measured by succinate production using a triple quadrupole mass spectrometer (Agilent). The reaction was carried out in a final volume of 0.5 ml. The reaction mix consists of 50 mM Tris-HCl (pH 7.8), 2 mg/ml BSA, 0.2 mg/ml catalase, 1 mM DTT, 2 mM ascorbate, 50 uM FeSO4, 500 uM a-ketoglutarate, and 4 uM of the respective ACC2 NT protein. Thereafter, 10 uM of MBP-HA-PHD3 was added to start the reaction. The reaction was allowed to proceed at 37°C for 30 minutes. During the course of the reaction, 50 ul was withdrawn from the reaction tube and quenched in 200 ul of 100% methanol at pre-determined time points and vortexed. The supernatants of the quenched reactions were evaporated and resuspended in the necessary buffer for loading onto the triple quadrupole mass spectrometer.
Glycogen and ATP assays
Glycogen and ATP were measured using a glycogen assay kit (Cayman Chemical, #700480), or ATP colorimetric/fluorometric assay kit (Biovision, #K354-100), respectively. In brief, 10-20 mg of flash frozen tissue were homogenized and processed according to manufacturer’s instructions. All assays were normalized by protein content. Both glycogen and ATP concentrations were calculated using a standard curve.
Bioinformatic analysis
Human muscle expression datasets were obtained from GEO under the respective accession identifiers and from GTEx (PMID: 23715323). Confounding factors, including gender, age, batch, and disease, as well as hidden factors that could cause gene expression variability, were estimated and removed using probabilistic estimation of expression residuals (PEER) (PMID: 22343431). Expression residuals obtained from PEER were used for further analysis. To identify the enriched gene sets correlated with PHD3 expression, we performed gene set enrichment analysis (GSEA) (PMID: 16199517) using the fgsea package (https://www.biorxiv.org/content/early/2016/06/20/060012). Specifically, genes were ranked based on the Pearson correlation coefficient against PHD3 expression, and enrichment analysis was performed to determine the enriched gene sets co-expressed with PHD3.
Quantification and statistical analysis
Details regarding the specific statistical tests, definition of center, and number of replicates (n), can be found for each experiment in the figure legends. All experiments were performed at least twice. Data from animal studies are shown as mean ± SEM, while data from in vitro studies are shown as mean ± SD. When comparing two groups, statistical analysis was performed using a two-tailed Student’s t test and statistical significances were considered when P values were less than 0.05. P values were calculated assuming a normal distribution and were corrected for multiple hypothesis using the Benjamini-Hochberg procedure. GraphPad, Prism, and Excel were used for all quantifications and statistical analyses.
Supplementary Material
KEY RESOURCES TABLE
| REAGENT or RESOURCE | SOURCE | IDENTIFIER |
|---|---|---|
| Antibodies | ||
| Anti-ACC | Cell Signaling Technologies | Cat# 3676S |
| Anti-ACC2 | Cell Signaling Technologies | Cat# 8578S |
| Anti-phospho-ACC | Cell Signaling Technologies | Cat# 3661S |
| Anti-AMPKα | Cell Signaling Technologies | Cat# 2532S |
| Anti-AMPKα (Thr172) | Cell Signaling Technologies | Cat# 2535S |
| Anti-PHD3 | Novus Biologicals | Cat# NB100-139 |
| Anti-PHD3 | Santa Cruz Biotechnology | Cat# sc-46030 |
| Anti-hydroxyproline | Abcam | Cat# ab37067 |
| Anti-HA | Cell Signaling Technologies | Cat# 3724S |
| Anti-HA | Cell Signaling Technologies | Cat# 2367S |
| Anti-Flag | Sigma-Aldrich | Cat# F2555 |
| Anti-GST | Santa Cruz Biotechnology | Cat# sc-138 |
| Anti-His | MLB | Cat# PM032 |
| Anti-Actin | Sigma-Aldrich | Cat# A2066 |
| Anti-α-Tubulin | Santa Cruz Biotechnology | Cat# sc-8035 |
| Anti-MYH2 | Developmental Studies Hybridoma Bank | Cat# 2F7 |
| EZview™ Red Protein G Affinity Gel | Sigma-Aldrich | Cat# E3403 |
| EZview™ ANTI-FLAG® M2 Affinity Gel | Sigma-Aldrich | Cat# F2426 |
| Glutathione Sepharose 4B | GE Healthcare Life Sciences | Cat# 17075601 |
| Pierce™ HisPur™ Ni-NTA Resin | Thermo Scientific | Cat# 88221 |
| Goat anti-Rabbit IgG (H+L) Cross-Adsorbed Secondary Antibody, Alexa Fluor 488 | Invitrogen | Cat# A-11008 |
| Rabbit anti-Goat IgG (H+L) Cross-Adsorbed Secondary Antibody, Alexa Fluor 488 | Invitrogen | Cat# A-11078 |
| Goat anti-Mouse IgG (H+L) Cross-Adsorbed Secondary Antibody, Alexa Fluor 488 | Invitrogen | Cat# A-11029 |
| Goat anti-Rabbit IgG (H+L) Cross-Adsorbed Secondary Antibody, Alexa Fluor 594 | Invitrogen | Cat# A-11012 |
| Biological Samples | ||
| Skeletal muscle (frozen) taken from experimental mouse strains listed in the Experimental Model section | See Experimental Models | N/A |
| Hearts (frozen) taken from experimental mouse strains listed in the Experimental Model section | See Experimental Models | N/A |
| Livers (frozen) taken from experimental mouse strains listed in the Experimental Model section | See Experimental Models | N/A |
| Chemicals, Peptides, and Recombinant Proteins | ||
| Mitotracker Green | Invitrogen | Cat# M22425 |
| DAPI (4′,6-Diamidino-2-Phenylindole, Dihydrochloride) | Sigma-Aldrich | Cat# D9542 |
| Dimethyl sulfoxide | Sigma-Aldrich | Cat# D2650 |
| Dimethyloxaloylglycine | Santa Cruz Biotechnology | Cat# sc-200755 |
| AICAR | Cell Signaling Technologies | Cat# 9944S |
| MG132 | R&D Systems INC | Cat# 1748/5 |
| LY294002 | Cell Signaling Technologies | Cat# 9901S |
| L-Carnitine | Sigma-Aldrich | Cat# C0158 |
| Palmitic acid | Sigma-Aldrich | Cat# P0500 |
| 1 μCi [9,10-3H(N)]-palmitic acid | Perkin Elmer | Cat# NET043001MC |
| Palmitate-BSA FAO Substrate | Agilent Technologies | Cat# 102720-100 |
| Hydrogen peroxide solution 30% | Sigma-Aldrich | Cat# H1009 |
| Western Lightning ECL Pro | Perkin Elmer | Cat# NEL120001EA |
| ECL Plus Western Blotting Substrate | Thermo Scientific | Cat# 32132 |
| Commercial Assays | ||
| Liquid DAB+ Substrate Chromogen System | DAKO | Cat# K346811-2 |
| VECTASTAIN Elite ABC Kit | Vector Laboratories | Cat# PK-6100 |
| Experimental Models: Cell Lines | ||
| HEK293T | ATCC | Cat# CRL-11268 |
| Immortalized MEF | ATCC | Cat# CRL-2907 |
| C2C12 | ATCC | Cat# CRL-1772 |
| AMPKα KO and WT MEFs | From the laboratory of Dr. Reuben Shaw | N/A |
| Experimental Models: Organisms/Strains | ||
| Mouse: AMPKFL;Ubc-CreER | From the laboratory of Dr. Reuben Shaw | N/A |
| Mouse: PHD3FL:MCK-Cre, PHD3FL:CMV-Cre and PHD3FL | This paper | N/A |
| Mouse: C57BL/6 | Jackson Laboratory | Cat# 000664 |
| Oligonucleotides | ||
| qPCR primers: see table S1 | This paper | N/A |
| MT-DNA copy number primers: see table S1 | This paper | N/A |
| shRNA- hairpin primers: see table S1 | This paper | N/A |
| Primers for cloning: see table S1 | This paper | N/A |
| Recombinant DNA | ||
| Plasmid: pcDNA3.1-HA-PHD3 | From the laboratory of Dr. William G.Kaelin Jr. lab | N/A |
| Plasmid: HA-pBabe PHD3 | From the laboratory of Dr. William G.Kaelin Jr. lab | N/A |
| Plasmid: pcDNA3.1-ACC2 WT-Flag, pcDNA3.1-ACC2 P450A-Flag, pcDNA3.1-ACC2 S222A-Flag, pcDNA3.1-ACC2 P450A/S222A-Flag, pcDNA3.1-ACC2 S222E-Flag, pcDNA3.1-ACC2 NT-Flag | This paper | N/A |
| Plasmid: pcDNA3.1-PHD3-HA | This paper | N/A |
| Plasmid: pHAGE-CMV-Flag-HA-puromycin | From the laboratory of Dr. William G.Kaelin Jr. lab | N/A |
| Plasmid: pHAGE-CMV-ACC2 WT-Flag-HA, pHAGE-CMV-ACC2 P450A-Flag-HA, pHAGE-CMV-ACC2 S222A-Flag-HA, pHAGE-CMV-ACC2 P450A/S222A-Flag-HA | This paper | N/A |
| Plasmid: pET28-PHD3-His-SUMO | This paper | N/A |
| Plasmid: pGEX-6P-1-ACC2 BC, pGEX-6P-1-ACC2 BCCP, pGEX-6P-1-ACC2 CT | This paper | N/A |
| Plasmid: pLKO.1-puro, pLKO.1-shPHD3 #1, pLKO.1-shPHD3 #2 | This paper | N/A |
| Plasmid: pLKO.1-puro, pLKO.1-shACC2 #1, pLKO.1-shACC2 #2 | This paper | N/A |
| Software and Algorithms | ||
| ImageJ | NIH | N/A |
| GraphPad Prism 7.0 | GraphPad Software | https://www.graphpad.com/ |
ACKNOWLEDGEMENTS
We thank all members of the Haigis lab for thoughtful discussion on this manuscript. We would like to thank Giulia Notarangelo, Jefte M. Drijvers, and Jiska van der Reest for careful editing of the manuscript. H.Y. is funded by the American Diabetes Association Fellowship (1-17-PDF-109) and M.C.H is funded by NIH grant R01CA213062, the Ludwig Center at Harvard Medical School, and the Glenn Foundation for Medical Research. J.A. is funded by the Ecole Polytechnique Fédérale de Lausanne and the Fondation Suisse de Recherche sur les Maladies Musculaires. A.C., A.D., L.J.G is funded by the Joslin Core grant (NIH P30DK036836). E.C.R. is in receipt of an NIH R25 (R25 CA-89017) Fellowship in partnership with the Ferenc Jolesz National Center for Image Guided Therapy at BWH (P41 EB015898). Microscopy experiments were performed at the Nikon Imaging Center at Harvard Medical School. Mouse exercise experiments were performed at Joslin Diabetes Center. pHAGE-CMV-Flag-HA-puromycin vector was obtained from Wade Harper’s lab at Harvard Medical School. cDNA and entry vectors were obtained from the Dana Farber/ Harvard Cancer Center Resource Core.
Footnotes
SUPPLEMENT INFORMATION
Supplement Information includes seven figures and one table.
DECLARATION OF INTERESTS
JA is a scientific advisory board member of Mitobridge/Astellas, Metro Biotech, and TES Pharma. The other authors do not declare a potential conflict of interest.
REFERENCES
- Abu-Elheiga L, Oh W, Kordari P, and Wakil SJ (2003). Acetyl-CoA carboxylase 2 mutant mice are protected against obesity and diabetes induced by high-fat/high-carbohydrate diets. Proc. Natl. Acad. Sci. USA. 100, 10207–10212. [DOI] [PMC free article] [PubMed] [Google Scholar]
- Bakay M, Wang Z, Melcon G, Schiltz L, Xuan J, Zhao P, Sartorelli V, Seo J, Pegoraro E, Angelini C, et al. (2006). Nuclear envelope dystrophies show a transcriptional fingerprint suggesting disruption of Rb-MyoD pathways in muscle regeneration. Brain. 129, 996–1013. [DOI] [PubMed] [Google Scholar]
- Berberich MJ, Paulo JA, and Everley RA (2018). MS3-IDQ: Utilizing MS3 Spectra beyond Quantification Yields Increased Coverage of the Phosphoproteome in Isobaric Tag Experiments. J. Proteome Res. 17, 1741–1747. [DOI] [PMC free article] [PubMed] [Google Scholar]
- Bloemberg D, and Quadrilatero J (2012). Rapid determination of myosin heavy chain expression in rat, mouse, and human skeletal muscle using multicolor immunofluorescence analysis. PLoS One. 7, e35273. [DOI] [PMC free article] [PubMed] [Google Scholar]
- Bujak AL, Crane JD, Lally JS, Ford RJ, Kang SJ, Rebalka IA, Green AE, Kemp BE, Hawke TJ, Schertzer JD, et al. (2015). AMPK activation of muscle autophagy prevents fasting-induced hypoglycemia and myopathy during aging. Cell Metab. 21, 883–890. [DOI] [PMC free article] [PubMed] [Google Scholar]
- Bultot L, Guigas B, Von, Wilamowitz-Moellendorff A, Maisin L, Vertommen D, Hussain N, Beullens M, Guinovart JJ, Foretz M, Viollet B, et al. (2012). AMP-activated protein kinase phosphorylates and inactivates liver glycogen synthase. Biochem J. 443, 193–203. [DOI] [PubMed] [Google Scholar]
- Carling D, Clarke PR, Zammit VA, and Hardie DG (1989). Purification and characterization of the AMP-activated protein kinase. Copurification of acetyl-CoA carboxylase kinase and 3-hydroxy-3-methylglutaryl-CoA reductase kinase activities. Eur. J. Biochem. 186, 129–136. [DOI] [PubMed] [Google Scholar]
- Chen Y, Zhang HS, Fong GH, Xi QL, Wu GH, Bai CG, Ling ZQ, Fan L, Xu YM, Qin YQ, et al. (2015). PHD3 Stabilizes the Tight Junction Protein Occludin and Protects Intestinal Epithelial Barrier Function. J. Biol. Chem. 290, 20580–20589. [DOI] [PMC free article] [PubMed] [Google Scholar]
- Cho YS, Lee JI, Shin D, Kim HT, Jung HY, Lee TG, Kang LW, Ahn YJ, Cho HS, and Heo YS (2010). Molecular mechanism for the regulation of human ACC2 through phosphorylation by AMPK. Biochem. Biophys. Res. Commun. 391, 187–192. [DOI] [PubMed] [Google Scholar]
- Choi CS, Savage DB, Abu-Elheiga L, Liu ZX, Kim S, Kulkarni A, Distefano A, Hwang YJ, Reznick RM, Codella R, et al. (2007). Continuous fat oxidation in acetyl-CoA carboxylase 2 knockout mice increases total energy expenditure, reduces fat mass, and improves insulin sensitivity. Proc. Natl. Acad. Sci. USA. 104, 16480–16485. [DOI] [PMC free article] [PubMed] [Google Scholar]
- Chouchani ET, Kazak L, Jedrychowski MP, Lu GZ, Erickson BK, Szpyt J, Pierce KA, Laznik-Bogoslavski D, Vetrivelan R, Clish CB, et al. (2016). Mitochondrial ROS regulate thermogenic energy expenditure and sulfenylation of UCP1. Nature. 532, 112–116. [DOI] [PMC free article] [PubMed] [Google Scholar]
- Dadgar S, Wang Z, Johnston H, Kesari A, Nagaraju K, Chen YW, Hill DA, Partridge TA, Giri M, Freishtat RJ, et al. (2014). Asynchronous remodeling is a driver of failed regeneration in Duchenne muscular dystrophy. J. Cell Biol. 207, 139–158. [DOI] [PMC free article] [PubMed] [Google Scholar]
- De Leiris J, Opie LH, and Lubbe WF (1975). Effects of free fatty acid and enzyme release in experimental glucose on myocardial infarction. Nature. 253, 746–747. [DOI] [PubMed] [Google Scholar]
- Du W, Zhang L, Brett-Morris A, Aguila B, Kerner J, Hoppel CL, Puchowicz M, Serra D, Herrero L, Rini BI, et al. (2017). HIF drives lipid deposition and cancer in ccRCC via repression of fatty acid metabolism. Nat. Commun. 8, 1769. [DOI] [PMC free article] [PubMed] [Google Scholar]
- Efeyan A, Comb WC, and Sabatini DM (2015). Nutrient-sensing mechanisms and pathways. Nature. 517, 302–310. [DOI] [PMC free article] [PubMed] [Google Scholar]
- Epstein AC, Gleadle JM, McNeill LA, Hewitson KS, O’Rourke J, Mole DR, Mukherji M, Metzen E, Wilson MI, Dhanda A, et al. (2001). C. elegans EGL-9 and mammalian homologs define a family of dioxygenases that regulate HIF by prolyl hydroxylation. Cell. 107, 43–54. [DOI] [PubMed] [Google Scholar]
- Errichiello E, Balsamo A, Cerni M, and Venesio T (2015). Mitochondrial variants in MT-CO2 and D-loop instability are involved in MUTYH-associated polyposis. J. Mol. Med. (Berl) 93, 1271–1281. [DOI] [PubMed] [Google Scholar]
- Galgani J, and Ravussin E (2008). Energy metabolism, fuel selection and body weight regulation. Int. J. Obes. (Lond) Suppl 7, S109–119. [DOI] [PMC free article] [PubMed] [Google Scholar]
- Galic S, Loh K, Murray-Segal L, Steinberg GR, Andrews ZB, and Kemp BE (2018). AMPK signaling to acetyl-CoA carboxylase is required for fasting-and cold-induced appetite but not thermogenesis. Elife. 13, pii: e32656. [DOI] [PMC free article] [PubMed] [Google Scholar]
- German NJ, Yoon H, Yusuf RZ, Murphy JP, Finley LW, Laurent G, Haas W, Satterstrom FK, Guarnerio J, Zaganjor E, et al. (2016). PHD3 Loss in Cancer Enables Metabolic Reliance on Fatty Acid Oxidation via Deactivation of ACC2. Mol. Cell. 63, 1006–1020. [DOI] [PMC free article] [PubMed] [Google Scholar]
- Goodwin GW, and Taegtmeyer H (1999). Regulation of fatty acid oxidation of the heart by MCD and ACC during contractile stimulation. Am. J. Physiol. 277, E772–777. [DOI] [PubMed] [Google Scholar]
- Gordon PM, Liu D, Sartor MA, IglayReger HB, Pistilli EE, Gutmann L, Nader GA, and Hoffman EP (1985). Resistance exercise training influences skeletal muscle immune activation: a microarray analysis. J. Appl. Physiol. 112, 443–453. [DOI] [PMC free article] [PubMed] [Google Scholar]
- Gowans GJ, and Hardie DG (2014). AMPK: a cellular energy sensor primarily regulated by AMP. Biochem. Soc. Trans. 42, 71–75. [DOI] [PMC free article] [PubMed] [Google Scholar]
- Greenberg SA, Bradshaw EM, Pinkus JL, Pinkus GS, Burleson T, Due B, Bregoli L, O’Connor KC, and Amato AA (2005). Plasma cells in muscle in inclusion body myositis and polymyositis. Neurology. 65, 1782–1787. [DOI] [PubMed] [Google Scholar]
- Grunt TW (2018). Interacting Cancer Machineries: Cell Signaling, Lipid Metabolism, and Epigenetics. Trends. Endocrinol. Metab. 29, 86–98. [DOI] [PubMed] [Google Scholar]
- Gwinn DM, Shackelford DB, Egan DF, Mihaylova MM, Mery A, Vasquez DS, Turk BE, and Shaw RJ (2008). AMPK phosphorylation of raptor mediates a metabolic checkpoint. Mol. Cell. 30, 214–226. [DOI] [PMC free article] [PubMed] [Google Scholar]
- Hardie DG, Ross FA, and Hawley SA (2012). AMPK: a nutrient and energy sensor that maintains energy homeostasis. Nat. Rev. Mol. Cell Biol. 13, 251–262. [DOI] [PMC free article] [PubMed] [Google Scholar]
- Herzig S, and Shaw RJ (2018). AMPK: guardian of metabolism and mitochondrial homeostasis. Nat. Rev. Mol. Cell Biol. 19, 121–135. [DOI] [PMC free article] [PubMed] [Google Scholar]
- Hirschey MD, Shimazu T, Goetzman E, Jing E, Schwer B, Lombard DB, Grueter CA, Harris C, Biddinger S, Ilkayeva OR, et al. (2010). SIRT3 regulates mitochondrial fatty-acid oxidation by reversible enzyme deacetylation. Nature. 464, 121–125. [DOI] [PMC free article] [PubMed] [Google Scholar]
- Huang, Li T, Li X, Zhang L, Sun L, He X, Zhong X, Jia D, Song L, Semenza GL, et al. (2014). HIF-1-mediated suppression of acyl-CoA dehydrogenases and fatty acid oxidation is critical for cancer progression. Cell Rep. 8, 1930–1942. [DOI] [PubMed] [Google Scholar]
- Hunter RW, Treebak JT, Wojtaszewski JF, and Sakamoto K (2011). Molecular mechanism by which AMP-activated protein kinase activation promotes glycogen accumulation in muscle. Diabetes. 60, 766–774. [DOI] [PMC free article] [PubMed] [Google Scholar]
- Huynh FK, Green MF, Koves TR, and Hirschey MD (2014). Measurement of fatty acid oxidation rates in animal tissues and cell lines. Methods Enzymol. 542, 391–405. [DOI] [PMC free article] [PubMed] [Google Scholar]
- Inoki K, Zhu T, and Guan KL (2003). TSC2 mediates cellular energy response to control cell growth and survival. Cell. 26, 577–590. [DOI] [PubMed] [Google Scholar]
- Jacobs RA, Díaz V, Meinild AK, Gassmann M, and Lundby C (2013). The C57Bl/6 mouse serves as a suitable model of human skeletal muscle mitochondrial function. Exp. Physiol. 98, 908–921. [DOI] [PubMed] [Google Scholar]
- Jenkins CM, Yang J, Sims HF, and Gross RW (2011). Reversible high affinity inhibition of phosphofructokinase-1 by acyl-CoA: a mechanism integrating glycolytic flux with lipid metabolism. J. Biol. Chem. 286, 11937–11950. [DOI] [PMC free article] [PubMed] [Google Scholar]
- Laderoute KR, Amin K, Calaoagan JM, Knapp M, Le T, Orduna J, Foretz M, and Viollet B (2006). 5′-AMP-activated protein kinase (AMPK) is induced by low-oxygen and glucose deprivation conditions found in solid-tumor microenvironments. Mol. Cell Biol. 26, 5336–5347. [DOI] [PMC free article] [PubMed] [Google Scholar]
- Lee S, Nakamura E, Yang H, Wei W, Linggi MS, Sajan MP, Farese RV, Freeman RS, Carter BD, Kaelin WG Jr. et al. (2005). Neuronal apoptosis linked to EglN3 prolyl hydroxylase and familial pheochromocytoma genes: developmental culling and cancer. Cancer Cell. 8, 155–167. [DOI] [PubMed] [Google Scholar]
- Lee J, Choi J, Scafidi S, and Wolfgang MJ (2016). Hepatic Fatty Acid Oxidation Restrains Systemic Catabolism during Starvation. Cell Rep. 16, 201–212. [DOI] [PMC free article] [PubMed] [Google Scholar]
- Liu X, Ide JL, Norton I, Marchionni MA, Ebling MC, Wang LY, Davis E, Sauvageot CM, Kesari S, Kellersberger KA, et al. (2013). Molecular imaging of drug transit through the blood-brain barrier with MALDI mass spectrometry imaging. Sci. Rep. 3, 2859. [DOI] [PMC free article] [PubMed] [Google Scholar]
- Liu Y, Ma Z, Zhao C, Wang Y, Wu G, Xiao J, McClain CJ, Li X, and Feng W (2014). HIF-1α and HIF-2α are critically involved in hypoxia-induced lipid accumulation in hepatocytes through reducing PGC-1α-mediated fatty acid β-oxidation. Toxicol. Lett. 226, 117–123. [DOI] [PubMed] [Google Scholar]
- Manning BD, Toker A (2017). AKT/PKB Signaling: Navigating the Network. Cell. 169, 381–405. [DOI] [PMC free article] [PubMed] [Google Scholar]
- McCoin CS, Knotts TA, and Adams SH (2015). Acylcarnitines--old actors auditioning for new roles in metabolic physiology. Nat. Rev. Endocrinol. 11, 617–625. [DOI] [PMC free article] [PubMed] [Google Scholar]
- Mihaylova MM, and Shaw RJ (2011). The AMPK signalling pathway coordinates cell growth, autophagy and metabolism. Nat. Cell Biol. 13, 1016–1023. [DOI] [PMC free article] [PubMed] [Google Scholar]
- Millay DP, O’Rourke JR, Sutherland LB, Bezprozvannaya S, Shelton JM, Bassel-Duby R, Olson EN (2013). Myomaker is a membrane activator of myoblast fusion and muscle formation. Nature. 499, 301–330. [DOI] [PMC free article] [PubMed] [Google Scholar]
- Mul JD, Stanford KI, Hirshman MF, and Goodyear LJ (2015). Exercise and Regulation of Carbohydrate Metabolism. Prog. Mol. Biol. Transl. Sci. 135, 17–37. [DOI] [PMC free article] [PubMed] [Google Scholar]
- Narkar VA, Downes M, Yu RT, Embler E, Wang YX, Banayo E, Mihaylova MM, Nelson MC, Zou Y, Juguilon H, et al. (2008). AMPK and PPARdelta agonists are exercise mimetics. Cell. 134, 405–415. [DOI] [PMC free article] [PubMed] [Google Scholar]
- Navarrete-Perea J, Yu Q, Gygi SP, and Paulo JA (2018). Streamlined Tandem Mass Tag (SL-TMT) Protocol: An Efficient Strategy for Quantitative (Phospho)proteome Profiling Using Tandem Mass Tag-Synchronous Precursor Selection-MS3. J. Proteome Res. 17, 2226–2236. [DOI] [PMC free article] [PubMed] [Google Scholar]
- O’Neill HM, Maarbjerg SJ, Crane JD, Jeppesen J, Jørgensen SB, Schertzer JD, Shyroka O, Kiens B, van Denderen BJ, Tarnopolsky MA, et al. (2011). AMP-activated protein kinase (AMPK) beta1beta2 muscle null mice reveal an essential role for AMPK in maintaining mitochondrial content and glucose uptake during exercise. Proc. Natl. Acad. Sci. USA. 108, 16092–16097. [DOI] [PMC free article] [PubMed] [Google Scholar]
- O’Neill HM, Lally JS, Galic S, Thomas M, Azizi PD, Fullerton MD, Smith BK, Pulinilkunnil T, Chen Z, Samaan MC, et al. (2014). AMPK phosphorylation of ACC2 is required for skeletal muscle fatty acid oxidation and insulin sensitivity in mice. Diabetologia. 57,1693–1702. [DOI] [PubMed] [Google Scholar]
- Palm W, and Thompson CB (2017). Nutrient acquisition strategies of mammalian cells. Nature. 546, 234–242. [DOI] [PMC free article] [PubMed] [Google Scholar]
- Paulo JA (2016). Sample preparation for proteomic analysis using a GeLC-MS/MS strategy. J. Biol. Methods. 3, pii: e45. [DOI] [PMC free article] [PubMed] [Google Scholar]
- Randle PJ, Garland PB, Hales CN, and Newsholeme EA (1963). The glucose fatty-acid cycle. Its role in insulin sensitivity and the metabolic disturbances of diabetes mellitus. Lancet. 1, 785–789. [DOI] [PubMed] [Google Scholar]
- Raue U, Trappe TA, Estrem ST, Qian HR, Helvering LM, Smith RC, and Trappe S (1985). Transcriptome signature of resistance exercise adaptations: mixed muscle and fiber type specific profiles in young and old adults. J. Appl. Physiol. 112, 1625–1636. [DOI] [PMC free article] [PubMed] [Google Scholar]
- Ruzankina Y, Pinzon-Guzman C, Asare A, Ong T, Pontano L, Cotsarelis G, Zediak VP, Velez M, Bhandoola A, and Brown EJ (2007). Deletion of the developmentally essential gene ATR in adult mice leads to age-related phenotypes and stem cell loss. Cell Stem Cell. 1, 113–126. [DOI] [PMC free article] [PubMed] [Google Scholar]
- Salt IP, Johnson G, Ashcroft SJ, and Hardie DG (1998). AMP-activated protein kinase is activated by low glucose in cell lines derived from pancreatic beta cells, and may regulate insulin release. Biochem. J. 335, 533–539. [DOI] [PMC free article] [PubMed] [Google Scholar]
- Schiaffino S (2018). Muscle fiber type diversity revealed by anti-myosin heavy chain antibodies. FEBS J. 285, 3688–3694. [DOI] [PubMed] [Google Scholar]
- Sellick CA, Hansen R, Stephens GM, Goodacre R, and Dickson AJ (2011). Metabolite extraction from suspension-cultured mammalian cells for global metabolite profiling. Nat. Protoc. 6, 1241–1249. [DOI] [PubMed] [Google Scholar]
- Spinelli JB, and Haigis MC (2018). The multifaceted contributions of mitochondria to cellular metabolism. Nat. Cell Biol. 20, 745–754. [DOI] [PMC free article] [PubMed] [Google Scholar]
- Spriet LL (2014). New insights into the interaction of carbohydrate and fat metabolism during exercise. Sports Med. Suppl 1, S87–96. [DOI] [PMC free article] [PubMed] [Google Scholar]
- Takeda K, Ho VC, Takeda H, Duan LJ, Nagy A, and Fong GH (2006). Placental but not heart defects are associated with elevated hypoxia-inducible factor alpha levels in mice lacking prolyl hydroxylase domain protein 2. Mol. Cell Biol. 26, 8336–8346. [DOI] [PMC free article] [PubMed] [Google Scholar]
- Tennant DA, and Gottlieb E (2010). HIF prolyl hydroxylase-3 mediates alpha-ketoglutarate-induced apoptosis and tumor suppression. J. Mol. Med. (Berl). 88, 839–849. [DOI] [PubMed] [Google Scholar]
- Tong L, and Harwood HJ Jr. (2006). Acetyl-coenzyme A carboxylases: versatile targets for drug discovery. J. Cell Biochem. 99, 1476–1488. [DOI] [PMC free article] [PubMed] [Google Scholar]
- Tran TH, Hsiao YS, Jo J, Chou CY, Dietrich LE, Walz T, and Tong L (2015). Structure and function of a single-chain, multi-domain long-chain acyl-CoA carboxylase. Nature. 518, 120–124. [DOI] [PMC free article] [PubMed] [Google Scholar]
- Wei J, and Tong L (2015). Crystal structure of the 500-kDa yeast acetyl-CoA carboxylase holoenzyme dimer. Nature. 526, 723–727. [DOI] [PMC free article] [PubMed] [Google Scholar]
- Woods SC, and Ramsay DS (2011). Food intake, metabolism and homeostasis. Physiol. Behav. 104, 4–7. [DOI] [PMC free article] [PubMed] [Google Scholar]
Associated Data
This section collects any data citations, data availability statements, or supplementary materials included in this article.
Supplementary Materials
Data Availability Statement
This study did not generate any unique datasets or code.