Abstract
Glycolysis is a well-known process by which metabolically active cells, such as tumor or immune cells meet their high metabolic demands. Previously, our laboratory has demonstrated that in airway epithelial cells, the pleiotropic cytokine, interleukin-1 beta (IL1B) induces glycolysis and that this contributes to allergic airway inflammation and remodeling. Activation of glycolysis is known to increase NADPH reducing equivalents generated from the pentose phosphate pathway, linking metabolic reprogramming with redox homeostasis. In addition, numerous glycolytic enzymes are known to be redox regulated. However, whether and how redox chemistry regulates metabolic reprogramming more generally remains unclear. In this study, we employed a multi-omics approach in primary mouse airway basal cells to evaluate the role of protein redox biochemistry, specifically protein glutathionylation, in mediating metabolic reprogramming. Our findings demonstrate that IL1B induces glutathionylation of multiple proteins involved in metabolic regulation, notably in the glycolysis pathway. Cells lacking Glutaredoxin-1 (Glrx), the enzyme responsible for reversing glutathionylation, show modulation of multiple metabolic pathways including an enhanced IL1B-induced glycolytic response. This was accompanied by increased secretion of thymic stromal lymphopoietin (TSLP), a cytokine important in asthma pathogenesis. Targeted inhibition of glycolysis prevented TSLP release, confirming the functional relevance of enhanced glycolysis in cells stimulated with IL1B. Collectively, data herein point to an intriguing link between glutathionylation chemistry and glycolytic reprogramming in epithelial cells and suggest that glutathionylation chemistry may represent a therapeutic target in pulmonary pathologies with perturbations in the glycolysis pathway.
Keywords: asthma, glutathionylation, glycolysis, inflammation
1 |. INTRODUCTION
Metabolic reprogramming is defined as an altered configuration of cellular metabolism to meet the specialized needs of cells or tissues exposed to distinct stimuli or stresses. Multiple stimuli that reconfigure cellular metabolism and various metabolites that regulate effector functions have been recognized. Aerobic glycolysis, is one example of metabolic reprogramming and is a well-known feature of metabolically active cells enabling the use of glucose-derived carbons to synthesize macromolecules. Rapidly proliferating tumor cells utilize carbons from glucose to meet their metabolic demands.1 The activation of immune cells is also accompanied by enhanced glycolysis to permit effector function and cytokine production. For example, the activation of dendritic cells or macrophages with pro-inflammatory stimuli increases glycolysis to produce lipids important for the subsequent activation of T cells,2–4 and enhanced glycolysis contributes to chronic inflammation and autoimmunity.5
Epithelial cells at mucosal barriers play key roles in protecting tissues from environmental stressors and produce a diverse array of antimicrobial factors, mucins, growth factors, chemokines and cytokines to promote homeostasis, tissue repair and afford protection against invading pathogens.6,7 Epithelial cells are therefore metabolically active and are likely to respond to diverse stimuli through metabolic reprogramming. Previous work from our laboratory and others has shown that aerobic glycolysis is a key feature of epithelial cell activation or regeneration, akin to observations in immune cells.8,9 Notably, we demonstrated that interleukin-1 (IL1) is a prominent inducer of glycolysis in airway epithelial cells and in settings of allergic inflammation.8 Enhanced glycolysis contributed to allergic inflammation, remodeling, and hyperresponsiveness in a mouse model of house dust mite-induced allergic airway disease. Furthermore, increases in lactate, a marker of glycolysis, were observed in sputum samples from asthmatics and directly correlated with increases in airway neutrophils and disease severity.8
Glycolytic reprogramming is closely linked to changes in redox homeostasis. Enhanced glycolysis offers protection against oxidative stress owing to increases in NADPH derived from the pentose phosphate pathway, an offshoot of glycolysis. Notably, tumor cells augment glycolysis to combat enhanced oxidative stress and to maintain homeostasis of glutathione,10 a major cellular redox system.11 Numerous proteins in the glycolysis cascade are redox regulated, suggesting that oxidative events contribute to increases in glycolysis. Of note, oxidation of the glycolysis enzymes glyceraldehyde-3-phosphate dehydrogenase,12,13 6-phosphofructo-2-kinase/fructose-2,6-bisphosphatase 3 (PFKFB3),14 triosephosphate isomerase,15 lactate dehydrogenase, and enolase16 have been demonstrated, in association with changes in their function.
One facet of glutathione biochemistry that remains less well recognized is its ability to regulate protein oxidation. Under conditions of oxidative stress, reactive cysteines are oxidized to sulfenic acid and other intermediates.17 Glutathione can react with sulfenic acid intermediates leading to glutathionylated moieties. Glutathione disulfide, the oxidized form of glutathione, also can induce protein glutathionylation (also known as S-glutathionylation or protein mixed disulfides). Glutathionylation is critical in the protection from irreversible overoxidation of protein cysteines, and also affects protein structure and function. Glutaredoxin-1 is a cellular enzyme that deglutathionylates its target proteins and reestablishes the reduced protein thiol groups.18,19 To date, it remains unclear whether glutathionylation affects glycolytic reprogramming and subsequent pro-inflammatory responses. Furthermore, the extent to which changes in glycolysis and other metabolic pathways occur in primary epithelial cells in response to an innate immune stimulus remains incompletely known. In the present study, we sought to investigate the importance of glutathionylation chemistry in metabolic reprogramming of primary airway basal cells via the comparative evaluation of WT or Glrx−/− cells. Given the importance of IL1B as an innate immune activator, its ability to induce glycolysis in epithelial cells and prior observations that IL1B induces oxidative stress,20,21 we utilized IL1B as the stimulus to assess metabolic reprogramming using multiple-omics approaches, while emphasizing glycolysis. Our results demonstrate that IL1B-stimulated glycolysis is enhanced in the absence of Glrx and that multiple proteins in the glycolysis pathway are targets of glutathionylation.
2 |. METHODS
2.1 |. Reagents and antibodies
Recombinant mouse IL1B was purchased from R&D systems, Minneapolis, MN, USA. Anti-GSH antibody was acquired from Virogen, Watertown, MA, USA. GAPDH and HK1 antibody were from Cell signaling technology, Danvers, MA, USA. [U-13C] labeled glucose and 2-deoxy-D-glucose (2-DG) were obtained from Sigma-Aldrich, St. Louis, MO, USA. TSLP, GM-CSF, CCL20/MIP-3 alpha, and CXCL1/KC mouse ELISA kits were purchased from R&D systems, Minneapolis, MN, USA.
2.2 |. Mouse airway basal cell cultures and exposure to IL1B
Primary mouse tracheal epithelial (MTE) cells were isolated from wild-type (WT) C57BL6/NJ mice or C57BL6/NJ mice lacking Glrx gene (GLRX KO) and cultured as previously described.22,23 Cells were grown on transwell inserts with media change every 2 days until forming a monolayer depicted by stable transepithelial electrical resistance (TEER) measurement. Media was then switched to plain DMEM:F12 media overnight followed by the incubation with IL1B (10 ng/mL) or 0.1% bovine serum albumin (BSA) in phosphate-buffered saline (PBS) (vehicle control) for 24 hours. To test the effect of glycolysis inhibition on pro-inflammatory cytokines release, cells were incubated in media containing 10 mM 2-DG for 1 hour before stimulation with IL1B.
2.3 |. 13C-glucose labeling and metabolomics analysis
MTE cells were grown to confluency as described above. The cells were washed and incubated overnight in plain DMEM:F12 media containing 6 mM glucose and 2 mM glutamine. The next day, cells were washed three times in media with no glucose, then, treated with IL1B or 0.1% BSA in PBS in media containing 6 mM of 13C-glucose and 2 mM glutamine. After 24 hours, cells were washed with PBS and pelleted. The supernatant was removed, and pellets were snap frozen in liquid nitrogen. Mass spectrometry-based metabolomics was performed at the University of Colorado, School of Medicine Metabolomics Core. Metabolites were extracted from frozen cell pellets by vortexing 30 minutes in the presence of ice-cold 5:3:2 methanol:acetonitrile:water (v/v/v) at 2 million cells per mL as described.24 Supernatants were clarified via centrifugation at 18 000g for 10 minutes at 4°C, then, analyzed on a Thermo Vanquish UHPLC coupled to a Thermo Q Exactive mass spectrometer using a 5 minutes C18 gradient in positive and negative ion modes (separate runs) exactly as previously described.25,26 Quality control, metabolite annotation, and peak area integration were performed using Maven (Princeton University) as described.26,27 Isotopologue distribution was plotted in GraphPad Prism 8.0. Heat maps were created by using a range scale function to scale the data set and visualized using the ComplexHeatmap package in R.28,29
2.4 |. DNA array
Microarray samples were prepared with a 50 ng RNA input as previously described using the Ovation Pico WTA System V2 (PN3302–12). Samples were biotinylated (a 5.5 μg input) with the Encore Biotin Module Part No. 4200–12. Briefly, Encore Biotin Module employs a proprietary fragmentation and labeling process that combines enzymatic and chemical processes for the preparation of labeled cDNA suitable for hybridization to Affymetrix GeneChip. Efficiency of the fragmentation and labeling reactions were verified using NeutrAvidin (10 mg/mL) with a gel-shift assay. An input of 2.5 μg of Biotin labeled single primer isothermal amplification (SPIA) cDNA was combined with a hybridization mix, injected into Mouse Clariom S arrays, and placed in the Affymetrix GeneChip Hybridization Oven 645 at 45°C and 60 RPM for 16.5 hours overnight. Arrays were stained using the Affymetrix GeneChip Fluidics Station 450 and scanned with the 7G Affymetrix GeneChip Scanner 3000. DNA array was normalized using the Transcriptome Analysis Console software (Thermo Fisher). The data were loaded into R28 using the Biobase package30 and annotated using the R package affycoretools.31 Differential expression between groups was calculated using the LIMMA package in R32 and a P value of less than .05 and fold change greater than 2 were used as a cutoffs. Heat maps of mRNA expression were created using the ComplexHeatmap package in R.29
2.5 |. Identification of glutathionylated proteins using GLRX-catalyzed cysteine derivatization and mass spectrometry
Cells were lysed in 50 mM Tris buffer pH 7.4 with 150 mM NaCl, 1% Igepal-630, 5 mM ethylenediaminetetraacetic acid (EDTA), 0.1% sodium dodecyl sulfate (SDS), 0.5% sodium deoxycholate, and 80 mM methyl methanethiosulfonate (MMTS). A 2 mL of blocking buffer containing 100 mM HEPES, pH 7.5, 1 mM EDTA, 2.5% SDS, and 80 mM MMTS was added to each sample and they were incubated at 50°C for 20 minutes to block free thiol groups on cysteine residues. Samples containing 1 mg protein were acetone-precipitated three times with 70% ice-cold acetone to remove excess MMTS from the solution and resuspended in binding buffer (10 mM HEPES pH 8.0, 0.1 mM EDTA, and 0.1% SDS). Each sample was incubated with 1 mM NADPH, 35 μg/mL glutathione reductase (Sigma-Aldrich, St. Louis, MO), 25 μg/mL wild-type mouse GLRX,33 and 0.2 mM reduced GSH for 30 minutes at 37°C to remove the GSH adduct from cysteine thiol groups. Negative control samples were incubated in the absence of GLRX and GSH. Proteins containing free thiol groups following GLRX-derivatization were pulled down by rotating each sample with 10 mg of Thiopropyl Sepharose beads (Sigma-Aldrich, St. Louis, MO) for 1 hour at room temperature. The beads were washed three times with 10 mM HEPES (pH 8.0), 0.1 mM EDTA, 1% SDS, and 250 mM NaCl and proteins were eluted from the beads by boiling the samples in 1x Laemmli buffer for 8 minutes at 95°C before loading the samples onto 10% of acrylamide gels. Gels were stained with Coomassie blue, bands were excised from the gel, and washed with 50% of methanol and 5% of acetic acid overnight. The proteins were reduced with 10 mM dithiothreitol and alkylated with 100 mM iodoacetamide followed by digestion with Promega sequencing grade modified trypsin (20 ng/μL) (Promega, Madison, WI). The digested samples were analyzed on the Q Exactive Plus mass spectrometer coupled to an EASY-nLC 1200 (Thermo Fisher Scientific). Samples were loaded onto a 100 μm × 125 mm capillary column packed Halo C18 (2.7 μm particle size, 90 nm pore size, Michrom Bioresources, CA, USA) at a flow rate of 300 nL/min. The column end was laser pulled to a ~3 μm orifice and packed with minimal amount of 5 μm Magic C18AQ before packing with the 2.7 μm particle size chromatographic materials. Peptides were separated by a gradient of 0%–35% CH3CN/0.1% FA over 60 minutes, 35%–80% CH3CN/0.1% FA in 1 minute, and then 80% CH3CN/0.1% FA for 4 minutes, followed by an immediate return to 0% CH3CN/0.1% FA and a hold at 0% CH3CN/0.1% FA. Samples were randomized in run order. Mass spectrometry data were acquired in a data-dependent “Top 10” acquisition mode with lock mass function activated (m/z 371.1012; use lock masses: best; lock mass injection: full MS), in which a survey scan from m/z 350–1600 at 70 000 resolution (AGC target 1e6; max IT 100 ms; profile mode) was followed by 10 higher-energy collisional dissociation (HCD) tandem mass spectrometry (MS/MS) scans on the most abundant ions at 35 000 resolution (loop count = 10; AGC target 5e4; max IT 100 ms; centroid mode). MS/MS scans were acquired with an isolation width of 1.2 m/z and a normalized collisional energy of 35%. Dynamic exclusion was enabled (peptide match: preferred; exclude isotopes: on; underfill ratio: 1%). Minimum AGC target = 1e3. Product ion spectra were searched using SEQUEST in the Proteome Discoverer 2.2 against a Uniprot Mus musculus protein database downloaded on June, 2017) with the “Basic” Processing and Consensus workflows. Appropriate fix and variable modifications were considered. Target Decoy PSM Validator was included in the workflow to limit the false discovery rate to less than 1%.
2.6 |. Western blot analysis
Cell lysates were prepared and protein concentration was determined using the Bio-Rad DC protein estimation kit. Equal amounts of proteins were resolved using sodium dodecyl sulfate (SDS)-polyacrylamide gel electrophoresis and transferred to polyvinylidene difluoride (PVDF) membranes. Overnight incubation with GSH, GAPDH or HKI antibody was performed before membranes were developed using peroxidase-conjugated secondary antibodies and imaged with chemiluminescence. For immunoprecipitating glutathionylated proteins, 200 μg of proteins were used in the pull down with one sample incubated with 50 mM DTT as a negative control.
2.7 |. Statistical analysis
Data in this manuscript are expressed as means ± SEM. Significant differences between groups were determined using the GraphPad Prism (GraphPad 8.2.1) software and analyzed by one-way ANOVA with a Tukey’s post hoc correction test for multiple comparisons. P values lower than .05 were considered significant.
3 |. RESULTS
3.1 |. Increased glutathionylation of multiple classes of proteins in response to interleukin-1 beta (IL1B) and exacerbation in the absence of glutaredoxin-1 (Glrx)
We previously demonstrated that IL1B is a key inducer of glycolysis in lung epithelial cells which enhances production of pro-inflammatory cytokines and augments responsiveness to house dust mite allergen.8,34 Previous studies have also demonstrated that IL1B induces oxidative stress.20,21 We therefore explored whether increases in glutathionylation occur in response to stimulation with IL1B. In epithelial cells exposed to IL1B for 24 hours, overall glutathionylation was increased (Figure 1A). Comparative evaluation of epithelial cells lacking Glrx−/− demonstrated further increases in glutathionylation compared to control cells (Figure 1A), consistent with the physiological role of GLRX as a deglutathionylase. We next identified the proteins that were glutathionylated in this experimental setting, by blocking reduced thiols with MMTS followed by GLRX-mediated cysteine derivatization, thiopropyl sepharose bead capture and identification of captured protein by mass spectrometry. Although the absolute number of glutathionylated proteins differed between two independently conducted experiments, a substantial portion of captured proteins overlapped, including 102 proteins in WT control cells, and 277 proteins in WT cells stimulated with IL1B. In control Glrx−/− cells, 167 glutathionylated proteins were detected, while in Glrx−/− cells stimulated with IL1B this number increased to 179 proteins (Figure 1B, Supplementary Figure 1A). Four glutathionylated proteins were uniquely detected in WT control cells, and 83 glutathionylated proteins were unique to WT cells stimulated with IL1B, whereas 9 proteins were uniquely detected in control Glrx−/− cells and 19 in Glrx−/− cells treated with IL1B (Supplementary Figure 1A). Pathway enrichment analysis performed using the Kyoto Encyclopedia of Genes and Genomes (KEGG) database35 revealed that the identified glutathionylated proteins in each group occurred in overlapping categories (Figure 1C) with hits predominantly occurring in metabolic pathways, including glycolysis (Supplementary Figure 1B). As expected, GLRX itself also was detected in all four groups (Supplementary Figure 1A), likely reflecting the capture of exogenous GLRX used in the derivatization reaction. Immunoprecipitation of glutathionylated proteins using an anti-GSH antibody followed by Western blotting validated some of these glutathionylation targets in the glycolysis pathway (Figure 1D). Overall, these data show that IL1B increases total protein glutathionylation in airway epithelial cells that is exacerbated in the absence of GLRX and suggest that protein glutathionylation affects multiple biochemical pathways, with a notable enrichment of proteins that govern cellular glucose metabolism.
FIGURE 1.
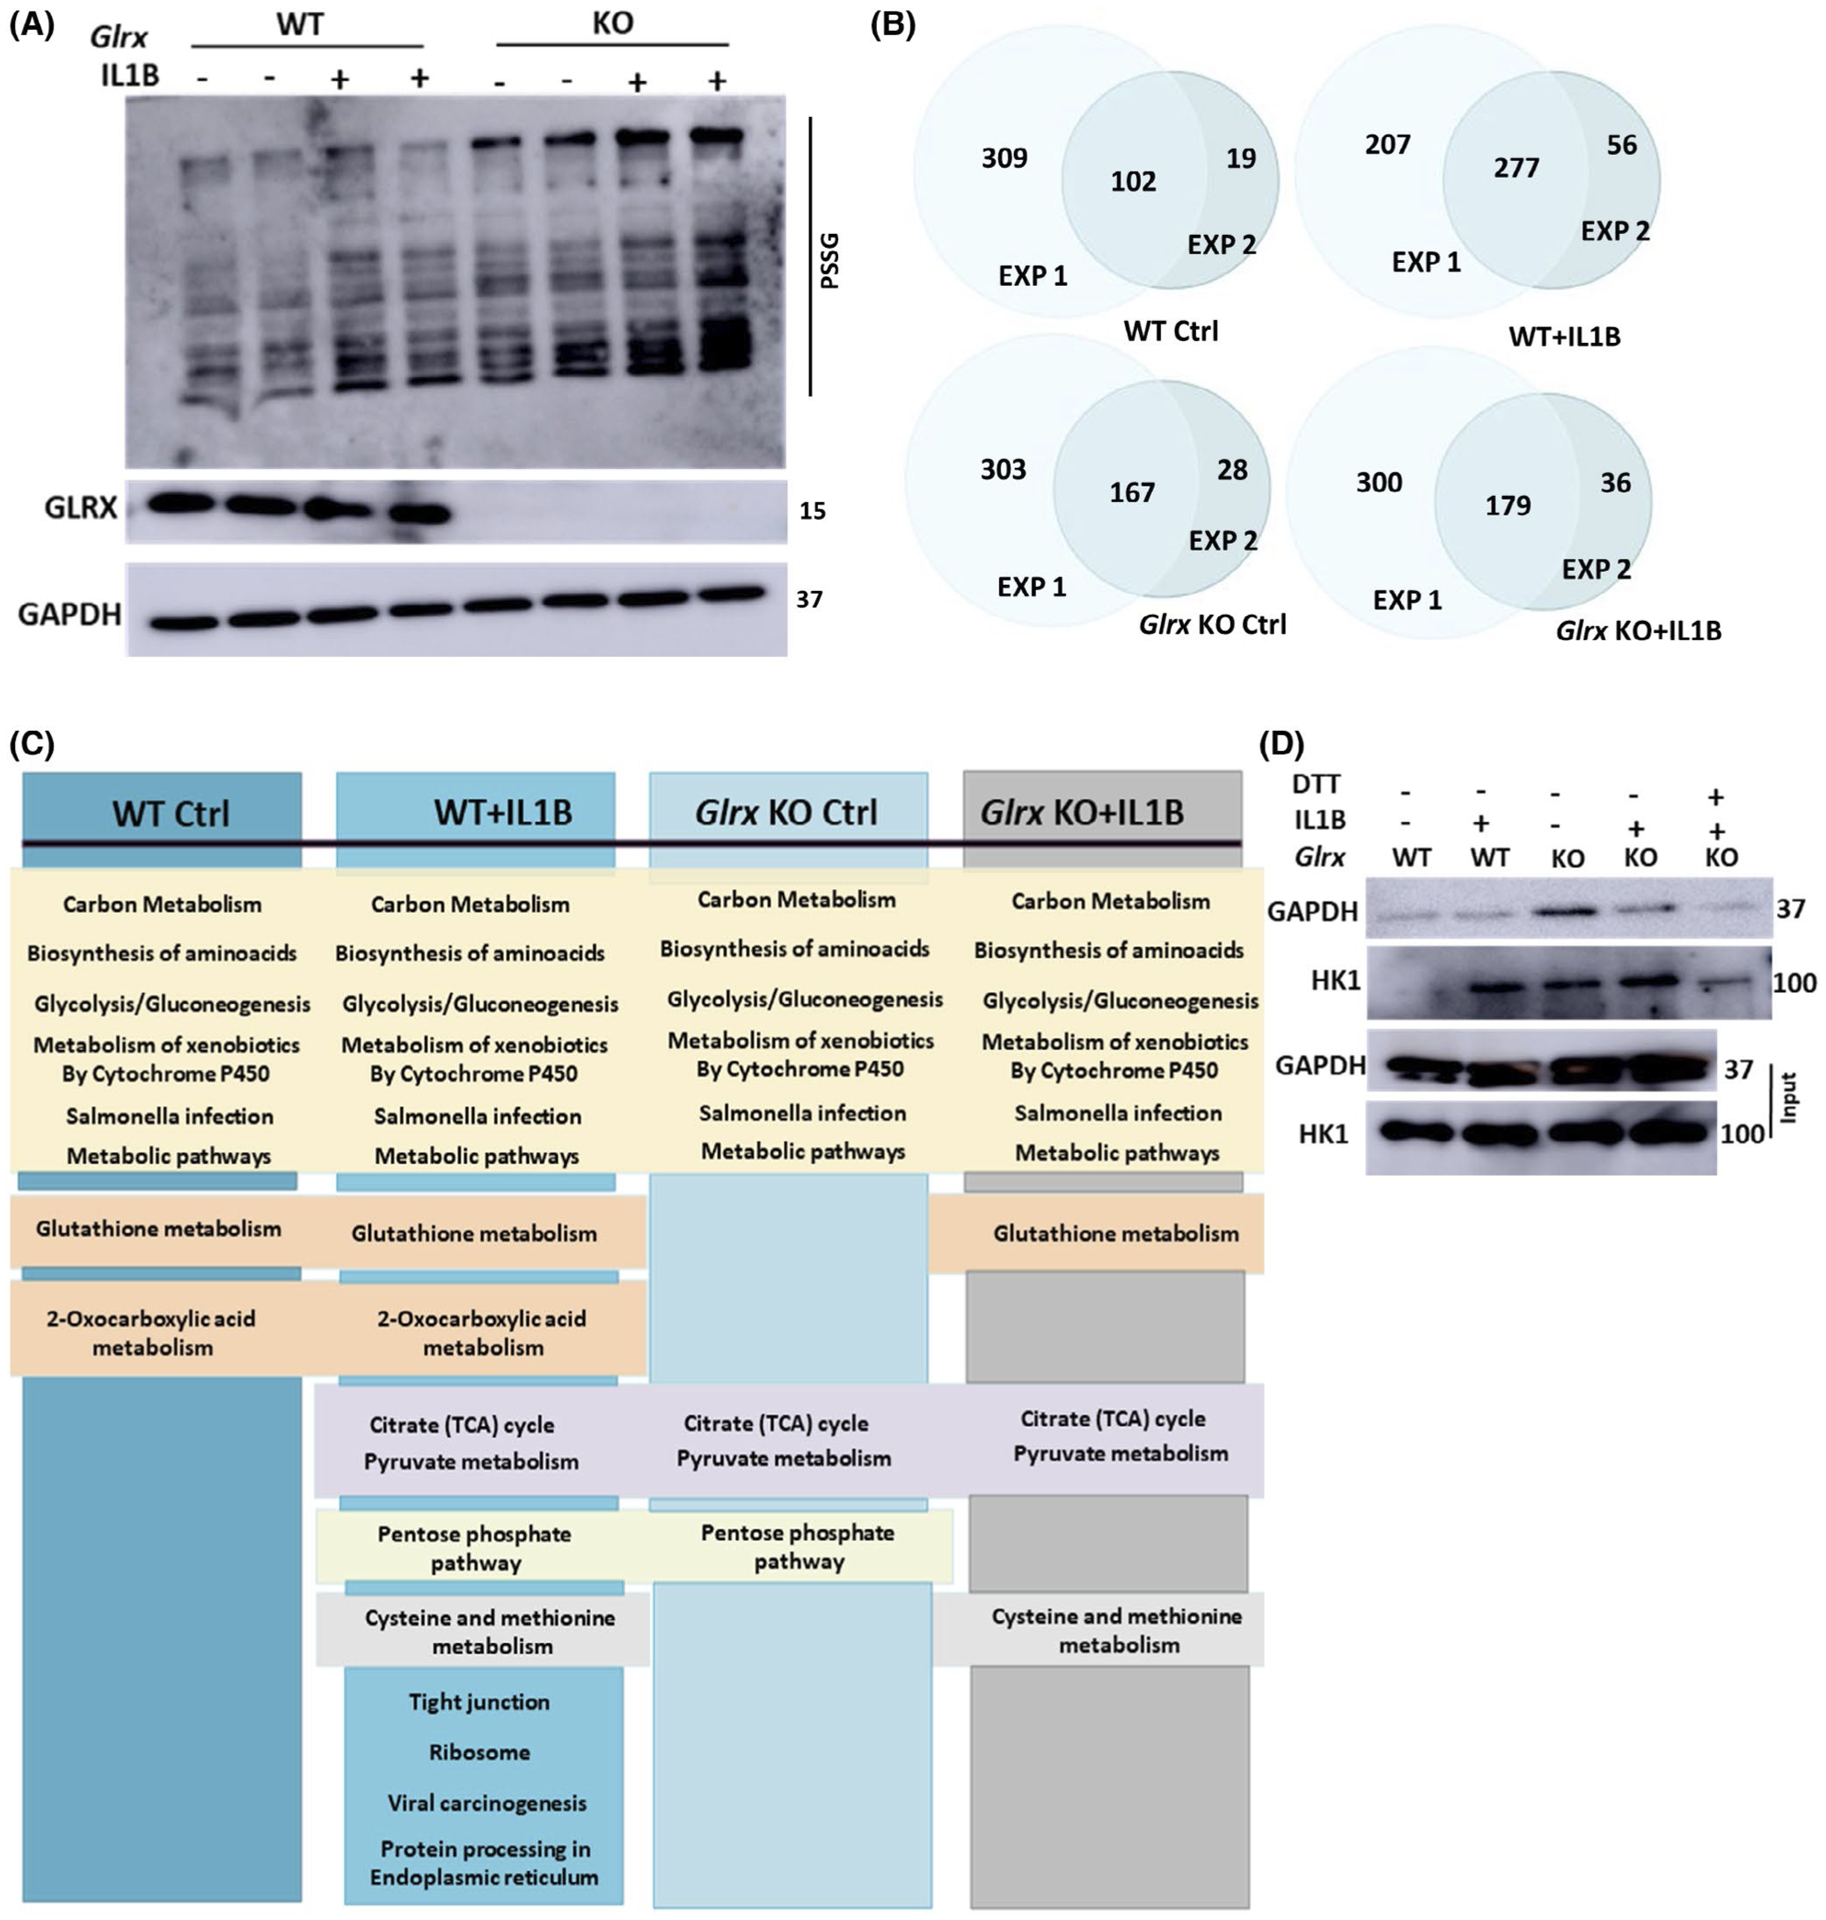
Assessment of IL1B-mediated effects on protein glutathionylation in mouse airway basal cells and the impact of ablation of Glrx. A, Western blot of total glutathionylated proteins in WT and Glrx−/− airway basal cells treated with 10 ng/mL IL1B for 24 hours or vehicle control. Top: Anti-GSH, Middle: GLRX, bottom: GAPDH as a loading control. B, Venn diagrams showing numbers of glutathionylated proteins in WT ctrl, WT + IL1B, Glrx−/− Ctrl, and Glrx−/− +IL1B groups appearing in two independent experiments. Results in C and supplementary Figure 1 reflect analyses done on only the overlapping proteins between the two experiments. C, KEGG pathways analysis for glutathionylated proteins appearing in each group. D, Confirmation of select glutathionylation target using immunoprecipitation with an GSH antibody followed by Western blotting for GAPDH and HK1. Dithiothreitol (DTT) was added to the cell lysate prior to immunoprecipitation as a negative control. Bottom input panels: Western blots of whole cell lysates
3.2 |. Targeted metabolomics identification of metabolites in epithelial cells stimulated with IL1B
Given that glutathionylated proteins were enriched in metabolic pathways, we next conducted targeted metabolomics analysis in order to unravel whether the abundance of metabolites changed in epithelial cells stimulated with IL1B, and whether these patterns were affected in the absence of GLRX. Heat maps demonstrate a statistically significant difference in the abundance of multiple metabolites in MTE cells exposed to IL1B, with a further enrichment of some metabolites occurring at baseline or in response to IL1B in Glrx−/− cells compared to WT counterparts (Figure 2). KEGG pathway analyses revealed significant differences in metabolites between WT control and IL1B-exposed cells in the categories of aminoacyl t-RNA biosynthesis, alanine, aspartate and glutamate metabolism, arginine biosynthesis, phenylalanine, tyrosine and tryptophan biosynthesis, glutathione metabolism and valine, leucine, and isoleucine biosynthesis (Supplementary Figure 2). Compared to WT cells exposed to IL1B, IL1B-exposed Glrx-deficient cells revealed increases in metabolites representing some of these pathways along with additional metabolites occurring in the TCA cycle as well as arginine and proline metabolism (Supplementary Figure 2).
FIGURE 2.
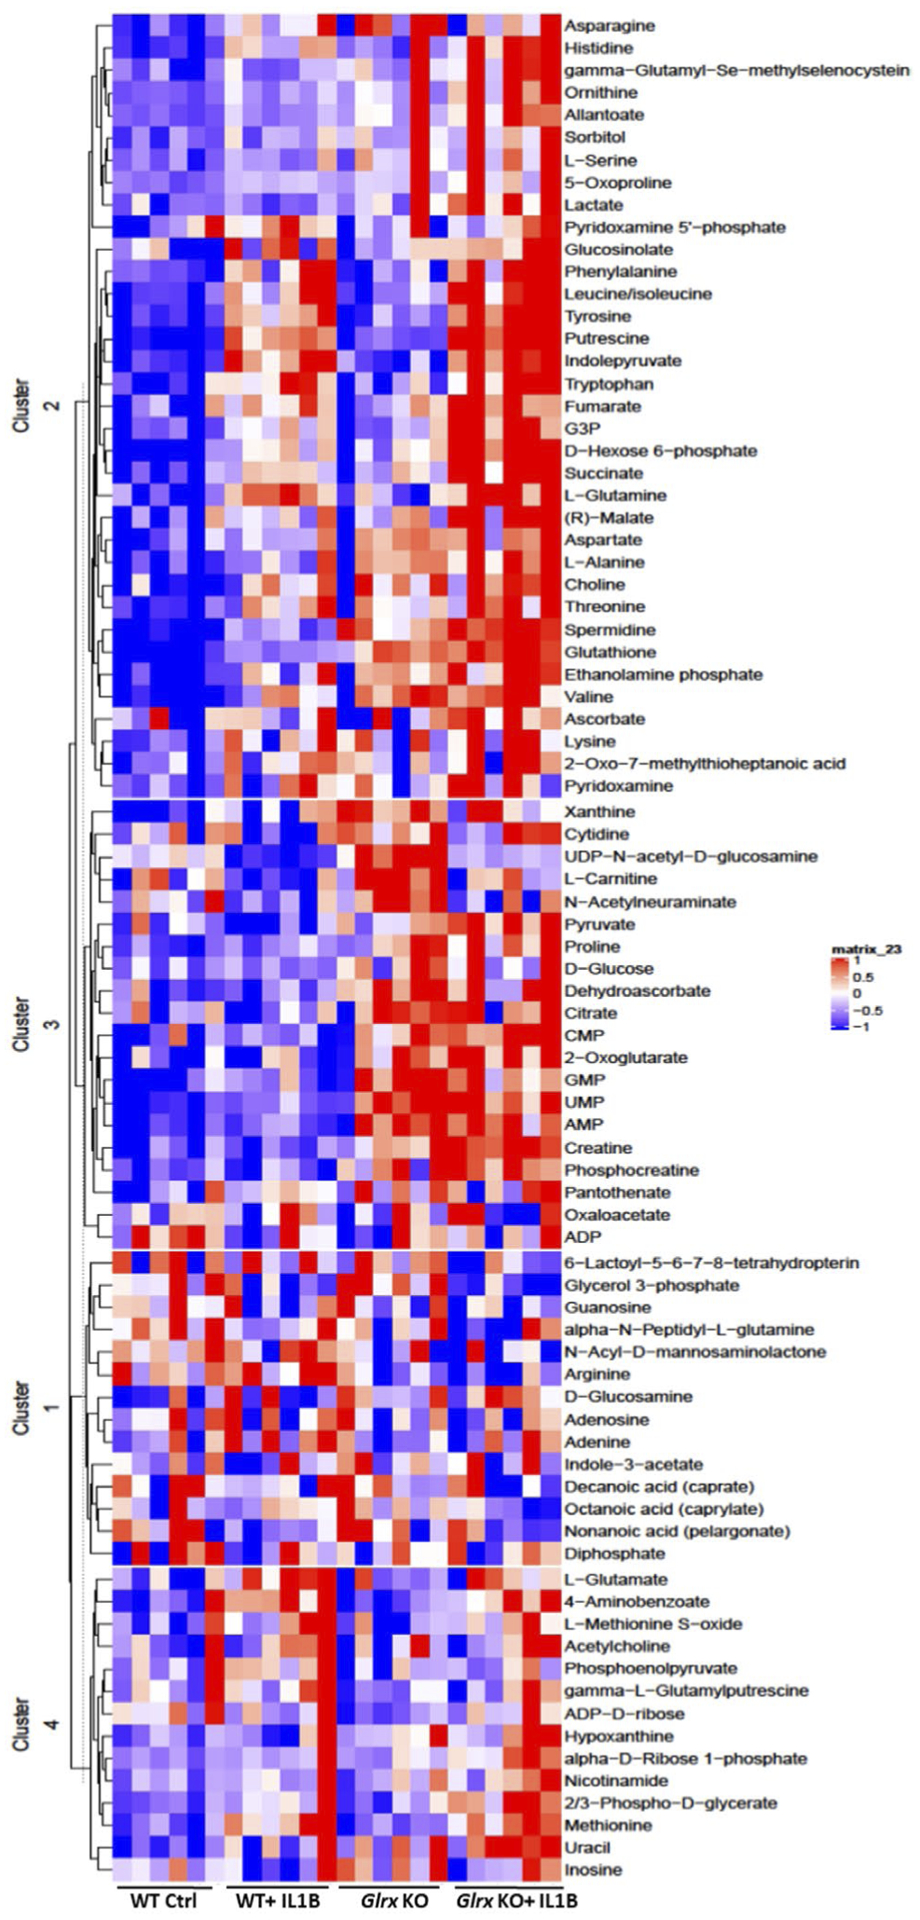
Metabolomics analysis in WT or Glrx−/− airway basal cells stimulated with IL1B. Heat map showing the top differentially regulated metabolites appearing in each of the four groups. Each column represents a biological replicate. The heat map was generated using range scaled metabolomics data with a P value < .05 for one of the four comparisons
3.3 |. Assessment of differential gene expression in epithelial cells stimulated with IL1B
Based on the complex differences in glutathionylated proteins and metabolites observed in epithelial cells exposed to IL1B, we next sought to explore whether gene expression changes induced by IL1B mirrored some of these changes. We therefore conducted a DNA array study to address this question. As anticipated, the most significantly upregulated mRNAs reflected genes important in inflammation and innate host responses, including the TNF signaling pathway, (Figure 3, Supplementary Figure 3). KEGG pathway analysis revealed significant differences between control and IL1B-exposed cells in multiple categories, and expression changes in genes within many of these classes were enhanced in Glrx−/− cells (Supplementary Figure 3). Of note, expression of genes in glycolysis/gluconeogenesis and metabolic pathways were preferentially enhanced in Glrx−/− cells compared to the respective control groups (Supplementary Figures 3 and 4), consistent with targets observed in these pathways identified in the glutathionylated proteome and via targeted metabolomics.
FIGURE 3.
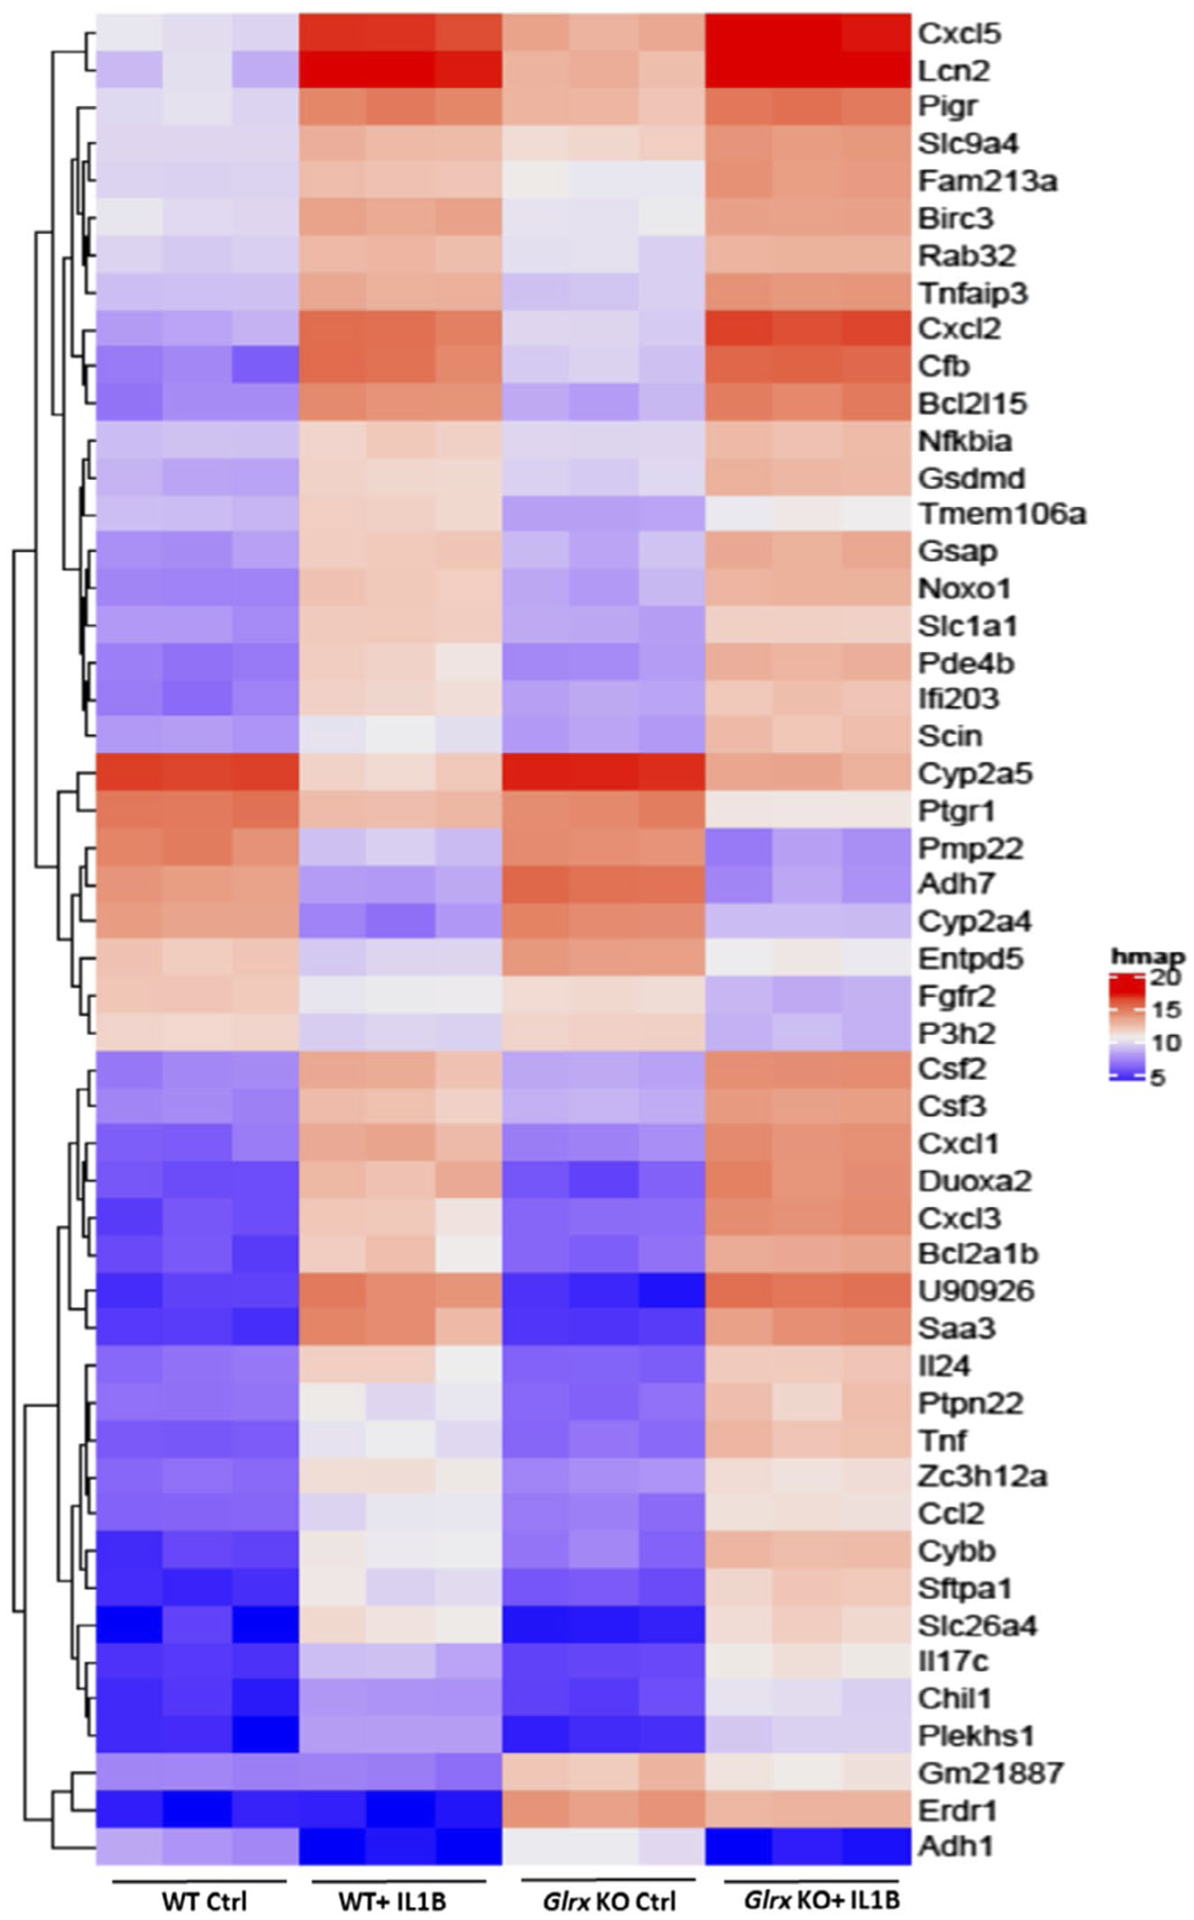
Microarray analysis in WT or Glrx−/− airway basal cells stimulated with IL1B. Heat map for the top 50 differentially regulated genes in the four groups. P values were calculated by comparing all four comparisons using Linear Models for Microarray Data (LIMMA)
3.4 |. Multi-omics pathway analysis in IL1B-stimulated epithelial cells
The assessment of the glutathionylated proteome, metabolome, and gene expression profiles revealed significant overlapping KEGG pathway enrichments across all three-omics platforms. Notably, the glycolysis pathway contained numerous hits across all three platforms. Intracellular levels of hexose-6-phosphate were significantly increased in Glrx−/− cells compared to WT controls. In addition, hexose-6-phosphate, glyceraldehyde-3-phosphate, pyruvate, and lactate were significantly elevated in Glrx−/− cells after IL1B stimulation compared to WT counterparts (Figure 4A, right). Glrx−/− cells showed constitutive increases in a number of glycolysis genes relative to WT cells including Hk1 (hexokinase1), Pfk (phosphofructokinase), Aldoa (fructose-bisphosphate aldolase), Tpi1 (triosephosphate isomerase), Gapdh (glyceraldehyde-3-phosphase dehydrogenase), Pgk1 (phosphoglycerate kinase1), Eno1 (enolase), Pkm (pyruvate kinase M), and Lhda (lactate dehydrogenase A). Expression of some of these genes also increased in response to IL1B both in WT and Glrx−/− cells, consistent with earlier findings.8 Interestingly, numerous of the enzymes in the glycolysis cascade were also identified as targets for glutathionylation, without any clear differences between genotypes or treatment groups (Figure 4A, left, green boxes). In addition to the modulation of the glycolysis pathway, a number of TCA metabolites including succinate, fumarate, and malate were more robustly increased in IL1B-exposed Glrx−/− cells compared to the WT groups (Figure 4B, bottom). These alterations were accompanied by changes in mRNA expression in TCA cycle genes (Figure 4B, top). Interestingly, citrate synthase, aconitase, isocitrate dehydrogenase, oxoglutarate dehydrogenase, succinate dehydrogenases, and malate dehydrogenase were all identified as targets for glutathionylation in one or more of the treatment groups or genotypes compared (Figure 4B, top, green boxes). Together, these multi-omics pathway analyses point to a prominent regulatory role for glutathionylation in the reconfiguration of the glycolysis pathway and the TCA cycle.
FIGURE 4.
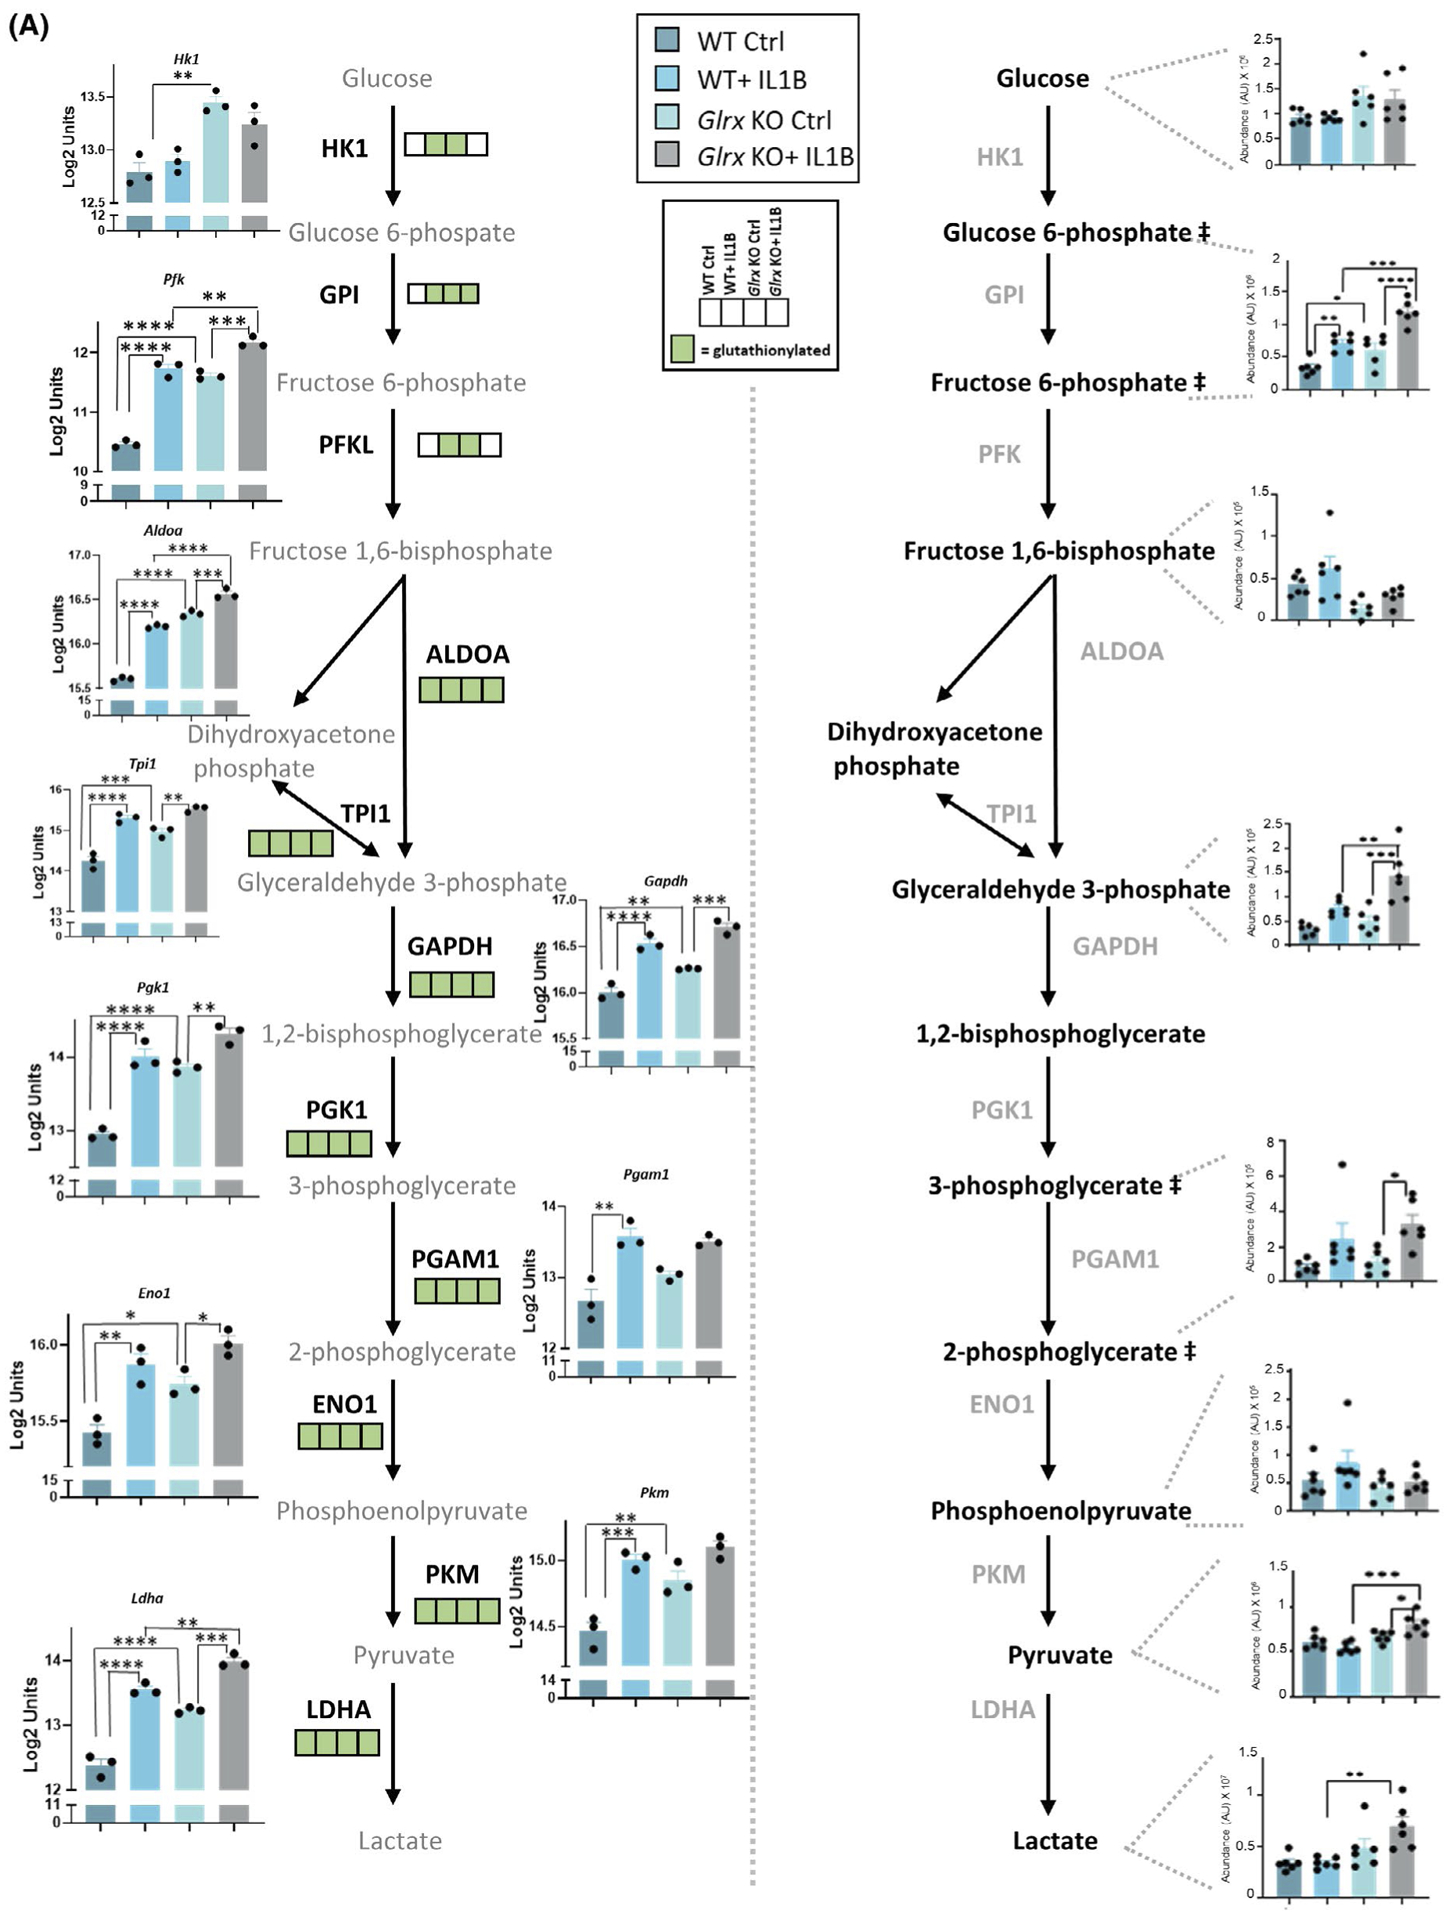
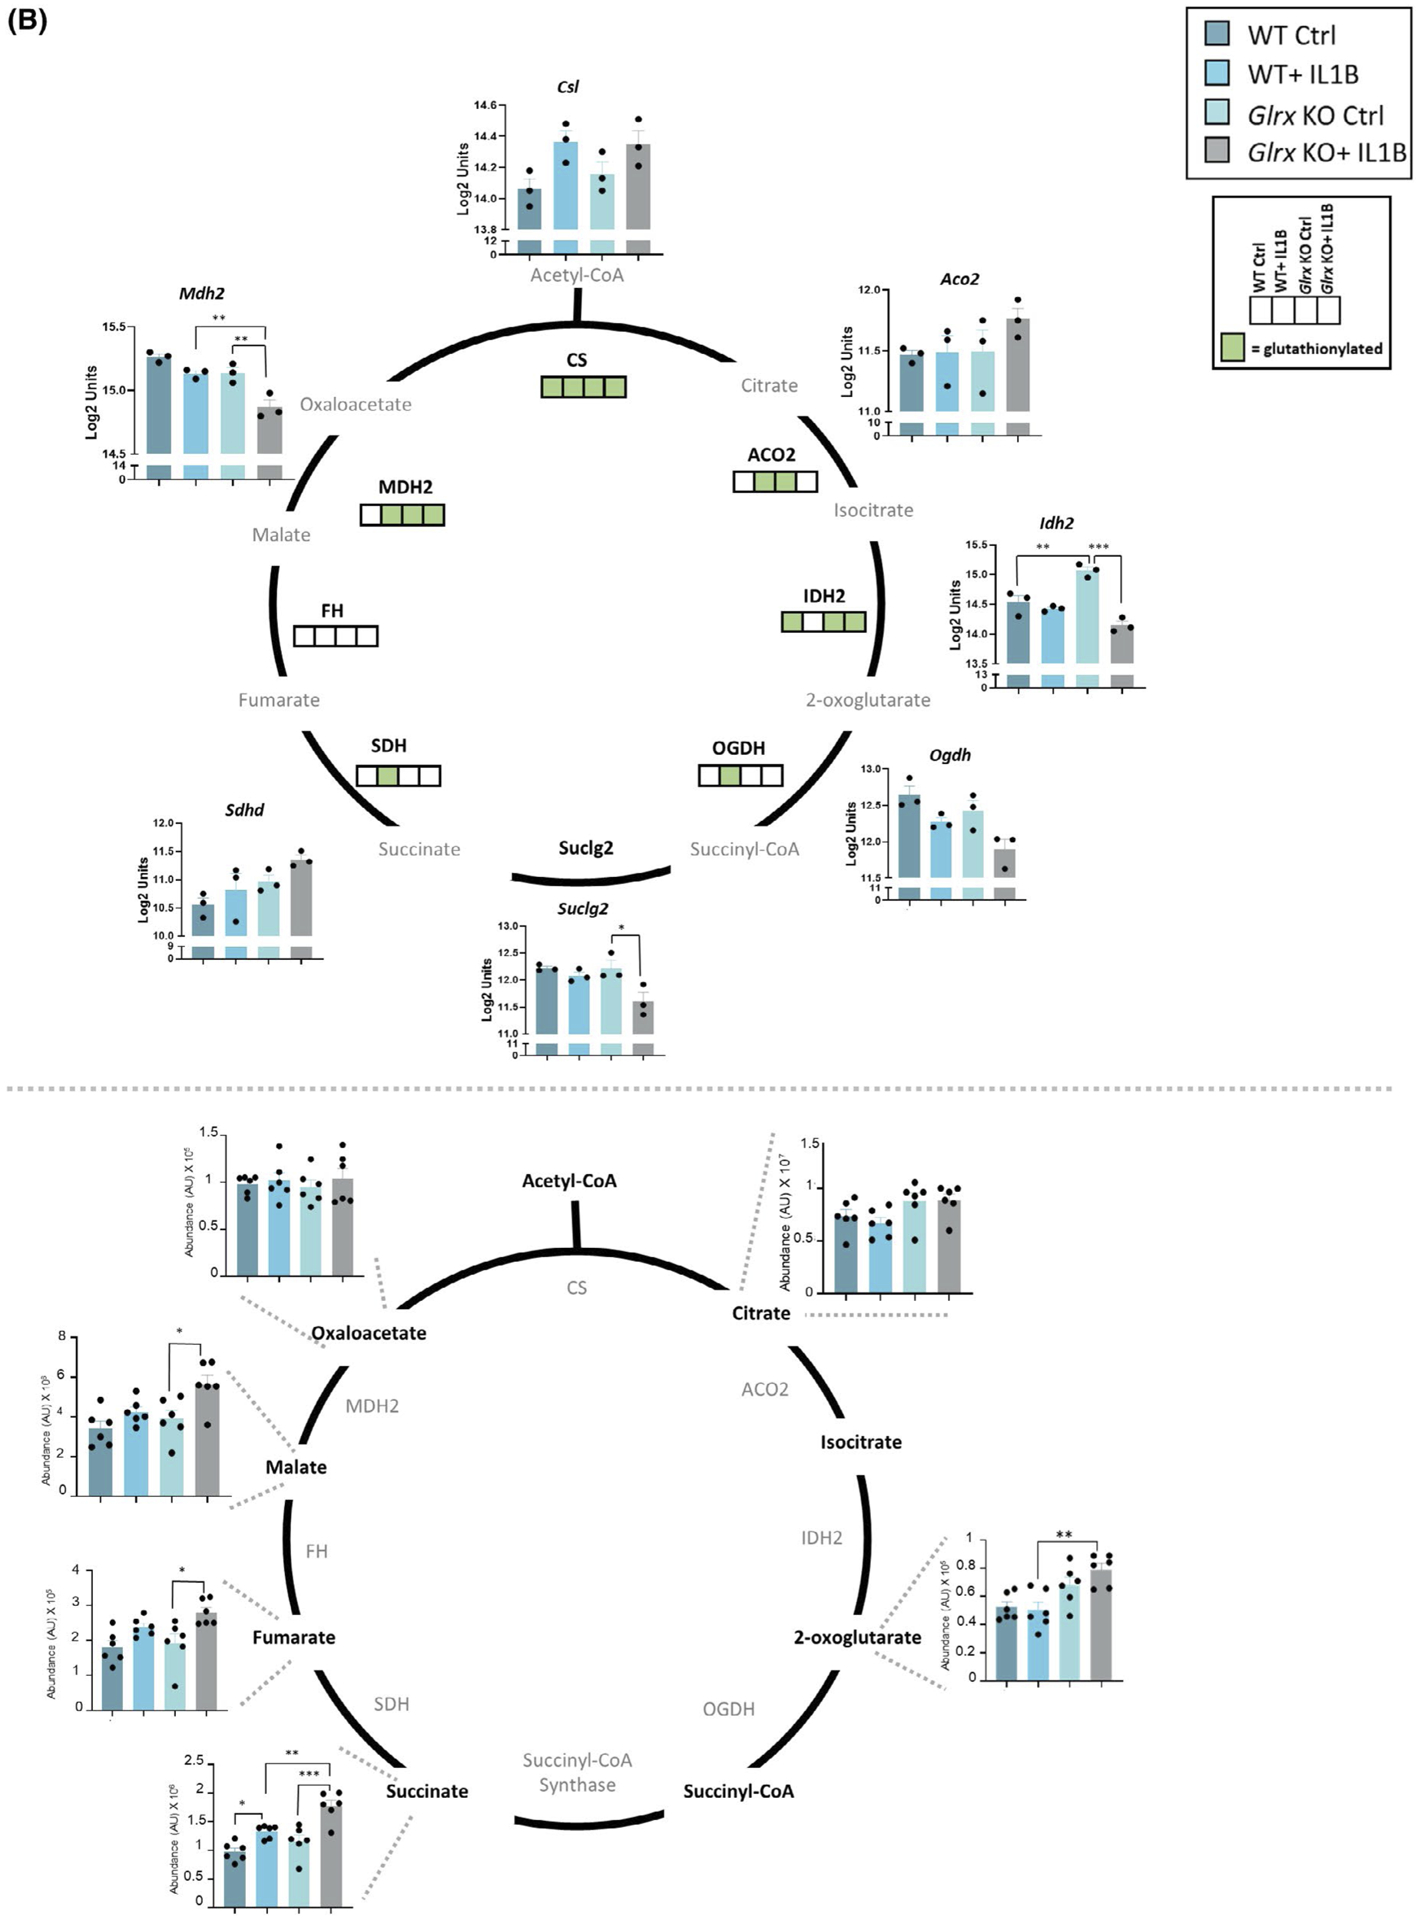
Multi-omics integration of KEGG pathways affected in airway basal cells stimulated with IL1B that are affected by GLRX status. Visualization of hits in the TCA cycle and glycolysis pathway identified in the -omics platforms described in Figures 1–3. A, Glycolysis pathway; right panel shows the total metabolites and left panel shows the microarray gene expression data as well as glutathionylated protein hits in each of the four groups (present; green, absent; white). ## Metabolites measured are hexose-6 phosphate (top) and phosphoglycerate (bottom). Hk1: hexokinase1, Pfk: phosphofructokinase, Aldoa: fructose-bisphosphate aldolase A, Tpi1: triosephosphate isomerase, Pgk1: phosphoglycerate kinase1, Gapdh: glyceraldehyde-3-phosphate dehydrogenase, Pgam1: phosphoglycerate mutase1, Eno1: enolase1, Pkm: pyruvate kinase M, Ldha: lactate dehydrogenase A, HK1: hexokinase1, GPI: glucose-6-phosphate isomerase, PFK: phosphofructokinase, ALDOA: Fructose-bisphosphate aldolase, TPI1: triosephosphate isomerase, GAPDH: glyceraldehyde-3-phosphate dehydrogenase, PGK1: phosphoglycerate kinase1, PGAM1: phosphoglycerate mutase 1, ENO1: alpha-enolase, PKM: pyruvate kinase M, LDHA: L-lactate dehydrogenase A B, TCA cycle; bottom panel shows the total metabolites and top panel shows the microarray gene expression data as well as glutathionylated protein hits in each of the four groups (present; green, absent; white). Csl: citrate synthase, Aco2: aconitate hydratase, mitochondrial, Idh2: isocitrate dehydrogenase, mitochondrial, Ogdh: 2-oxoglutarate dehydrogenase, mitochondrial, Suclg2: succinate coA ligase, subunit G, Sdhd: succinate dehydrogenase, mitochondrial, Mdh2: malate dehydrogenase, mitochondrial. CS: citrate synthase, ACO2: aconitate hydratase, IDH2: isocitrate dehydrogenase, OGDH: 2-oxoglutarate dehydrogenase, SDH: succinate dehydrogenase, FH: fumarate hydratase, MDH2: malate dehydrogenase, mitochondrial. *P < .05, ** P < .01, *** P < .001, **** P < .0001 (ANOVA)
3.5 |. Ablation of Glrx enhances glycolysis in airway epithelial cells and regulates pro-inflammatory signaling induced by IL1B
In order to corroborate that glycolysis was increased in the absence of Glrx, we traced carbons from [U-13C] glucose through glycolysis and TCA cycle. Consistent with unlabeled metabolite analyses, 13C− hexose phosphate and 13C− lactate were increased 24 hours post IL1B, with further increases in 13C− hexosephosphate, 13C− glyceraldehyde-3-phosphate, 13C− pyruvate, and 13C− lactate occurring in Glrx−/− cells stimulated with IL1B (Figure 5A), along with more pronounced increases in lactate detected in the media from Glrx−/− cells detected in parallel experiments not using 13C-glucose (Figure 5B). In addition, 13C− fumarate, 13C− malate, and 13C− succinate were increased in response to IL1B stimulation in WT and/or Glrx−/− cells (Figure 5C). A time course analysis revealed time-dependent changes in labeled metabolites between the groups (Supplementary Figure 5). Collectively these findings demonstrate that carbons derived from glucose enter the glycolysis pathway and are used to fuel the TCA cycle, in response to IL1B and that glucose usage in these pathways is enhanced in the absence of Glrx.
FIGURE 5.
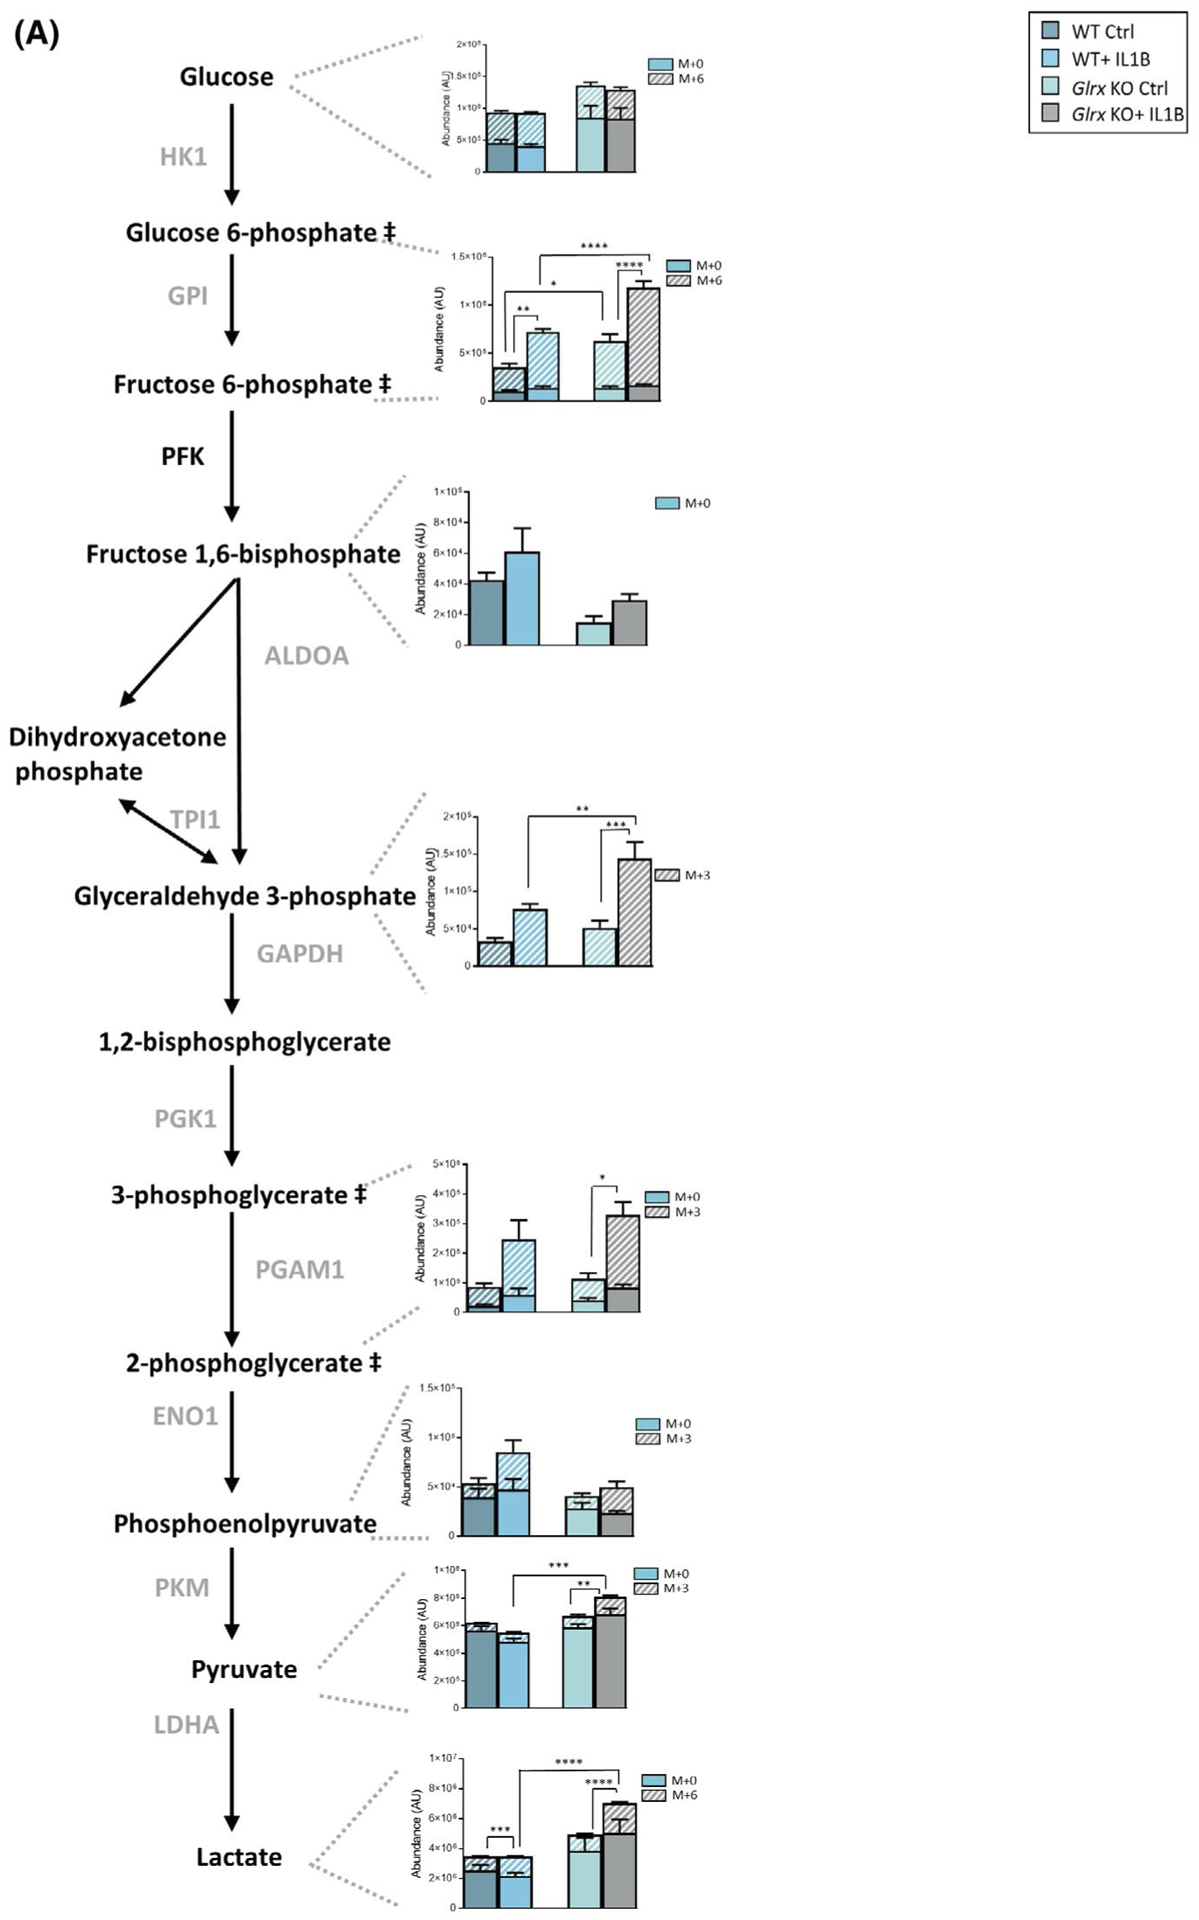
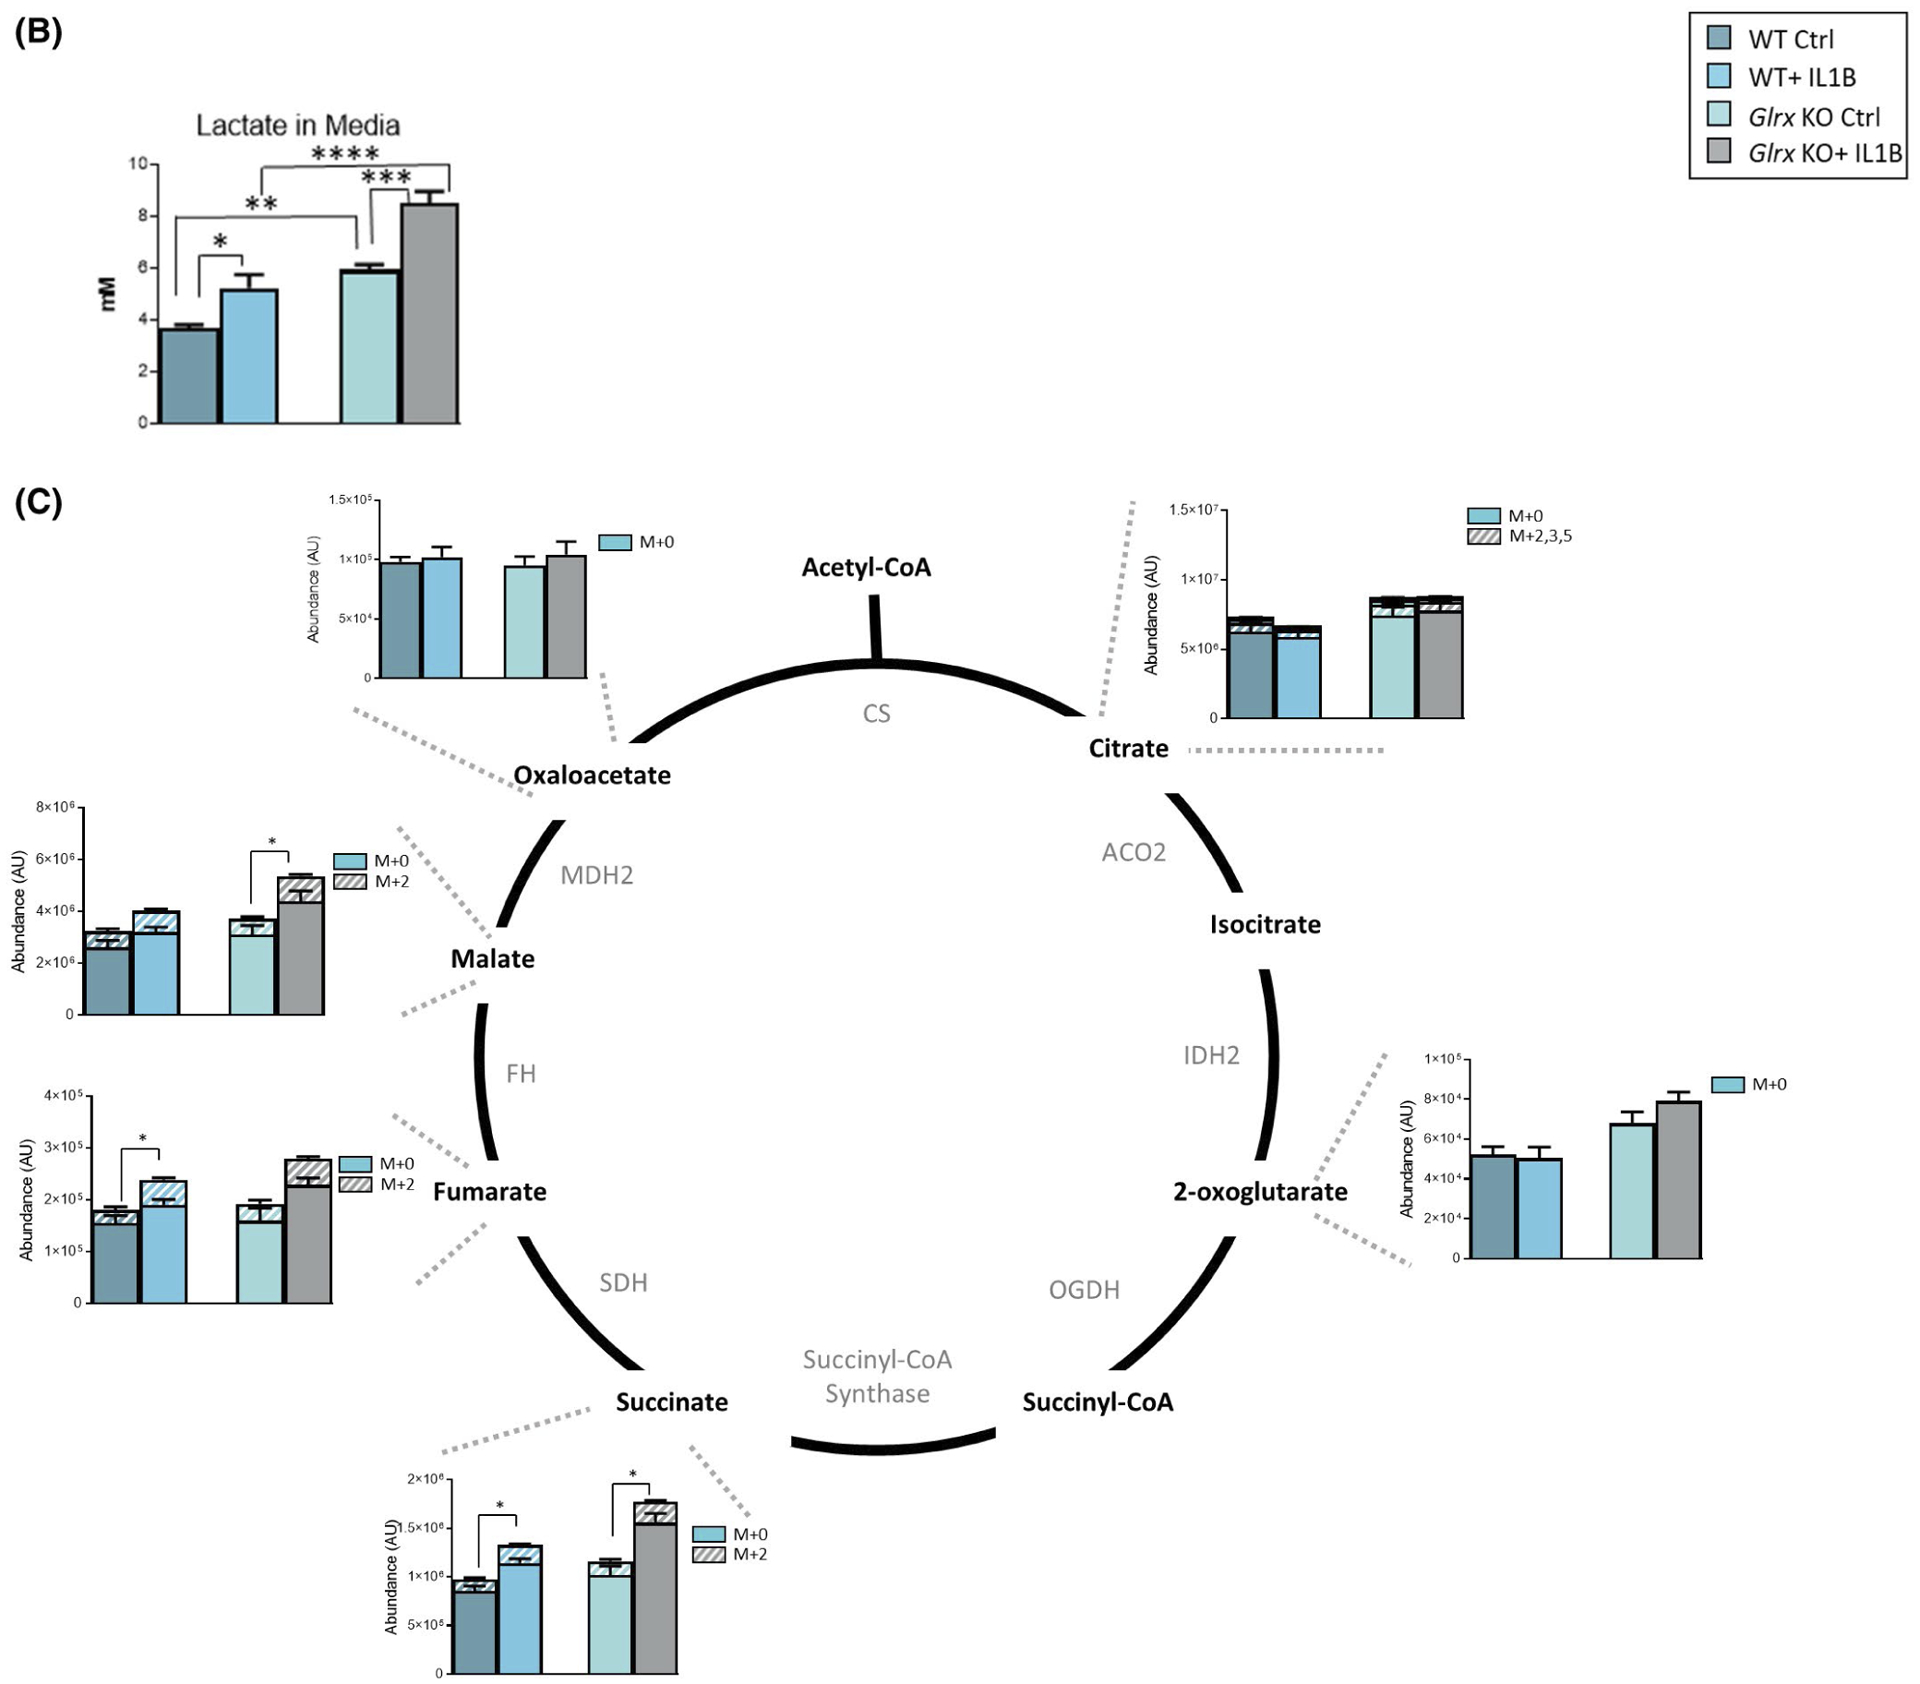
13C-glucose carbon tracing confirms increases in glycolysis in epithelial cells lacking Glrx. A, Schematic for glycolysis pathway highlighting metabolites that are differentially regulated 24 hours poststimulation with IL1B and in airway basal cells lacking Glrx. Heavy metabolites are depicted as + 3 and + 6 and presented with hash marks. Solid color panels represent the unlabeled portion of each metabolite. ## Metabolites measured are hexose-6 phosphate (top) and phosphoglycerate (bottom). B, Levels of secreted lactate (in mM) in cell culture supernatant of airway basal cells. C, Schematic for metabolites in the TCA cycle. Heavy metabolites are depicted as + 2, +3, and + 5 and presented with hash marks. Solid color panels represent the unlabeled portion of each metabolite. Statistics in this figure represent only the heavy portion of the metabolites, with the exception of lactate in panel B. *P < .05, ** P < .01, *** P < .001, **** P < .0001 (ANOVA)
We previously demonstrated that IL1B-induced glycolysis contributes to enhanced expression of select pro-inflammatory genes in epithelial cells notably of thymic stromal lymphopoietin (TSLP) and granulocyte monocyte colony stimulating factor (GM-CSF). Based on the findings that glycolysis is enhanced in the absence of Glrx we next addressed whether gene expression and secretion of these pro-inflammatory mediators were enhanced in the absence of Glrx. Results in Figure 6A, show that IL1B induced increased gene expression of Tslp, Csf2 (encoding GM-CSF), Ccl20, and Cxcl1 (encoding KC), with exacerbated increases of Tslp, Csf2, and Cxcl1 apparent in IL1B-stimulated cells lacking Glrx. In addition, IL1B-mediated secretion of TSLP was higher in Glrx−/− cells compared to WT counterparts along with higher secretion of GM-CSF. In contrast, IL1B-induced CCL20 and KC were similar between WT and Glrx−/− cells (Figure 6B). Administration of 2-deoxyglucose (2-DG), an inhibitor of glycolysis, potently inhibited secretion of TSLP and GM-CSF irrespective of genotype, and also attenuated the release of CCL20 and KC in media (Figure 6B). These findings demonstrate that enhanced glycolysis induced by IL1B in epithelial cells lacking Glrx results in exaggerated expression of TSLP, a mediator of severe inflammation in asthma.36,37
FIGURE 6.
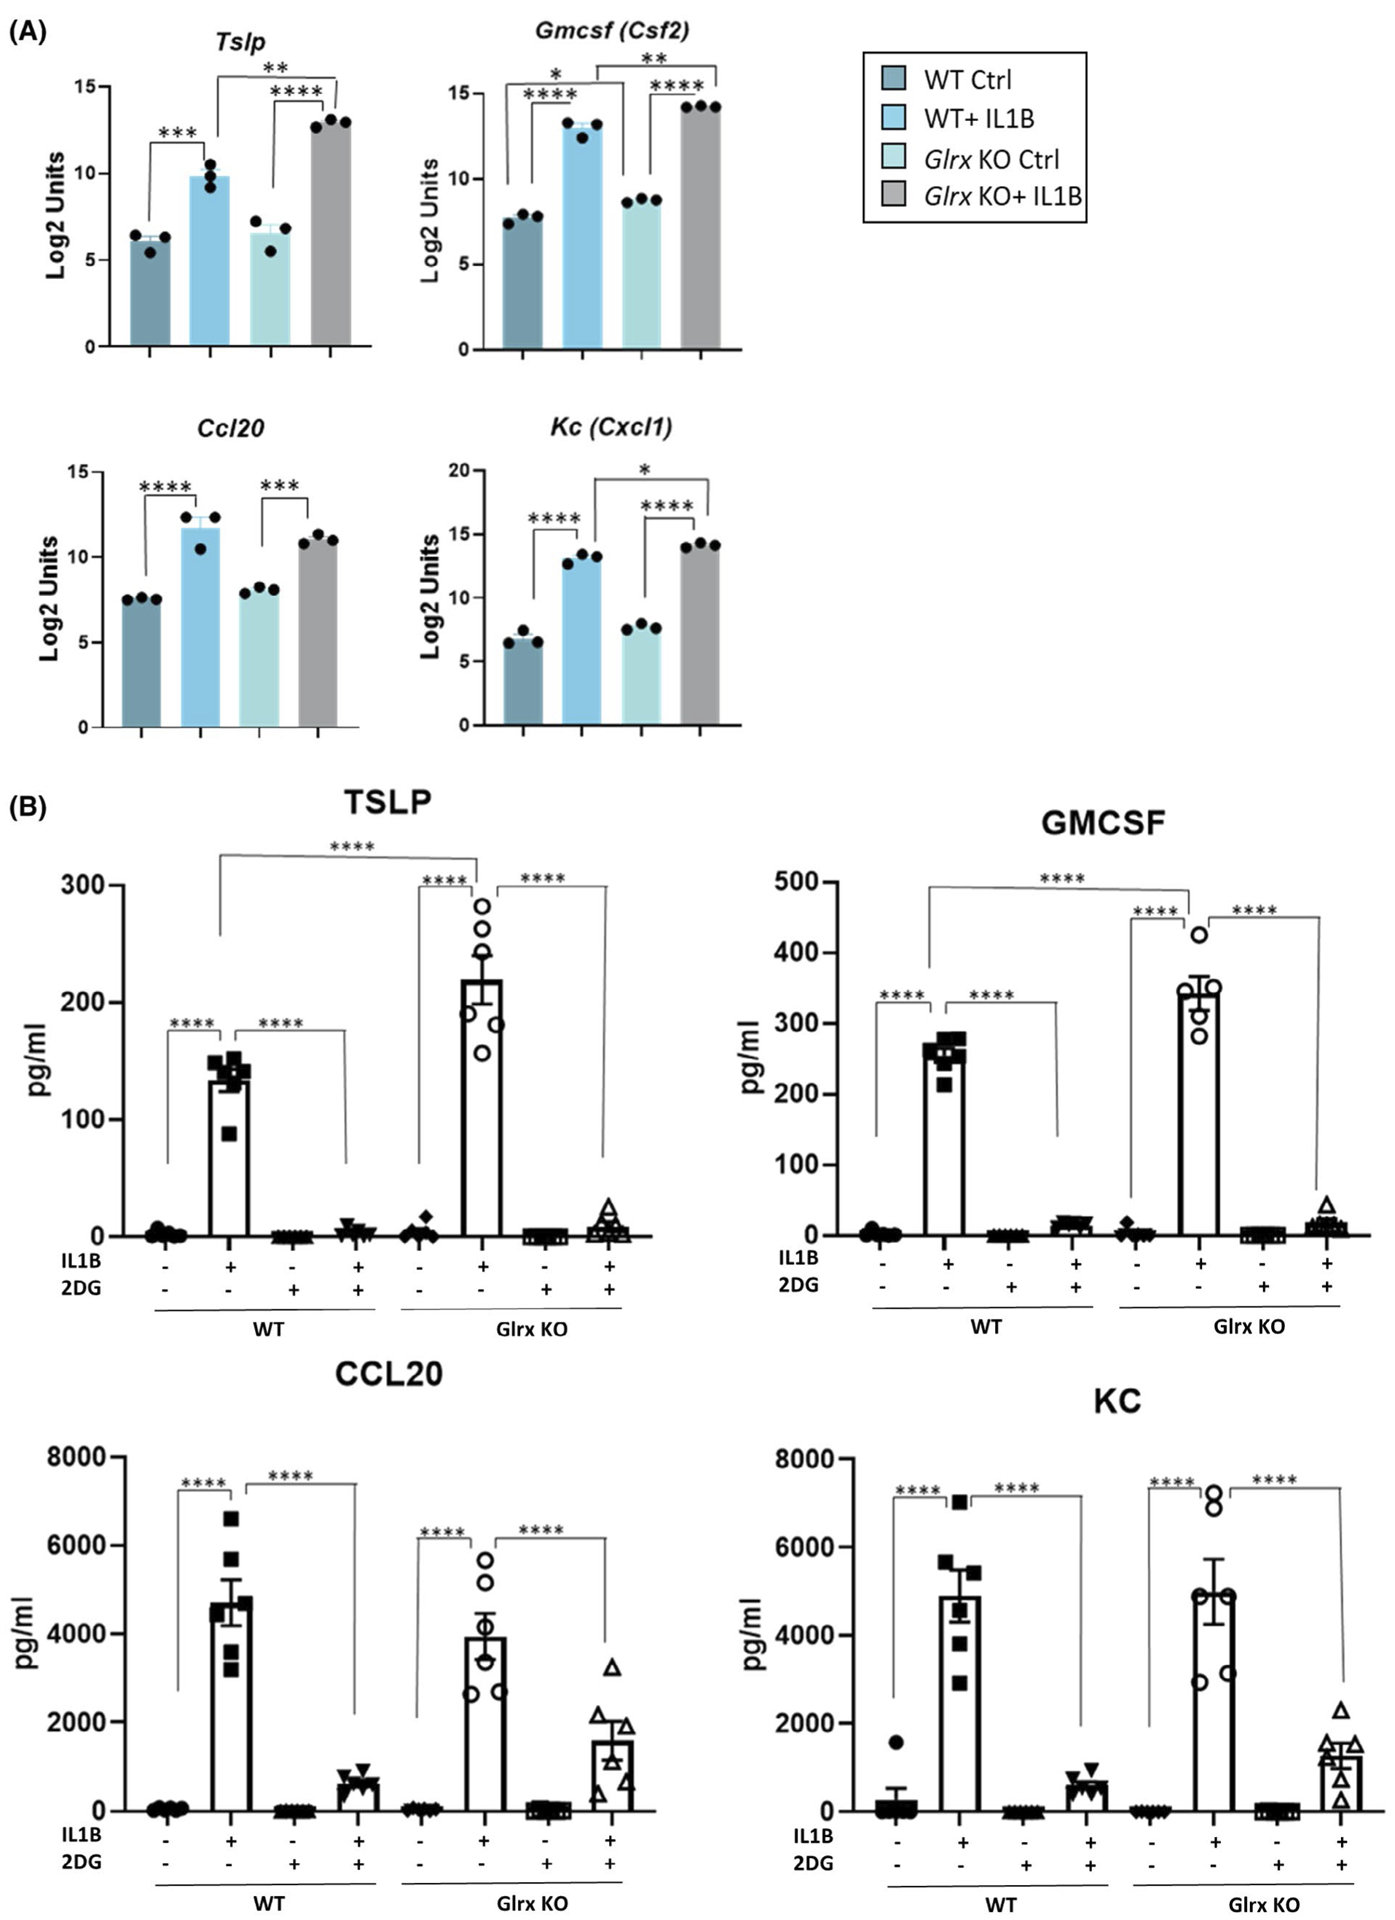
Glutaredoxin absence exacerbates pro-inflammatory signaling induced by IL1B in airway basal cells. A, Gene expression of Tslp, Csf2, Ccl20, and Cxcl1 in WT and Glrx−/− control airway basal cell or 24 hours after stimulation with IL1B. B, Secreted pro-inflammatory cytokines TSLP, GM-CSF, CCL20, and KC levels measured in culture media supernatant 24 hours poststimulation with IL1B. A 10 mM of 2-DG was used for 1 hour before IL1B stimulation
4 |. DISCUSSION
Airway epithelial cells exert critical effector functions and have considerable plasticity, enabling them to respond to inhaled insults via production of cytokines, growth factors, anti-microbials, surfactants, mucins, etc The extent to which changes in metabolism and redox processes affect epithelial effector function remains incompletely described. Herein, we utilize a multi-omics approach involving C13-glucose tracing, targeted metabolomics, DNA array, and redox proteomics following stimulation with the critical innate immune effector, IL1B, to obtain insights into the pathways governing epithelial cell responses. Furthermore, we conducted these experiments in WT versus Glrx−/− epithelial cells in order to address the extent to which these cellular pathways were affected by glutathionylation chemistry. KEGG pathway analyses demonstrate the modulation of multiple pathways between the different treatment groups, with notable changes in the glycolysis and TCA cycle across the different-omics platforms. Our results show that in the absence of Glrx, IL1B-induced glycolysis is enhanced along with increased secretion of the asthma-relevant cytokine, TSLP. These observations are also supported by the identification of a substantial number of glutathionylated protein targets in the glycolysis pathway and TCA cycle and point to a close interplay between glutathionylation chemistry and glucose metabolism.
Links between glutathione, and glycolysis are well recognized in immune cell and cancer biology. Glutathione primes T-cell metabolism and effector function.38,39 Furthermore, in cancer cells, activation of the pentose phosphate pathway increases NADPH and promotes glutathione redox homeostasis to allow tumor cells to survive in oxidative environments. Interestingly, the pyruvate kinase M2 isoform, which is expressed in glycolytically active cells, can be inactivated via oxidation of key cysteines.11 This event is important in activation of the pentose phosphate pathway and control of glutathione-mediated redox balance.11 PKM was one of the glutathionylation targets identified in the present study, suggesting that its glutathionylation may contribute to the enhanced glycolytic reprogramming induced by IL1B or in Glrx−/− cells described herein. A recent study from our laboratories demonstrating that a small molecule activator of PKM2 diminished IL1B-induced lactate and TSLP secretion34 supports a putative scenario wherein glutathionylation of PKM2 is linked to its inactivation and contributes to glycolytic reprogramming and the activation of pro-inflammatory signals.
The findings obtained in epithelial cells that are presented herein are supported by prior studies demonstrating that influenza A virus-infected epithelial cells show activation of numerous metabolic pathways.40 A role for glycolysis in the control of influenza A infection and replication is plausible based on observations that hypoxia-inducible factor 1α (HIF-1α) deficiency in epithelial cells decreased glycolysis and promoted autophagy leading to enhanced influenza A virus replication and acute lung injury.41 Further, HIF-1α-mediated activation of glycolysis in combination with inhibition of prolyl hydroxylases was shown to protect epithelial cells from neutrophil or lipopolysaccharide-induced epithelial cell death and afforded protection from acute lung injury.42 Interestingly, HIF-1α glutathionylation leads to its stabilization.43 Although HIF-1α was not identified in the glutathionylated proteome described herein, future studies will be required to address whether HIF-1α-dependent signals contribute to metabolic reconfiguration in epithelial cells exposed to IL1B. Finally, a role for glycolysis and autophagy in epithelial repair was demonstrated in variant Club cells, an airway epithelial progenitor cell population.6 The authors showed that inhibition of autophagy decreased glucose uptake, and furthermore that glucose deprivation, or glycolysis blockade, decreased the proliferative capacity of these progenitor cells and instead promoted their differentiation into ciliated and secretory cells.6 These observations point to a critical role of the autophagy and glycolysis pathways in controlling the regenerative/differentiation potential of epithelial cells. The present study utilized airway basal progenitor cells, therefore, additional studies will be required to determine how Glrx and protein glutathionylation control epithelial differentiation.
Finally, it is important to highlight a number of caveats to our work. Following methyl methanethiosulfonate (MMTS) blocking of reduced sulfhydryls, we used wild-type murine GLRX as the catalyst for cysteine derivatization enabling deconvolution of the glutathionylated proteome. This approach differs from the protocols using chemical derivatization strategies that are commonly used in redox proteomics studies. Although we revealed numerous protein targets, the specific cysteines that are glutathionylated and their implications for alterations in structure/function will require additional protocol refinement and follow-up mechanistic studies. Those studies will be required in order to unravel the functional implications of key target cysteines in the glycolysis pathway and how their glutathionylation affects glycolytic reprogramming. An alternative explanation for the findings presented herein could be that the observed changes in glycolysis are not due to glutathionylation of a key glycolysis protein target(s), but instead are the result of a compensatory response resulting from the effects of glutathionylation on other cellular processes, such as ER stress or alterations in mitochondrial function. Furthermore, additional analysis also will be necessary to determine whether changes in glutathionylation are linked to changes in overall target protein abundance. Finally, besides its role as a deglutathionylase, murine GLRX is a dithiol oxidoreductase that can reduce disulfides. We therefore can-not rule out that the protein targets revealed by our screen were strictly glutathionylated. However, validation of selected targets in the glycolysis pathway using a glutathione-specific antibody (Figure 1D) support our observations. It also is puzzling that the glutathionylated proteome was not increased in IL1B-stimulated Glrx−/− cells compared to WT counterparts, which contrasts with the overall GSH Western blot shown in Figure 1A. The reason for this discrepancy is not clear and will await further analyses related to the efficiency of the GLRX-mediated derivatization. Finally, the experimental design herein represents a snapshot analysis conducted at one time point that does not give insight into temporal relationships between redox and metabolic states that may fluctuate dynamically following IL1B stimulation.
In summary, using a multi-omics platform, we have demonstrated herein that epithelial cells stimulated with IL1B exhibit substantial changes in cellular metabolism which are accentuated in the absence of Glrx. KEGG pathway analyses highlight target enrichments in the TCA cycle and glycolysis pathway. We also show herein that expression of a key asthma cytokine, TSLP, is enhanced in the absence of Glrx and was abrogated using the glycolysis inhibitor 2-DG. Collectively, these observations point to an intricate relationship between glutathionylation chemistry and metabolic alterations within epithelial cells, findings that offer a rationale for utilizing the GLRX/glutathionylation axis to target metabolic reconfiguration for therapeutic purposes.
Supplementary Material
ACKNOWLEDGMENTS
This work was supported by grants NIH R35HL135828 (Y-JH), NIH R01HL137268, R01HL085646, R01HL138708, R21AG055325 (AvdV), NIH T32HL076122 (AM), NIH R01HL122383, R01HL141364, and RO1HL136917 (VA). The VGN Proteomics Facility at the University of Vermont is funded by the Vermont Biomedical research Network (NIH NIGMS INBRE: P20GM103449).
Funding information
National Institutes of Health, Grant/Award Number: R35HL135828, R01HL137268, R01HL085646, R01HL138708, R21AG055325, T32HL076122 and R01HL122383; National Institute of General Medical Sciences (NIGMS), Grant/Award Number: P20GM103449
Abbreviations:
- 2-DG
2-deoxy-D-glucose
- ACO2
aconitate hydratase
- ALDOA
fructose-bisphosphate aldolase
- CCL20
Chemokine (C-C-motif) ligand 20
- CS
citrate synthase
- ENO1
alpha-enolase
- FH
fumarate hydratase
- GAPDH
glyceraldehyde-3-phosphate dehydrogenase
- GLRX
glutaredoxin-1
- GLRX KO
glutaredoxin knockout cells
- GM-CSF
granulocyte macrophage colony stimulating factor
- GPI
glucose-6-phosphate isomerase
- GSH
glutathione
- HIF
hypoxia-inducible factor
- HK1
hexokinase1
- IDH2
isocitrate dehydrogenase
- IL-1
interleukin-1
- KC
Chemokine (C-X-C) motif ligand 1
- KEGG
kyoto encyclopedia of genes and genomes
- LDHA
L-lactate dehydrogenase A
- MDH2
malate dehydrogenase, mitochondrial
- MMTS
methyl methanethiosulfonate
- MTE cells
mouse tracheal epithelial cells
- OGDH
2-oxoglutarate dehydrogenase
- PFK
phosphofructokinase
- PFKFB3
6-phosphofructo-2-kinase/fructose-2,6-bisphosphatase 3
- PKM
Pyruvate kinase M
- PGAM1
phosphoglycerate mutase 1
- PGK1
phosphoglycerate kinase1
- SDH
succinate dehydrogenase
- TSLP
thymic stromal lymphopoietin
- TPI1
triosephosphate isomerase
- WT Ctrl
wild-type control cells
Footnotes
CONFLICT OF INTEREST
Yvonne Janssen-Heininger and Vikas Anathy hold patents: United States Patent No. 8,679,811, “Treatments Involving Glutaredoxins and Similar Agents” (YJ-H, VA), United States Patent No. 8,877,447, “Detection of Glutathionylated Proteins” (YJ-H), United States Patent, 9,907,828, “Treatments of oxidative stress conditions” (YJ-H, VA). Yvonne Janssen-Heininger and Vikas Anathy have received consulting fees from Celdara Medical LLC for their contributions to the proposed commercialization of glutaredoxin for the treatment of pulmonary fibrosis.
SUPPORTING INFORMATION
Additional Supporting Information may be found online in the Supporting Information section.
REFERENCES
- 1.DeBerardinis RJ, Chandel NS. Fundamentals of cancer metabolism. Sci Adv. 2016;2(5):e1600200. [DOI] [PMC free article] [PubMed] [Google Scholar]
- 2.Everts B, Amiel E, Huang S-C, et al. TLR-driven early glycolytic reprogramming via the kinases TBK1-IKKɛ supports the anabolic demands of dendritic cell activation. Nat Immunol. 2014;15(4):323–332. [DOI] [PMC free article] [PubMed] [Google Scholar]
- 3.O’Neill LA, Pearce EJ. Immunometabolism governs dendritic cell and macrophage function. J Exp Med. 2016;213(1):15–23. [DOI] [PMC free article] [PubMed] [Google Scholar]
- 4.Tannahill GM, Curtis AM, Adamik J, et al. Succinate is an inflammatory signal that induces IL-1β through HIF-1α. Nature. 2013;496(7444):238–242. [DOI] [PMC free article] [PubMed] [Google Scholar]
- 5.Angiari S, Runtsch MC, Sutton CE, et al. Pharmacological activation of pyruvate kinase M2 inhibits CD4(+) T cell pathogenicity and suppresses autoimmunity. Cell Metab. 2020;31(2):391–405.e8. [DOI] [PMC free article] [PubMed] [Google Scholar]
- 6.Davies DE. Epithelial barrier function and immunity in asthma. Ann Am Thorac Soc. 2014;11(Suppl 5):S244–S251. [DOI] [PubMed] [Google Scholar]
- 7.Hartl D, Tirouvanziam R, Laval J, et al. Innate immunity of the lung: from basic mechanisms to translational medicine. J Innate Immun. 2018;10(5–6):487–501. [DOI] [PMC free article] [PubMed] [Google Scholar]
- 8.Qian XI, Aboushousha R, van de Wetering C, et al. IL-1/inhibitory κB kinase ε-induced glycolysis augment epithelial effector function and promote allergic airways disease. J Allergy Clin Immunol. 2018;142(2):435–450.e10. [DOI] [PMC free article] [PubMed] [Google Scholar]
- 9.Li K, Li M, Li W, et al. Airway epithelial regeneration requires autophagy and glucose metabolism. Cell Death Dis. 2019;10(12):875. [DOI] [PMC free article] [PubMed] [Google Scholar]
- 10.Harris I, Treloar A, Inoue S, et al. Glutathione and thioredoxin antioxidant pathways synergize to drive cancer initiation and progression. Cancer Cell. 2015;27(2):211–222. [DOI] [PubMed] [Google Scholar]
- 11.Anastasiou D, Poulogiannis G, Asara JM, et al. Inhibition of pyruvate kinase M2 by reactive oxygen species contributes to cellular antioxidant responses. Science. 2011;334(6060):1278–1283. [DOI] [PMC free article] [PubMed] [Google Scholar]
- 12.Mohr S, Stamler JS, Brüne B. Posttranslational modification of glyceraldehyde-3-phosphate dehydrogenase by S-nitrosylation and subsequent NADH attachment. J Biol Chem. 1996;271(8):4209–4214. [DOI] [PubMed] [Google Scholar]
- 13.Reisz JA, Wither MJ, Dzieciatkowska M, et al. Oxidative modifications of glyceraldehyde 3-phosphate dehydrogenase regulate metabolic reprogramming of stored red blood cells. Blood. 2016;128(12):e32–e42. [DOI] [PubMed] [Google Scholar]
- 14.Seo M, Lee YH. PFKFB3 regulates oxidative stress homeostasis via its S-glutathionylation in cancer. J Mol Biol. 2014;426(4):830–842. [DOI] [PMC free article] [PubMed] [Google Scholar]
- 15.Zaffagnini M, Michelet L, Sciabolini C, et al. High-resolution crystal structure and redox properties of chloroplastic triosephosphate isomerase from Chlamydomonas reinhardtii. Mol Plant. 2014;7(1):101–120. [DOI] [PubMed] [Google Scholar]
- 16.Fratelli M, Demol H, Puype M, et al. Identification by redox proteomics of glutathionylated proteins in oxidatively stressed human T lymphocytes. Proc Natl Acad Sci USA. 2002;99(6):3505–3510. [DOI] [PMC free article] [PubMed] [Google Scholar]
- 17.Sies H, Jones DP. Reactive oxygen species (ROS) as pleiotropic physiological signalling agents. Nat Rev Mol Cell Biol. 2020;21(7):363–383. [DOI] [PubMed] [Google Scholar]
- 18.Janssen-Heininger Y, Reynaert NL, van der Vliet A, Anathy V. Endoplasmic reticulum stress and glutathione therapeutics in chronic lung diseases. Redox Biol. 2020;33:101516. [DOI] [PMC free article] [PubMed] [Google Scholar]
- 19.Chia SB, Elko EA, Aboushousha R, et al. Dysregulation of the glutaredoxin/S-glutathionylation redox axis in lung diseases. Am J Physiol Cell Physiol. 2020;318(2):C304–C327. [DOI] [PMC free article] [PubMed] [Google Scholar]
- 20.Li Q, Harraz MM, Zhou W, et al. Nox2 and Rac1 regulate H2O2-dependent recruitment of TRAF6 to endosomal interleukin-1 receptor complexes. Mol Cell Biol. 2006;26(1):140–154. [DOI] [PMC free article] [PubMed] [Google Scholar]
- 21.Oakley FD, Smith RL, Engelhardt JF. Lipid rafts and caveolin-1 coordinate interleukin-1beta (IL-1beta)-dependent activation of NFkappaB by controlling endocytosis of Nox2 and IL-1beta receptor 1 from the plasma membrane. J Biol Chem. 2009;284(48):33255–33264. [DOI] [PMC free article] [PubMed] [Google Scholar]
- 22.Wu R, Smith D. Continuous multiplication of rabbit tracheal epithelial cells in a defined, hormone-supplemented medium. In Vitro. 1982;18(9):800–812. [DOI] [PubMed] [Google Scholar]
- 23.Alcorn JF, Guala AS, van der Velden J, et al. Jun N-terminal kinase 1 regulates epithelial-to-mesenchymal transition induced by TGF-beta1. J Cell Sci. 2008;121(Pt 7):1036–1045. [DOI] [PMC free article] [PubMed] [Google Scholar]
- 24.Nemkov T, D’Alessandro A, Hansen KC. Three-minute method for amino acid analysis by UHPLC and high-resolution quadrupole orbitrap mass spectrometry. Amino Acids. 2015;47(11):2345–2357. [DOI] [PMC free article] [PubMed] [Google Scholar]
- 25.Nemkov T, Reisz JA, Gehrke S, Hansen KC, D’Alessandro A. High-throughput metabolomics: isocratic and gradient mass spectrometry-based methods. Methods Mol Biol. 2019;1978:13–26. [DOI] [PubMed] [Google Scholar]
- 26.Gehrke S, Rice S, Stefanoni D, et al. Red Blood cell metabolic responses to torpor and arousal in the hibernator arctic ground squirrel. J Proteome Res. 2019;18(4):1827–1841. [DOI] [PMC free article] [PubMed] [Google Scholar]
- 27.Nemkov T, Hansen KC, D’Alessandro A. A three-minute method for high-throughput quantitative metabolomics and quantitative tracing experiments of central carbon and nitrogen pathways. Rapid Commun Mass Spectrom. 2017;31(8):663–673. [DOI] [PMC free article] [PubMed] [Google Scholar]
- 28.r-project. R: A Language and Environment for Statistical Computing. 2020. June 22. Available from: https://www.r-project.org/. Accessed 25 June, 2020.
- 29.Gu Z, Eils R, Schlesner M. Complex heatmaps reveal patterns and correlations in multidimensional genomic data. Bioinformatics. 2016;32(18):2847–2849. [DOI] [PubMed] [Google Scholar]
- 30.Huber W, Carey VJ, Gentleman R, et al. Orchestrating high-throughput genomic analysis with bioconductor. Nat Methods. 2015;12(2):115–121. [DOI] [PMC free article] [PubMed] [Google Scholar]
- 31.MacDonald JW. affycoretools: Functions Useful for those doing Repetitive Analyses with Affymetrix GeneChips. 2020. September 29. Available from: https://www.bioconductor.org/packages/release/bioc/html/affycoretools.html.
- 32.Ritchie ME, Phipson B, Wu DI, et al. limma powers differential expression analyses for RNA-sequencing and microarray studies. Nucleic Acids Res. 2015;43(7):e47. [DOI] [PMC free article] [PubMed] [Google Scholar]
- 33.Anathy V, Lahue KG, Chapman DG, et al. Reducing protein oxidation reverses lung fibrosis. Nat Med. 2018;24(8):1128–1135. [DOI] [PMC free article] [PubMed] [Google Scholar]
- 34.van de Wetering C, Aboushousha R, Manuel AM, et al. Pyruvate kinase M2 promotes expression of proinflammatory mediators in house dust mite-induced allergic airways disease. J Immunol. 2020;204(4):763–774. [DOI] [PMC free article] [PubMed] [Google Scholar]
- 35.Kanehisa M, Goto S. KEGG: kyoto encyclopedia of genes and genomes. Nucleic Acids Res. 2000;28(1):27–30. [DOI] [PMC free article] [PubMed] [Google Scholar]
- 36.Gauvreau GM, O’Byrne PM, Boulet L-P, et al. Effects of an anti-TSLP antibody on allergen-induced asthmatic responses. N Engl J Med. 2014;370(22):2102–2110. [DOI] [PubMed] [Google Scholar]
- 37.Corren J, Parnes JR, Wang L, et al. Tezepelumab in Adults With Uncontrolled Asthma. N Engl J Med. 2017;377(10):936–946. [DOI] [PubMed] [Google Scholar]
- 38.Mak TW, Grusdat M, Duncan GS, et al. Glutathione primes T cell metabolism for inflammation. Immunity. 2017;46(4):675–689. [DOI] [PubMed] [Google Scholar]
- 39.Kurniawan H, Franchina DG, Guerra L, et al. Glutathione restricts serine metabolism to preserve regulatory T cell function. Cell Metab. 2020;31(5):920–936.e7. [DOI] [PMC free article] [PubMed] [Google Scholar]
- 40.Tian X, Zhang K, Min J, et al. Metabolomic analysis of influenza A virus A/WSN/1933 (H1N1) infected A549 cells during first cycle of viral replication. Viruses. 2019;11(11):1007. [DOI] [PMC free article] [PubMed] [Google Scholar]
- 41.Zhao C, Chen J, Cheng L, et al. Deficiency of HIF-1α enhances influenza A virus replication by promoting autophagy in alveolar type II epithelial cells. Emerg Microbes Infect. 2020;9(1):691–706. [DOI] [PMC free article] [PubMed] [Google Scholar]
- 42.Tojo K, Tamada N, Nagamine Y, et al. Enhancement of glycolysis by inhibition of oxygen-sensing prolyl hydroxylases protects alveolar epithelial cells from acute lung injury. FASEB J. 2018;32(4):2258–2268. [DOI] [PubMed] [Google Scholar]
- 43.Watanabe Y, Murdoch CE, Sano S, et al. Glutathione adducts induced by ischemia and deletion of glutaredoxin-1 stabilize HIF-1α and improve limb revascularization. Proc Natl Acad Sci USA. 2016;113(21):6011–6016. [DOI] [PMC free article] [PubMed] [Google Scholar]
Associated Data
This section collects any data citations, data availability statements, or supplementary materials included in this article.


