Abstract
Electromagnetic tracking is a safe, reliable, and cost-effective method to track medical instruments in image-guided surgical navigation. However, patient motion and magnetic field distortions heavily impact the accuracy of tracked position and orientation. The use of redundant magnetic sensors can help to map and mitigate for patient movements and magnetic field distortions within the tracking region. We propose a planar inductive sensor design, printed on PCB and embedded into medical patches. The main advantage is the high repeatability and the cost benefit of using mass PCB manufacturing processes. The article presents new operative formulas for electromagnetic tracking of planar coils on the centimetre scale. The full magnetic analytical model is based on the mutual inductance between coils which can be approximated as being composed by straight conductive filaments. The full model is used to perform accurate system simulations and to assess the accuracy of faster simplified magnetic models, which are necessary to achieve real-time tracking in medical applications.
Keywords: electromagnetic tracking, registration, image-guided surgery, inductive sensor, mutual inductance
1. Introduction
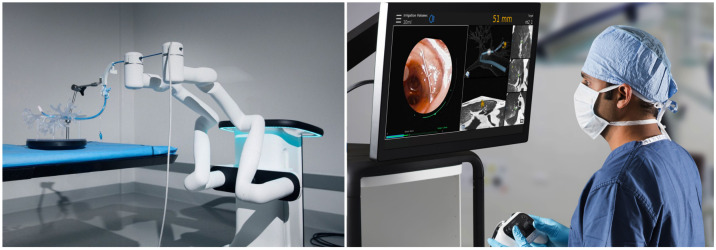
Electromagnetic Tracking (EMT) is the gold standard technology for image-guided surgical interventions (Figure 1) without line of sight [1]. Existing applications include bronchoscopy [2], urology [3], orthopaedic surgery [4], catheter navigation [5,6].
Figure 1.
The Monarch robotic endoscopy platform (Auris Health Inc., Redwood City, CA, USA), as an example of image-guided surgery device.
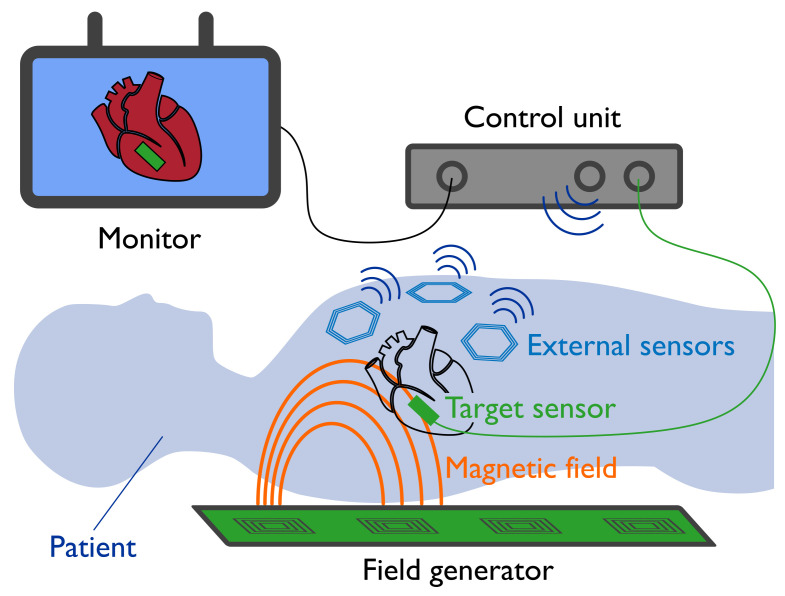
The working principle behind EMT systems is detailed in Figure 2. Position and orientation information is based on the coupling between a field generator and a magnetic sensor. The magnetic model is the function that maps the position and orientation of the target sensor to the magnetic field measured at that location. The comparison between the model and the field measurement allows one to reverse the map and find the sensor pose in the working space. EMT system update-rate and latency directly depend on the model accuracy and calculation speed. Field generators are appositely shaped to generate a field that can be easily modelled (i.e., magnetic dipole [7,8,9], current sheets [10] or current filaments [11,12]). When an analytic model is not available, due to the shape of the transmitter coils or due to the presence of static field distortions, data-driven models are used which approximate the field values through Look-up Tables [13,14,15], Neural Networks [16,17,18] or multi-variable function interpolation [19,20,21].
Figure 2.
In electromagnetic tracking, a target sensor, attached to the instrument tip, measures the magnetic field generated by a set of transmitter coils. The signal is analysed by a control unit, which recovers sensor position and orientation from a known magnetic field model. The instrument is then visualised on an external monitor to assist the surgical operation. The use of external redundant sensors can help compensate for patient motion and magnetic field distortions.
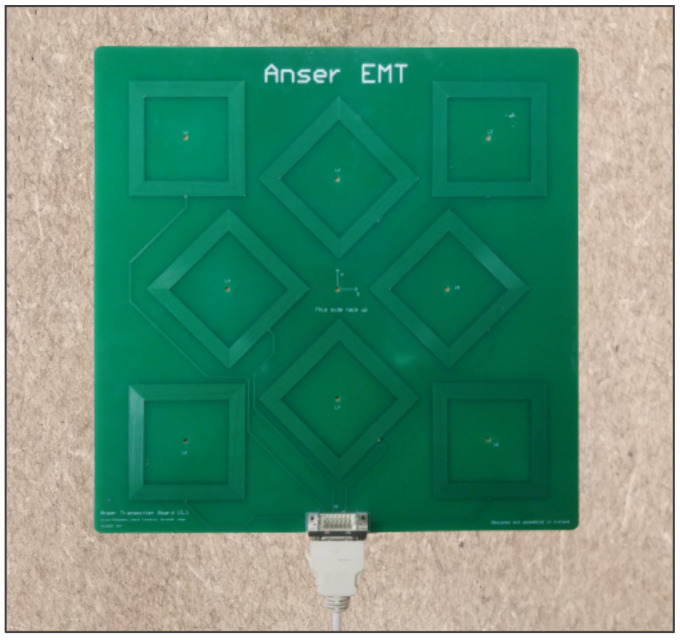
This work focuses on the tracking of large inductive sensors on the centimetre scale. The field generator comprises a set of eight coils, as first presented in [12]. The transmitter coils are composed of straight filaments and embedded in a printed circuit board (PCB). Each coil is driven with a sinusoidal current at a different frequency. The pick-up coil measures a superposition the eight magnetic fields, and frequency-division multiplexing (FDM) is used to distinguish the eight signals. Based on this information, the five degrees of freedom (DoF) of the sensor coil are derived. Full system details can be found on the online project repository [22].
Planar coils integrated into patches and applied on the body of the patient, as shown in Figure 2, can improve the robustness of EMT for image-guided interventions. For example, a set of sensors placed around the operative region can track and compensate for respiratory or cardiac movements [23], or they can evaluate the field at multiple locations and perform the real-time compensation of field distortions by dynamically correcting the field model. Another possible application of the methods presented in this article involves the tracking of the planar transmitter coils of one or more field generators [24,25]. In this scenario, the reciprocal position between two boards can be determined by tracking the position of the coils of one board with respect to the other. This allows one to freely place two boards and enlarge the tracking region, with the ability to automatically determine the new position.
Inductive sensors measure the variation of the magnetic flux across the sensor area. While small-diameter sensors can be approximated with a single point without accuracy loss [26], larger-diameter sensors require the evaluation of the field at more points within the sensor area [27], in order to numerically integrate the magnetic flux measured by the sensor. The more accuracy that is required, the more points may be considered, resulting in a slower tracking algorithm.
A novel method is proposed which makes the flux calculation faster by the use of magnetic vector potential integration along the perimeter of the sensor coil.
The model is then compared to the single-point approximation, in terms of speed and accuracy. This work demonstrates the first EMT method based on the mutual coupling between straight-filaments, suited to large-area sensor coils.
2. Mutual Inductance between Large-Area Planar Coils
The mutual inductance between two coils is defined by the magnetic flux generated by one coil—which can be considered the transmitter coil —that is linked to the loop of the second coil—or receiver coil —per unit current (Equation (1)). In terms of magnetic vector potential, , the mutual inductance, , is also given by Equation (2), where and are the unit vectors perpendicular to the surface and tangential to the loop respectively, and r is the position where or are evaluated:
| (1) |
| (2) |
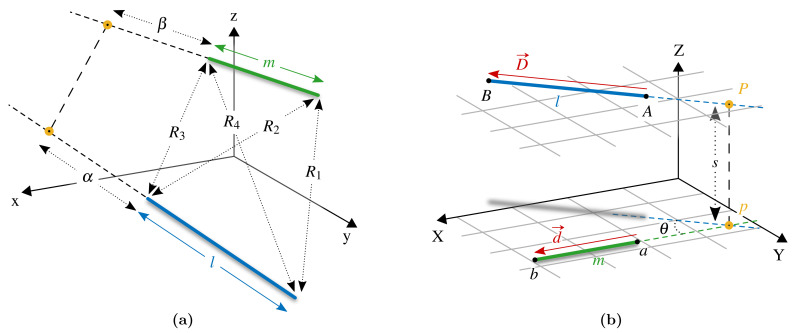
The two approaches are illustrated in Figure 3.
Figure 3.
The mutual inductance between coil and coil can be (a) calculated from Equation (1) and numerically approximated by evaluation of the magnetic field generated by across the area of or (b) analytically calculated from Equation (2) as the sum of the partial mutual inductances between the straight filaments of the two coils.
Magnetic sensors used in EMT systems are usually of tiny dimensions, less than 1 in diameter [28], which allows one to approximate the of Equation (1) by a single point.
For the tracking of larger-area inductive sensors, such as those studied in this work, the field may be evaluated at multiple points within the cross-sectional area of the sensor coil in order to perform a numerical integration, as depicted in Figure 3a. The number of evaluation points needed to achieve a given accuracy scales quadratically with the diameter of the receiving coil.
In this case, it becomes numerically more convenient to use Equation (2), where the integral is performed around the sensor loop and the number of segments that approximate the perimeter increases linearly with the diameter, as depicted in Figure 3b.
Expressing the Biot–Savart law in terms of magnetic vector potential [29,30], Equation (2) becomes:
| (3) |
which is referred as the Neumann integral [31,32].
If both and are composed of straight filaments, the double integral of Equation (3) can be split into the contributions given by all couples of two filaments [33]:
| (4) |
where is defined as the partial mutual inductance between filament i of coil and filament j of coil , as shown in Figure 3b, and will be analytically evaluated in Section 2.1.
2.1. Partial Mutual Inductance between Straight Wires at Any Angle
The Neumann integral (Equation (3)) performed between two straight filaments provides the partial mutual inductance between the filaments and can be solved analytically [34,35,36]. Analytical solutions presented in this article represent an improvement, in terms of accuracy and speed, over past works which used numerical integration [11,37].
In accordance to Figure 4, the following notation is defined. Points A and B are the three-dimensional vectors of the start and end points of the transmitting filament , respectively. It will be clear in Section 2.2 that A and B could be matrices of n transmitting vectors, such as the filaments composing a coil or a set of coils, allowing for fast vectorial implementation. Analogously, the receiving filament is defined by points a and b. The distances between the end-points of segments and are , , , , as indicated in Figure 4a.
Figure 4.
(a) Two straight filaments at any angle. For convenience, l is considered the transmitting filament which generates a magnetic field, m is the receiving filament, where a voltage is induced by the variable field. (b) A change in coordinates is performed in order to calculate the mutual inductance between the two wires.
Two direction vectors are found:
| (5) |
The lengths of the two filaments are and .
For any two straight lines in the space, two planes exist which are parallel and contain these lines. The distance between the planes, s, corresponds to the minimum distance between the straight lines. The position of minimal distance is identified by point P. When projecting the filaments on the same parallel plane, the angle between the projections is .
The quantities and are the lengths of the prolongations of the filaments to the intersection point of minimal distance P, as indicated in Figure 4b.
Equation (6) gives the mutual inductance between two filamentary wires at any angle and not on the same plane [35,36]. The quantity has the dimension of a solid angle and is given by Equation (7).
| (6) |
| (7) |
In order to generalise Equation (6), and may be defined with a positive sign if the prolongation towards point P is directed as the filament, negative otherwise [38].
2.2. Novel Implementation of the Formula
In this section, a new way to implement formula Equation (6) is described which considers the coordinates of the end-points of the filaments. The procedure is neat and it is well suited to vectorial input for the simultaneous calculation of the partial mutual inductances between one filament and many others.
As depicted in Figure 4, a change in coordinates is performed, to a reference system where the quantities required by Equations (6) and (7) can be easily computed. The new X-axis is defined to be aligned to the receiving filament. The unit direction vector is identified by , following normalisation:
| (8) |
Axis Z is chosen to be perpendicular to both the filaments, i.e., perpendicular to the uniquely identified parallel planes containing the filaments, and axis Y is consequently found to complete the triplet:
| (9) |
It should be noted that and change for each transmitting filament and are matrices if multiple transmitting filaments are considered at the same time. Vectorisation is still possible for Equation (9) if the three vector components are computed by separate equations. The change in coordinates of the quantities of Figure 4 is performed by dot product with the new directions, e.g., for point , the new component is found as:
| (10) |
In the new reference system XYZ, the distance between the straight lines is given by the Z-components:
| (11) |
The sine and cosine of the angle are:
| (12) |
Considering X and Y components only, the straight lines lay on the same plane and point P is their intersection:
| (13) |
Finally, and , defined with a sign, as in [38], are:
| (14) |
3. Sensor Manufacturing
In order to experimentally validate the formula proposed in this article, Section 2.2, a set of planar coils were manufactured on PCB. This section details the sensor coil design optimisation and the resulting sensor parameters.
3.1. Planar Sensor Coil Design
Two parameters are of primary importance for a coil used as an inductive sensor: the sensitivity (or sensor gain) and the Signal-to-Noise Ratio (SNR). Another important parameter is the frequency of resonance, related to the parasitic capacitance between the winding turns.
Sensor sensitivity is proportional to the total area enclosed by every turn of the coil. Sources of noise are thermal noise and the noise added by the signal amplifier. In particular, thermal noise is a function of the coil resistance, which is linear with the winding length.
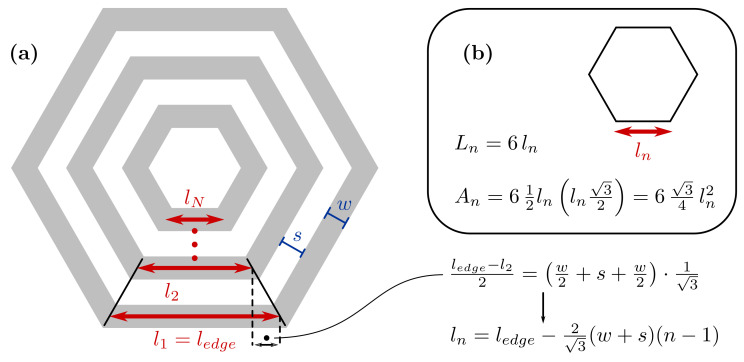
The coil total length and area are calculated as follows, for a hexagonal planar coil. Similar formulas apply for other planar shapes. The winding is approximated by concentric hexagons, as shown in Figure 5.
Figure 5.
To calculate the cross-sectional area and the total length of a hexagonal planar coil, the spiral is approximated as a set of concentric hexagons. (a) The edge length, , of the inner turn depends on the external edge, , and the trace width, w, and spacing, s. In the box (b), formulae for the equilateral hexagon perimeter and area .
If is the edge length of the external turn and w and s are the trace width and spacing, respectively, the edge length of the inner turn is computed as:
| (15) |
where n starts from for the external turn.
Total winding length and area are:
| (16) |
and
| (17) |
where is the total number of turns and is the number of PCB layers, assuming the same coil design is used for all the layers.
In Equations (16) and (17), the series sums are derived from the following identities:
| (18) |
A copper coil is considered, with resistivity of and trace thickness , corresponding to 1 per square foot, as a standard PCB manufacturing specification. Coil ohmic resistance is:
| (19) |
Thermal noise RMS density is given by Equation (20):
| (20) |
where is the Boltzmann constant and T is the ambient temperature, .
The inductive sensor signal requires amplification before sampling. A low-noise instrumentation amplifier INA163 (Texas Instruments, Dallas, TX, USA) is used in the system [26]. The INA163 introduces an input stage noise of and an output stage noise of . In addition, an input noise current density of 0.8 is declared, which was multiplied by the coil resistance, given by Equation (19), to get the noise density as a voltage. The amplifier was configured with a gain of .
Total noise magnitude depends on the signal bandwidth, . The system uses FDM to demodulate the eight magnetic field measurements from the eight transmitter coils. The measured voltage was sampled at , and 1000 samples were used to perform the frequency analysis [26]. Considering one of the eight frequencies, the target signal frequency is contained in a bin width of , which is the bandwidth of the noise added to the signal of interest.
Noise contributions sum quadratically, and the total noise is then computed as:
| (21) |
The voltage induced on the sensor is equal to the time derivative of the magnetic flux enclosed by the sensor coil. Assuming the magnetic field to be constant across the sensor area , the magnitude of the signal measured is given by Equation (22), after amplification:
| (22) |
where f is the signal frequency and is the magnetic field normal component.
In the system configuration used in the following experiments, the eight sinusoidal fields have frequencies above , and a typical magnitude of the magnetic field normal component is above . As the fields frequencies can be configured in a range between 20 and 50 [26], and the signal magnitude depends on the sensor position and orientation, the values considered for f and are just a reference used for the coil geometry optimisation and design process.
Finally, SNR is calculated from Equations (21) and (22):
| (23) |
It can be seen that, in Equation (23), the coil area only appears in the numerator, and the winding length is only present in the denominator. As the ratio increases with the coil dimension, it follows that larger coils always provide larger and signal . Coil dimension is limited by the spatial constraints of the final application.
3.2. Coil Design Optimisation
In the optimisation process, the sensor coils external dimension, , was fixed to 3 and SNR was optimised for the number of turns , trace width w and spacing s. The parameters w and s were constrained to a minimum value of , corresponding to 5 , as it is a common PCB limit for standard production, while the maximum was limited by what is physically manufacturable on a planar spiral of , for a given w and s.
The Matlab function was used to solve the constrained optimisation problem. For these constraints, the higher gain and SNR are obtained when trace width and spacing are minimised, , and the number of turns is maximised.
It should be noted that this is not always the case, as for larger coil dimensions it would be more convenient to select a wider trace width, in order to reduce coil resistance and thermal noise, and to avoid filling all the space available, because inner turns could contribute more to noise than signal. In particular, when the signal is so large that the amplifier noise can be neglected, thermal noise would dominate in the coil design for SNR optimisation.
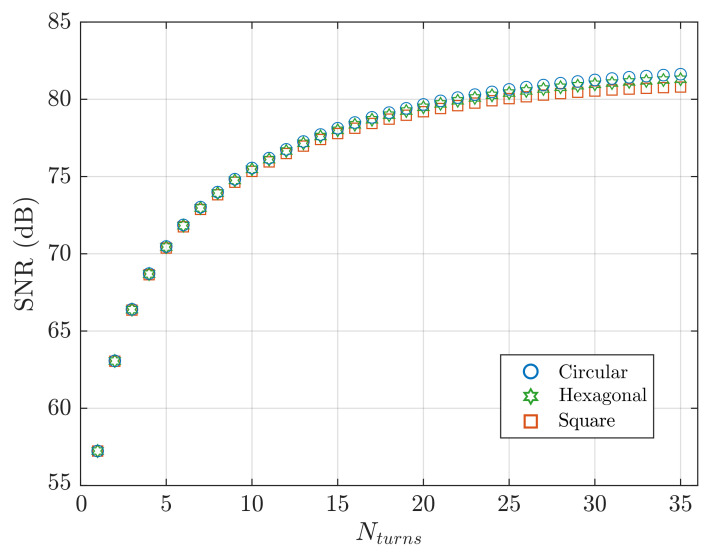
Three coil shapes were compared: a hexagonal coil with a diagonal of 3, and a circular and square planar coils with the diameter and the edge, respectively, defined to give the same footprint area as the hexagonal coil. SNR calculated from Equation (23) is plotted in Figure 6, with variation in turn count.
Figure 6.
SNR predicted from Equation (23). Circular, hexagonal and square planar coil shapes are compared, with variation in turn count. The three planar coils have the same footprint area (5.85 ) of a hexagon with a diagonal of 3 .
The circular shape provides higher SNR for two reasons: (1) when more turns are added, the cross-sectional area increases more for a circular winding than for a hexagonal or square winding, yielding a higher signal magnitude; (2) a circular coil has the maximum enclosed area for a given winding length, minimising the resistance and the thermal noise.
The parasitic capacitance of planar coils is mainly due to the electrical coupling between overlapping traces of different layers [39,40]. To decrease the parasitic capacitance of the coil and maximise the self resonance frequency, the footprints of subsequent layers were designed with shifted traces, as illustrated in Figure 7.
Figure 7.
Optimisation provided the same value for trace width and spacing, for PCB planar coils on the centimetres scale. To minimise the parasitic capacitance of the winding, it is convenient to shift the footprints of subsequent layers, so that the traces do not overlap.
3.3. Coil Measured Parameters
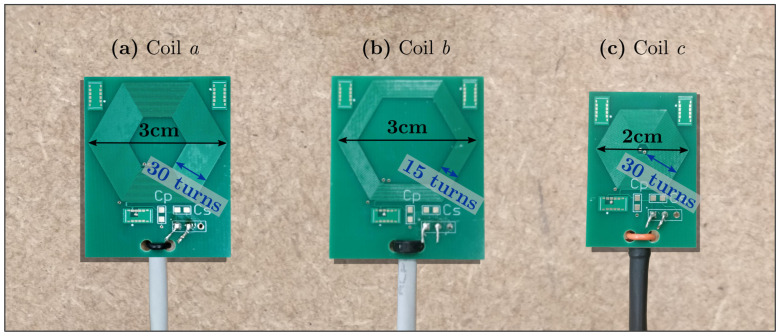
In order to experimentally validate Equation (6), which applies to coils composed of straight filaments, the hexagonal planar coil of Figure 8a was PCB manufactured. A hexagonal shape provides higher SNR than a square coil (Figure 6) and can be entirely modelled by six filaments per turn. Coil parameters are: , , , . Two other coils were used for comparison, the first (Figure 8b) having less turns, , and the second (Figure 8c) with a smaller diagonal dimension, .
Figure 8.
Three hexagonal sensors were manufactured on a 4-layer PCB. (a) The reference coil a has a diagonal, , of 3 and 30 turns per layer. (b) Another version with 15 turns, and (c) a smaller coil with , were manufactured to validate the formulas used in the coil design procedure.
Coil resistance was calculated with Equation (19). The self inductance can by estimated by Equation (4), if the transmitting and receiving filaments are taken from the same coil. For the three coils of Figure 8, predicted ohmic resistance and self inductance are:
| (24) |
Coil resistance and self inductance were measured at 1. Experimental values for coils a, b and c of Figure 8 are:
| (25) |
to be compared with Equation (24).
Inductive sensor theoretical sensitivity to a sinusoidal magnetic field is:
| (26) |
where the coil area is calculated as per Equation (17). For a reference, commercial sensors typical sensitivity is on the order of 0.1 [41]. The sensitivity of the three sensors under analysis was not directly measured, but the variation in the output sensor voltage was measured for coil b and c relative to coil a. Results are summarised in Table 1.
Table 1.
Coil resistance and self inductance predicted and measured at 1, for the three coils of Figure 8. Sensitivity predicted by Equation (26) and signal variation experimentally measured between the three coils.
| Coil a | Coil b | Coil c | |
|---|---|---|---|
| Coil dimension | , | , | , |
| 30 turns | 15 turns | 30 turns | |
| Resistance (Equation (24)) | 30.47 | 18.36 | 16.3 |
| Resistance meas. | 37 | 22.8 | 18.6 |
| Inductance (Equation (6)) | 304.2 | 133.3 | 111.2 |
| Inductance meas. | 289.4 | 121.2 | 98.2 |
| Sensitivity (Equation (26)) | 0.239 | 0.166 (69.4%) | 0.077 (32.4%) |
| Sensitivity meas. | — | 66.4% | 30.3% |
4. Mutual Inductance Measurement
Coil a of Table 1, shown in Figure 8a, was selected as preferred sensor model for the other experiments presented in the next sections of this article.
A set of mutual inductances were measured between coil a and the eight transmitter coils of the field generator, shown in Figure 9.
Figure 9.
The field generator comprises a set of eight planar transmitter coils, as first presented in [12]. Each coil is driven with a sinusoidal current at a different frequency and the sensor coil uses frequency-division multiplexing (FDM) to distinguish the eight signals.
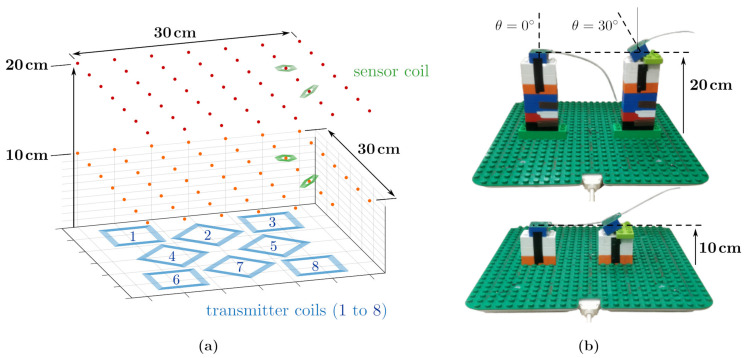
The receiving coil was positioned on a grid of test points laying on a horizontal plane. The experiment was repeated for two distances from the planar transmitter board, 10 and 20, and for two sensor orientations, vertically oriented and with an angle of from the vertical axis, as shown in Figure 10a.
Figure 10.
(a,b) The mutual inductance was measured on a grid of points at 10 and 20 from the planar field generator, for two sensor orientations: pitch angle and . At every test point, the eight mutual inductances between the sensor coil and the eight transmitter coils are considered, leading to a total of mutual inductances experimentally evaluated.
Duplo blocks (The Lego Company, Billund, Denmark) were used to precisely locate the sensor in known positions (Figure 10b). At every test position, 100 measurements were collected and the average was considered, in order to reduce random error.
For each sensor position and orientation, the eight mutual inductances between sensor and the transmitter coils of the field generator were measured, leading to a total of 1568 mutual inductance values experimentally collected, for the 98 different positions and two sensor orientations.
Mutual inductances at test-points were also simulated with the analytical model proposed in Section 2. PCB traces of the transmitting and the receiving planar coils were approximated as 0-radius straight filaments. Previous works demonstrated that this assumption is true almost everywhere apart from the close proximity (approximately less than five times the trace width) to the conductor [42,43].
The model takes into account all the filaments composing the square transmitter coil and all the filaments of the hexagonal sensor coil, to compute the mutual inductance between the two coils as the sum of the contributions given by every pair of filaments.
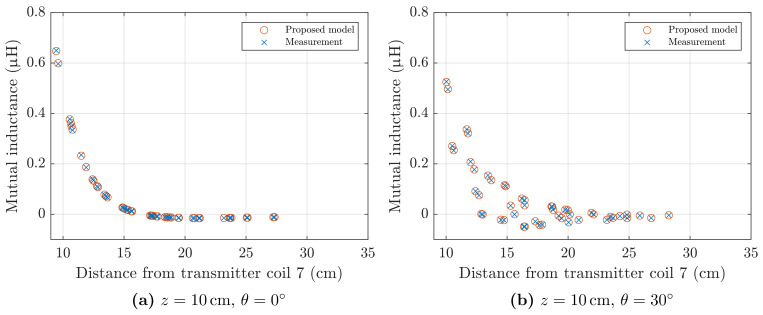
Figure 11 shows the mutual inductance between the sensor coil a and transmitter coil 7, as defined in Figure 10a, for the grid of points at and the two sensor orientations. The values experimentally measured are compared to the values predicted by the formula proposed in this article, Section 2.
Figure 11.
Mutual inductance between coil a of Figure 8a, and transmitter coil 7 of the field generator, as defined in Figure 10a. Experimental values are compared to those predicted by the analytical model of Section 2. (a) Test points at 10 from the planar field generator, pitch angle . (b) Test points at 10 from the planar field generator, pitch angle .
Results of the four tests performed are summarised in Table 2. Each of the four cases includes inductance values. The average measured mutual inductance, , the root-mean-square error (RMSE) and the maximum error (MAXE) between the measurement and the model are reported.
Table 2.
Each test includes 392 mutual inductance values, with average . RMSE and MAXE are calculated between the measurement and the model proposed in Section 2.
| Test | [nH] | RMSE [nH] | MAXE [nH] |
|---|---|---|---|
| z = 10 cm, theta = | 85.808 | 1.354 | 6.585 |
| z = 10 cm, theta = | 78.061 | 0.979 | 4.343 |
| z = 20 cm, theta = | 30.428 | 0.174 | 0.549 |
| z = 20 cm, theta = | 26.990 | 0.144 | 0.490 |
5. System Simulation
Mutual inductance calculation provides the mutual inductance between transmitter and receiver coils, based on the relative position between the two coils.
The positioning algorithm aims to solve the inverse problem: finding the sensor position and orientation, given the set of mutual inductances measured between the eight transmitter coils of the field generator, Figure 9, and the sensor coil, Figure 8a.
The problem was solved in a least-squares sense, with cost function:
| (27) |
where is the estimated sensor position, is the voltage measurement, related to transmitter coil i, and is the signal predicted by the magnetic model.
5.1. Magnetic Model
The transmitter board comprises eight square planar coils of 25 turns, for a total of filaments, as shown in Figure 9. The receiving sensor is a hexagonal planar coil of 30 turns, composed by filaments, as shown in Figure 8a. The full magnetic model accounts for the magnetic mutual coupling between all the pairs of transmitting and receiving filaments, which is given by Equation (6). Vectorisation is of massive importance for speed, because a total of 144,000 filament couples has to be considered.
The optimisation algorithm was implemented on Matlab, (Mathworks, Natick, MA, USA), running on an HP EliteBook 840 G3 (HP Inc., Palo Alto, CA, USA) with a Core i7-6500U 2.5 GHz processor and 8 of RAM. Matlab function lsqnonlin was used to solve Equation (27), resulting on an average solution time on the order of seconds. Therefore, the full model is not suitable to real-time tracking applications, which require update-rates at least on the order of tens of Hz [44].
Two simplified but faster models are proposed and analysed. The first model considers only one turn for the receiving coil, or six filaments. A further simplification does not take into account the receiving coil area, and evaluates the magnetic field at a single point at the middle. In both the cases, the transmitter coils are not simplified and all the 800 filaments are considered.
5.2. Dependence on Distance
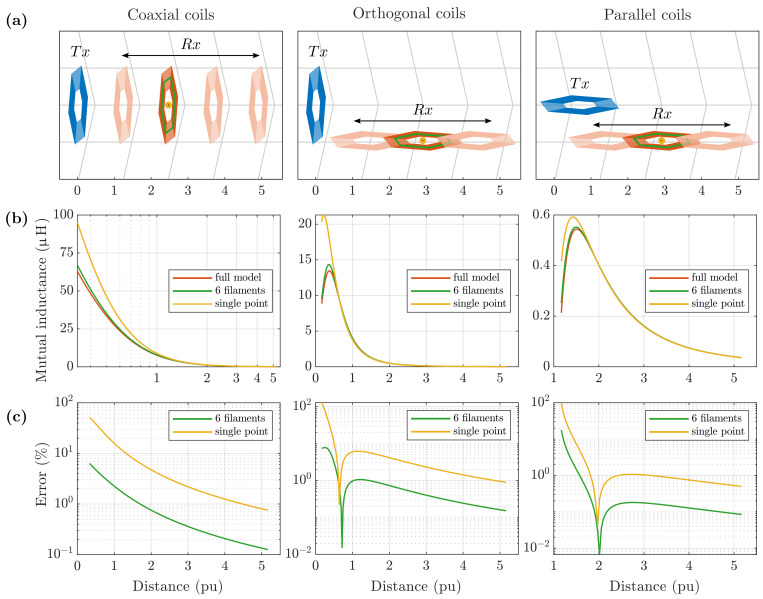
The Accuracy of the simplified 6-filament and single-point models was tested for the mutual inductance calculation between two coils, with variation in the distance, using the full model as a ground-truth reference.
Two hexagonal planar coils of 3 diagonal were considered. Mutual inductance was calculated at increasing distance, for different reciprocal orientations, as drawn in Figure 12a. The yellow dot indicates the position of the point of evaluation for the single-point model and the green hexagon highlights the single turn considered in the 6-filament model.
Figure 12.
(a) A transmitter coil, , and a receiver coil, , at increasing distance, for three orientation configurations. Plots are on a per unit (p.u.) scale, referring to the coil diameter. (b) The mutual inductance was calculated with the full model, 6-filament and single-point approximations. (c) The relative error falls below 1% at a distance of larger than 2 and 5 for the 6-filament and single-point models, respectively, for all the three orientations considered.
Mutual inductances calculated with the full, 6-filament and single-point models are plotted in Figure 12b, on a per-unit axis, relative to the hexagonal coil diagonal. Figure 12c shows the relative percentage error of the two simplified models against the exact model reference.
As expected, relative error decreases with distance, as model approximations become less important. The error depends on coil orientation, but some general observations are true for all three orientation cases considered.
For the single-point model, the relative error becomes smaller than 1% at a distance of approximately five times the coil diagonal. For a coil of 3 , such as coil a under analysis, it corresponds to 15 .
For the 6-filament model, the relative error maintains almost constantly five times smaller than the single-point error, becoming less than 1% below a distance of 2
5.3. Static Tracking Simulation
Virtual tracking simulations can be used to validate magnetic models for EMT [45]. The sensor is positioned at a number of locations within the tracking region, where the magnetic field is given by an accurate field simulation. The magnetic model being tested is used to infer the sensor position, starting from the simulated magnetic measurement.
With reference to Equation (27), the voltage measurement was simulated using the full model described in Section 5.1, while is the signal predicted by the magnetic model being tested.
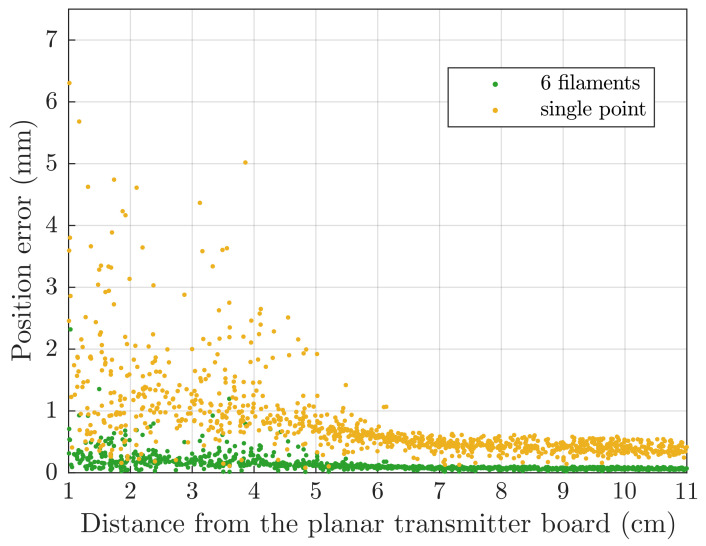
To compare the 6-filament and the single-point models, two virtual static tracking accuracy tests were performed. In the first test, position errors due to model approximations were studied. The magnetic sensor was virtually placed at 512 random positions between 1 and 11 from the transmitter board.
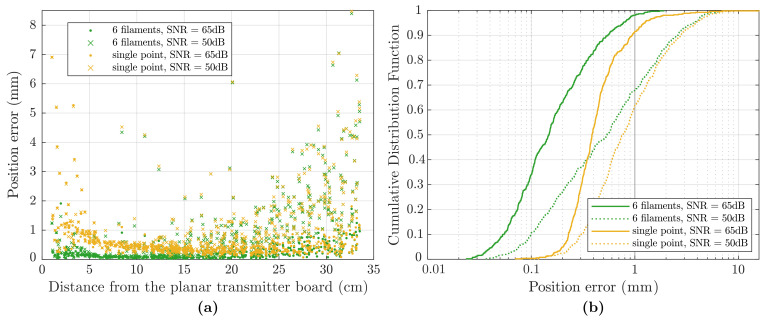
In the second test, random white noise was added to the simulated signal, to analyse the robustness of the two models. The sensor was placed at 512 random locations in a cube of . The simulated noise magnitude was considered fixed, not dependent on the signal, representing an external noise source, meaning that SNR is not constant and depends on the signal magnitude. Test points further from the field generator have a smaller signal and, thus, present a smaller SNR.
The test was repeated using two different Gaussian noise magnitudes, in order to evaluate the influence of noise on tracking error. For the two cases, the SNR values computed as an average on all the test points are 65 and 50 respectively.
5.4. Static Tracking Simulation Results
The position error is computed as the Euclidean distance between the test position , used to simulate the magnetic measurement, and the position solved by the tracking algorithm, :
| (28) |
Scatter plot of the error is shown in Figure 13, where it can be seen that the single-point approximation is not accurate in the proximity of the field generator. However, it can be used for large-area coils, such as the one under analysis, at distances above 6 , with sub-millimetre errors.
Figure 13.
Static accuracy test simulation with no added noise. Position errors are due to model approximations. The two simplified models presented in Section 5.1 are compared.
For more accurate tracking near the field generator, the 6-filament model can be used, but as reported in Table 3, it takes more time for computation on average.
Table 3.
Speed and accuracy of the 6-filament and the single-point models used in a simulated electromagnetic tracking experiment. Scatter plot of the error is shown in Figure 13. Computation time is calculated as the average solution time for 512 random test points.
| Model | Time [s] | Distance from Board [cm] | RMSE [mm] | ME [mm] |
|---|---|---|---|---|
| 6-filament | 0.052 | 1–6 | 0.2615 | 0.1903 |
| 6–11 | 0.0754 | 0.0733 | ||
| single-point | 0.007 | 1–6 | 1.4083 | 1.1024 |
| 6–11 | 0.4485 | 0.4357 |
Computation time is calculated as the average time for the solution of each of the 512 test points. Average solution time, root-mean-square error (RMSE) and mean error (ME) are detailed in Table 3, for the two models described.
For the results of Figure 14, Gaussian noise was added to the simulated signal, of Equation (27). Compared to the no-noise simulation of Figure 13, average tracking error increases, as the noisy measured signal deviates from the magnetic model.
Figure 14.
(a) Static accuracy test simulation with noisy data, two noise levels are compared. Position errors depend on model approximations and on noise magnitude. (b) Cumulative distribution function of the position error, for the two magnetic models considered and average noise levels of 50 and 65 .
Error is plotted in Figure 14a. Test points at higher distance have a lower signal and SNR, resulting in higher position error. It can be noticed that, for the compared 6-filament and the single-point models, solutions are similar for positions far from the transmitter board, where SNR is low and the error is mainly due to the externally added noise. On the other hand, for positions near the transmitter board different noise levels have less influence, while the source of error is due to the model approximations.
The cumulative distribution function of the error is plotted in Figure 14b and shows that, in the lower noise case, with an average SNR of 65 , almost all the points obtained with the 6-filament model and approximately 90 of the points for the single-point model exhibit sub-millimetre errors. If the external noise is increased, with an average SNR of 50 , the percentages of the points with sub-millimetre errors decrease to approximately 70 and 60 respectively.
6. Experimental Tracking Accuracy Test
A real electromagnetic tracking test was performed to estimate the static positional accuracy of planar coil a, using the magnetic model proposed in this article.
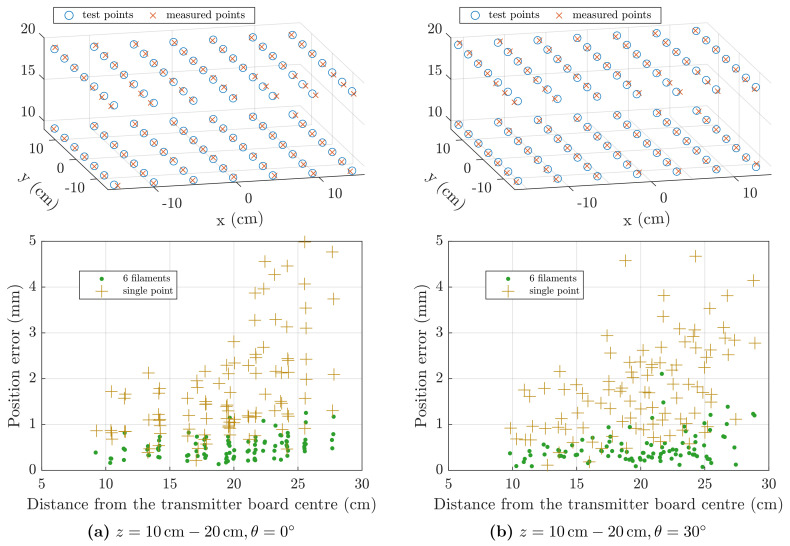
The four test cases described in Section 4 and visualised in Figure 10 were repeated, where in this case the real field measurements, , were used to estimate the position of the sensor, from Equation (27). The 6-filament and the single-point magnetic models, previously presented, are compared in terms of tracking accuracy and speed.
Electromagnetic tracking test results are presented separately in Figure 15 for the two sensor orientation cases, and . The first row of Figure 15 shows the two grids of 49 points at and , together with the positions estimated by the single-point model.
Figure 15.
Static accuracy test with real data. In the first row, test points and positions solved using the single-point model. In the second row, scatter plot of the position error, for the 6-filament and single-point models. Columns (a,b) show the results for different sensor orientations, and , respectively.
The second row of Figure 15 shows the scatter plot of the total position error, computed as for Equation (28), against the distance from the centre of the field generator. It can be seen that the 6-filament model yielded better accuracy than the single-point model, with errors below 1 for almost all the test points. Errors of the single-point model are below 5. Positions further from the centre-point show, on average, larger errors, due to signal attenuation and decreased SNR.
Average solution time, root-mean-square error (RMSE) and mean error (ME) are detailed in Table 4, for the four test cases and the two magnetic models described.
Table 4.
Speed and accuracy of the 6-filament and the single-point models used in a real electromagnetic tracking experiment. Scatter plot of the error is shown in Figure 15. Computation time is calculated as the average solution time for the 49 test points.
| Test | Model | Time [s] | RMSE [mm] | ME [mm] |
|---|---|---|---|---|
| 6-filament | 0.1420 | 0.54 | 0.49 | |
| single-point | 0.0091 | 1.54 | 1.31 | |
| 6-filament | 0.1483 | 0.63 | 0.52 | |
| single-point | 0.0094 | 1.92 | 1.57 | |
| 6-filament | 0.1541 | 0.58 | 0.52 | |
| single-point | 0.0098 | 2.47 | 2.23 | |
| 6-filament | 0.1488 | 0.57 | 0.48 | |
| single-point | 0.0097 | 2.29 | 2.07 |
7. Discussion
A method for the calculation of the mutual inductance between coils composed of straight filaments was presented, and a new formulation for the partial mutual inductance between arbitrarily oriented straight filaments was proposed.
Coil design demonstrated that planar coils on the centimetre scale are optimised when the minimum track width and spacing are chosen, and the number of turns is maximised. The circular shape is optimal for SNR optimisation, Figure 6, but a hexagonal coil shape was selected, because it can be entirely modelled by straight filaments. In Table 1, measured coil resistance, inductance and sensitivity variation are compared with the values predicted in the design stage.
A hexagonal planar coil with a diameter of 3 was PCB manufactured. A set of mutual inductances was measured between the sensor coil and the eight transmitter coils of the field generator. Experimental values validated the model proposed in Section 2. A selection of the results is plotted in Figure 11, and the average error is reported in Table 2.
The tracking algorithm was implemented in Matlab, (Mathworks, Natick, MA, USA), with an average solution time in the order of seconds, when all the pairs of transmitting and receiving filaments were considered. To allow for real-time EMT, two simplified models were introduced, where the sensor coil was approximated by six filaments or by a single point respectively.
Virtual tracking error is plotted in Figure 13, where it can be seen that the single-point model provides sub-millimetre positioning errors at distances larger than 6 from the transmitter board, while the 6-filament model reaches the same level of accuracy even for closer positions.
Four EMT static tests were performed, varying the sensor orientation and distance from the field generator. As reported in Table 4, using the 6-filament model the position error is three to four times smaller than using the single-point model, but the average solution time is approximately 0.15 , compared to 0.01 for the single-point model.
8. Conclusions
Magnetic sensors are commonly used for electromagnetic tracking in image-guided interventions. The use of redundant sensors can help to detect and minimise the effect of magnetic distortions. One additional application is the surface tracking of breathing motion to compensate for registration errors.
Large-area planar sensors show high sensitivity, even in the absence of a magnetic core. They can be printed on flexible PCB, and embedded in adhesive patches, with reduced costs and high precision manufacturing and repeatability.
This paper analyses the tracking performances of planar coils on the centimetre scale. An accurate magnetic model is proposed and experimentally validated. While the model was too slow for effective real-time EMT, it proved useful to perform sensor design and calibration and to run tracking simulations.
The introduction of model simplifications increased the calculation speed, and the real-time tracking of large-area planar sensors was demonstrated with sub-millimetre positioning errors.
Future work will investigate the use of PCB printed planar sensors to record the registration volume deformation and compensate the target sensor position for patient movements. In another study, the sensors will collect real-time measurements of the magnetic field at known positions, in order to recognise and compensate for metallic distortions.
Abbreviations
The following abbreviations are used in this manuscript:
| EMT | ElectroMagnetic Tracking |
| PCB | Printed Circuit Board |
| FDM | Frequency-Division Multiplexing |
| SNR | Signal-to-Noise Ratio |
| RMSE | Root-Mean-Square Error |
| ME | Mean Error |
Author Contributions
Conceptualization, M.C., H.A.J., K.O. and P.C.-M.; methodology, M.C., H.A.J., K.O. and P.C.-M.; formal analysis, M.C.; investigation, M.C.; writing—original draft preparation, M.C.; writing—review and editing, M.C., H.A.J., K.O. and P.C.-M; supervision, P.C.-M.; funding acquisition, P.C.-M. All authors have read and agreed to the published version of the manuscript.
Funding
This research was funded by the Science Foundation Ireland Technology Innovation and Development under Award TIDA17/4897, by Science Foundation Ireland Career Devel- opment Award 17/CDA/4771, and by the Eureka Eurostars through the project “Mariana: Image-guided catheter navigation in the outer airways” under Project 11581.
Institutional Review Board Statement
Not applicable.
Informed Consent Statement
Not applicable.
Data Availability Statement
Not applicable.
Conflicts of Interest
The authors declare no conflict of interest.
Footnotes
Publisher’s Note: MDPI stays neutral with regard to jurisdictional claims in published maps and institutional affiliations.
References
- 1.Sorriento A., Porfido M.B., Mazzoleni S., Calvosa G., Tenucci M., Ciuti G., Dario P. Optical and Electromagnetic Tracking Systems for Biomedical Applications: A Critical Review on Potentialities and Limitations. IEEE Rev. Biomed. Eng. 2020;13:212–232. doi: 10.1109/RBME.2019.2939091. [DOI] [PubMed] [Google Scholar]
- 2.Agrawal A., Hogarth D.K., Murgu S. Robotic Bronchoscopy for Pulmonary Lesions: A Review of Existing Technologies and Clinical Data. J. Thorac. Dis. 2020;12:3279–3286. doi: 10.21037/jtd.2020.03.35. [DOI] [PMC free article] [PubMed] [Google Scholar]
- 3.Lima E., Rodrigues P.L., Mota P., Carvalho N., Dias E., Correia-Pinto J., Autorino R., Vilaça J.L. Ureteroscopy-Assisted Percutaneous Kidney Access Made Easy: First Clinical Experience with a Novel Navigation System Using Electromagnetic Guidance (IDEAL Stage 1) Eur. Urol. 2017;72:610–616. doi: 10.1016/j.eururo.2017.03.011. [DOI] [PubMed] [Google Scholar]
- 4.Martins B., Dagnino G., Dogramadzi S. Real-Time Electromagnetic Tracking of Orthopaedic Pins for Robot-Assisted Fracture Surgery; Proceedings of the Computer and Robot Assisted Surgery (CRAS); London, UK. 10–11 September 2018. [Google Scholar]
- 5.Kim J. Non-Fluoroscopic Catheter Tracking System for Atrial Fibrillation Ablation. Korean Circ. J. 2018;49:97–98. doi: 10.4070/kcj.2018.0319. [DOI] [PMC free article] [PubMed] [Google Scholar]
- 6.Yamada S., Lo L.W., Lin Y.J., Chang S.L., Chung F.P., Hu Y.F., Tuan T.C., Chao T.F., Liao J.N., Lin C.Y., et al. The Accuracy and Clinical Applicability of a Sensor Based Electromagnetic Non-Fluoroscopic Catheter Tracking System. Korean Circ. J. 2019;49:84–96. doi: 10.4070/kcj.2018.0195. [DOI] [PMC free article] [PubMed] [Google Scholar]
- 7.Kalmus H.P. A New Guiding and Tracking System. IRE Trans. Aerosp. Navig. Electron. 1962;ANE-9:7–10. doi: 10.1109/TANE3.1962.4201833. [DOI] [Google Scholar]
- 8.Xie J., Qin C., Zhou X., Huang L., Han X., Wang M., Li L. The Simulations and Experiments of the Electromagnetic Tracking System Based on Magnetic Dipole Model. IEEE Trans. Appl. Supercond. 2014;24:1–4. doi: 10.1109/TASC.2013.2294406. [DOI] [Google Scholar]
- 9.Paperno E., Plotkin A. Cylindrical Induction Coil to Accurately Imitate the Ideal Magnetic Dipole. Sens. Actuators A Phys. 2004;112:248–252. doi: 10.1016/j.sna.2004.01.004. [DOI] [Google Scholar]
- 10.Schroeder T. An Accurate Magnetic Field Solution for Medical Electromagnetic Tracking Coils at Close Range. J. Appl. Phys. 2015;117:224504. doi: 10.1063/1.4922667. [DOI] [Google Scholar]
- 11.Anderson P.T. Ph.D. Thesis. The University of Vermont; Burlington, VT, USA: 2001. A Source of Accurately Calculable Quasi-Static Magnetic Fields. [Google Scholar]
- 12.Mansfield H., Cantillon-Murphy P., Griffiths J., Eustace D., O’Shea M., O’Donoghue K., Power T. Catheter Position Tracking System Using Planar Magnetics and Closed Loop Current Control. IEEE Trans. Magn. 2014;50:1–9. doi: 10.1109/tmag.2014.2304271. [DOI] [Google Scholar]
- 13.Briggs W. Magnetic Calibration by Tetrahedral Interpolation. Proc. NIST-ASME Ind. Virtual Real. Symp. 1999;5:27–32. [Google Scholar]
- 14.Bryson S.T. Measurement and Calibration of Static Distortion of Position Data from 3D Trackers. Stereoscopic Displays and Applications III. Volume 1669. International Society for Optics and Photonics; Washington, DC, USA: 1992. pp. 244–255. [DOI] [Google Scholar]
- 15.Attivissimo F., Lanzolla A.M.L., Carlone S., Larizza P., Brunetti G. A Novel Electromagnetic Tracking System for Surgery Navigation. Comput. Assist. Surg. 2018;23:42–52. doi: 10.1080/24699322.2018.1529199. [DOI] [PubMed] [Google Scholar]
- 16.Kindratenko V., Bennett A. Evaluation of Rotation Correction Techniques for Electromagnetic Position Tracking Systems. In: Mulder J., van Liere R., editors. Virtual Environments 2000. Springer; Vienna, Austria: 2000. pp. 13–22. [DOI] [Google Scholar]
- 17.Kindratenko V.V., Sherman W.R. Neural Network-Based Calibration of Electromagnetic Tracking Systems. Virtual Real. 2005;9:70–78. doi: 10.1007/s10055-005-0005-3. [DOI] [Google Scholar]
- 18.Whitmire E., Salemi Parizi F., Patel S. Aura: Inside-out Electromagnetic Controller Tracking; Proceedings of the 17th Annual International Conference on Mobile Systems, Applications, and Services-MobiSys ’19; Seoul, Korea. 17–21 June 2019; Seoul, Korea: ACM Press; 2019. pp. 300–312. [DOI] [Google Scholar]
- 19.Czernuszenko M., Sandin D., DeFanti T. Line of Sight Method for Tracker Calibration in Projection-Based VR Systems; Proceedings of the 2nd International Immersive Projection Technology Workshop; Ames, IA, USA. 11–12 May 1988. [Google Scholar]
- 20.Ghazisaedy M., Adamczyk D., Sandin D., Kenyon R., DeFanti T. Ultrasonic Calibration of a Magnetic Tracker in a Virtual Reality Space; Proceedings of the Virtual Reality Annual International Symposium ’95; Research Triangle Park, NC, USA. 11–15 March 1995; pp. 179–188. [DOI] [Google Scholar]
- 21.Livingston M.A., State A. Magnetic Tracker Calibration for Improved Augmented Reality Registration. Presence Teleoperators Virtual Environ. 1997;6:532–546. doi: 10.1162/pres.1997.6.5.532. [DOI] [Google Scholar]
- 22.Cantillon-Murphy P., Jaeger H.A. Anser EMT, OSF Repository. [(accessed on 14 April 2021)];2016 Available online: https://osf.io/47q8q/
- 23.Ahmad G., Hussein A.A., Mesubi O., Tian J., Ferieg H., Elmaaty M.A., Hamdy A., Ego-Osuala K., Jimenez A., See V., et al. Impact of Fluoroscopy Unit on the Accuracy of a Magnet-Based Electroanatomic Mapping and Navigation System: An In Vitro and In Vivo Validation Study. Pacing Clin. Electrophysiol. 2014;37:157–163. doi: 10.1111/pace.12231. [DOI] [PubMed] [Google Scholar]
- 24.Jaeger H.A., Cantillon-Murphy P. Distorter Characterisation Using Mutual Inductance in Electromagnetic Tracking. Sensors. 2018;18:3059. doi: 10.3390/s18093059. [DOI] [PMC free article] [PubMed] [Google Scholar]
- 25.Jaeger H.A., Cantillon-Murphy P. Electromagnetic Tracking Using Modular, Tiled Field Generators. IEEE Trans. Instrum. Meas. 2019;68:4845–4852. doi: 10.1109/TIM.2019.2900884. [DOI] [Google Scholar]
- 26.Jaeger H.A., Franz A.M., O’Donoghue K., Seitel A., Trauzettel F., Maier-Hein L., Cantillon-Murphy P. Anser EMT: The First Open-Source Electromagnetic Tracking Platform for Image-Guided Interventions. Int. J. Comput. Assist. Radiol. Surg. 2017 doi: 10.1007/s11548-017-1568-7. [DOI] [PubMed] [Google Scholar]
- 27.Cavaliere M., McVeigh O., Jaeger H.A., Hinds S., O’Donoghue K., Cantillon-Murphy P. Inductive Sensor Design for Electromagnetic Tracking in Image Guided Interventions. IEEE Sens. J. 2020;20:8623–8630. doi: 10.1109/JSEN.2020.2984323. [DOI] [Google Scholar]
- 28.Aurora Sensors-NDI. [(accessed on 14 April 2021)]; Available online: https://www.ndigital.com/products/aurora/aurora-sensors/
- 29.Johnk C.T.A. Engineering Electromagnetic Fields and Waves. John Wiley and Sons, Inc.; New York, NY, USA: 1975. 667p [Google Scholar]
- 30.Paul C.R., Nasar S.A. Introduction to Electromagnetic Fields. McGraw-Hill; New York, NY, USA: 1987. [Google Scholar]
- 31.Neumann F.E. Allgemeine Gesetze der inducirten elektrischen Ströme. Ann. Der Phys. Und Chem. 1846;143:31–44. doi: 10.1002/andp.18461430103. [DOI] [Google Scholar]
- 32.Chan H.L., Cheng K.W.E., Sutanto D. A Simplified Neumann’s Formula for Calculation of Inductance of Spiral Coil; Proceedings of the 8th International Conference on Power Electronics and Variable Speed Drives; London, UK. 18–19 September 2000; pp. 69–73. [DOI] [Google Scholar]
- 33.Greenhouse H. Design of Planar Rectangular Microelectronic Inductors. IEEE Trans. Parts Hybrids Packag. 1974;10:101–109. doi: 10.1109/TPHP.1974.1134841. [DOI] [Google Scholar]
- 34.Rosa E.B. The Self and Mutual-Inductances of Linear Conductors. Bull. Bur. Stand. 1908;4:301. doi: 10.6028/bulletin.088. [DOI] [Google Scholar]
- 35.Campbell G.A. Mutual Inductances of Circuits Composed of Straight Wires. Phys. Rev. 1915;5:452–458. doi: 10.1103/PhysRev.5.452. [DOI] [Google Scholar]
- 36.Grover F.W. Inductance Calculations: Working Formulas and Tables. Instrument Society of America; Albuquerque, NM, USA: 1946. [Google Scholar]
- 37.Sonntag C.L.W., Lomonova E.A., Duarte J.L. Implementation of the Neumann Formula for Calculating the Mutual Inductance between Planar PCB Inductors; Proceedings of the 2008 18th International Conference on Electrical Machines; Vilamoura, Portugal. 6–9 September 2008; pp. 1–6. [DOI] [Google Scholar]
- 38.Cheng Y., Shu Y. Mutual Inductance Calculation between Arbitrarily Positioned Rectangular Filaments. Int. J. Appl. Electromagn. Mech. 2014;46:287–298. doi: 10.3233/JAE-141779. [DOI] [Google Scholar]
- 39.Yue C., Wong S. Physical Modeling of Spiral Inductors on Silicon. IEEE Trans. Electron Devices. 2000;47:560–568. doi: 10.1109/16.824729. [DOI] [Google Scholar]
- 40.Zolfaghari A., Chan A., Razavi B. Stacked Inductors and 1-to-2 Transformers in CMOS Technology; Proceedings of the IEEE 2000 Custom Integrated Circuits Conference (Cat. No.00CH37044); Orlando, FL, USA. 24 May 2000; pp. 345–348. [DOI] [Google Scholar]
- 41.O’Donoghue K. Ph.D. Thesis. University College Cork; Cork, Ireland: 2014. Electromagnetic Tracking and Steering for Catheter Navigation. [Google Scholar]
- 42.Sonntag C.L.W., Sprée M., Lomonova E.A., Duarte J.L., Vandenput A.J.A. Accurate Magnetic Field Intensity Calculations for Contactless Energy Transfer Coils; Proceedings of the 16th International Conference on the Computation of Electromagnetic Fields; Achen, Germany. 24–28 June 2007; pp. 1–4. [Google Scholar]
- 43.Cheng Y., Shu Y. A New Analytical Calculation of the Mutual Inductance of the Coaxial Spiral Rectangular Coils. IEEE Trans. Magn. 2014;50:1–6. doi: 10.1109/TMAG.2013.2290972. [DOI] [Google Scholar]
- 44.Yaniv Z., Wilson E., Lindisch D., Cleary K. Electromagnetic Tracking in the Clinical Environment: Electromagnetic Tracking in the Clinical Environment. Med. Phys. 2009;36:876–892. doi: 10.1118/1.3075829. [DOI] [PMC free article] [PubMed] [Google Scholar]
- 45.De Angelis G., De Angelis A., Moschitta A., Carbone P. Comparison of Measurement Models for 3D Magnetic Localization and Tracking. Sensors. 2017;17:2527. doi: 10.3390/s17112527. [DOI] [PMC free article] [PubMed] [Google Scholar]
Associated Data
This section collects any data citations, data availability statements, or supplementary materials included in this article.
Data Availability Statement
Not applicable.


