eLife logoLink to eLife
. 2021 Apr 20;10:e67740. doi: 10.7554/eLife.67740

Bacterial–fungal interactions in the neonatal gut influence asthma outcomes later in life

Rozlyn CT Boutin 1,2,, Charisse Petersen 2, Sarah E Woodward 1,2, Antonio Serapio-Palacios 2, Tahereh Bozorgmehr 2, Rachelle Loo 1,2, Alina Chalanuchpong 1,2, Mihai Cirstea 1,2, Bernard Lo 1, Kelsey E Huus 1,2, Weronika Barcik 2, Meghan B Azad 3, Allan B Becker 3, Piush J Mandhane 4,5, Theo J Moraes 6, Malcolm R Sears 7, Padmaja Subbarao 6,8, Kelly M McNagny 9,10, Stuart E Turvey 1,11, B Brett Finlay 1,2,12,
Editors: Wendy S Garrett13, Antonis Rokas14
PMCID: PMC8075585  PMID: 33876729

Abstract

Bacterial members of the infant gut microbiota and bacterial-derived short-chain fatty acids (SCFAs) have been shown to be protective against childhood asthma, but a role for the fungal microbiota in asthma etiology remains poorly defined. We recently reported an association between overgrowth of the yeast Pichia kudriavzevii in the gut microbiota of Ecuadorian infants and increased asthma risk. In the present study, we replicated these findings in Canadian infants and investigated a causal association between early life gut fungal dysbiosis and later allergic airway disease (AAD). In a mouse model, we demonstrate that overgrowth of P. kudriavzevii within the neonatal gut exacerbates features of type-2 and -17 inflammation during AAD later in life. We further show that P. kudriavzevii growth and adherence to gut epithelial cells are altered by SCFAs. Collectively, our results underscore the potential for leveraging inter-kingdom interactions when designing putative microbiota-based asthma therapeutics.

Research organism: Human, Mouse, Other

Introduction

Asthma is a chronic airways disease affecting over 300 million people worldwide and at least one-in-ten children in developed countries (Asher and Pearce, 2014; Vos and Global Burden of Disease Study 2013 Collaborators, 2015; Organization, W, 2008). The most common form of asthma is an allergic-type disease driven by excessive type-2 inflammation involving immunoglobulin (Ig)E antibodies, T helper (Th) type 2 cells, and lung eosinophilia (Lambrecht and Hammad, 2015). In severe cases, there can also be involvement of type-17 inflammation involving Th17 cells and interleukin (IL)−17 (Lambrecht and Hammad, 2015; Irvin et al., 2014; Wang et al., 2010). Despite its high global prevalence, the etiology of allergic asthma remains incompletely understood, the disease has no cure, and patients with severe asthma often fail to achieve adequate disease control with standard treatments.

Recent findings of associations between suboptimal establishment (dysbiosis) of the bacterial communities within the infant gut microbiota and an increased risk of developing childhood asthma (Arrieta et al., 2018; Fujimura et al., 2016; Stokholm et al., 2018) have generated intense interest in exploiting the gut microbiota for therapeutic purposes. Although the exact signatures of dysbiosis are variable across studies, states of asthma- and allergy-associated dysbiosis have been consistently associated with reduced levels of fecal short-chain fatty acid (SCFA) bacterial fermentation products including acetate, butyrate, and propionate (Arrieta et al., 2018; Roduit et al., 2019; Arrieta et al., 2018). SCFAs are well recognized for their anti-inflammatory effects in the context of disease (Roduit et al., 2019; Trompette et al., 2014; Thorburn et al., 2015; Arpaia et al., 2013; Smith et al., 2013; Machiels et al., 2014), indicating that key functional consequences of asthma-associated bacterial dysbiosis may be conserved across studies and cohorts. To date, studies investigating the dysbiosis-asthma paradigm have predominantly focused on the bacterial signatures of dysbiosis and highlighted an asthma-protective role for certain gut bacteria (Boutin et al., 2020; Arrieta et al., 2015). In contrast, two recent studies in human birth cohorts have indicated that fungal dysbiosis, characterized by overgrowth of certain fungi, co-occurs with and is often much more conspicuous than asthma-associated bacterial dysbiosis (Fujimura et al., 2016; Arrieta et al., 2018). A causal role for fungal dysbiosis during infancy and later asthma outcomes has yet to be elucidated.

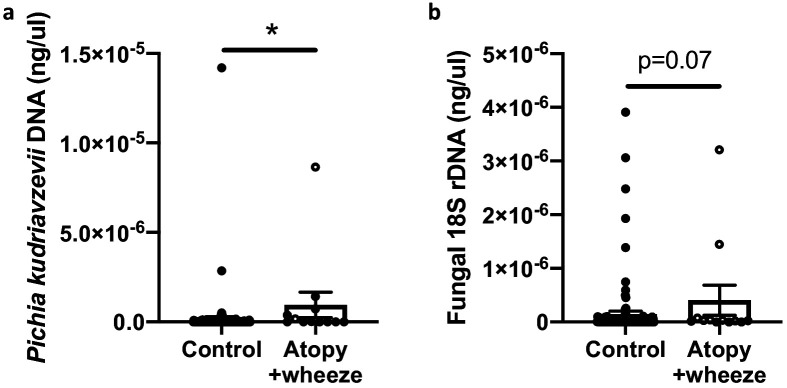
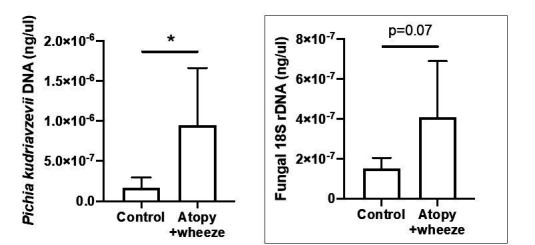
In Ecuadorian infants from the Ecuador Life (ECUAVIDA) study from a rural (non-industrialized) district of Quinindé, Esmeraldas Province (Cooper et al., 2015), we recently showed that fungal dysbiosis characterized by a general increase in total fungal load and increased abundance of the yeast Pichia kudriavzevii (also known as Candida krusei, Issatchenkia orientalis, and Candida glycerinogenes [Douglass et al., 2018]) within the gut at 3 months of age was associated with an increased risk of developing atopy and wheeze, a phenotype associated with an increased risk of asthma, at age 5 years (Arrieta et al., 2018). This yeast is commonly identified in human gut mycobiota studies (Suhr and Hallen-Adams, 2015) and has been found as a gut microbe in other birth cohorts (Heisel, 2015; Ward et al., 2018). Moreover, in a subset of 123 subjects from the CHILD Cohort Study, we found evidence suggesting that Canadian infants from an industrialized setting at high risk of asthma also demonstrate overgrowth of P. kudriavzevii in 3-month stool samples relative to healthy infants (Figure 1). Overgrowth of P. kudriavzevii in the gut in early life may therefore represent a relevant and widely applicable model of asthma-associated early life gut fungal dysbiosis.

Figure 1. Canadian infants at high risk of asthma demonstrate increased levels of fecal fungi.

Figure 1.

Quantitative (q) PCR quantification (standard curve method) of DNA in feces collected at 3 months of age from infants in the CHILD Cohort Study (control subjects, n = 115; Atopy+Wheeze at age 5 years, n = 12). (a) qPCR quantification of Pichia kudriavzevii DNA. (b) qPCR quantification of all fungal 18S rRNA gene copies. Error bars represent the standard error of the mean and p-values were calculated using a Mann–Whitney test in GraphPad Prism; *p<0.05.

Figure 1—source data 1. qPCR quantification of Pichia kudriavzevii DNA in CHILD Cohort participants.
Figure 1—source data 2. qPCR quantification of fungal DNA in CHILD Cohort participants.

While it has been demonstrated in adult mice that dysbiosis induced by treatment with antibiotic or antifungal agents exacerbates features of allergic airway disease (AAD) following antigen sensitization and challenge during the period of microbial disruption (Skalski et al., 2018; Li et al., 2018; Shao et al., 2019; Wheeler, 2016), neonatal life is a unique period of parallel development and maturation of both the microbiota and immune system. Fungal dysbiosis associated with asthma in neonatal and adult life may therefore differ mechanistically both in terms of the specific microbiota community compositions involved and their immediate and long-term immunological consequences (Barcik et al., 2020). Accordingly, using overgrowth of P. kudriavzevii as a model of fungal dysbiosis, we sought to determine whether fungal dysbiosis in the neonatal period influences asthma outcomes later in life, and to identify which aspects of asthmatic immunopathology are affected.

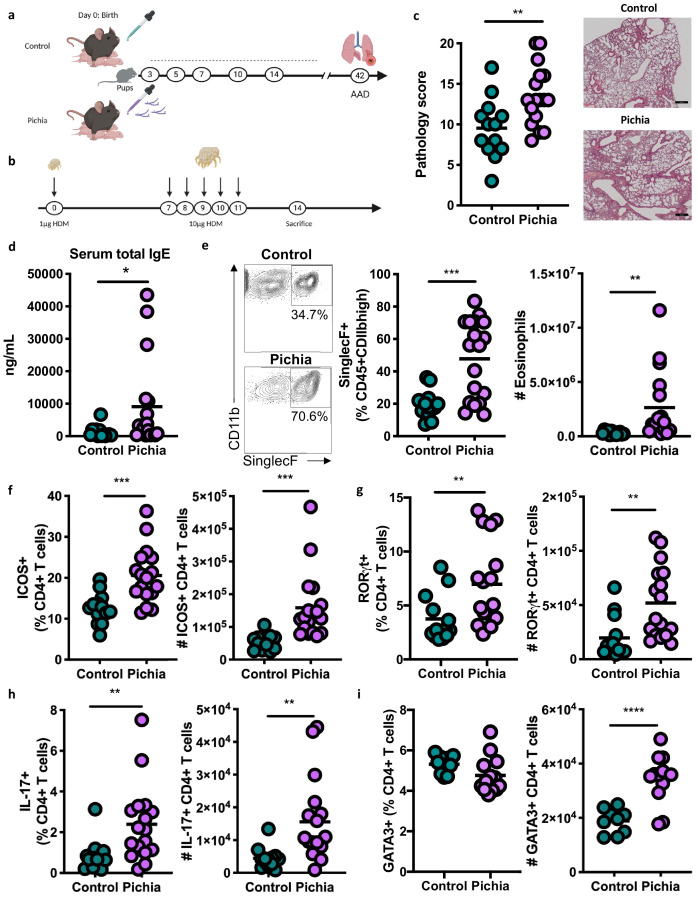
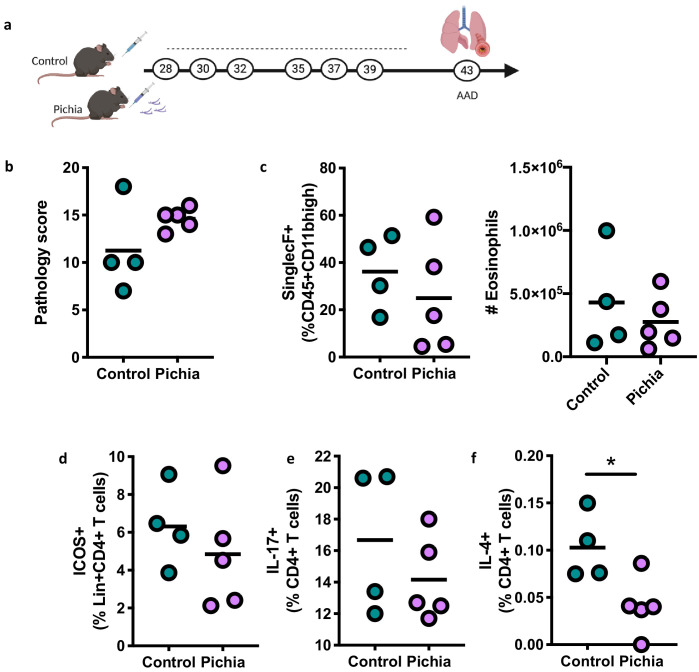
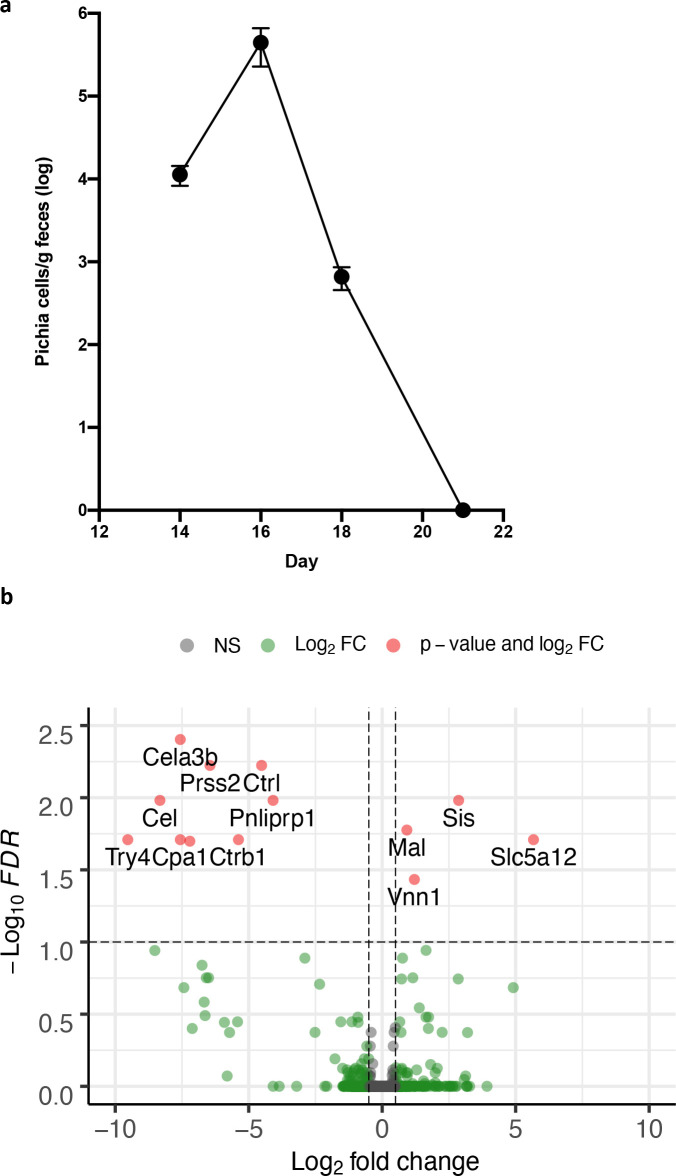
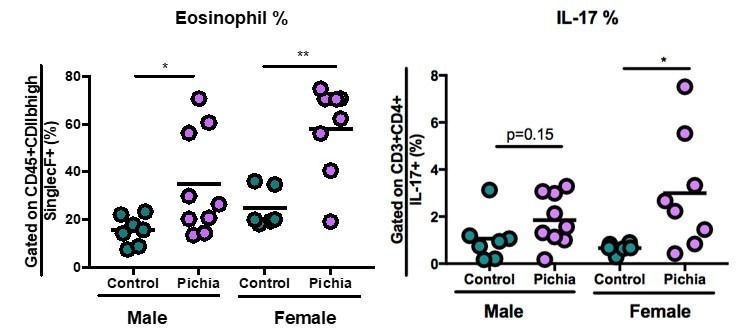
To establish a causal role for early life fungal dysbiosis in asthma etiology and validate previous findings in the ECUAVIDA cohort, we exposed specific-pathogen-free (SPF) mice to P. kudriavzevii during the neonatal period and then used the house dust mite (HDM) model of AAD to induce airway inflammation at 6 weeks of age (Willart et al., 2012; Schuijs et al., 2015Figure 2A,B). Pups were exposed to either P. kudriavzevii suspended in phosphate buffered saline (PBS) or PBS alone by painting the abdomen and face of lactating dams with these respective solutions every second day for 2 weeks following birth. The presence of P. kudriavzevii in the guts of pups born to P. kudriavzevii-treated animals during the 2-week treatment period was confirmed by colony counts from plated colon tissues (Figure 3—figure supplement 1a). Relative to P. kudriavzevii-naïve (control) animals, animals exposed to P. kudriavzevii during the first 2 weeks of life demonstrated increased lung inflammation during AAD later in life, as evidenced by increases in lung histopathology scores, circulating IgE, lung eosinophils, and lung activated T cells expressing inducible co-stimulatory (ICOS) molecule (Figure 2C–F). ICOS expression is associated with IL-4 production (Dong et al., 2001) and Th2 responses (Gonzalo et al., 2001) in the lung and lymph nodes during asthma (Uwadiae et al., 2019). Moreover, ICOS is highly expressed on T follicular helper (Tfh) cells important for driving B cell class switching to IgE (Beier et al., 2004; Reinhardt et al., 2009; Gong et al., 2019), suggesting that P. kudriavzevii-exposed mice demonstrate increased adaptive immunity-driven lung inflammation. P. kudriavzevii-exposed animals also demonstrated an increase in the proportion and numbers of Th17 cells in the lung, identified by RORγthigh expression and IL-17 secretion (Figure 2G–H), and greater numbers of lung GATA3+Th2 cells (Figure 2I). Notably, mice exposed to P. kudriavzevii for 2 weeks in adolescent life (4–6 weeks of age) via oral gavage did not show evidence of increased lung inflammation in the context of HDM-induced AAD (Figure 2—figure supplement 1), highlighting the importance of the previously reported ‘critical window’ of life during which the gut microbiota has the greatest ability to affect immune development relevant to asthma (Arrieta et al., 2015; Stiemsma and Turvey, 2017).

Figure 2. Mice neonatally exposed to Pichia kudriavzevii demonstrate increased inflammatory responses during allergic airway disease later in life.

(a) Experimental procedure for neonatal exposure to P. kudriavzevii (Pichia; numbers indicate days of life) and (b) house dust mite (HDM) model of allergic airway disease (AAD). Dashed lines indicate the period of neonatal exposure in the pups. (c–i) Control and Pichia mice were born to dams treated with either PBS or yeast cells for 2 weeks after giving birth, respectively, and intranasally sensitized and challenged with HDM extract. (c) Lung pathology scores (left; 4–20) and representative images (right; 4× objective). (d) ELISA detection of serum IgE. (e) Representative eosinophil staining (left; pre-gated on single CD45+CD11 bhigh cells), frequency (middle), and total numbers of eosinophils (right) in the lung. (f) Frequencies (left) and numbers (right) of ICOS+ T cells (pre-gated on CD3+CD4+ cells) in the lung. (g) Frequencies (left) and numbers (right) of RORγthigh T cells (pre-gated on CD3+CD4+ cells) in the lung. (h) Frequencies (left) and numbers (right) of IL-17+T cells (pre-gated on CD3+CD4+ cells) in the lung. (i) Frequencies (left) and numbers (right) of GATA3+T cells (pre-gated on CD3+CD4+ cells) in the lung. Data in (c–h) are pooled from three independent experiments each showing the same trends (control n = 13, Pichia n = 17). Data in (i) are pooled from two independent experiments each showing the same trends (control n = 9, Pichia n = 13). Dots represent individual mice and lines indicate the group mean. *p<0.05, **p<0.01, ***p<0.001; unpaired two-tailed Student’s t-test with Welch’s correction.

Figure 2—source data 1. Neonatal exposure lung cell counts.
Figure 2—source data 2. Neonatal exposure serum IgE.
Figure 2—source data 3. Neonatal exposure lung histology scoring.
Figure 2—source data 4. Neonatal exposure lung histology.
Figure 2—source data 5. Neonatal exposure lung pathology.

Figure 2.

Figure 2—figure supplement 1. Adolescent exposure to Pichia kudriavzevii does not alter inflammatory responses during allergic airway disease later in life.

Figure 2—figure supplement 1.

(a) Experimental procedure for adolescent exposure to P. kudriavzevii (Pichia; numbers indicate days of life) and house dust mite (HDM) model of allergic airway disease (AAD). (b–d) Control (n = 4) and Pichia (n = 5) mice were exposed to either PBS or yeast cells, respectively, via oral gavage for 2 weeks beginning at 4 weeks of age (day 28 of life) and intranasally sensitized and challenged with HDM extract according to the protocol in Figure 2b. Dashed lines indicate the period of fungal exposure. (b) Lung pathology scores (4–20). (c) Frequencies (left) of SinglecF+ cells (pre-gated on CD45+CDllbhigh single cells) and total numbers of eosinophils (right) in the lung. (d) Frequencies (left) of ICOS+ T cells (pre-gated on Lineage+CD3+CD4+ cells) in the lung. (e) Frequencies (left) of IL-17+T cells (pre-gated on CD3+CD4+ cells) in the lung. (f) Frequencies (left) of IL-4+T cells (pre-gated on CD3+CD4+ cells) in the lung. Dots represent individual mice and lines indicate the group mean. All results are not significant unless otherwise indicated. *p<0.05; unpaired two-tailed Student’s t-test with Welch’s correction.
Figure 2—figure supplement 1—source data 1. Adolescent exposure lung cell counts.
Figure 2—figure supplement 1—source data 2. Adolescent exposure histology scoring.

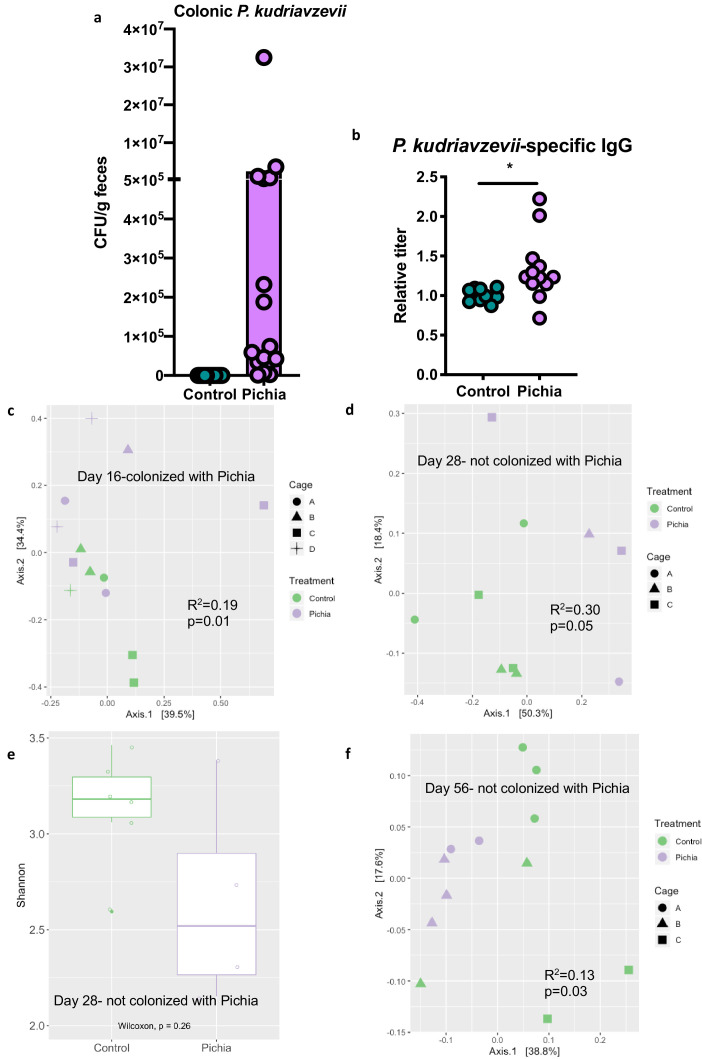
To further characterize fungal colonization in our model, we plated colon contents or fecal samples from pups born to P. kudriavzevii-treated dams immediately before and after weaning, when the gut microbiota is known to undergo dramatic shifts in community composition (Al Nabhani et al., 2019). Colony counts at days 16 (Figure 3A) and 21 (no colonies present) of life revealed that although levels were highly variable, P. kudriavzevii colonized the guts of pups born to dams treated with this yeast until at least 2 days after the final treatment, but was no longer present in the gut microbiota after pups were weaned on day 19 of life. Thus, pups were only colonized during the period when they were co-housed with dams and littermates, indicating that persistent exposure is required to maintain colonization (Figure 3—figure supplement 1a). This transient fungal colonization in early life has been previously described (Fan et al., 2015) and closely mimics the human condition wherein gut fungal populations decline over time in early life (Schei et al., 2017; Kondori, 2019) and may or may not stably colonize the adult gut (Nash et al., 2017; Auchtung et al., 2018) as a result of increasingly anaerobic conditions and colonization resistance, among other factors. The absence of robust fungal communities in these animals at 4 and 8 weeks of age was verified by assessing for the presence of fungi in DNA isolated from fecal samples using high-throughput sequencing and primers targeting the internal transcribed spacer region (ITS-2) of the fungal 18S rRNA gene (sequencing files generated <1 Mb of raw data per sample).

Figure 3. Mice transiently colonized with Pichia kudriavzevii in neonatal life mount an immune response to this yeast and exhibit persistent alterations to their gut bacterial populations.

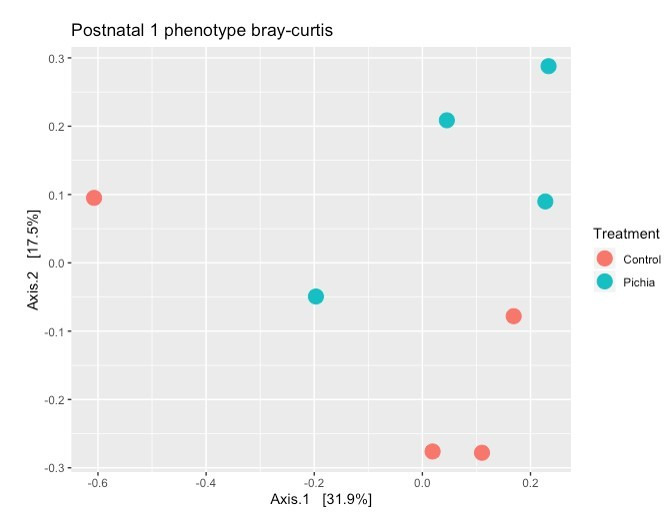
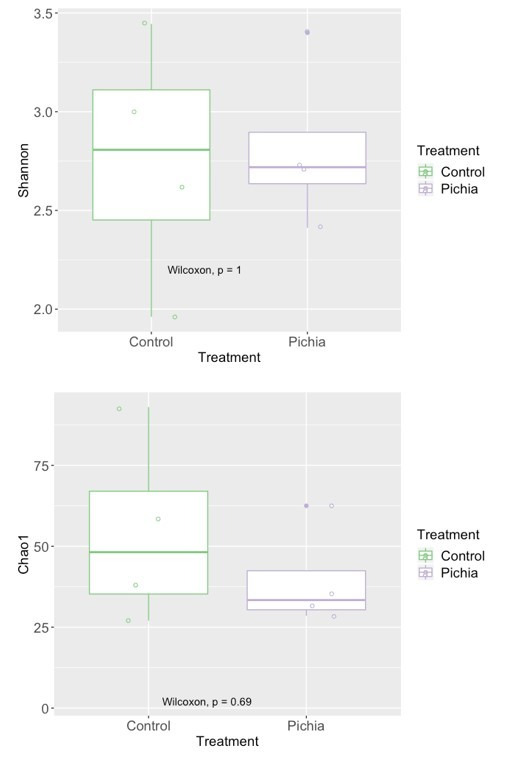
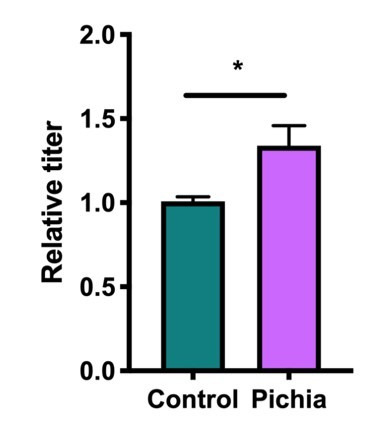
(a–c) Mice neonatally exposed to PBS (control) or P. kudriavzevii (Pichia) via suckling during the first 2 weeks of life were sacrificed at day 16 of life to assess for colonization by P. kudriavzevii or on day 28 of life for immunophenotyping. (a) Colony counts of P. kudriavzevii in colon tissues isolated from 16-day-old mice. (b) ELISA detection of serum P. kudriavzevii-specific IgG depicted as optical density (OD) absorbance value relative to controls sacrificed on day 28 of life. (c) Principal coordinate analysis (PCoA) plot based on Bray-Curtis Dissimilarity distances from 16S rRNA gene sequencing data from colonic contents collected at 16 days of age (control n = 6; Pichia n = 7). (d) PCoA plot based on Bray-Curtis Dissimilarity distances and (e) alpha diversity (Shannon index) derived from 16S rRNA gene amplicon sequencing data from fecal samples collected at 4 weeks of age (day 28) from mice treated as described in Figure 2a (control n = 6; Pichia n = 4). (f) PCoA plot based on Bray-Curtis Dissimilarity distances from 16S rRNA gene sequencing data from fecal samples collected at sacrifice (day 56) for animals treated as described in Figure 2a (control n = 7; Pichia n = 5). Mice in (f) were siblings of mice in (c–e). Data in (a) are pooled from three independent experiments each showing the same trends (control n = 15, Pichia n = 16). Data in (b) are pooled from two independent experiments each showing the same trends (control n = 9, Pichia n = 12). (c–f) Data are representative of at least two independent experiments each showing the same trends. Colors indicate treatment and shapes indicate different cages within each treatment condition. Fungal colonization status (presence/absence of Pichia in the gut) is indicated in each panel. (c, d, and f) p-values determined by PERMANOVA and corrected for cage effects. Dots represent individual mice. *p<0.05; unpaired two-tailed Student’s t-test with Welch’s correction.

Figure 3—source data 1. Neonatal exposure colony counts.
Figure 3—source data 2. Neonatal exposure Pichia-specific IgG.
Figure 3—source data 3. Neonatal exposure colony counts.
Figure 3—source data 4. Neonatal exposure colony counts.

Figure 3.

Figure 3—figure supplement 1. Mice neonatally exposed to Pichia kudriavzevii are transiently colonized and mount an immune response in the gut.

Figure 3—figure supplement 1.

(a) Colony counts of Pi.kudriavzevii (Pichia) in fecal samples collected on day 14 (n = 7), day 16 (n = 10), day 18 (n = 15), and day 21 (n = 15) from pups neonatally exposed to P. kudriavzevii via suckling during the first 2 weeks of life. Error bars represent SEM and dots represent the mean. (b) Volcano plot demonstrating genes with altered gene expression in the colons of mice neonatally exposed to P. kudriavzevii via suckling during expression in the colons of mice neonatally exposed to P. kudriavzevii via suckling during the first 2 weeks of life relative to mice exposed to vehicle alone. X-axis indicates log2 fold change in expression and y-axis indicates -log10 of the associated p-value corrected by the FDR method. NS: not significant. FC: Fold change.
Figure 3—figure supplement 1—source data 1. Pichia colonization time course.

Figure 3—figure supplement 2. Gut bacterial populations from mice neonatally exposed to Pichia kudriavzevii in PBS or PBS alone are faithfully transplanted into germ-free mice.

Figure 3—figure supplement 2.

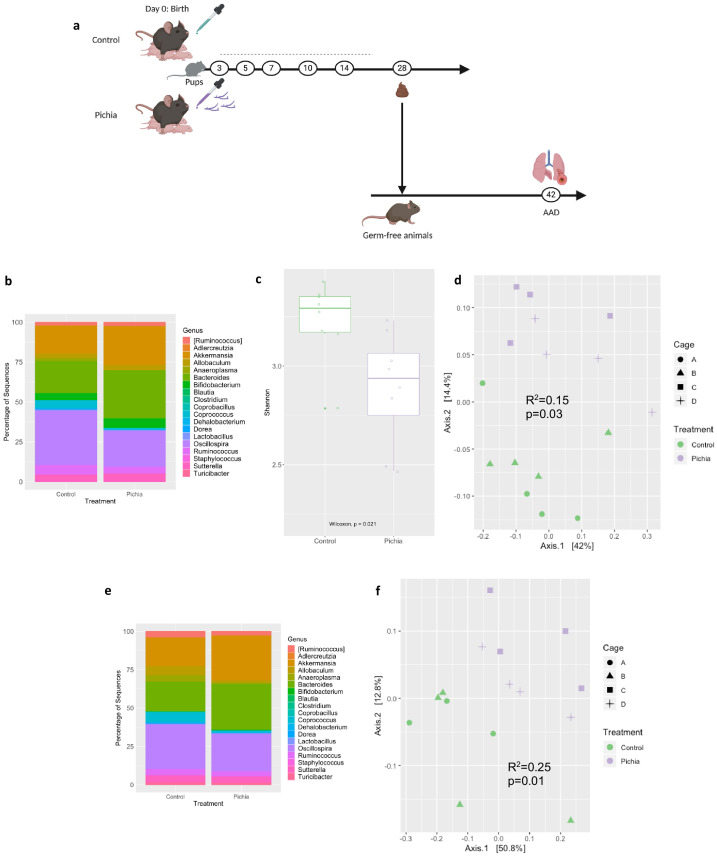
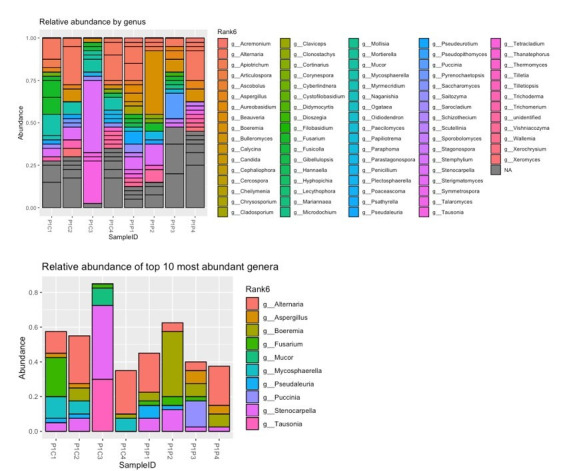
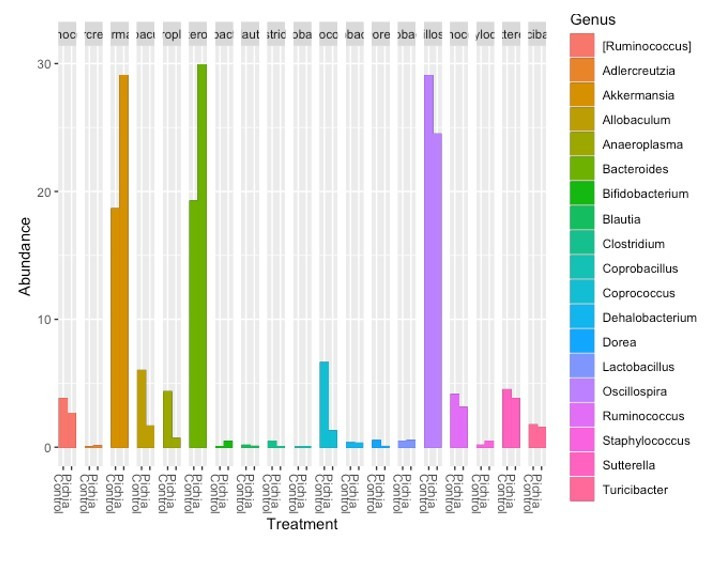
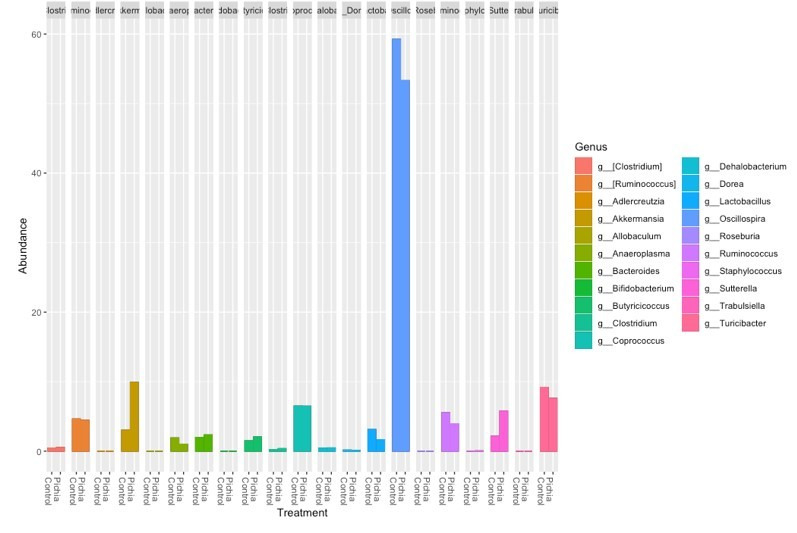
(a–f) Bacterial microbiota of germ-free mice given a fecal transplant with samples collected at day 28 from mice treated as described in Figure 2a. (a) Experimental design (numbers indicate days of experimental timeline beginning from birth of donor mice). (b) Relative abundances of the bacterial genera found in fecal samples collected 2 weeks following the fecal transplant based on 16S sequencing data (control [n = 8] and Pichia [n = 8]). (c) Alpha diversity (Shannon index) and (d) principal coordinate analysis (PCoA) plot based on Bray-Curtis Dissimilarity distances and derived from 16S rRNA gene amplicon sequencing data from fecal samples described in b. Colors indicate treatment and shapes indicate different cages within each treatment condition. (e) Relative abundances of the bacterial genera identified in fecal samples collected 4 weeks following the fecal transplant (at sacrifice) based on 16S rRNA gene sequencing data and after merging 16S amplicon sequence variants to genus level (control [n = 7] and Pichia [n = 8]). (f) PCoA plot based on Bray-Curtis Dissimilarity distances and derived from 16S rRNA gene amplicon sequencing data from fecal samples described in e. (d and f) p-values determined by PERMANOVA and corrected for cage effects. AAD: allergic airway disease.

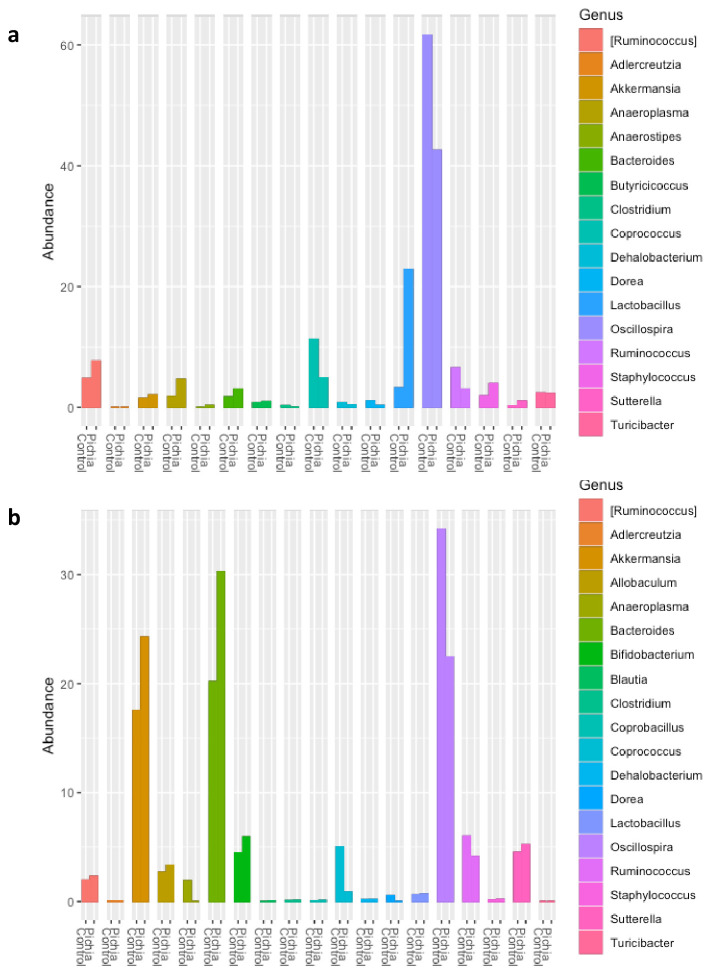
Figure 3—figure supplement 3. Relative abundance of the bacterial genera identified in fecal samples based on 16S rDNA amplicon sequencing from (a) 4-week-old mice (day 28) described in Figure 2a and (b) ex-germ-free mice given a fecal transplant as described in Figure 3—figure supplement 1a 2 weeks after the fecal transplant.

Figure 3—figure supplement 3.

Figure 3—figure supplement 4. Changes to gut bacteria resulting from neonatal colonization with Pichia kudriavzevii are not responsible for increased lung inflammation observed during allergic airway disease later in life.

Figure 3—figure supplement 4.

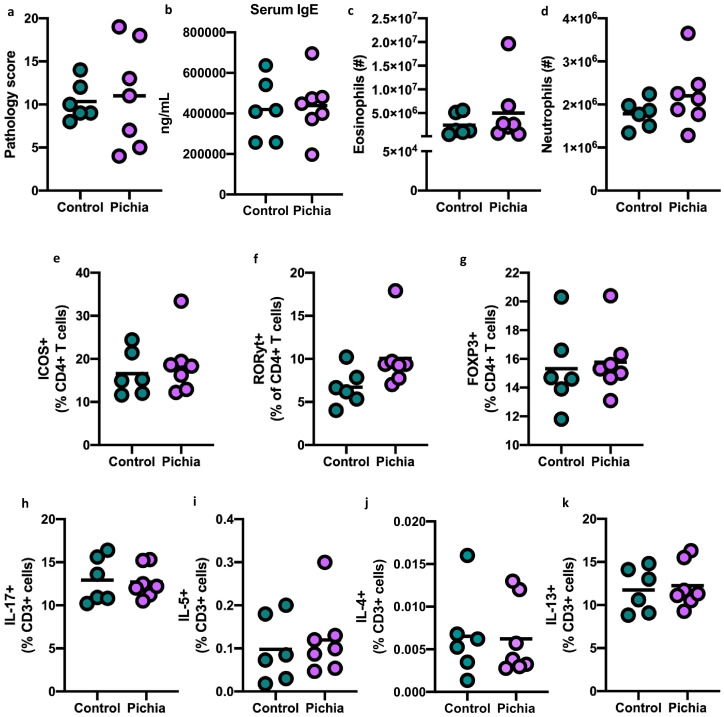
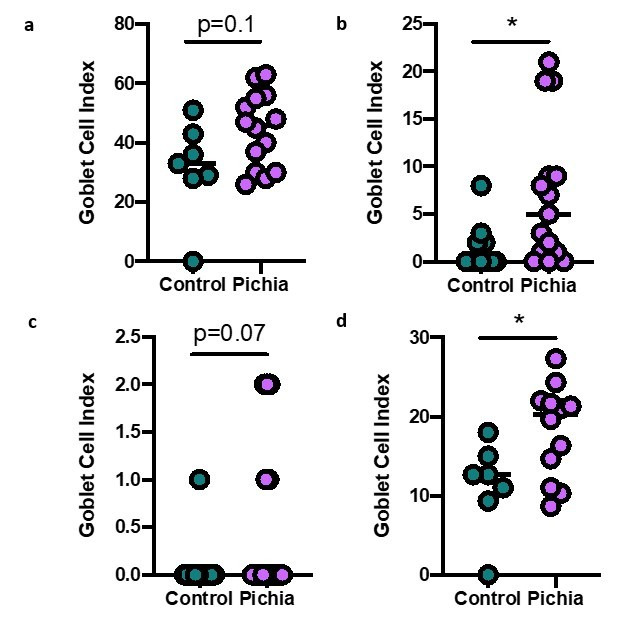
(a–k) Severity of allergic airway disease (AAD) induced following the procedure in Figure 2b with house dust mite does not differ in germ-free mice given a fecal transplant with samples collected at day 28 from mice in Figure 2a (control [n = 6] and Pichia [n = 7]). (a) Lung pathology scores (4–20). (b) ELISA detection of serum IgE. (c and d) Total numbers of SinglecF+CD45+CDllbhigh eosinophils (c) and Gr1+CD45+CDllb+ neutrophils in the lung (d). (e–g) Frequencies of ICOS+ CD4 T cells (e), RORγthigh CD4 T cells (f), and FOXP3+CD4 T cells (g) pre-gated on CD3+CD4+ cells in the lung. (h–k) Frequencies of IL-17+T cells (h), IL-5+T cells (i), IL-4+T cells (j), and IL-13+T (k) cells (pre-gated on CD3+) in the lung. Dots represent individual mice and lines indicate the group mean. No statistical differences between groups were identified by unpaired two-tailed Student’s t-test with Welch’s correction.
Figure 3—figure supplement 4—source data 1. Germ-free mice lung cell counts.
Figure 3—figure supplement 4—source data 2. Germ-free mice serum IgE.

Despite the absence of P. kudriavzevii in the gut past weaning, animals neonatally exposed to this yeast demonstrate increased levels of circulating P. kudriavzevii-specific IgG at 4 weeks of age and altered expression of a number of chymotrypsin-related genes previously associated with antigen-presenting immune cell function (Naujokat et al., 2007; Chiba et al., 2014), indicating that these animals mounted an immune response to this organism during the period of colonization (Figure 3B; Figure 3—figure supplement 1b). More specifically, RNA-sequencing analysis of colons from 16-day-old mice neonatally exposed to P. kudriavzevii demonstrated downregulated expression of Try4, Cel, Cpa1, Cela3b, Cela2a, Prss2, Pnliprp1, Ctrl, and Ctrlb1 relative to P. kudriavzevii-naïve animals. Many of these genes have been implicated in immune functions related to bridging innate and adaptive immunity, including dectin-1-mediated signaling in dendritic cells (Chiba et al., 2014). Dectin-1 is a surface protein that plays an important role in sensing fungal β-glucan moieties (Iliev et al., 2012; Goodridge et al., 2011), suggesting a potential link between altered immunological function in the gut at the time of colonization with later HDM outcomes.

Non-bacterial microbes within the gut microbiota, even as transient colonizers, can dramatically and enduringly alter gut bacterial communities (Martínez et al., 2018; Mason et al., 2012; Nieves-Ramirez, 2018), and disruptions to gut bacterial populations have previously been linked to more severe asthma in the context of antibiotic-induced overgrowth of Candida albicans within the gastrointestinal tract (Shao et al., 2019; Noverr et al., 2004; Noverr and Huffnagle, 2005). Thus, we next examined whether early life exposure to P. kudriavzevii alters asthma-associated gut bacterial populations. Bacterial populations of P. kudriavzevii-exposed and -naïve mice separated according to treatment condition by principal component analysis based on Bray-Curtis Dissimilarity on day 16 of life (p=0.01; Figure 3C), and these differences persisted beyond the period of fungal colonization into adulthood (Figure 3D–F). Adult germ-free mice repopulated with colonic contents from 4-week-old SPF P. kudriavzevii-exposed animals (no longer containing P. kudriavzevii but with bacterial dysbiosis present; Figure 3—figure supplement 2, Figure 3—figure supplement 3), however, did not exhibit increased allergic airway inflammation following HDM sensitization and challenge relative to germ-free animals repopulated with colonic contents from P. kudriavzevii-naïve animals (Figure 3—figure supplement 4). These data indicate that actual presence of P. kudriavzevii, rather than differences in the gut bacterial populations at the time of AAD induction in P. kudriavzevii-exposed animals, is essential to the observed increase in severity of airway inflammation in conventional P. kudriavzevii-exposed animals.

As neonatal exposure to P. kudriavzevii itself seems to exacerbate AAD later in life, we investigated how the infant gut niche influenced its tractability to fungal colonization. Little is known about the growth characteristics of P. kudriavzevii, but it has been observed to form pseudohyphae under certain conditions (Kurtzman, 1998; Oberoi et al., 2012). C. albicans, an opportunistic-pathogenic yeast previously demonstrated to be associated with exacerbated AAD in the context of bacterial dysbiosis (Skalski et al., 2018; Kurtzman, 1998), requires hyphal formation for efficient epithelial cell adhesion (Dalle et al., 2010; Matsubara et al., 2016), which is inhibited by the presence of bacterial derived SCFAs (Noverr and Huffnagle, 2004) and other organic acids (Cottier et al., 2015). Furthermore, a reduced abundance of SCFA-producing Clostridiales within the neonatal gut microbiota has been linked to impaired colonization resistance to pathogens (Kim et al., 2017), including fungi (Fan et al., 2015). Given that SCFAs have also been demonstrated to protect against asthma development and to be reduced in abundance in stool from infants at risk of asthma in Ecuador (in conjunction with fungal dysbiosis), the CHILD cohort, and other birth cohorts (Roduit et al., 2019; Trompette et al., 2014; Thorburn et al., 2015; Arrieta et al., 2015; Cait et al., 2018; Arrieta et al., 2018), we next investigated whether the asthma-protective effects of SCFAs could be mediated in part via their ability to prevent colonization of the infant gut by asthma-associated fungi.

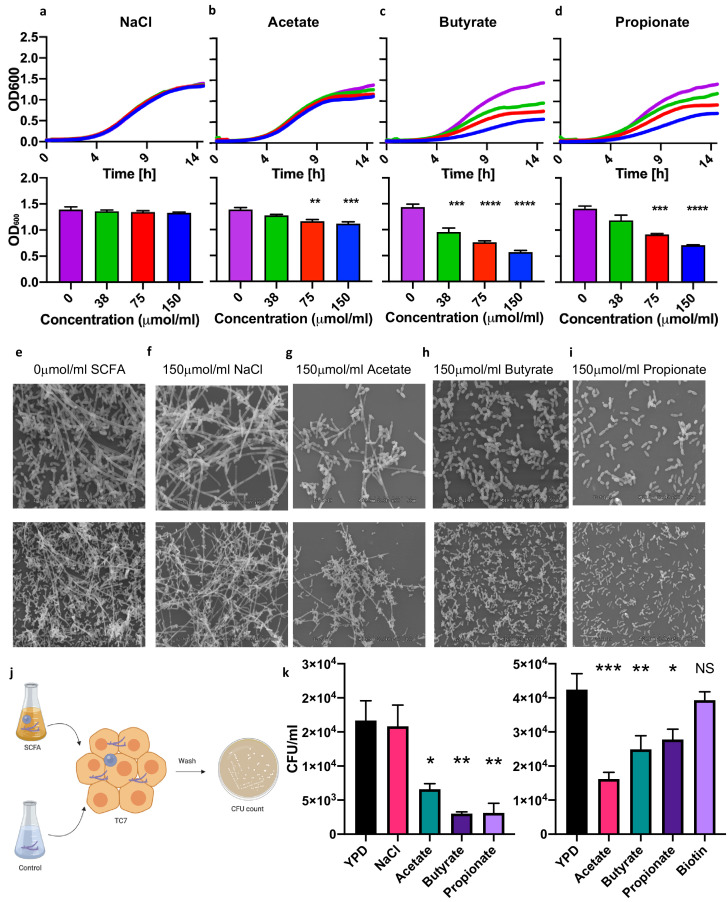
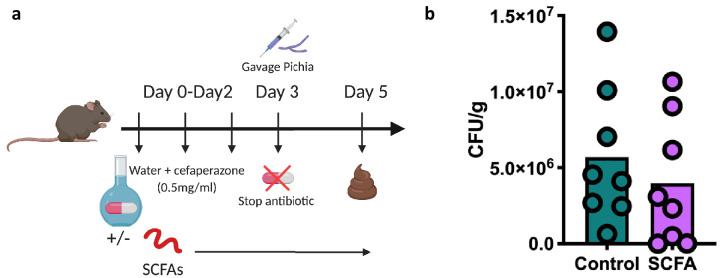
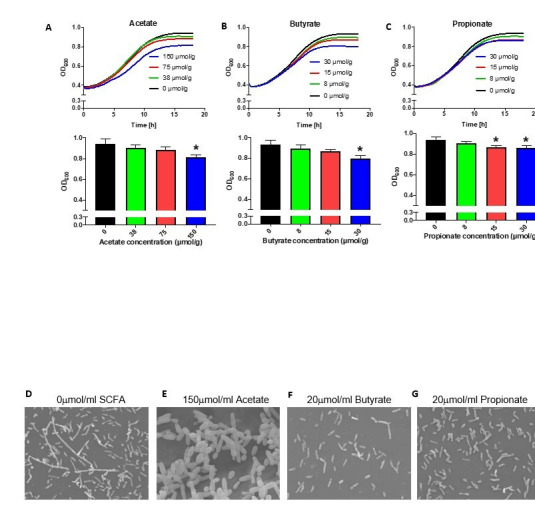
We cultured P. kudriavzevii in the presence of physiologically relevant concentrations of acetate, butyrate, and propionate (Arrieta et al., 2018; Arrieta et al., 2018) at colonic pH 6.5 (Nugent, 2001) and observed that the presence of these molecules in the growth medium inhibits the growth of P. kudriavzevii (Figure 4A–D). SCFA-associated growth inhibition was accompanied by decreased pseudohyphae formation by P. kudriavzevii, as observed by scanning electron microscopy (Figure 4E–I). Pseudohyphae formation and its importance for gut colonization have not been previously reported in the context of commensal P. kudriavzevii, so we next interrogated whether this phenotype is required for colonization within the gut. P. kudriavzevii was pre-cultured in growth medium supplemented with acetate, butyrate, or propionate and its adherence to TC7 intestinal epithelial cells was measured. P. kudriavzevii cells grown in the presence of SCFAs demonstrate an impaired ability to adhere to these cells, with propionate and butyrate again having the most potent effects (Figure 4K). Furthermore, mice supplemented with a cocktail of SCFAs in their drinking water exhibited a trend toward reduced colonization with P. kudriavzevii following antibiotic treatment and fungal oral gavage (Figure 4—figure supplement 1). These findings indicate that commensal bacterial-derived SCFA production in early life may, in addition to having previously documented direct beneficial immunomodulatory and asthma-protective effects (reviewed in Dang and Marsland, 2019), prevent colonization of the infant gut by commensal fungi that have harmful asthma-associated immunomodulatory properties.

Figure 4. Short-chain fatty acids inhibit the growth of Pichia kudriavzevii.

(a–d) Growth over time (top; mean of three biological replicates) and optical density (OD) at 600 nm at 15 hr (bottom) of P. kudriavzevii grown in yeast peptone dextrose (YPD) broth supplemented with sodium chloride (a) or the sodium salts of the short-chain fatty acids (SCFA) acetate (b), butyrate (c), or propionate (d) at the indicated biologically relevant concentrations (shown in units equivalent to μmol/g stool). (e–i) Scanning electron microscopy of P. kudriavzevii grown in YPD (e) or 150 μmol/mL of sodium chloride (NaCl) (f) or the sodium salts of acetate (g), butyrate (h), or propionate (i) at high (top) and low (bottom) magnification. (j) Epithelial cell adhesion assay experimental setup for (k). (k) Colony counts (colony forming units; CFU) of P. kudriavzevii pre-cultured in the presence of solutions described in (e–i) adherent to TC7 cells after 2 hr (left) and of P. kudriavzevii pre-cultured in the presence of the short-chain fatty acids (SCFA) acetate (150 μmol/mL), butyrate (30 μmol/mL), or propionate (30 μmol/mL) at biologically relevant molar ratios (shown in units equivalent to μmol/g stool) or biotin (10 mg/L) adherent to TC7 cells after 2 hr (right). (a–d and k) Data represent results from four independent experiments performed in triplicate. Dots represent biological replicates and unless otherwise stated, data are presented as mean ± SEM. Statistical comparisons are relative to SCFA-free controls. *p<0.05, **p<0.01, ***p<0.001, NS: not significant; ANOVA with Tukey’s post hoc test.

Figure 4—source data 1. SCFA growth curve.
Figure 4—source data 2. SCFA growth curve.
Figure 4—source data 3. SCFA growth curve.
Figure 4—source data 4. SCFA growth curve.
elife-67740-fig4-data4.xlsx (326.2KB, xlsx)
Figure 4—source data 5. SCFA growth curve.
elife-67740-fig4-data5.xlsx (332.7KB, xlsx)
Figure 4—source data 6. SCFA growth curve.
elife-67740-fig4-data6.xlsx (213.6KB, xlsx)
Figure 4—source data 7. SCFA growth curve.
elife-67740-fig4-data7.xlsx (284.9KB, xlsx)
Figure 4—source data 8. SCFA growth curve.
Figure 4—source data 9. SCFA growth curve.

Figure 4.

Figure 4—figure supplement 1. Mice supplemented with short-chain fatty acids (SCFAs) exhibit reduced colonization by Pichia kudriavzevii.

Figure 4—figure supplement 1.

(a and b) Experimental design (a) and colony counts (b) in fecal samples collected from animals given an oral gavage of P. kudriavzevii 48 hr previously and maintained on regular (control; n = 15) or SCFA-supplemented (SCFA; n = 16) water. (b) Data represent results from two independent experiments each showing the same trends. Dots represent individual mice.
Figure 4—figure supplement 1—source data 1. SCFA supplementation colonization.

Herein, we have demonstrated a causal relationship between overgrowth of the commensal yeast P. kudriavzevii in the neonatal gastrointestinal tract and an increase in inflammation during AAD induced later in life, with involvement of both type-2 and type-17 inflammatory pathways. C. albicans, as well as P. kudriavzevii, are frequently found within the gastrointestinal tract but are also opportunistic pathogens blurring the line between commensal and pathogen (Douglass et al., 2018; Shao et al., 2019). Thus, host immune responses elicited by these microbes, particularly in early life and in the context of a disrupted gut bacterial microbiota, may have long-term consequences for immune-related diseases later in life. The immunological consequences of overgrowth of P. kudriavzevii in the neonatal gut are likely not exclusive to this organism. Overgrowth of different fungi, however, may result in subtle differences in the associated ecological and immune effects observed in the host. Mechanistically, early life fungal dysbiosis in the gut may drive long-lasting immune changes in the host through metabolite- or surface antigen-mediated (Quintin et al., 2012; Netea et al., 2011) influences on the early development of lymphoid organs (Zhang et al., 2016), innate, and/or adaptive immune cells. For instance, early exposures to fungi may modulate asthma-relevant immunity through the generation of memory immune cells in the gut that cross-react with common allergens such as HDM encountered in the lung. A similar phenomenon has recently been reported in human adults, wherein C. albicans-specific Th17 cells generated in the gut cross-react with airborne Aspergillus fumigatus to contribute to pathological airway inflammation during acute allergic bronchopulmonary aspergillosis (Bacher et al., 2019).

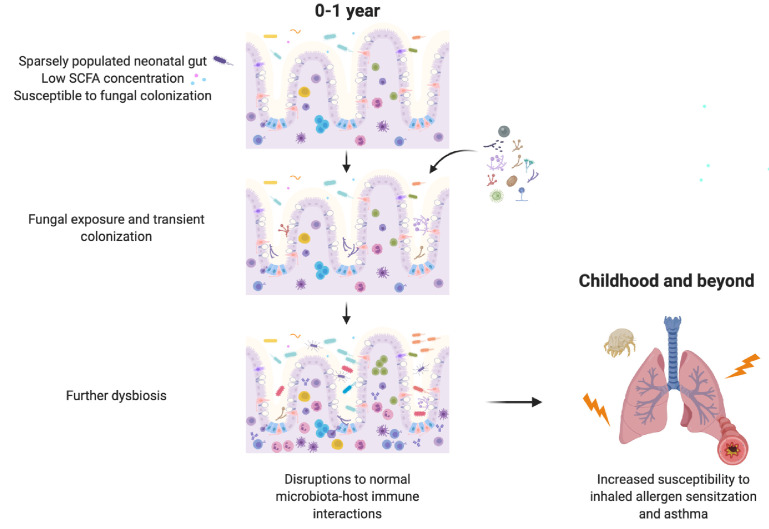
We also show that SCFAs, bacterial metabolites with direct immunomodulatory effects on the host, can inhibit the growth and morphology of asthma-associated fungi in a manner that has important functional consequences for gut colonization and subsequent immunomodulation. Taken together, our results suggest that gut bacterial communities with a reduced capacity for SCFA production create conditions permissive to invasion by transient fungal colonizers. In the neonatal gut, transient fungal colonization, in turn, may either directly or indirectly, through disruption to the normal temporal succession of neonatal gut microbiota communities required for appropriate immune development, further alter immune development and susceptibility to asthma (Figure 5). These data highlight the importance of inter-kingdom interactions in determining microbiota-associated asthma outcomes and reveal a novel role for bacterial-derived SCFAs in protecting against asthma.

Figure 5. Schematic summary of the hypothesized sequence of events by which early life gut fungal dysbiosis associated with increased susceptibility to asthma in childhood occurs.

Figure 5.

Materials and methods

Quantitative PCR

DNA was isolated from 123 stool samples collected at 3 months of age from a subset of subjects in the CHILD Cohort Study and selected based on stool and 16S rRNA gene sequencing data availability from the same sample or subject (samples for 16S rDNA sequencing were selected as previously described [Boutin et al., 2020]). All samples had a minimum DNA yield of 8 ng/µL following the DNA extraction. DNA was extracted from frozen stool samples using the Qiagen QIAmp PowerFecal DNA extraction kit according to the manufacturer’s instructions. Total fungal load was assessed using the FungiQuant quantitative PCR (qPCR) assay on all samples submitted for ITS-2 rDNA gene sequencing (Liu et al., 2012). Specifically, sample DNA concentrations were determined by Qubit analysis and concentrations were normalized to 1 ng/µL, 10 ng/µL, or 100 ng/µL. 2 µL of template DNA was added to a reaction mixture containing iTaq Universal Probes Supermix (BIO-RAD), H2O, FAM probe (1 µM; Applied Biosystems), forward primer (10 µM; GGRAAACTCACCAGGTCCAG), and reverse primer (10 µM; GSWCTATCCCCAKCACGA) for a total reaction volume of 10 µL. This assay uses primers specific for the more highly conserved 18S rRNA gene of the fungal genome, which exhibits less length variability than the ITS-2 region and is therefore more suitable for qPCR assays. Reactions were run in duplicate at standard ramp speed, and qPCR was performed using the following cycling protocol: an initial enzyme activation step at 95°C for 2 min followed by 45 cycles of a denaturation (95°C for 15 s) step and then a combined annealing/extension step (60°C for 1 min). Amplicon DNA concentration was determined using a standard curve generated using 10-fold dilutions of a 0.1 ng/µL stock of 18S rRNA gene amplicons purified from a PCR reaction completed using the FungiQuant primers and purified Candida parapsilosis template DNA. C. parapsilosis template DNA was extracted from a pure culture of C. parapsilosis (ATCC 22019) grown at 30°C for 24 hr using the Quick-DNA Fungal/Bacterial Microprep Kit (Zymo Research) kit.

Total P. kudriavzevii load in CHILD samples and DNA isolated from mouse fecal samples or colon contents was assessed using previously validated qPCR primers specific for this yeast (Heisel, 2015; Carvalho et al., 2007). 2 µL of template DNA described above was added to a reaction mixture containing QuantiNova SYBR Green master mix (Qiagen), Rox reference dye (Qiagen), H2O, forward primer (Heisel, 2015) (10 µM; CTGGCCGAGCGAACTAGACT), and reverse primer (Carvalho et al., 2007) (10 µM; TTCTTTTCCTCCGCTTATTGA) for a total reaction volume of 10 µL. This primer combination was selected based on its high efficiency, as calculated using a standard curve of P. kudriavzevii DNA, and ability to specifically target P. kudriavzevii at cycle threshold values below 30. This assay uses primers which target a P. kudriavzevii-unique sequence within the ITS-2 region. Reactions were run in duplicate and qPCR using the following cycling protocol: activation at 95°C for 2 min followed by 40 cycles of denaturation (95°C for 5 s) and annealing/extension (60°C for 30 s). Cycling was performed at max/fast ramp rate. All qPCR reactions were performed on a 7500 Fast Real-Time System (Applied Biosystems, Foster City, Calif) machine and three negative controls were included on each plate. For the CHILD study samples, P. kudriavzevii DNA concentration was determined using a standard curve generated using 10-fold dilutions of a 1 ng/µL stock of 18S amplicons purified from a PCR reaction completed using the mentioned primers and purified P. kudriavzevii. P. kudriavzevii (ATCC 6258) was grown at 30°C for 24 hr using the Quick-DNA Fungal/Bacterial Microprep Kit (Zymo Research) kit.

Any samples with a large discrepancy between duplicate readings were re-run in triplicates. All samples were standardized to 10 ng/µL of total DNA for final comparative analysis. If DNA was not detected or the threshold value (Ct) was above the negative controls, the sample was considered to have no fungal DNA present. Any quantity of DNA detected in the negative controls was subtracted from all samples of the corresponding plate.

CHILD Cohort Study case definition

Based on previously described definitions of cases and controls (Arrieta et al., 2018), subjects with ‘Atopy+wheeze’ were defined as those who wheezed in the past 12 months and had a positive skin prick test (sensitization/atopy) at age 5. Controls are those with no wheeze ever and no atopy at age 5 years. IgE-mediated allergic sensitization (atopy) was diagnosed based on skin prick testing to multiple common food and environmental inhalant allergens, using ≥2 mm average wheal size as indicating a positive test relative to the negative control (glycerin). Wheeze was assessed at age 5 years according to the Child Health Questionnaire or clinical assessment (Subbarao et al., 2015).

The CHILD Cohort Study protocols were approved by the human clinical research ethics boards at all universities and institutions directly involved with the CHILD cohort (McMaster University, University of British Columbia, the Hospital for Sick Children, University of Manitoba, and University of Alberta).

Mice

C57BL/6J SPF mice (Jackson Laboratories, Bar Harbor, ME) were maintained in the Modified Barrier Facility at the University of British Columbia on a 12 hr light/dark cycle and provided with food and water ad libitum. Dams were maintained on a breeder diet and pups received normal chow after weaning. Germ-free mice were maintained in the Center for Disease Modeling at the University of British Columbia and housed in a cage-in-a-cage isolator system for the duration of the experiment. All experiments were in accordance with the University of British Columbia Animal Care Committee guidelines and approved by the UBC Animal Care Committee.

Neonatal exposure to P. kudriavzevii or PBS

Glycerol stocks of 2 × 10⁷ P. kudriavzevii (ATCC 6258) cells were prepared from 48 hr cultures generated from a single colony inoculated into YPD broth shaking at 37°C. Immediately prior to use, cells were spun at 6000 × g for 5 min at 4°C and resuspended in 250 μL PBS (GE Healthcare Life Sciences). On days 3, 5, 7, 10, and 14 after giving birth, dams bred in-house or ordered directly from Jackson laboratories at day E15–17 of gestation were treated with P. kudriavzevii in PBS or PBS alone by scruffing the animal and using a P1000 pipette to gently apply 250 μL of solution to the abdomen and face region. Once pups reached 6 weeks of age, AAD was induced in these animals.

Adolescent exposure to P. kudriavzevii or PBS

Four-week-old mice were given an oral gavage with 106 cells of P. kudriavzevii suspended in PBS or PBS alone 30 min following an oral gavage with a 5% sodium bicarbonate solution on days 0, 2, 4, 7, 9, and 11. On day 15, AAD was induced in these animals.

HDM-induced AAD

AAD was induced in 6-week-old animals as previously described (Willart et al., 2012; Schuijs et al., 2015). Briefly, animals were anesthetized with 3% isoflurane and sensitized with 1 μg of HDM protein (Greer Laboratories) in 40 μL of PBS by the intranasal route using a P200 pipette on day 0. Mice were subsequently anesthetized and intranasally challenged on 5 consecutive days 1 week later (days 7–11 of the model, inclusive) with 10 μg HDM protein in 40 μL of PBS. Three days after the final challenge (day 14 of the model), animals are sacrificed by intraperitoneal injection of 500 mg/kg tribromoethanol (Avertin; Sigma) and cervical dislocation.

Isolation of lung immune cells

Lung tissues were excised and placed in complete RPMI (Gibco) supplemented with 10% fetal bovine serum (Gibco), 50 U/mL penicillin/streptomycin (Gibco), 1 mM sodium pyruvate (Gibco), 1× Minimum Essential Medium nonessential amino acids (Gibco), and 1× Glutamax (Gibco) until processed. Tissues were then cut into pieces using razor blades and shaken at 37°C for 45 min in 1× PBS with calcium and magnesium (GE Healthcare Life Sciences or Gibco) containing 5% (v/v) fetal bovine serum (Gibco) and 0.5 mg/mL Collagenase (Sigma catalog #C2139). Tissues were vortexed every 15 min during this tissue digestion step. Digested cells were passed through a pre-wetted 70 μM filter into ice-cold 1× PBS. Cells were collected by centrifugation at 4°C for 10 min at 800 × g and then red blood cells were lysed using ammonium–chloride–potassium lysing buffer (Gibco). A hemocytometer and trypan blue staining were then used to manually count the isolated cells. Cells were normalized to an equal quantity among all samples prior to staining for flow cytometry.

Flow cytometry and antibodies

Surface staining for flow cytometry was done in column buffer (2 mM EDTA [Millipore], 10 mM HEPES [GE Healthcare Life Sciences Life Sciences], 5% [v/v] fetal bovine serum in PBS without calcium and magnesium) for 20 min at 4°C. After staining, cells were washed twice with column buffer, fixed overnight in a 1:1 fix solution of column buffer: 4% paraformaldehyde, and washed prior to running flow cytometry. For intracellular cytokine staining, cells were stimulated for 8–12 hr with a Cell Stimulation Cocktail plus protein transport inhibitors (eBiosciences) at 4°C. Intracellular staining was done after fixing and permeabilizing cells using Perm/Fix buffer (eBiosciences) overnight at 4°C or for 1 hr at room temperature. Cells were then washed and stained in a Perm/Buffer wash solution (eBiosciences) for 30 min at 4°C. Cells were then washed twice with the Perm/Buffer wash before being resuspended in column buffer. Flow cytometry data for conventional mouse experiments were collected with a BD LSRII-561 and analyzed with FlowJo (Version 10) software. Flow cytometry data for the germ-free experiment was collected on an Invitrogen Attune NxT or CytoFLEX (Beckman Coulter) machine. See Table 1 for antibodies used in this study. Single stain and Fluorescence Minus One controls were used for gating.

Table 1. Anti-mouse flow cytometry antibodies used in this study.

Cell marker Fluorophore Source Clone
 CD3 eFluor450 eBioscience 17A2
 CD4 PerCP-Cy5.5 TONBO biosciences RM4-5
 CD4 FITC TONBO biosciences RM4-5
 FOXP3 PE eBioscience FJK-16s
 RORγt APC eBioscience B2D
 ICOS FITC eBioscience 7E.17G9
 GATA3 PE-Cy7 eBioscience TWAJ
 CD11b eFluor450 eBioscience M1/70
 CD11b APC eBioscience M1/70
 CD11c eFluor450 eBioscience N418
 F4/80 FITC eBioscience BM8
 CD45 PerCPCy5.5 eBiosceicne 30-F11
 SinglecF PE BD Biosciences E50-2440
 GR-1 PE-Cy7 eBioscience RB6-8C5
 IL-13 APC-eFluor780 eBioscience eBio13A
 IL-5 PE eBioscience TRFK5
 IFN-γ AlexaFluor700 eBioscience XMG1.2
 IFN-γ PE TONBO biosciences XMG1.2
 IL-4 APC eBioscience 11B11
 IL-17A PE-Cy7 eBioscience eBio17B7
 B220 eFluor450 eBioscience RA3-6B2
 NK1.1 eFluor450 eBioscience PK136
 FcεRI eFluor450 eBioscience MAR-1

*Cy = cyanine.

Used to define lineage + cells.

Lung histology

Lungs were collected and fixed in 10% formalin for 48–72 hr, washed with 70% ethanol, and cut longitudinally into 5 μm sections following paraffin embedding (Wax-It Histology Services, Vancouver, Canada). Sections were stained with hematoxylin and eosin and then blindly assessed for signs of inflammation. Histology was assessed as previously described (Russell et al., 2012) with minor modifications. Briefly, using the 4× objective, a score of 1–5 (1 = no signs of disease; 5 = severe disease) was assigned to each section for each of the following parameters: (1) peribronchial infiltration, (2) perivascular infiltration, (3) parenchymal infiltration, and (4) epithelium damage for a maximum score of 20. The 10× objective was used as needed to assess finer details.

Serum collection and antibody measurements

Blood was collected by cardiac puncture immediately after sacrifice, allowed to clot, and serum was collected and stored at −70°C until use. IgE levels were assessed by ELISA (ThermoFisher Scientific) according to the manufacturer’s instructions. Serum levels of P. kudriavzevii-specific IgG were assessed by ELISA based on previously described methods (Zeng et al., 2016). High-binding plates were coated overnight at 4°C with P. kudriavzevii from a 24 hr culture heat-killed at 90°C for 1 hr and normalized to an OD600 of 0.5 in 0.1 M sodium carbonate (Fisher Scientific) (pH 9.5). Plates were then washed four times with 0.05% Tween 20 (Sigma) in PBS and blocked for 2 hr at 37°C with 2% bovine serum albumin (Sigma) in PBS. Samples diluted in PBS with 10% fetal bovine serum were then added and plates were incubated at room temperature for 2 hr. Plates were washed four times again and goat anti-mouse IgG antibody (Invitrogen; catalog #62–6540) diluted 1:1000 in PBS with 10% fetal bovine serum was added for 1 hr at room temperature. After four more washes, plates were incubated with Streptavadin-HRP (BD Biosciences, catalog #554066) diluted 1:1000 in PBS with 10% fetal bovine serum for 1 hr at room temperature. Plates were washed four times and TMB substrate (BD Biosciences) was added for 15 min. Reactions were then quenched with 2 M hydrochloric acid and absorbance was measured at 450 nm. Total IgE levels were determined using a standard curve according to the manufacturer’s instructions and all other serum antibody levels are reported as absorbance readings normalized to controls. All samples were run in duplicate for each ELISA.

Fungal colonization assessment

Fecal pellets, colonic contents, or whole tissue and contents were collected into 1 mL of PBS and homogenized with a tungsten bead in a FastPrep-24 instrument (MP Biomedical) for 1 min at speed 5.5 one to two times as needed. Homogenates were plated on Sabouraud Dextrose Agar supplemented with 50 mg/L chloramphenicol and 5 mg/L gentamycin (SDA + CG). Plates were incubated at 37°C and colonies were counted the following day. Colony counts were normalized to sample weight.

Isolation and RNA-sequencing of gut immune cells

Sixteen-day-old mice neonatally treated as described above with either P. kudriavzevii suspended in PBS or PBS alone were sacrificed using isoflurane and CO2. Colons were then resected, placed into RNAlater (Qiagen) after fecal material was gently removed mechanically, and stored at −70°C until use.

Colonic RNA was extracted using the ThermoFisher GeneJet RNA kit according to the manufacturer’s instructions and sent to GENEWIZ (South Plainfield, NJ, USA) for quality control, DNAse treatment, and RNA sequencing. Briefly, extracted RNA samples were treated with TURBO DNase (Thermo Fisher Scientific, Waltham, MA, USA) to remove DNA following manufacturer’s protocol. The RNA samples were then quantified using Qubit 2.0 Fluorometer (Life Technologies, Carlsbad, CA, USA) and RNA integrity was checked using Agilent TapeStation 4200 (Agilent Technologies, Palo Alto, CA, USA).

RNA sequencing libraries were prepared using the NEBNext Ultra RNA Library Prep Kit for Illumina following manufacturer’s instructions (NEB, Ipswich, MA, USA). Briefly, mRNAs were first enriched with Oligo(dT) beads. Enriched mRNAs were fragmented for 15 min at 94°C. First strand and second strand cDNAs were subsequently synthesized. cDNA fragments were end repaired and adenylated at 3’ ends, and universal adapters were ligated to cDNA fragments, followed by index addition and library enrichment by limited-cycle PCR. The sequencing libraries were validated on the Agilent TapeStation (Agilent Technologies, Palo Alto, CA, USA) and quantified by using Qubit 2.0 Fluorometer (Invitrogen, Carlsbad, CA) as well as by quantitative PCR (KAPA Biosystems, Wilmington, MA, USA).

The sequencing libraries were pooled and clustered on two lanes of a HiSeq (4000 or equivalen) flowcell. After clustering, the flowcell was loaded on the instrument according to manufacturer’s instructions. The samples were sequenced using a 2 × 150 bp Paired End (PE) configuration. Image analysis and base calling were conducted by the HiSeq Control Software (HCS). Raw sequence data (.bcl files) generated from Illumina HiSeq was converted into fastq files and de-multiplexed using Illumina's bcl2fastq 2.17 software. One mismatch was allowed for index sequence identification. Raw data is available in the NCBI sequence read archive (SRA) under Bioproject ID PRJNA706731 (http://www.ncbi.nlm.nih.gov/bioproject/706731).

Fecal DNA isolation and 16S library preparation

Fresh fecal pellets were collected and immediately stored at −70°C until use. DNA was extracted using the QIAmp PowerFecal DNA kit with minor modifications. After adding solution C1, samples were heated at 65°C, placed on ice for 5 min, and then bead beat twice for 1 min at speed 5.5 using a FastPrep-24 instrument (MP Biomedical). Following DNA isolation, DNA was quantified using a Nanodrop machine and stored at −20°C until use. To prepare DNA for 16S sequencing, DNA was normalized to approximately 10–50 ng/μL and 2 μL of DNA was used in each PCR reaction.

16S PCR (10 μL 5× buffer, 1 μL MgCl, 1 μL forward primer, 1 μL reverse primer, 1 μL dNTPs, 33.5 μL water, 0.5 μL enzyme, and 2 μL template DNA per reaction) was done using Illumina-tagged and barcoded primers specific for the 16S V4 region (Kozich et al., 2013) and the following cycling protocol: 98°C for 2 min, followed by 25–30 cycles of 90°C for 20 s, 55°C for 15 s, and 72°C for 30 s, and then 72°C for 10 min. Reactions were run on a gel to ensure successful amplification and then samples for each library were gel extracted (Thermo Scientific GeneJET Gel Extraction Kit) and quantified using a PicoGreen assay (Invitrogen). Sequencing was performed using v2 technology on an Illumina MiSeq with 30% PhiX. Raw sequencing data is deposited to the NCBI sequence read archive (SRA) under the Project ‘Early life Pichia and asthma’ (accession PRJNA624902; https://www.ncbi.nlm.nih.gov/sra/PRJNA624902).

Germ-free fecal transplant

Fecal transplants into germ-free mice were performed as previously described (Suez et al., 2014) with minor modifications. Briefly, individual fecal samples were collected from six donor animals neonatally exposed as described above to either P. kudriavzevii-exposed or PBS alone on day 27 (week 4) of life, pooled, and homogenized in 2 mL of pre-reduced PBS containing 0.05% cysteine-HCl. Donor animals were born to two different dams in each treatment condition and housed in different cages after weaning. The fecal slurry was allowed to settle by gravity under anaerobic conditions for 10 min and recipient 12–16-week-old C57bl/6 germ-free female mice were given an oral gavage with 100 μL of the supernatant. Recipient mice were housed in two separate cages per treatment condition and HDM-induced AAD was induced 2 weeks following the fecal transplant. Successful transfer of colonic bacteria was verified via 16S sequencing and flow cytometry staining was performed as above with minor modifications.

P. kudriavzevii-specific PCR

The absence of P. kudriavzevii DNA isolated from the fecal transplant inoculum used in germ-free experiments was verified on a 1% agarose gel following PCR using P. kudriavzevii-specific primers (Carvalho et al., 2007) and the TopTaq Supermix (Qiagen).

SCFA growth inhibition assay

P. kudriavevii was grown at 37°C in YPD for 48 hr and then inoculated into YPD supplemented with the sodium salts of the SCFAs acetate (Fisher Scientific), butyrate (Sigma), or propionate (Sigma) at the indicated concentrations based on known concentrations of SCFAs in the gut (Arrieta et al., 2015; Arrieta et al., 2018) in a 96-well plate. Sodium chloride was used as an osmolarity control and biotin as a negative control where indicated and all solutions were normalized to pH 6.5. Cultures were normalized to an OD600 of 0.05 and grown in triplicate for 24 hr in a SYNERGY H1 Microplate Reader (BioTek) at 37°C, with readings taken every 15 min. The 96-well plate was shaken for 10–20 s before each reading. OD600 readings were corrected for medium blanks for each condition at each concentration and three technical replicates were included per growth condition.

Scanning electron microscopy

Fungal cultures were grown in 96-well plates as described above for 24 hr, washed with phosphate buffer (0.1M, pH = 7.4), and then fixed in 4% formaldehyde with 2.5% glutaraldehyde in 0.05M sodium cacodylate (pH 6.5) at room temperature for 2 hr and then overnight at 4°C. The following day, samples were washed with sodium cacodylate (0.1M, pH = 7.4), and post-fixed with an osmium/tannic acid solution (1% OsO4 and 0.1% tannic acid in 0.1M sodium cacodylate, pH = 7.4). Samples were then dehydrated through exposure to a graded ethanol series (10, 20, 30, 40, 50, 60, 70, 80, 90, 95, and 3 × 100%), critical point dried using a Tousimis CPD Autosamdri 815B, and mounted onto a 12.5 mm Al SEM pin stub using a microporous sample holder. Samples were sputter coated with 10 nM AuPd in a Cressington HR208 and images were acquired on a S2600 VP scanning electron microscope.

Epithelial cell adhesion assay

P. kudriavzevii was grown at 37°C in YPD for 48 hr and then inoculated into YPD supplemented with the sodium salts of the SCFAs acetate, butyrate, or propionate at a concentration of 150 μmol/mL in a 96-well plate. Sodium chloride was used as an osmolarity control and all solutions were normalized to pH 6.5. All cultures were normalized to a starting OD600 of 0.05 using a Teacan plate reader and left for 24 hr shaking at 37°C. Cultures were then normalized to an OD600 of 0.02 in a 1:3 mixture of YPD: DMEM. TC7 cells were washed with PBS and 1 mL of diluted yeast cells from each condition were added to TC7 cells and left for 2 hr in a 37°C incubator. TC7 cells were then washed twice with PBS to remove unattached fungal cells and dissociated with Accutase (Invitrogen). Harvested TC7 cells (with P. kudriavzevii attached) were plated onto SDA + CG plates overnight at 37°C for colony counting. Three technical replicates in each condition were performed to obtain each biological replicate and the cultures used to inoculate the TC7 cells were also plated to ensure an equal number of cells was added per condition.

SCFA supplementation in adult mice

Six- to seven-week-old male and female mice were housed two per cage and drinking water was supplemented with 0.5 mg/mL cefoperazone (Sigma catalog #62893-20-3) as previously described (Noverr et al., 2005) on days 0–3 to clear the intestinal bacterial microbiota. Half of the mice further had their water supplemented with a cocktail of SCFAs according to previously established protocols (Smith et al., 2013; Cait et al., 2018) for the duration of the experiment. The cocktail consisted of sodium acetate (67.5 mM), sodium propionate (25.9 mM), and sodium butyrate (40 mM), and the control animals received water that was pH and sodium matched (Smith et al., 2013). All water was filter sterilized and had Splenda added (8 g/L) to improve palatability. On day 3, all mice were given an oral gavage with 107 cells of P. kudriavzevii obtained from a 48 hr culture generated from a single colony of yeast and grown at 37°C while shaking. Two days after the gavage, fecal samples were collected for plating. Uncolonized mice were removed from the analysis.

Quantification and statistical analysis

ASV construction and taxonomic assignment for 16S data

Demultiplexed forward and reverse 250 bp reads were merged, denoised, trimmed, and filtered for sequencing quality control using DADA2 (Callahan et al., 2016) in QIIME2 (Bolyen et al., 2019). Taxonomic assignment of the resulting amplicon sequence variants (ASVs) was performed using the Greengenes database (DeSantis et al., 2006) version 13-8-99-515-806. All subsequent filtering and analysis steps were done in R Studio using the phyloseq (McMurdie and Holmes, 2013) and vegan (Philip, 2003) packages. ASV tables were filtered to remove singleton ASVs and taxa present at least three times in at least 10% of samples. To account for differences in sequencing depth, ASV tables were rarefied prior to computing alpha and beta diversities.

RNA sequencing analysis

RNA sequencing reads were aligned to the grcm38 mouse reference genome using ‘hisat2’ and then converted to raw feature counts using ‘featureCounts’ in Python3. The resulting feature count table was analyzed in R Studio (R version 4.0.3) for differentially abundant genes. Genes detected less than once per every million reads were removed from downstream analysis. Trimmed Mean of M-values (TMM) normalization was performed on the remaining genes using the package ‘edgeR’ (Robinson et al., 2010). Differentially abundant genes were identified by a likelihood ratio test (LRT) using ‘edgeR’. To limit type 1 errors, multiple correction was applied using Benjamini–Hochberg procedure and only genes with a false discovery rate (FDR) cut off of 10% or less were considered significantly different.

Statistical analysis

Statistical analysis was performed in GraphPad Prism (http://www.graphpad.com) or in RStudio (https://www.rstudio.com/). Student’s t-test with Welch’s correction was used for flow cytometry data and ANOVA was used when more than two groups were present, with post hoc Tukey’s test for multiple comparisons. For microbiome data, differences in beta diversity between groups were computed using a permutational analysis of variance (PERMANOVA) by the adonis function in the package vegan (Philip, 2003). All experiments included at least two cages per treatment group so p-values are adjusted for cage effects by using the option by = ‘margin’. Alpha diversities were compared using a Wilcoxon Rank-Sum test. Group comparisons for qPCR results were done in PRISM using the Mann–Whitney test. Unless otherwise stated, error bars represent the standard error of the mean of pooled data and statistical significance is represented by *p<0.05, **p<0.01, ***p<0.001, and ****p<0.0001. Figure 2a,b, Figure 3—figure supplement 2a, Figure 4, Figure 4—figure supplement 1a and Figure 5 were created with Biorender.com. R code is included in the Source Data associated with this manuscript.

Acknowledgements

We thank Ingrid Barta for preparing some tissue samples for histology, staff at Wax-It Histology Services, staff at UBC’s Modified Barrier Facility and Center for Disease Modeling for animal care support, Andy Johnson for flow facility training and support, Derrick Horne for assistance with scanning electron microscopy, Dr. Hind Sbihi for assistance with cleaning CHILD Cohort Study phenotype data, and all of our colleagues in the Finlay laboratory. We are grateful to all the families who took part in the CHILD Cohort Study, and the entire CHILD team, which includes interviewers, nurses, computer and laboratory technicians, clerical workers, research scientists, volunteers, managers, and receptionists. Funding: This work was funded by grants from CIHR to BBF (PJT-148484; FDN-159935) and AllerGen (12CHILD). RCTB was supported by a Vanier Canada Graduate Scholarship, a University of British Columbia (UBC) Four Year Doctoral Fellowship, and a Vancouver Coastal Health-Canadian Institutes of Health Research (CIHR)-UBC MD/PhD Studentship Award. MBA holds a Canada Research Chair in the Developmental Origins of Chronic Disease and is a Fellow of the CIFAR Humans and the Microbiome Program. SET holds the Aubrey J Tingle Professorship in Pediatric Immunology and Canada Research Chair in Pediatric Precision Health. BBF is a UBC Peter Wall Distinguished Professor and CIFAR Senior Fellow of the CIFAR Humans and the Microbiome Program.

Funding Statement

The funders had no role in study design, data collection and interpretation, or the decision to submit the work for publication.

Contributor Information

Rozlyn CT Boutin, Email: rozlyn.boutin@msl.ubc.ca.

B Brett Finlay, Email: bfinlay@msl.ubc.ca.

Wendy S Garrett, Harvard T.H. Chan School of Public Health, United States.

Antonis Rokas, Vanderbilt University, United States.

Funding Information

This paper was supported by the following grants:

  • Canadian Institutes of Health Research Project Grant PJT-148484 to B Brett Finlay.

  • Canadian Institutes of Health Research Foundation Grant FDN-159935 to B Brett Finlay.

  • AllerGen 12CHILD to Meghan B Azad, Allan B Becker, Piush J Mandhane, Theo J Moraes, Malcolm R Sears, Padmaja Subbarao, Stuart E Turvey, B Brett Finlay.

  • Canadian Institutes of Health Research Doctoral: Vanier Canada Graduate Scholarships to Rozlyn CT Boutin.

  • Vancouver Coastal Health AND CIHR UBC MD/PhD Studentship Award to Rozlyn CT Boutin.

Additional information

Competing interests

No competing interests declared.

Author contributions

Conceptualization, Data curation, Formal analysis, Supervision, Validation, Investigation, Visualization, Methodology, Writing - original draft, Project administration, Writing - review and editing.

Conceptualization, Data curation, Formal analysis, Investigation, Visualization, Writing - review and editing.

Data curation, Formal analysis, Validation, Investigation, Methodology.

Data curation, Validation, Investigation, Methodology.

Data curation, Validation, Investigation.

Data curation, Investigation, Writing - review and editing.

Data curation, Investigation.

Conceptualization, Data curation, Formal analysis, Validation, Investigation, Writing - review and editing.

Data curation, Investigation, Writing - review and editing.

Data curation, Investigation, Methodology, Writing - review and editing.

Investigation, Methodology, Writing - review and editing.

Resources, Data curation, Funding acquisition, Investigation.

Resources, Funding acquisition, Investigation.

Resources, Funding acquisition, Investigation.

Resources, Funding acquisition, Investigation.

Resources, Funding acquisition, Investigation.

Resources, Funding acquisition, Investigation.

Resources, Funding acquisition, Methodology, Writing - review and editing.

Resources, Supervision, Funding acquisition, Investigation, Project administration, Writing - review and editing.

Resources, Supervision, Funding acquisition, Project administration, Writing - review and editing.

Ethics

Human subjects: The CHILD Cohort Study protocols were approved by the human clinical research ethics boards at all universities and institutions directly involved with the CHILD cohort (McMaster University, University of British Columbia, the Hospital for Sick Children, University of Manitoba, and University of Alberta). Work in the Finlay/Turvey labs is conducted under the ethics certificate number H07-03120.

Animal experimentation: All animal experiments were in accordance with the University of British Columbia Animal Care Committee guidelines and approved by the UBC Animal Care Committee (protocols A17-0322 and A13-0344).

Additional files

Source data 1. R code for RNA-seq data.
elife-67740-data1.zip (1.4KB, zip)
Transparent reporting form

Data availability

Data Availability: All data generated or analyzed during this study are included in the manuscript and supporting files. Bacterial sequencing data have been deposited in the NCBI SRA under accession code SUB7276684 (https://www.ncbi.nlm.nih.gov/sra/PRJNA624902). RNA-seq data is deposited under Bioproject ID PRJNA706731 (http://www.ncbi.nlm.nih.gov/bioproject/706731).

The following datasets were generated:

Boutin RCT. 2021. Early life Pichia and asthma: NCBI Sequence Read Archive. PRJNA624902

Boutin RCT. 2021. Pichia Exposure RNAseq. NCBI Sequence Read Archive. PRJNA706731

References

  1. Al Nabhani Z, Dulauroy S, Marques R, Cousu C, Al Bounny S, Déjardin F, Sparwasser T, Bérard M, Cerf-Bensussan N, Eberl G. A weaning reaction to Microbiota is required for resistance to immunopathologies in the adult. Immunity. 2019;50:1276–1288. doi: 10.1016/j.immuni.2019.02.014. [DOI] [PubMed] [Google Scholar]
  2. Arpaia N, Campbell C, Fan X, Dikiy S, van der Veeken J, deRoos P, Liu H, Cross JR, Pfeffer K, Coffer PJ, Rudensky AY. Metabolites produced by commensal Bacteria promote peripheral regulatory T-cell generation. Nature. 2013;504:451–455. doi: 10.1038/nature12726. [DOI] [PMC free article] [PubMed] [Google Scholar]
  3. Arrieta MC, Stiemsma LT, Dimitriu PA, Thorson L, Russell S, Yurist-Doutsch S, Kuzeljevic B, Gold MJ, Britton HM, Lefebvre DL, Subbarao P, Mandhane P, Becker A, McNagny KM, Sears MR, Kollmann T, Mohn WW, Turvey SE, Finlay BB, CHILD Study Investigators Early infancy microbial and metabolic alterations affect risk of childhood asthma. Science Translational Medicine. 2015;7:307ra152. doi: 10.1126/scitranslmed.aab2271. [DOI] [PubMed] [Google Scholar]
  4. Arrieta MC, Arévalo A, Stiemsma L, Dimitriu P, Chico ME, Loor S, Vaca M, Boutin RCT, Morien E, Jin M, Turvey SE, Walter J, Parfrey LW, Cooper PJ, Finlay B. Associations between infant fungal and bacterial dysbiosis and childhood atopic wheeze in a nonindustrialized setting. Journal of Allergy and Clinical Immunology. 2018;142:424–434. doi: 10.1016/j.jaci.2017.08.041. [DOI] [PMC free article] [PubMed] [Google Scholar]
  5. Asher I, Pearce N. Global burden of asthma among children. The International Journal of Tuberculosis and Lung Disease. 2014;18:1269–1278. doi: 10.5588/ijtld.14.0170. [DOI] [PubMed] [Google Scholar]
  6. Auchtung TA, Fofanova TY, Stewart CJ, Nash AK, Wong MC, Gesell JR, Auchtung JM, Ajami NJ, Petrosino JF. Investigating colonization of the healthy adult gastrointestinal tract by fungi. mSphere. 2018;3:e00092-18. doi: 10.1128/mSphere.00092-18. [DOI] [PMC free article] [PubMed] [Google Scholar]
  7. Bacher P, Hohnstein T, Beerbaum E, Röcker M, Blango MG, Kaufmann S, Röhmel J, Eschenhagen P, Grehn C, Seidel K, Rickerts V, Lozza L, Stervbo U, Nienen M, Babel N, Milleck J, Assenmacher M, Cornely OA, Ziegler M, Wisplinghoff H, Heine G, Worm M, Siegmund B, Maul J, Creutz P, Tabeling C, Ruwwe-Glösenkamp C, Sander LE, Knosalla C, Brunke S, Hube B, Kniemeyer O, Brakhage AA, Schwarz C, Scheffold A. Human Anti-fungal Th17 immunity and pathology rely on Cross-Reactivity against Candida Albicans. Cell. 2019;176:1340–1355. doi: 10.1016/j.cell.2019.01.041. [DOI] [PubMed] [Google Scholar]
  8. Barcik W, Boutin RCT, Sokolowska M, Finlay BB. The role of lung and gut Microbiota in the pathology of asthma. Immunity. 2020;52:241–255. doi: 10.1016/j.immuni.2020.01.007. [DOI] [PMC free article] [PubMed] [Google Scholar]
  9. Beier KC, Hutloff A, Löhning M, Kallinich T, Kroczek RA, Hamelmann E. Inducible costimulator-positive T cells are required for allergen-induced local B-cell infiltration and antigen-specific IgE production in lung tissue. Journal of Allergy and Clinical Immunology. 2004;114:775–782. doi: 10.1016/j.jaci.2004.06.024. [DOI] [PubMed] [Google Scholar]
  10. Bolyen E, Rideout JR, Dillon MR, Bokulich NA, Abnet CC, Al-Ghalith GA, Alexander H, Alm EJ, Arumugam M, Asnicar F, Bai Y, Bisanz JE, Bittinger K, Brejnrod A, Brislawn CJ, Brown CT, Callahan BJ, Caraballo-Rodríguez AM, Chase J, Cope EK, Da Silva R, Diener C, Dorrestein PC, Douglas GM, Durall DM, Duvallet C, Edwardson CF, Ernst M, Estaki M, Fouquier J, Gauglitz JM, Gibbons SM, Gibson DL, Gonzalez A, Gorlick K, Guo J, Hillmann B, Holmes S, Holste H, Huttenhower C, Huttley GA, Janssen S, Jarmusch AK, Jiang L, Kaehler BD, Kang KB, Keefe CR, Keim P, Kelley ST, Knights D, Koester I, Kosciolek T, Kreps J, Langille MGI, Lee J, Ley R, Liu YX, Loftfield E, Lozupone C, Maher M, Marotz C, Martin BD, McDonald D, McIver LJ, Melnik AV, Metcalf JL, Morgan SC, Morton JT, Naimey AT, Navas-Molina JA, Nothias LF, Orchanian SB, Pearson T, Peoples SL, Petras D, Preuss ML, Pruesse E, Rasmussen LB, Rivers A, Robeson MS, Rosenthal P, Segata N, Shaffer M, Shiffer A, Sinha R, Song SJ, Spear JR, Swafford AD, Thompson LR, Torres PJ, Trinh P, Tripathi A, Turnbaugh PJ, Ul-Hasan S, van der Hooft JJJ, Vargas F, Vázquez-Baeza Y, Vogtmann E, von Hippel M, Walters W, Wan Y, Wang M, Warren J, Weber KC, Williamson CHD, Willis AD, Xu ZZ, Zaneveld JR, Zhang Y, Zhu Q, Knight R, Caporaso JG. Reproducible, interactive, scalable and extensible microbiome data science using QIIME 2. Nature Biotechnology. 2019;37:852–857. doi: 10.1038/s41587-019-0209-9. [DOI] [PMC free article] [PubMed] [Google Scholar]
  11. Boutin RCT, Sbihi H, Dsouza M, Malhotra R, Petersen C, Dai D, Sears MR, Moraes TJ, Becker AB, Azad MB, Mandhane PJ, Subbarao P, Finlay BB, Turvey SE. Mining the infant gut Microbiota for therapeutic targets against atopic disease. Allergy. 2020;75:2065–2068. doi: 10.1111/all.14244. [DOI] [PubMed] [Google Scholar]
  12. Cait A, Hughes MR, Antignano F, Cait J, Dimitriu PA, Maas KR, Reynolds LA, Hacker L, Mohr J, Finlay BB, Zaph C, McNagny KM, Mohn WW. Microbiome-driven allergic lung inflammation is ameliorated by short-chain fatty acids. Mucosal Immunology. 2018;11:785–795. doi: 10.1038/mi.2017.75. [DOI] [PubMed] [Google Scholar]
  13. Callahan BJ, McMurdie PJ, Rosen MJ, Han AW, Johnson AJ, Holmes SP. DADA2: high-resolution sample inference from Illumina amplicon data. Nature Methods. 2016;13:581–583. doi: 10.1038/nmeth.3869. [DOI] [PMC free article] [PubMed] [Google Scholar]
  14. Carvalho A, Costa-De-Oliveira S, Martins ML, Pina-Vaz C, Rodrigues AG, Ludovico P, Rodrigues F. Multiplex PCR identification of eight clinically relevant candida species. Medical Mycology. 2007;45:619–627. doi: 10.1080/13693780701501787. [DOI] [PubMed] [Google Scholar]
  15. Chiba S, Ikushima H, Ueki H, Yanai H, Kimura Y, Hangai S, Nishio J, Negishi H, Tamura T, Saijo S, Iwakura Y, Taniguchi T. Recognition of tumor cells by Dectin-1 orchestrates innate immune cells for anti-tumor responses. eLife. 2014;3:e04177. doi: 10.7554/eLife.04177. [DOI] [PMC free article] [PubMed] [Google Scholar]
  16. Cooper PJ, Chico ME, Platts-Mills TA, Rodrigues LC, Strachan DP, Barreto ML. Cohort profile: the Ecuador life (ECUAVIDA) study in esmeraldas province, Ecuador. International Journal of Epidemiology. 2015;44:1517–1527. doi: 10.1093/ije/dyu128. [DOI] [PMC free article] [PubMed] [Google Scholar]
  17. Cottier F, Tan AS, Xu X, Wang Y, Pavelka N. MIG1 regulates resistance of Candida Albicans against the fungistatic effect of weak organic acids. Eukaryotic Cell. 2015;14:1054–1061. doi: 10.1128/EC.00129-15. [DOI] [PMC free article] [PubMed] [Google Scholar]
  18. Dalle F, Wächtler B, L'Ollivier C, Holland G, Bannert N, Wilson D, Labruère C, Bonnin A, Hube B. Cellular interactions of Candida Albicans with human oral epithelial cells and enterocytes. Cellular Microbiology. 2010;12:248–271. doi: 10.1111/j.1462-5822.2009.01394.x. [DOI] [PubMed] [Google Scholar]
  19. Dang AT, Marsland BJ. Microbes, metabolites, and the gut-lung Axis. Mucosal Immunology. 2019;12:843–850. doi: 10.1038/s41385-019-0160-6. [DOI] [PubMed] [Google Scholar]
  20. DeSantis TZ, Hugenholtz P, Larsen N, Rojas M, Brodie EL, Keller K, Huber T, Dalevi D, Hu P, Andersen GL. Greengenes, a chimera-checked 16S rRNA gene database and workbench compatible with ARB. Applied and Environmental Microbiology. 2006;72:5069–5072. doi: 10.1128/AEM.03006-05. [DOI] [PMC free article] [PubMed] [Google Scholar]
  21. Dong C, Juedes AE, Temann UA, Shresta S, Allison JP, Ruddle NH, Flavell RA. ICOS co-stimulatory receptor is essential for T-cell activation and function. Nature. 2001;409:97–101. doi: 10.1038/35051100. [DOI] [PubMed] [Google Scholar]
  22. Douglass AP, Offei B, Braun-Galleani S, Coughlan AY, Martos AAR, Ortiz-Merino RA, Byrne KP, Wolfe KH. Population genomics shows no distinction between pathogenic Candida Krusei and environmental Pichia kudriavzevii: one species, four names. PLOS Pathogens. 2018;14:e1007138. doi: 10.1371/journal.ppat.1007138. [DOI] [PMC free article] [PubMed] [Google Scholar]
  23. Fan D, Coughlin LA, Neubauer MM, Kim J, Kim MS, Zhan X, Simms-Waldrip TR, Xie Y, Hooper LV, Koh AY. Activation of HIF-1α and LL-37 by commensal Bacteria inhibits candida albicans colonization. Nature Medicine. 2015;21:808–814. doi: 10.1038/nm.3871. [DOI] [PMC free article] [PubMed] [Google Scholar]
  24. Fujimura KE, Sitarik AR, Havstad S, Lin DL, Levan S, Fadrosh D, Panzer AR, LaMere B, Rackaityte E, Lukacs NW, Wegienka G, Boushey HA, Ownby DR, Zoratti EM, Levin AM, Johnson CC, Lynch SV. Neonatal gut Microbiota associates with childhood multisensitized atopy and T cell differentiation. Nature Medicine. 2016;22:1187–1191. doi: 10.1038/nm.4176. [DOI] [PMC free article] [PubMed] [Google Scholar]
  25. Gong F, Zheng T, Zhou P. T follicular helper cell subsets and the associated cytokine IL-21 in the pathogenesis and therapy of asthma. Frontiers in Immunology. 2019;10:2818. doi: 10.3389/fimmu.2019.02918. [DOI] [PMC free article] [PubMed] [Google Scholar]
  26. Gonzalo JA, Tian J, Delaney T, Corcoran J, Rottman JB, Lora J, Al-garawi A, Kroczek R, Gutierrez-Ramos JC, Coyle AJ. ICOS is critical for T helper cell-mediated lung mucosal inflammatory responses. Nature Immunology. 2001;2:597–604. doi: 10.1038/89739. [DOI] [PubMed] [Google Scholar]
  27. Goodridge HS, Reyes CN, Becker CA, Katsumoto TR, Ma J, Wolf AJ, Bose N, Chan AS, Magee AS, Danielson ME, Weiss A, Vasilakos JP, Underhill DM. Activation of the innate immune receptor Dectin-1 upon formation of a 'phagocytic synapse'. Nature. 2011;472:471–475. doi: 10.1038/nature10071. [DOI] [PMC free article] [PubMed] [Google Scholar]
  28. Heisel T. Complementary Amplicon-Based genomic approaches for the study of fungal. Communities in Humans. 2015;10:e0116705. doi: 10.1371/journal.pone.0116705. [DOI] [PMC free article] [PubMed] [Google Scholar]
  29. Iliev ID, Funari VA, Taylor KD, Nguyen Q, Reyes CN, Strom SP, Brown J, Becker CA, Fleshner PR, Dubinsky M, Rotter JI, Wang HL, McGovern DP, Brown GD, Underhill DM. Interactions between commensal fungi and the C-type lectin receptor Dectin-1 influence colitis. Science. 2012;336:1314–1317. doi: 10.1126/science.1221789. [DOI] [PMC free article] [PubMed] [Google Scholar]
  30. Irvin C, Zafar I, Good J, Rollins D, Christianson C, Gorska MM, Martin RJ, Alam R. Increased frequency of dual-positive TH2/TH17 cells in bronchoalveolar lavage fluid characterizes a population of patients with severe asthma. Journal of Allergy and Clinical Immunology. 2014;134:1175–1186. doi: 10.1016/j.jaci.2014.05.038. [DOI] [PMC free article] [PubMed] [Google Scholar]
  31. Kim YG, Sakamoto K, Seo SU, Pickard JM, Gillilland MG, Pudlo NA, Hoostal M, Li X, Wang TD, Feehley T, Stefka AT, Schmidt TM, Martens EC, Fukuda S, Inohara N, Nagler CR, Núñez G. Neonatal acquisition of clostridia species protects against colonization by bacterial pathogens. Science. 2017;356:315–319. doi: 10.1126/science.aag2029. [DOI] [PMC free article] [PubMed] [Google Scholar]
  32. Kondori N. Candida species as commensal gut colonizers: A study of 133 longitudinally followed Swedish infants. Medical Mycology. 2019;58:myz091. doi: 10.1093/mmy/myz091. [DOI] [PubMed] [Google Scholar]
  33. Kozich JJ, Westcott SL, Baxter NT, Highlander SK, Schloss PD. Development of a dual-index sequencing strategy and curation pipeline for analyzing amplicon sequence data on the MiSeq illumina sequencing platform. Applied and Environmental Microbiology. 2013;79:5112–5120. doi: 10.1128/AEM.01043-13. [DOI] [PMC free article] [PubMed] [Google Scholar]
  34. Kurtzman CP. Issatchenkia Kudryavtsev emend. In: Kurtzman S, Johnson C. P, editors. The Yeasts-a Taxonimic Study. Elsevier; 1998. pp. 221–226. [DOI] [Google Scholar]
  35. Lambrecht BN, Hammad H. The immunology of asthma. Nature Immunology. 2015;16:45–56. doi: 10.1038/ni.3049. [DOI] [PubMed] [Google Scholar]
  36. Li X, Leonardi I, Semon A, Doron I, Gao IH, Putzel GG, Kim Y, Kabata H, Artis D, Fiers WD, Ramer-Tait AE, Iliev ID. Response to fungal dysbiosis by Gut-Resident CX3CR1+ Mononuclear Phagocytes Aggravates Allergic Airway Disease. Cell Host & Microbe. 2018;24:847–856. doi: 10.1016/j.chom.2018.11.003. [DOI] [PMC free article] [PubMed] [Google Scholar]
  37. Liu CM, Kachur S, Dwan MG, Abraham AG, Aziz M, Hsueh PR, Huang YT, Busch JD, Lamit LJ, Gehring CA, Keim P, Price LB. FungiQuant: a broad-coverage fungal quantitative real-time PCR assay. BMC Microbiology. 2012;12:255. doi: 10.1186/1471-2180-12-255. [DOI] [PMC free article] [PubMed] [Google Scholar]
  38. Machiels K, Joossens M, Sabino J, De Preter V, Arijs I, Eeckhaut V, Ballet V, Claes K, Van Immerseel F, Verbeke K, Ferrante M, Verhaegen J, Rutgeerts P, Vermeire S. A decrease of the butyrate-producing species Roseburia hominis and Faecalibacterium prausnitzii defines dysbiosis in patients with ulcerative colitis. Gut. 2014;63:1275–1283. doi: 10.1136/gutjnl-2013-304833. [DOI] [PubMed] [Google Scholar]
  39. Martínez I, Maldonado-Gomez MX, Gomes-Neto JC, Kittana H, Ding H, Schmaltz R, Joglekar P, Cardona RJ, Marsteller NL, Kembel SW, Benson AK, Peterson DA, Ramer-Tait AE, Walter J. Experimental evaluation of the importance of colonization history in early-life gut Microbiota assembly. eLife. 2018;7:e36521. doi: 10.7554/eLife.36521. [DOI] [PMC free article] [PubMed] [Google Scholar]
  40. Mason KL, Erb Downward JR, Falkowski NR, Young VB, Kao JY, Huffnagle GB. Interplay between the gastric bacterial Microbiota and Candida Albicans during postantibiotic recolonization and gastritis. Infection and Immunity. 2012;80:150–158. doi: 10.1128/IAI.05162-11. [DOI] [PMC free article] [PubMed] [Google Scholar]
  41. Matsubara VH, Wang Y, Bandara H, Mayer MPA, Samaranayake LP. Probiotic lactobacilli inhibit early stages of Candida Albicans biofilm development by reducing their growth, cell adhesion, and filamentation. Applied Microbiology and Biotechnology. 2016;100:6415–6426. doi: 10.1007/s00253-016-7527-3. [DOI] [PubMed] [Google Scholar]
  42. McMurdie PJ, Holmes S. Phyloseq: an R package for reproducible interactive analysis and graphics of microbiome census data. PLOS ONE. 2013;8:e61217. doi: 10.1371/journal.pone.0061217. [DOI] [PMC free article] [PubMed] [Google Scholar]
  43. Nash AK, Auchtung TA, Wong MC, Smith DP, Gesell JR, Ross MC, Stewart CJ, Metcalf GA, Muzny DM, Gibbs RA, Ajami NJ, Petrosino JF. The gut mycobiome of the human microbiome project healthy cohort. Microbiome. 2017;5:153. doi: 10.1186/s40168-017-0373-4. [DOI] [PMC free article] [PubMed] [Google Scholar]
  44. Naujokat C, Berges C, Höh A, Wieczorek H, Fuchs D, Ovens J, Miltz M, Sadeghi M, Opelz G, Daniel V. Proteasomal chymotrypsin-like peptidase activity is required for essential functions of human monocyte-derived dendritic cells. Immunology. 2007;120:120–132. doi: 10.1111/j.1365-2567.2006.02487.x. [DOI] [PMC free article] [PubMed] [Google Scholar]
  45. Netea MG, Quintin J, van der Meer JW. Trained immunity: a memory for innate host defense. Cell Host & Microbe. 2011;9:355–361. doi: 10.1016/j.chom.2011.04.006. [DOI] [PubMed] [Google Scholar]
  46. Nieves-Ramirez ME. Asymptomatic intestinal colonization with protist Blastocystis. mSystems. 2018;3:e00007-00018. doi: 10.1128/mSystems.00007-18. [DOI] [PMC free article] [PubMed] [Google Scholar]
  47. Noverr MC, Noggle RM, Toews GB, Huffnagle GB. Role of antibiotics and fungal Microbiota in driving pulmonary allergic responses. Infection and Immunity. 2004;72:4996–5003. doi: 10.1128/IAI.72.9.4996-5003.2004. [DOI] [PMC free article] [PubMed] [Google Scholar]
  48. Noverr MC, Falkowski NR, McDonald RA, McKenzie AN, Huffnagle GB. Development of allergic airway disease in mice following antibiotic therapy and fungal Microbiota increase: role of host genetics, antigen, and interleukin-13. Infection and Immunity. 2005;73:30–38. doi: 10.1128/IAI.73.1.30-38.2005. [DOI] [PMC free article] [PubMed] [Google Scholar]
  49. Noverr MC, Huffnagle GB. Regulation of Candida Albicans morphogenesis by fatty acid metabolites. Infection and Immunity. 2004;72:6206–6210. doi: 10.1128/IAI.72.11.6206-6210.2004. [DOI] [PMC free article] [PubMed] [Google Scholar]
  50. Noverr MC, Huffnagle GB. The 'microflora hypothesis' of allergic diseases. Clinical Experimental Allergy. 2005;35:1511–1520. doi: 10.1111/j.1365-2222.2005.02379.x. [DOI] [PubMed] [Google Scholar]
  51. Nugent SG. Intestinal luminal pH in inflammatory bowel disease: possible determinants and implications for therapy with aminosalicylates and other drugs. Gut. 2001;48:571–577. doi: 10.1136/gut.48.4.571. [DOI] [PMC free article] [PubMed] [Google Scholar]
  52. Oberoi HS, Babbar N, Sandhu SK, Dhaliwal SS, Kaur U, Chadha BS, Bhargav VK. Ethanol production from alkali-treated rice straw via simultaneous saccharification and fermentation using newly isolated thermotolerant Pichia kudriavzevii HOP-1. Journal of Industrial Microbiology and Biotechnology. 2012;39:557–566. doi: 10.1007/s10295-011-1060-2. [DOI] [PubMed] [Google Scholar]
  53. Organization, W . The Global Burden of Disease: 2004 Update. World Health Organization; 2008. [Google Scholar]
  54. Philip D. Computer program review VEGAN, a package of R functions for community ecology. Journal of Vegetation Science. 2003;14:927–930. doi: 10.1111/j.1654-1103.2003.tb02228.x. [DOI] [Google Scholar]
  55. Quintin J, Saeed S, Martens JHA, Giamarellos-Bourboulis EJ, Ifrim DC, Logie C, Jacobs L, Jansen T, Kullberg BJ, Wijmenga C, Joosten LAB, Xavier RJ, van der Meer JWM, Stunnenberg HG, Netea MG. Candida Albicans infection affords protection against reinfection via functional reprogramming of monocytes. Cell Host & Microbe. 2012;12:223–232. doi: 10.1016/j.chom.2012.06.006. [DOI] [PMC free article] [PubMed] [Google Scholar]
  56. Reinhardt RL, Liang HE, Locksley RM. Cytokine-secreting follicular T cells shape the antibody repertoire. Nature Immunology. 2009;10:385–393. doi: 10.1038/ni.1715. [DOI] [PMC free article] [PubMed] [Google Scholar]
  57. Robinson MD, McCarthy DJ, Smyth GK. edgeR: a bioconductor package for differential expression analysis of digital gene expression data. Bioinformatics. 2010;26:139–140. doi: 10.1093/bioinformatics/btp616. [DOI] [PMC free article] [PubMed] [Google Scholar]
  58. Roduit C, Frei R, Ferstl R, Loeliger S, Westermann P, Rhyner C, Schiavi E, Barcik W, Rodriguez‐Perez N, Wawrzyniak M, Chassard C, Lacroix C, Schmausser‐Hechfellner E, Depner M, Mutius E, Braun‐Fahrländer C, Karvonen AM, Kirjavainen PV, Pekkanen J, Dalphin JC, Riedler J, Akdis C, Lauener R, O'Mahony L, Hyvärinen A, Remes S, Roponen M, Chauveau A, Dalphin ML, Kaulek V, Ege M, Genuneit J, Illi S, Kabesch M, Schaub B, Pfefferle P, Doekes G. High levels of butyrate and propionate in early life are associated with protection against atopy. Allergy. 2019;74:799–809. doi: 10.1111/all.13660. [DOI] [PubMed] [Google Scholar]
  59. Russell SL, Gold MJ, Hartmann M, Willing BP, Thorson L, Wlodarska M, Gill N, Blanchet MR, Mohn WW, McNagny KM, Finlay BB. Early life antibiotic-driven changes in Microbiota enhance susceptibility to allergic asthma. EMBO Reports. 2012;13:440–447. doi: 10.1038/embor.2012.32. [DOI] [PMC free article] [PubMed] [Google Scholar]
  60. Schei K, Avershina E, Øien T, Rudi K, Follestad T, Salamati S, Ødegård RA. Early gut mycobiota and mother-offspring transfer. Microbiome. 2017;5:107. doi: 10.1186/s40168-017-0319-x. [DOI] [PMC free article] [PubMed] [Google Scholar]
  61. Schuijs MJ, Willart MA, Vergote K, Gras D, Deswarte K, Ege MJ, Madeira FB, Beyaert R, van Loo G, Bracher F, von Mutius E, Chanez P, Lambrecht BN, Hammad H. Farm dust and endotoxin protect against allergy through A20 induction in lung epithelial cells. Science. 2015;349:1106–1110. doi: 10.1126/science.aac6623. [DOI] [PubMed] [Google Scholar]
  62. Shao TY, Ang WXG, Jiang TT, Huang FS, Andersen H, Kinder JM, Pham G, Burg AR, Ruff B, Gonzalez T, Khurana Hershey GK, Haslam DB, Way SS. Commensal Candida Albicans positively calibrates systemic Th17 immunological responses. Cell Host & Microbe. 2019;25:404–417. doi: 10.1016/j.chom.2019.02.004. [DOI] [PMC free article] [PubMed] [Google Scholar]
  63. Skalski JH, Limon JJ, Sharma P, Gargus MD, Nguyen C, Tang J, Coelho AL, Hogaboam CM, Crother TR, Underhill DM. Expansion of commensal fungus Wallemia mellicola in the gastrointestinal mycobiota enhances the severity of allergic airway disease in mice. PLOS Pathogens. 2018;14:e1007260. doi: 10.1371/journal.ppat.1007260. [DOI] [PMC free article] [PubMed] [Google Scholar]
  64. Smith PM, Howitt MR, Panikov N, Michaud M, Gallini CA, Bohlooly-Y M, Glickman JN, Garrett WS. The microbial metabolites, short-chain fatty acids, regulate colonic treg cell homeostasis. Science. 2013;341:569–573. doi: 10.1126/science.1241165. [DOI] [PMC free article] [PubMed] [Google Scholar]
  65. Stiemsma LT, Turvey SE. Asthma and the microbiome: defining the critical window in early life. Allergy, Asthma & Clinical Immunology. 2017;13:3. doi: 10.1186/s13223-016-0173-6. [DOI] [PMC free article] [PubMed] [Google Scholar]
  66. Stokholm J, Blaser MJ, Thorsen J, Rasmussen MA, Waage J, Vinding RK, Schoos AM, Kunøe A, Fink NR, Chawes BL, Bønnelykke K, Brejnrod AD, Mortensen MS, Al-Soud WA, Sørensen SJ, Bisgaard H. Maturation of the gut microbiome and risk of asthma in childhood. Nature Communications. 2018;9:141. doi: 10.1038/s41467-017-02573-2. [DOI] [PMC free article] [PubMed] [Google Scholar]
  67. Subbarao P, Anand SS, Becker AB, Befus AD, Brauer M, Brook JR, Denburg JA, HayGlass KT, Kobor MS, Kollmann TR, Kozyrskyj AL, Lou WY, Mandhane PJ, Miller GE, Moraes TJ, Pare PD, Scott JA, Takaro TK, Turvey SE, Duncan JM, Lefebvre DL, Sears MR, CHILD Study investigators The canadian healthy infant longitudinal development (CHILD) Study: examining developmental origins of allergy and asthma. Thorax. 2015;70:998–1000. doi: 10.1136/thoraxjnl-2015-207246. [DOI] [PubMed] [Google Scholar]
  68. Suez J, Korem T, Zeevi D, Zilberman-Schapira G, Thaiss CA, Maza O, Israeli D, Zmora N, Gilad S, Weinberger A, Kuperman Y, Harmelin A, Kolodkin-Gal I, Shapiro H, Halpern Z, Segal E, Elinav E. Artificial sweeteners induce glucose intolerance by altering the gut Microbiota. Nature. 2014;514:181–186. doi: 10.1038/nature13793. [DOI] [PubMed] [Google Scholar]
  69. Suhr MJ, Hallen-Adams HE. The human gut mycobiome: pitfalls and potentials--a mycologist's perspective. Mycologia. 2015;107:1057–1073. doi: 10.3852/15-147. [DOI] [PubMed] [Google Scholar]
  70. Thorburn AN, McKenzie CI, Shen S, Stanley D, Macia L, Mason LJ, Roberts LK, Wong CH, Shim R, Robert R, Chevalier N, Tan JK, Mariño E, Moore RJ, Wong L, McConville MJ, Tull DL, Wood LG, Murphy VE, Mattes J, Gibson PG, Mackay CR. Evidence that asthma is a developmental origin disease influenced by maternal diet and bacterial metabolites. Nature Communications. 2015;6:7320. doi: 10.1038/ncomms8320. [DOI] [PubMed] [Google Scholar]
  71. Trompette A, Gollwitzer ES, Yadava K, Sichelstiel AK, Sprenger N, Ngom-Bru C, Blanchard C, Junt T, Nicod LP, Harris NL, Marsland BJ. Gut Microbiota metabolism of dietary fiber influences allergic airway disease and hematopoiesis. Nature Medicine. 2014;20:159–166. doi: 10.1038/nm.3444. [DOI] [PubMed] [Google Scholar]
  72. Uwadiae F, Pyle CJ, Walker SA, Lloyd CM, Harker JA. Targeting the ICOS/ICOS-L pathway in a mouse model of established allergic asthma disrupts T follicular helper cell responses and ameliorates disease. The Journal of Allergy and Clinical Immunology. 2019;74:650–662. doi: 10.1111/all.13602. [DOI] [PMC free article] [PubMed] [Google Scholar]
  73. Vos T, Global Burden of Disease Study 2013 Collaborators Global, regional, and national incidence, prevalence, and years lived with disability for 301 acute and chronic diseases and injuries in 188 countries, 1990-2013: a systematic analysis for the global burden of disease study 2013. The Lancet. 2015;386:743–800. doi: 10.1016/S0140-6736(15)60692-4. [DOI] [PMC free article] [PubMed] [Google Scholar]
  74. Wang YH, Voo KS, Liu B, Chen CY, Uygungil B, Spoede W, Bernstein JA, Huston DP, Liu YJ. A novel subset of CD4(+) T(H)2 memory/effector cells that produce inflammatory IL-17 cytokine and promote the exacerbation of chronic allergic asthma. Journal of Experimental Medicine. 2010;207:2479–2491. doi: 10.1084/jem.20101376. [DOI] [PMC free article] [PubMed] [Google Scholar]
  75. Ward TL, Dominguez-Bello MG, Heisel T, Al-Ghalith G, Knights D, Gale CA. Development of the human mycobiome over the first month of life and across body sites. mSystems. 2018;3:e00140-17. doi: 10.1128/mSystems.00140-17. [DOI] [PMC free article] [PubMed] [Google Scholar]
  76. Wheeler ML. Immunological consequences of intestinal fungal short article immunological consequences of intestinal fungal dysbiosis. Cell Host & Microbe. 2016;19:865–873. doi: 10.1016/j.chom.2016.05.003. [DOI] [PMC free article] [PubMed] [Google Scholar]
  77. Willart MA, Deswarte K, Pouliot P, Braun H, Beyaert R, Lambrecht BN, Hammad H. Interleukin-1α controls allergic sensitization to inhaled house dust mite via the epithelial release of GM-CSF and IL-33. Journal of Experimental Medicine. 2012;209:1505–1517. doi: 10.1084/jem.20112691. [DOI] [PMC free article] [PubMed] [Google Scholar]
  78. Zeng MY, Cisalpino D, Varadarajan S, Hellman J, Warren HS, Cascalho M, Inohara N, Núñez G. Gut Microbiota-Induced immunoglobulin G controls systemic infection by symbiotic Bacteria and pathogens. Immunity. 2016;44:647–658. doi: 10.1016/j.immuni.2016.02.006. [DOI] [PMC free article] [PubMed] [Google Scholar]
  79. Zhang Z, Li J, Zheng W, Zhao G, Zhang H, Wang X, Guo Y, Qin C, Shi Y. Peripheral lymphoid volume expansion and maintenance are controlled by gut Microbiota via RALDH+ dendritic cells. Immunity. 2016;44:330–342. doi: 10.1016/j.immuni.2016.01.004. [DOI] [PMC free article] [PubMed] [Google Scholar]

Decision letter

Editor: Antonis Rokas1
Reviewed by: Gianni Panagiotou2

In the interests of transparency, eLife publishes the most substantive revision requests and the accompanying author responses.

Acceptance summary:

This manuscript describes the association between overgrowth of the yeast Pichia kudriavzevii in the gut of infant mice and humans and risk for asthma later in life. In addition to replicating their previous finding of this association in a different human population, this work shows that yeast overgrowth stems from interaction with gut bacteria, highlighting the importance of inter-kingdom interactions in understanding microbiota-associated asthma outcomes.

Decision letter after peer review:

[Editors’ note: the authors submitted for reconsideration following the decision after peer review. What follows is the decision letter after the first round of review.]

Thank you for submitting your work entitled "Bacterial-fungal interactions in the neonatal gut influence asthma outcomes later in life" for consideration by eLife. Your article has been reviewed by 3 peer reviewers, and the evaluation has been overseen by a Reviewing Editor and a Senior Editor. The reviewers have opted to remain anonymous.

Our decision has been reached after consultation between the reviewers. Based on these discussions and the individual reviews below, we regret to inform you that your work will not be considered further for publication in eLife at this time.

All of us thought that the premise of your study is extremely interesting. However, there were numerous concerns raised by the reviewers. The reviewers expressed a need for dramatic changes to improve the clarity of the presentation and its logic. Reviewers also expressed many concerns about the existence of claims not full supported by the data provided. All of these issues are explained in detail in the individual reviewers' comments below.

Should the authors think they can address these criticisms, eLife would be willing to reconsider a resubmitted manuscript.

Please note, however, two important points. First, please note that any resubmission would be considered as a new submission and may necessitate acquisition of comments from new reviewers (if one or more from the ones that reviewed this version are not available). Second, please note that your data and analyses will need to strongly support the conclusions (and the conclusions will need to be sufficiently exciting) in order for a re-submission to be successful.

Reviewer #1:

This manuscript describes the association between Pichia kudriavzevii overgrowth in the gut of infant mice and humans and the occurrence of allergic airway disease (AAD) later in life. Here, the authors replicated their previous finding in Ecuadorian children, which showed an association between fungal overgrowth, particularly levels of P. kudriavzevii, and AAD later in life, using a population of Canadian children. They went on to show a correlation in mice between early exposure to P. kudriavzevii while weaning and increased inflammation in an AAD model after fungal exposure ended. Building on their previous work which found lower levels of short-chain fatty acids in the population with higher P. kudriavzevii, which are produced by intestinal bacteria, they show that higher concentrations of butyrate and related molecules suppress growth, alter morphology and reduce adherence of P. kudriavzevii to Caco2/T7 epithelial cells leading them to propose a model that modulation of gut bacteria could be used to prevent the effects of fungal overgrowth and sensitization to allergens early in life. Overall, the paper is interesting, but the text is confusing with some errors and inconsistencies in places.

1. For all bar plots, please show individual data points (e.g. Figure 1) on the graphs to show the data distribution. This is necessary to confirm the authors conclusion that there is a correlation between individuals with AW have increased Pichia burden or if this is the case for only a subpopulation. The 18S-based fungal load data, in light of the y-axis, are not compelling-data points again should be shown. Why does there appear to be more Pichia DNA than total fungal DNA?

2. For experiments in which different data from each mouse is available, such as Pichia abundance and eosinophil counts, or different immunological markers, please perform a correlation analysis to determine if the variability seen between mice further supports the conclusions made in this paper instead of a series of independent t-tests. Do mice with the highest Pichia colonization have a stronger immune response? In multiple panels a few data points appear to drive the differences between the groups, if these data are from the same experiment in each panel that needs to be addressed in the text and in the statistical analysis. It would support the message of the paper.

3. What was the rationale for adding IL-4+ cell analysis in Figure 2-supplement 1F but not in Figure 2? The authors mention that ICOS is associated with IL-4 production, but IL-4 data are not shown. Furthermore, In Figure 3-supplemental 2 include IL-5 and IL-13 to show that the same response characterized in Figure 2, but these metrics were not present in Figure 2. Please either include the data or explain.

4. In multiple places in the text it is stated that Pichia is absent from the gut at different time points, however no data was shown to directly support this conclusion. Either add data or delete these statements.

a. Line 114 – no data shown for colony counts at 21 days, remove from text or add this missing figure.

b. Line 116 – no data is shown to support that Pichia is gone after weaning. Without showing that Pichia did not persist after weaning then, it is possible that prolonged fungal colonization is responsible for the AAD phenotype observed. Address this inconsistency by adding in the relevant data or addressing in the text.

c. Line 120-124 – no data shown to support that there is no Pichia in the gut at 4 weeks.

d. Line 131-132 – have not shown fungal colonization ends at a particular day.

5. A discussion of data in Figure 3C-F correlates with previously published studies on bacterial dysbiosis and AAD would be a beneficial addition. Clostridales are mentioned as a direct contributor to SCFA, is the abundance of members of this genus altered in the experiment shown?

6. In Figure 3-supplemental 1, data is shown to support the hypothesis that the bacterial composition change in the gut alone does not account for the changes in immune response however no data is shown to verify that the fecal transplant procedure successfully recapitulated the Pichia exposed gut microbiome. An analysis comparing data in Figure 3D and Figure 3 supplemental 1B-D is important to show that the bacterial species present in the fecal sample obtained from the mice exposed to Pichia were able to successfully colonize the germ-free mice and be representative of the original population. It would also be interesting to do the same analysis with the post-AAD samples to show how Pichia exposed and germ-free colonized mice (Figure 3F and Figure 3-supplemental 1E-F) respond to AAD model – is there a difference?

Changes to the text:

1. This study looks at the effects of Pichia on bacterial dysbiosis and immune response but does not show data to support a more general change in fungal dysbiosis (no other fungal species present in the mouse gut were assessed). Throughout the paper, as in line 92-95, this point should not be made without support.

2. The biological relevance of Figure 2 and Figure 2-supplement 1 are difficult to interpret without first having established colonization/dysbiosis of the gut microbiome. Consider moving Figure 3 first to establish you can recapitulate the dysbiosis seen in children in this mouse model and then show in Figure 2 that this correlates with differences in the immune system later in life.

3. The data in Figure 4 don't align with the other data in the paper without more discussion of the connection. Expand upon the discussion/relevance of assessing SCFA effects on Pichia in this paper. Have SCFA been shown to impact fungal colonization previously, in analyses that corelate SCFA with decreased AAD? Is the hypothesis being tested that before increased Pichia in children there was changes in the microbiome that decreased local SCFA concentrations and this allowed Pichia overgrowth, which in turn further impact the bacterial gut microbiome and immune development? Clarify a connection in the text as to why Figure 4 is important to the story arc of this paper. It might be useful to present both models in a concluding figure.

4. For Figure 3B, to address the relevance of circulating Pichia-specific IgG, compare data to fold changes in other studies in other systems.

5. Line 84 suggest that the data in Figure 1B are significant (p<0.05), but according to the figure they are not, edit text to acknowledge the p-value accordingly.

Reviewer #2:

In this report Boutin and colleagues have investigated the impact of exposing mice to P. kudriavzevii on HDM-induced allergic lung inflammation. The premise of the work comes from previous data from the CHILD study, amongst others, that link certain fungal species with an increased asthma severity.

There are two main conclusions from this work. First, the exposure must occur pre-weening and second, that SCFA directly reduce fungal adherence to intestinal epithelial cells.

Figure 1 is in line with prior reports, setting the rationale for the author's focus on Pichia. The best control to include would be a comparison with another fungi, which might serve as a negative control. As the authors indicate, there are already a number of reports showing anti-fungal treatment, or colonisation with specific fungi, exacerbate allergic inflammation in mouse models. Is there something unique to Pichia, or is a general outgrowth of any fungi seen as increasing susceptibility?

The new data starts with Figure 2 where in general there is an increase in adaptive immune parameters in the Pichia group. Variability is very high, and in many cases, there appear to be 'responders' and 'non-responders', e.g. panel's D, E, G, H. Could these be cage affects? Statistical significance is reached in most cases, likely due to the pooling of experiments to have sufficient numbers. In this respect, it is unclear why data is pooled from 2 experiments in some case, and 3 in others? What is the basis for this? Overall, while there are some differences, particularly in the FACS analysis, the overall phenomenon does not look particularly robust, and disease (as opposed to FACS) parameters are largely missing, e.g. mucus production and lung function. There is no correlation with the level of Pichia colonisation per mouse and the readouts e.g. did the mice showing high levels of eosinophils also have higher CFU of Pichia during the 2 weeks of exposure?

The concerns continue with Figure 2-sup where the authors have changed the protocol, now giving the Pichia per oral and post-weening. The conclusion is that the phenomenon no longer exists and thus the exposure must occur pre-weening. In fact, in this case there are far fewer animals and the figure legend indicates this is a single experiment (no repeats referred to?). The pathology score appears to have a similar increase in the Pichia group as in Figure 2, however an outlier in the control group likely stops significance. The fact that there is a lot of variability and so few mice, plus the fact that two different protocols have been used (skin administration vs oral gavage), means that the authors can't conclude the Pichia is only active in early life. These data do not appear robust and the conclusions are overstated.

In Figure 3 the highly variable exposure to Pichia is noted and the authors argue that there is an increase in Pichia specific IgG, however these data are shown as relative to control and there is a minor shift to around 1.2 in most samples. This analysis does not appear to be robust enough to conclude an adaptive response has been mounted against the Pichia. The clearest data from Figure 3 comes with the GF recolonisation experiment, which in fact shows that transferring the microbiome from Pichia mice does not transfer any susceptibility. The inferred conclusion therefore is that the effect must be linked with early life immune maturation. However, no evidence is provided to support this. Neonatal GF mice would need to be colonised as a control, and immune parameters measured to prove that there has been some early life imprinting. Moreover, given the need to pool multiple experiments to show their phenomenon in Figure 2, similar numbers of mice are likely required throughout the manuscript to allow robust conclusions.

Finally, in Figure 4 the authors show that culturing the fungi in vitro in the presence of SCFA reduces fungal adherence to an intestinal epithelial cell line. The data is clear, but the obvious concern is the physiological relevance of this, and also the absence of any link with the prior data in the manuscript. Ideally the authors would include a better negative control, showing that other common intestinal metabolites do not affect fungal adherence. In addition, the SCFA should be utilised at ratios similar to that seen in vivo. In Figure 4, the highest concentration of 150umol/ml is utilised for each SCFA, however if the butyrate and propionate levels were relative to acetate, the conclusion would likely change. Direct cell toxicity of the SCFA should also be reported. These data would also carry more weight if in vivo experiments were performed to test whether there is reduced Pichia colonisation in early life in mice with higher SCFA levels.

Overall, although conceptually the manuscript is interesting, there are major concerns related to the robustness of the datasets and comparisons that are drawn between the different experimental systems.

Reviewer #3:

Boutin et al. performed a throughout study to investigate the cause of allergic airway disease induced by early fungal colonization. They used the commensal fungus Pichia kudriavzevii as reasonable example in mouse models. They furthermore demonstrate that the disease is only induced when mice are exposed early in life and that the resulting disease is predominantly induced by the fungus and not the resulting microbiome.

I believe this is a well thought out and conducted study. The following points should be considered by the authors for improving the quality and clarity of their study:

The major problem in the manuscript is the unjustified experiments with SCFAs. Suddenly in the manuscript there is a statement that SCFAs have been reported in the literature to inhibit fungi so the authors decided to test some of them for their inhibitory role on P. kudriavzevii. Subsequently and after the successful testing of the inhibitory role of the tested SCFAs in vitro the authors claimed that they have found the mechanism behind colonization of P. kudriavzevii. The authors could support this in several ways:

– There is a huge variation in the P. kudriavzevii levels of the 115 subjects from the Child cohort. A 16S rRNA analysis of these subjects and a correlation analysis with P. kudriavzevii levels could prove that SCFA bacterial producers correlate negatively with P. kudriavzevii levels. The authors could measure the SCFAs in the stool samples of these children to confirm their hypothesis.

– In the mice experiments I would like to see that supplementation of the food with these SCFAs indeed leads to colonisation resistance against P. kudriavzevii.

– Alternatively, a concomitant oral gavage of a known strong SCFA bacterial producer and P. kudriavzevii could offer the evidence needed to support the authors hypothesis.

One of the most interesting findings was that: unlike the neonatal exposure, mice exposed to P. kudriavzevii for two weeks in adolescent life (4-6 weeks of age) via oral gavage did not demonstrate increased lung inflammation. However, it is not completely clear to me whether the two exposure groups ("neonatal exposure" and "adult exposure" as stated in the Methods) have the same treatment methods and dosage. Please elaborate more on this.

The authors stated in Line 387 of the Methods section that "Successful transfer of colonic bacteria was verified via 16S sequencing", but I did not find relevant results or figures.

Line 128: "Bacterial populations of P. kudriavzevii-exposed and -naïve mice separated moderately"

Please supply an effect size measure in the corresponding figure or text to elucidate what a 'moderate' effect is in this context.

Line 131: High variability and low sample size for a mice-based 16s rRNA analysis, in Figure 3C, 3D, 3F (as main results), although being statistically significant. The authors used Bray-Curtis Dissimilarity as community β-diversity measures, I wonder whether other distance measures (e.g. weighted/unweighted UniFrac) could have higher power in discriminating the two groups.

Line 132: I would suggest adding the points for individual samples in Figure 3E.

Line 272: Is four-week-old mice really "adult exposure" as stated in the subtitle? or, adolescent?

Line 383: were the recipient germ-free mice 12-16-week-old? Based on the figure legend of Figure 3-supplement 1a, AAD induction was at day 42 (week 6). Please confirm and/or clarify.

Figure 1: As statement by the authors, the variation is high with respect to fungal counts. If possible, scatter or bee swarm plots would help to assess the variation better.

Figure 2c In the caption, the pathology score is shown and referenced as "left; 5-20". However, controls clearly show a value below 5. Please correct the range or elucidate.

Figure 2-suppl c: Same as with Figure 2C, please correct the caption.

Figure 3c-d: Please report a proper effect size in the plot (such as F-values or R2) or in the caption in addition to the p-value.

Figure 3—figure supplement c "Relative abundances of the top 100 sequences at genus level […]"

"Top 100 sequences" does not make sense in this context. Please correct or elucidate. I guess it should be similar to Figure 3—figure supplement E.

Figure 3-suppl e "top 100 genera"

Only 19 genera are shown in the plot (which is reasonable). Please report it properly in the caption.

Please lower case the sub-figure letters in the figure captions (or vice versa)

eLife. 2021 Apr 20;10:e67740. doi: 10.7554/eLife.67740.sa2

Author response


[Editors’ note: the authors resubmitted a revised version of the paper for consideration. What follows is the authors’ response to the first round of review.]

Reviewer #1:

This manuscript describes the association between Pichia kudriavzevii overgrowth in the gut of infant mice and humans and the occurrence of allergic airway disease (AAD) later in life. Here, the authors replicated their previous finding in Ecuadorian children, which showed an association between fungal overgrowth, particularly levels of P. kudriavzevii, and AAD later in life, using a population of Canadian children. They went on to show a correlation in mice between early exposure to P. kudriavzevii while weaning and increased inflammation in an AAD model after fungal exposure ended. Building on their previous work which found lower levels of short-chain fatty acids in the population with higher P. kudriavzevii, which are produced by intestinal bacteria, they show that higher concentrations of butyrate and related molecules suppress growth, alter morphology and reduce adherence of P. kudriavzevii to Caco2/T7 epithelial cells leading them to propose a model that modulation of gut bacteria could be used to prevent the effects of fungal overgrowth and sensitization to allergens early in life. Overall, the paper is interesting, but the text is confusing with some errors and inconsistencies in places.

Thank you for your feedback, we sincerely appreciate your detailed assessment of our work and appreciate the opportunity to address these important points.

1. For all bar plots, please show individual data points (e.g. Figure 1) on the graphs to show the data distribution. This is necessary to confirm the authors conclusion that there is a correlation between individuals with AW have increased Pichia burden or if this is the case for only a subpopulation. The 18S-based fungal load data, in light of the y-axis, are not compelling-data points again should be shown. Why does there appear to be more Pichia DNA than total fungal DNA?

Excellent point. As this reviewer rightly points out, this is a frequently observed finding in human microbiota studies and the increased Pichia burden is present only for a subpopulation of children in the CHILD cohort (6/12 cases vs 36/115 in the controls). This is also what we saw in our previous publication using data from a human birth cohort in Ecuador (Arrieta et al., (2018)) (1). We agree, however, that the data in the CHILD cohort are not as compelling as those in the original paper. The purpose of this data is to support our use of Pichia overgrowth as a relevant model, and our results suggest that larger sample sizes should be used in future work. Given that this is preliminary data, this has now been moved to be a Supplementary file and we have replaced the original figures with figures showing the individual data points. We have also qualified our wording and reduced the focus on this data:

Line 98-103: “Moreover, in a subset of 123 subjects from the CHILD Cohort Study, we found evidence suggesting that Canadian infants from an industrialized setting at high risk of asthma also demonstrate overgrowth of P. kudriavzevii in three-month stool samples relative to healthy infants (Supplementary file 1). Overgrowth of P. kudriavzevii in the gut in early life may therefore represent a relevant and widely applicable model of asthma-associated early life gut fungal dysbiosis.”

Author response image 1.

Author response image 1.

Thank you for pointing out the y-axes of our graphs, this review allowed us to look at the data more closely and further highlighted the utility of showing the individual data points as suggested. The y-axis of the graph for P. kudriavzevii DNA is brought up by an outlier in the control group, but with the individual data points shown it becomes more evident that the total fungal population in the samples is around 10-6 whereas the P. kudriavzevii load is less than this. The loads could appear similar for several reasons, and this again mimics what was seen in our 2018 JACI paper by Arrieta et al. Differences in the copy number of target DNA could account for these differences. Moreover, the standard curves for the Pichia figure used total Pichia DNA (full genome; ~4 ITS copies/genome), whereas those for the total fungal load analysis used only the 18S amplicons. Therefore, we would expect the Pichia figure to reflect more total DNA/18S copy. Finally, note that the assay used for the FungiQuant analysis (probe-based method) differs from the Pichia-specific (SYBR-based method) analysis and has a longer amplicon. If copy number is calculated (https://www.idtdna.com/pages/education/decoded/article/calculations-converting-from-nanograms-to-copy-number) after converting the Pichia DNA amount to ITS copies (based on the average genome size of 10.8126Mb(https://www.ncbi.nlm.nih.gov/genome/?term=Pichia%20kudriavzevii[Organism]&cmd=DetailsSearch) and 4 copies of the 18S rDNA locus per genome(2)), the results are shown in Figure 1.

2. For experiments in which different data from each mouse is available, such as Pichia abundance and eosinophil counts, or different immunological markers, please perform a correlation analysis to determine if the variability seen between mice further supports the conclusions made in this paper instead of a series of independent t-tests. Do mice with the highest Pichia colonization have a stronger immune response? In multiple panels a few data points appear to drive the differences between the groups, if these data are from the same experiment in each panel that needs to be addressed in the text and in the statistical analysis. It would support the message of the paper.

We agree with the reviewer that if this type of data were available, it would greatly strengthen our paper, and this has been the topic of much ongoing discussion within our group. Unfortunately, this correlation analysis is not possible due to the design of the experiment and technical challenges associated with obtaining colonization data for the specific individual pups used for the asthma experiments. We found that pups are only colonized with Pichia when they are housed with the dams (who are the ones that actually received the treatment), but lose colonization once they are weaned at 19 days of age. Therefore, it is not possible to regulate exactly how much Pichia each individual pup receives. Furthermore, before weaning, pups do not produce fully formed fecal samples so colonization has to be measured as an endpoint analysis-i.e. by collecting gut tissues. As a result, the colonization data is collected on different animals from those taken out to the AAD endpoint.

We also worry that colonization of pups would be variable within animals over the course of the first 2 weeks of life (given stochastic exposure, coprophagy, etc.) and are concerned that correlating Pichia burden at any given time point with inflammatory markers would be an inaccurate assessment.

Despite these limitations, it was important to us to address this concern. We therefore repeated the full 12-week experiment and fecal samples were collected during and after the colonization period to correlate Pichia load (determined using colony counts) with asthma outcomes. Unfortunately, this experiment confirmed that the earliest time point a formed fecal sample could be obtained from pups was 18 days of life and given the low colonization at this time point, no correlations were found between colony counts and asthma outcome parameters.

With regards to the “responder” vs “non-responder” mice, we did observe that female mice appear to be more sensitive to the effects of fungal dysbiosis on AAD (note that female and male mice were housed separately and both sexes were included in the study (1 cage/sex that received Pichia/experimental repeat except for 1 of the 3 repeats)). This is likely in part due to the increased sensitivity of female mice to animal models of allergic disease.

It’s important for us to mention that, while these figures reflect pooled data, our three independent experiments showed the same trends and/or significance in the results. We feel that the repeated statistical significance of our results despite this inherent variability speaks to the robustness of the observed effects of Pichia on inflammatory outcomes during AAD. The original data has been provided as a supplement to indicate this and the figure legends have been updated for clarity. The GATA3+ T cell measurement is the one exception to this as this antibody was only included in the flow cytometry panels in 2 experiments, and therefore Author response image 2 represents combined data from 2, rather than 3, experiments.

Author response image 2.

Author response image 2.

3. What was the rationale for adding IL-4+ cell analysis in Figure 2-supplement 1F but not in Figure 2? The authors mention that ICOS is associated with IL-4 production, but IL-4 data are not shown. Furthermore, In Figure 3-supplemental 2 include IL-5 and IL-13 to show that the same response characterized in Figure 2, but these metrics were not present in Figure 2. Please either include the data or explain.

Thank you for the opportunity to explain these discrepancies and we apologize for not making this more clear in the methods. The IL-4 antibody used for flow cytometry did not successfully stain our cells in at least 2 of our 3 neonatal exposure experiments, so this data was not included. The flow cytometer we used for these initial experiments also did not accommodate the additional colours to be able to add IL-5 and IL-13 to these neonatal exposure experiments. These additional markers were added to our panel in the germ-free experiment once we upgraded our machine. To address this reviewer’s concern, we attempted to perform IHC for IL-4 in lung sections taken from the experiments where mice were neonatally exposed to P. kudriavzevii but unfortunately were unsuccessful given the age of the samples. We hope to be able to further address the role of ICOS+ T cells and IL-4 production in future work.

4. In multiple places in the text it is stated that Pichia is absent from the gut at different time points, however no data was shown to directly support this conclusion. Either add data or delete these statements.

Our apologies for not clearly describing our experimental methods. The text has been revised to indicate that colonization occurs only during the period when the pups are housed with dams (who received the Pichia treatment and are also colonized during the treatment period), until weaning at 19 days of age.

Line 114-133: “To establish a causal role for early life fungal dysbiosis in asthma etiology and validate previous findings in the ECUAVIDA cohort, we exposed mice to P. kudriavzevii during the neonatal period and then used the house dust mite (HDM) model of AAD to induce airway inflammation at six weeks of age (Figure 1A,B). Pups were exposed to either P. kudriavzevii suspended in phosphate buffered saline (PBS) or PBS alone by painting the abdomen and face of lactating dams with these respective solutions every second day for two weeks following birth.”

Line 154-166: “Colony counts at day 16 (Figure 2A) and 21 (no colonies present) of life revealed that although levels were highly variable, P. kudriavzevii colonized the guts of pups born to dams treated for two weeks with this yeast until at least two days after the final treatment, but was no longer present in the gut microbiota after they were weaned on day 19 of life. Thus, pups were only colonized during the period when they were co-housed with dams and littermates, indicating that persistent exposure is required to maintain colonization (Figure 2-supplement 1a).”

After weaning, pups are moved to new cages and housed with same-sex littermates. Colonization during the first 3 weeks was assessed by colony counts and by plating fecal samples (when it was possible to collect fecal samples) from mice at days 14, 16, 18, and 21 of life. These data have been added as Figure 2-supplement 1. We plated the intestines of a small number of mice on day 9 of life by sacrificing these pups and found by qualitative observation of colony growth that there was abundant colonization. qPCR for Pichia at day 21 and 28 of life further confirmed barely/no detectable levels of Pichia in fecal pellets (defined as Ct >30 using primers specific for P. kudriavzevii), respectively. See Excel file provided to reviewers.

qPCR was done using the Qiagen Quantinova SYBR kit according to the manufacturer’s instructions and the following primers (3) (which we identified to be specific for P. kudriavzevii at Ct’s below 30):

F: CTGGCCGAGCGAACTAGACT

R: TTCTTTTCCTCCGCTTATTG

~169bp product.

Each reaction contained:

-2µl of template DNA

-QuantiNova SYBR Green master mix (Qiagen)

-Rox reference dye (Qiagen)

-H2O

-forward primer (10µM)

-reverse primer (10µM)

10µl reaction volume

The cycling protocol was as follows:

- 95oC for 2min

-40x: [(95oC for 5s) + (60oC for 30s)]

a. Line 114 – no data shown for colony counts at 21 days, remove from text or add this missing figure.

We agree that this is an important part of our findings, particularly because it speaks to the sensitivity of the early life window for immune development. We have struggled, however, with how to properly show a lack of colonies. Please see the added Figure 2-supplement 1 where we attempt to demonstrate this, visually.

b. Line 116 – no data is shown to support that Pichia is gone after weaning. Without showing that Pichia did not persist after weaning then, it is possible that prolonged fungal colonization is responsible for the AAD phenotype observed. Address this inconsistency by adding in the relevant data or addressing in the text.

We recognize that a lack of colony counts might difficult to represent, we therefore also performed PCR on the inoculum used in the GF experiment and found no evidence for the presence of Pichia based on the gel and qPCR (see added Excel file).

c. Line 120-124 – no data shown to support that there is no Pichia in the gut at 4 weeks.

Please see the added Figure 2-supplement 1 where we attempt to demonstrate this, visually.

d. Line 131-132 – have not shown fungal colonization ends at a particular day.

In addition to the additional colony counting data obtained through the revision experiment described in point 2 above, we performed ITS-2 sequencing on fecal pellets collected at four and eight weeks of age from our original experiments, but found no sequences that were annotated as Pichia (or Isaatchenkia orientalis, which is what the UNITE database calls P. kudriavzevii). This is also now clarified in the text:

Line 154-166: “Colony counts at day 16 (Figure 2A) and 21 (no colonies present) of life revealed that although levels were highly variable, P. kudriavzevii colonized the guts of pups born to dams treated for two weeks with this yeast until at least two days after the final treatment, but was no longer present in the gut microbiota after they were weaned on day 19 of life. Thus, pups were only colonized during the period when they were co-housed with dams and littermates, indicating that persistent exposure is required to maintain colonization (Figure 2-supplement 1a).”

When we performed a formal fungal microbiota sequencing analysis using the ITS86(F) and ITS4(R) primers in a subset of samples, all of the resulting sequencing files were <1Mb in size, indicating that very few fungi were detected (according to the standards used by Integrated Microbiome Resources, where the sequencing was done, the sequencing actually failed). Once we processed the sequencing data, very few samples passed the quality filtering steps and the fungal sequencing was therefore not done for all experiments (n=8 from stool collected at 4 weeks of age from animals treated neonatally (n=4 per treatment condition), n=8 from adolescent mice (6 weeks; n=4/treatment condition treated in adolescence), n=10 from stool collected at 8 weeks of age (n=2 controls, n=8 Pichia; data not fully processed given that only 3 samples had >150kb of raw data) at experimental endpoint after the HDM asthma model).

Interestingly, we noted that the number of reads/data recovered from samples collected at four weeks of age was higher than the number of reads we obtained when analyzing samples collected in adolescence or at experimental endpoint, even in Pichia-treated animals. After sequence quality filtering and taxonomic assignment, only 2 samples per treatment condition in the adolescent mice contained >500 fungal reads. All 8 samples from 4-week-old mice had at least 500 reads, but the fungal communities did not differ significantly in α or β (Bray-Curtis) diversity.

Age Treatment Number of reads (after processing)
Adolescent (6 weeks) Control 728
Adolescent (6 weeks) Control 379
Adolescent (6 weeks) Control 2038
Adolescent (6 weeks) Control 308
Adolescent (6 weeks) Pichia 552
Adolescent (6 weeks) Pichia 466
Adolescent (6 weeks) Pichia 143
Adolescent (6 weeks) Pichia 873
4 weeks Control 752
4 weeks Control 750
4 weeks Control 7485
4 weeks Control 2128
4 weeks Pichia 1922
4 weeks Pichia 532
4 weeks Pichia 842
4 weeks Pichia 1220

Samples collected at 4 weeks of age from animals treated neonatally:

Author response image 3.

Author response image 3.

adonis(formula = braydist_ITSpn1 ~ Treatment, permutations = 4999)Permutation: free

Number of permutations: 4999

Terms added sequentially (first to last)

Df SumsOfSqs MeanSqs F.Model R2 Pr(>F)

Treatment 1 0.28239 0.28239 1.158 0.16178 0.2592

Residuals 6 1.46316 0.24386 0.83822

Total 7 1.74555 1.00000

Author response image 4.

Author response image 4.

Looking at the fungal genera identified, the majority of the fungi present were likely food-derived (P1 at the start of the SampleID indicates these mice were treated postnatally with Pichia or vehicle; the following C indicates control animals and P indicates Pichia animals):

Author response image 5.

Author response image 5.

Text has been added to indicate this:Line 170-174: “The absence of robust fungal communities in these animals at four and eight weeks of age was verified by assessing for the presence of fungi in DNA isolated from fecal samples using high-throughput sequencing and primers targeting the internal transcribed spacer region (ITS-2) of the fungal 18S rRNA gene (sequencing files generated <1Mb of raw data per sample).”

5. A discussion of data in Figure 3C-F correlates with previously published studies on bacterial dysbiosis and AAD would be a beneficial addition. Clostridales are mentioned as a direct contributor to SCFA, is the abundance of members of this genus altered in the experiment shown?

This is an excellent question, and one of particular interest for our lab. Please see our detailed response to point 9 below.

6. In Figure 3-supplemental 1, data is shown to support the hypothesis that the bacterial composition change in the gut alone does not account for the changes in immune response however no data is shown to verify that the fecal transplant procedure successfully recapitulated the Pichia exposed gut microbiome. An analysis comparing data in Figure 3D and Figure 3 supplemental 1B-D is important to show that the bacterial species present in the fecal sample obtained from the mice exposed to Pichia were able to successfully colonize the germ-free mice and be representative of the original population.

Thank you for this suggestion. This reviewer is correct in that colonization of germfree mice does not always reflect the donor. We were, therefore, pleased to see that all but one bacterial genus (Butyricicoccus-present at low abundance) transferred to the germ-free mice after removing low-frequency features and data filtering/rarefaction. Germ-free mice also had an expansion in the relative abundance of Akkermansia, Bifidobacterium, and Allobaculum, which was accompanied by a reduced relative abundance of Lactobacillus relative to the four-week-old SPF mice. This comparison has now been included in Supplementary file 2, and we feel it supports the important findings from this experiment.

It would also be interesting to do the same analysis with the post-AAD samples to show how Pichia exposed and germ-free colonized mice (Figure 3F and Figure 3-supplemental 1E-F) respond to AAD model – is there a difference?

We agree that this was an interesting analysis. While we feel it is outside of the scope of the present paper in the short report format, we have provided the results in Author response image 6 and Author response image 7.

Author response image 6.

Author response image 6.

Author response image 7.

Author response image 7.

Author response image 6 is the relative abundance of the genera identified in the germ-free animals at sacrifice:

Author response image 7 shows the genera identified in the fecal samples from the SPF mice at sacrifice:

Changes to the text:

1. This study looks at the effects of Pichia on bacterial dysbiosis and immune response but does not show data to support a more general change in fungal dysbiosis (no other fungal species present in the mouse gut were assessed). Throughout the paper, as in line 92-95, this point should not be made without support.

Fungal dysbiosis in this study is defined as an outgrowth of P. kudriavzevii specifically. While transient, we still feel that this fits the definition of a change to the healthy-state microbial community. See response to point 4d. We have also clarified this in the text:

Line 110-113: “Accordingly, using overgrowth of P. kudriavzevii as a model of fungal dysbiosis, we sought to determine whether fungal dysbiosis in the neonatal period influences asthma outcomes later in life, and to identify which aspects of asthmatic immunopathology are affected.”

2. The biological relevance of Figure 2 and Figure 2-supplement 1 are difficult to interpret without first having established colonization/dysbiosis of the gut microbiome. Consider moving Figure 3 first to establish you can recapitulate the dysbiosis seen in children in this mouse model and then show in Figure 2 that this correlates with differences in the immune system later in life.

Thank you for this suggestion. We have now added a line to indicate that pups are colonized during the treatment period:

Line 133-135: “The presence of P. kudriavzevii in the guts of pups born to P. kudriavzevii-treated animals during the two-week treatment period was confirmed by colony counts from plated colon tissues (Figure 2-supplement 1a).”

We have also added a transition sentence to the next paragraph:

Line 151-154: “To further characterize fungal colonization in our model, we plated colon contents or fecal samples from pups born to P. kudriavzevii-treated dams immediately before and after weaning, when the gut microbiota is known to undergo dramatic shifts in community composition.”

3. The data in Figure 4 don't align with the other data in the paper without more discussion of the connection. Expand upon the discussion/relevance of assessing SCFA effects on Pichia in this paper. Have SCFA been shown to impact fungal colonization previously, in analyses that corelate SCFA with decreased AAD? Is the hypothesis being tested that before increased Pichia in children there was changes in the microbiome that decreased local SCFA concentrations and this allowed Pichia overgrowth, which in turn further impact the bacterial gut microbiome and immune development? Clarify a connection in the text as to why Figure 4 is important to the story arc of this paper. It might be useful to present both models in a concluding figure.

This is an excellent point and we are grateful to the reviewer for pointing this out. Clarity on the link between Pichia and the SCFA experiments is now provided by directly referencing the association between low levels of acetate and increased Pichia in the fecal samples from children in Ecuador. The references cited also indicate previous examples (especially from Gary Huffnagle’s group) showing that SCFAs affect the growth of fungi linked to AAD following antibiotic treatment. It has not previously been shown directly that SCFAs impact colonization. The rationale behind the SCFA investigation is that the neonatal gut of infants at risk of asthma is uniquely susceptible to transient colonization by microbes encountered by chance due to bacterial dysbiosis and a lack of SCFAs, and that transient colonization subsequently has the potential to alter both local gut microbiota communities and normal immune development. It is also possible that fungal colonization is a chance event that occurs in the general context of the neonatal gut, where colonization resistance is low, which then precipitates both bacterial and fungal dysbiosis during a critical window of concurrent immune development that increases an infant’s risk of developing asthma (i.e. we cannot say whether the bacterial or fungal dysbiosis occurs first). A detailed analysis/comparison of Clostridiales or SCFAs in the mouse samples collected after weaning would therefore not make biological sense (we suggest that reduced SCFA-producing bacterial communities precede fungal dysbiosis, rather than cause these changes, and Figure 2 shows bacterial communities after fungal dysbiosis has already occurred). We have made the following changes to add clarity:

Lines 231-236: “Given that SCFAs have also been demonstrated to protect against asthma development and to be reduced in abundance in stool from infants at risk of asthma in Ecuador (in conjunction with fungal dysbiosis), the CHILD cohort, and other birth cohorts, we next determined whether part of the asthma-protective effects of SCFAs could be mediated by preventing colonization of the infant gut by asthma-associated fungi.”

We have also added further clarification to situate these results within the larger context of the story:

Lines 289-294: “Taken together, our results suggest that gut bacterial communities with a reduced capacity for SCFA production in the guts of neonates at risk of asthma are permissive to invasion by transient fungal colonizers. Transient fungal colonization, in turn, may either directly or indirectly through disruption to the normal temporal succession of neonatal gut microbiota communities required for appropriate immune development, further alter immune development and susceptibility to asthma (Figure 4).”

We hope that our study will serve to inform future studies aimed at validating this work further, including correlation analyses between SCFA levels and fungal load in human data sets.

Thank you for this suggestion for an additional figure, a model putting the story together has now been included as Figure 4.

4. For Figure 3B, to address the relevance of circulating Pichia-specific IgG, compare data to fold changes in other studies in other systems.

Similar differences in IgG levels have been described by others:

Tropini et al. (2018) Cell. (4)

Castro-Dopico et al. (2019) Immunity.(5)

Doron et al. (2021) Cell. (6)

We agree that the response is subtle, but given that the measurement was done 1 week after weaning, when the mice are no longer colonized with Pichia, this is not necessarily surprising. When viewed in a format similar to other papers:

Author response image 8.

Author response image 8.

We have also performed an additional RNA-seq analysis to assess for differences in inflammatory markers/immune responses to Pichia in the guts of 16-day-old mice. These data support the hypothesis that early life colonization with P. kudriavzevii induces changes in the expression of immune-related genes (especially those related to dendritic cell function), including a downregulation of chymotrypsin-like genes (7,8), in the gut. These results have been added to Figure 2-supplement 1b.

5. Line 84 suggest that the data in Figure 1B are significant (p<0.05), but according to the figure they are not, edit text to acknowledge the p-value accordingly.

Thank you for pointing this out, we have removed this from the text.

Reviewer #2:

In this report Boutin and colleagues have investigated the impact of exposing mice to P. kudriavzevii on HDM-induced allergic lung inflammation. The premise of the work comes from previous data from the CHILD study, amongst others, that link certain fungal species with an increased asthma severity.

Thank you for taking the time to thoroughly go through and evaluate our work, we appreciate your feedback.

There are two main conclusions from this work. First, the exposure must occur pre-weening and second, that SCFA directly reduce fungal adherence to intestinal epithelial cells.

Figure 1 is in line with prior reports, setting the rationale for the author's focus on Pichia. The best control to include would be a comparison with another fungi, which might serve as a negative control. As the authors indicate, there are already a number of reports showing anti-fungal treatment, or colonisation with specific fungi, exacerbate allergic inflammation in mouse models. Is there something unique to Pichia, or is a general outgrowth of any fungi seen as increasing susceptibility?

This is a great question and one that is of ongoing interest to us. We have a separate manuscript under review describing a broader view of fungal communities in the guts of children from the CHILD cohort and have therefore refrained from including additional data on this in the present work. Based on our data, it would be an overgeneralization to say that it is a general outgrowth of fungi, however, it is unlikely that this is a phenomenon unique to Pichia. For example, there may be certain features conserved across groups of fungi (ex. the ability to form pseudohyphae or true hyphae (16,17)) that may make these fungi more likely to be associated with asthma outcomes. We attempted to touch on this in our discussion (line 269-285), but are happy to elaborate more if the reviewer would like.

The new data starts with Figure 2 where in general there is an increase in adaptive immune parameters in the Pichia group. Variability is very high, and in many cases, there appear to be 'responders' and 'non-responders', e.g. panel's D, E, G, H. Could these be cage affects? Statistical significance is reached in most cases, likely due to the pooling of experiments to have sufficient numbers. In this respect, it is unclear why data is pooled from 2 experiments in some case, and 3 in others? What is the basis for this? Overall, while there are some differences, particularly in the FACS analysis, the overall phenomenon does not look particularly robust, and disease (as opposed to FACS) parameters are largely missing, e.g. mucus production and lung function. There is no correlation with the level of Pichia colonisation per mouse and the readouts e.g. did the mice showing high levels of eosinophils also have higher CFU of Pichia during the 2 weeks of exposure?

This is an excellent point and one that has led to much discussion within our group. We similarly observed that there was a significant amount of variability in our data and have therefore examined this in detail. While these figures reflect pooled data, our three independent experiments showed the same trends and/or significance in the results. We feel that the repeated statistical significance of our results despite this inherent variability speaks to the robustness of the observed effects of Pichia on inflammatory outcomes during AAD. The original data has been provided as a supplement to indicate this and the figure legends have been updated for clarity. The GATA3+ T cell measurement is the one exception to this as this antibody was only included in the flow cytometry panels in 2 experiments, and therefore this figure represents combined data from 2, rather than 3, experiments.

With regards to the “responder” vs “non-responder” mice, we did observe that female mice appear to be more sensitive to the effects of fungal dysbiosis on AAD (note that female and male mice were housed separately and both sexes were included in the study (1 cage/sex that received Pichia/experimental repeat except for 1 of the 3 repeats)). This is likely in part due to the increased sensitivity of female mice to animal models of allergic disease.

Raising another important point, while ideally the correlation analysis between fungal load and asthma outcomes could be done, we found that this was not possible given the inability to (a) obtain fecal colony counts from pre-weaned neonates or (b) tightly regulate how much Pichia each pup received. Pups are only colonized with Pichia when they are housed with the dams (who are the ones that actually received the treatment), but lose colonization once they are weaned at 19 days of age. Therefore, we were unable to regulate exactly how much Pichia each pup received. Furthermore, before weaning, pups to not produce fully formed fecal samples so colonization has to be measured as an endpoint analysis-i.e. by collecting gut tissues. As a result, the colonization data is collected on different animals from those taken out to the AAD endpoint.

Furthermore, we agree with this reviewer that including additional data on disease parameters in the AAD would strengthen our conclusions. To address this reviewer’s concerns, we attempted to perform IHC for IL-4 in lung sections taken from the experiments where mice were neonatally exposed to P. kudriavzevii but unfortunately were unsuccessful given the age of the samples. We were, however, able to complement our findings using non-FACS-based assessments of airway inflammation by performing additional histology to assess for mucus production using PAS staining using similar methods as published by others (16). These results agreed with our other findings:

Author response image 9. Goblet cell numbers quantified in primary (A), secondary (B), and tertiary (C) airways of mice in Figure 1.

Author response image 9.

(D) Shows the average goblet cell index for all airways in each animal. Figure illustrates combined results of three experiments.

Additional histology methods: Lung sections from mice taken to end-point in the asthma model were stained with periodic acid-Schiff (PAS). Histological scoring was performed by a trained pathologist who was blinded to the study design and specimen IDs. One primary, one secondary, and one tertiary airway was selected from each slide and one hundred sequential airway epithelial cells were identified in each airway. The number of PAS+ cells (goblet cells) per hundred cells was counted and divided by the total number of epithelial cells to render a goblet cell index for each airway of each specimen. The average goblet cell index per section was obtained by averaging the goblet cell index of the three examined airways. When an airway was not visible in a section, this specimen was eliminated from the analysis. All slides were scored blinded.

Finally, we repeated the full 12-week early life exposure experiment and performed an analysis of cells in bronchioalveolar (BAL) washings following asthma induction. These results corroborated our FACS findings.

Author response image 10.

Author response image 10.

The concerns continue with Figure 2-sup where the authors have changed the protocol, now giving the Pichia per oral and post-weening. The conclusion is that the phenomenon no longer exists and thus the exposure must occur pre-weening. In fact, in this case there are far fewer animals and the figure legend indicates this is a single experiment (no repeats referred to?). The pathology score appears to have a similar increase in the Pichia group as in Figure 2, however an outlier in the control group likely stops significance. The fact that there is a lot of variability and so few mice, plus the fact that two different protocols have been used (skin administration vs oral gavage), means that the authors can't conclude the Pichia is only active in early life. These data do not appear robust and the conclusions are overstated.

Thank you for the feedback, these are important points and we appreciate the opportunity to clarify our methods and conclusions. We now realize that the rationale for including these results and the message we attempted to portray with these results was not clearly contextualized. We actually agree with this reviewer on many points and have therefore included this figure as a supplement rather than a main figure. Given the “critical window” hypothesis that bacterial dysbiosis in early life is critical to modulating atopy-associated outcomes later in life, we performed this experiment as a preliminary assessment of whether this hypothesis might hold true in the case of fungal dysbiosis as well. We recognized that it would be difficult to exactly replicate the methods from the early life experiments in older mice, but felt that using the technique of oral gavage would allow us to more tightly regulate how much P. kudriavzevii each animal received while maintaining exposure through the oral route. Given that we obtained negative results with this experiment and that the experiment was only repeated once, we have qualified our language to avoid overstating the results. It is still possible that, if the experiment were to be repeated, adolescent exposure would affect asthma outcomes, but our data do indicate that the effect is more pronounced with neonatal exposure. We hope the text reflects this nuance now:

Line 146-150: “Notably, mice exposed to P. kudriavzevii for two weeks in adolescent life (4-6 weeks of age) via oral gavage did not show evidence of increased lung inflammation in the context of HDM-induced AAD (Figure 1-supplement 1), highlighting the importance of the previously reported “critical window” of life during which the gut microbiota has the greatest ability to affect immune development relevant to asthma.”

In Figure 3 the highly variable exposure to Pichia is noted and the authors argue that there is an increase in Pichia specific IgG, however these data are shown as relative to control and there is a minor shift to around 1.2 in most samples. This analysis does not appear to be robust enough to conclude an adaptive response has been mounted against the Pichia.

Thank you for pointing out this important point. We have now performed an additional RNA-seq analysis in the guts of 16-day old mice to assess for differences in inflammatory markers/immune responses to Pichia. These data support the hypothesis that early life colonization with P. kudriavzevii induces changes in the expression of immune-related genes (especially those related to dendritic cell function), including a downregulation of chymotrypsin-like genes (7,8), in the gut. These results have been added to Figure 2-supplement 1b.

We also agree with this reviewer that our IgG data are subtle. However, given that the measurement was done 1 week after weaning, when the mice are no longer colonized with Pichia, we felt that these results are in line with existing literature. Indeed, similar differences in IgG levels have been described by others:

Tropini et al. (2018) Cell. (4)

Castro-Dopico et al. (2019) Immunity.(5)

Doron et al. (2021) Cell. (6)

The clearest data from Figure 3 comes with the GF recolonisation experiment, which in fact shows that transferring the microbiome from Pichia mice does not transfer any susceptibility. The inferred conclusion therefore is that the effect must be linked with early life immune maturation. However, no evidence is provided to support this. Neonatal GF mice would need to be colonised as a control, and immune parameters measured to prove that there has been some early life imprinting. Moreover, given the need to pool multiple experiments to show their phenomenon in Figure 2, similar numbers of mice are likely required throughout the manuscript to allow robust conclusions.

Thank you for this thoughtful feedback, this reviewer raises several points related to our experimental methods that have generated much discussion within our group. Our rationale for using germ-free mice in this model was based on previous work using germ-free mice as models of neonatal mice with a normal microbiota given the immunological immaturity of germ-free mice (see recent paper: (18)). Colonizing neonatal GF mice with our experimental set-up without also transferring Pichia to the GF mice would have been very challenging. Moreover, it has been shown that when fungi alone are provided to germ-free mice, AAD is actually improved (19), indicating that any bacteria/microbial stimulation can trigger the development of the immune system in these animals, and that the presence of bacteria is needed to add biological relevance to the experimental model. We therefore selected to perform the fecal transplant at the earliest time point we could be certain that P. kudriavzevii was not longer present, but bacterial changes in the microbiota could be identified. We have included Figure 2-supplement 2 to show that the bacterial microbiota communities separate according to the treatment condition of the original donor mice, as expected.

Finally, in Figure 4 the authors show that culturing the fungi in vitro in the presence of SCFA reduces fungal adherence to an intestinal epithelial cell line. The data is clear, but the obvious concern is the physiological relevance of this, and also the absence of any link with the prior data in the manuscript. Ideally the authors would include a better negative control, showing that other common intestinal metabolites do not affect fungal adherence. In addition, the SCFA should be utilised at ratios similar to that seen in vivo. In Figure 4, the highest concentration of 150umol/ml is utilised for each SCFA, however if the butyrate and propionate levels were relative to acetate, the conclusion would likely change. Direct cell toxicity of the SCFA should also be reported. These data would also carry more weight if in vivo experiments were performed to test whether there is reduced Pichia colonisation in early life in mice with higher SCFA levels.

These are all excellent points and we apologize for not taking the time in the paper to clearly outline our rationale and highlight the biological relevance of our methods and findings. To address these concerns, we used NaCl as a control for the adherence assay, and have performed an additional experiment using biologically relevant concentrations of SCFAs and biotin (an abundant factor produced by gut bacteria) as an additional control. Figure 3K has been updated to reflect the new results. When repeating this experiment, we also used biologically relevant molar ratios of the SCFAs.

We would like to clarify that SCFAs are no longer present in the media when the fungal cells are added to the colon cells (the Pichia cells are spun down and resuspended in a 50/50 solution of YPD and DMEM), so toxicity should not be a concern. Fungal cell stocks used to inoculate the TC7 cells were further plated to confirm viability and confirm that OD measurements tracked with cell counts (included in raw data for the new experiment). We also performed the growth curve and SEM experiments using molar ratios equivalent to concentrations found in the gut and found that butyrate and propionate had similar effects, even at the lower concentrations (see Author response image 11; note that previous studies have used similar concentrations of 100-150μmol/ml of butyrate as “biologically relevant” concentrations (17,20,21)).

Author response image 11. (A-C) Growth over time (top) and optical density (OD) at 600nm at 18 hours (bottom) of Pichia kudriavzevii grown in Yeast Peptone Dextrose (YPD) broth supplemented with the sodium salts of the short chain fatty acids (SCFA) acetate (A), butyrate (B), or propionate (C) at the indicated concentrations.

Author response image 11.

(D-G) Scanning electron microscopy of P. kudriavzevii grown in YPD (D) or the sodium salts of acetate (E), butyrate (F), or propionate (G). (A-C) Data represent results from three independent experiments performed in triplicate. Dots represent biological replicates and data are presented as mean ± SEM. Statistical comparisons are relative to SCFA-free controls. *p < 0.05, **p < 0.01, ***p < 0.001.

We initially performed the epithelial cell adhesion assay as a proof-of-concept assay to demonstrate that reduced hyphae formation has a functional consequence for adherence. To further support these findings, we have performed an additional in vivo experiment to assess the ability of orally delivered biologically relevant molar ratios of the SCFAs to inhibit the colonization of the murine gut by P. kudriavzevii. We observed that mice supplemented with a cocktail of SCFAs in their drinking water exhibit a trend toward reduced colonization with P. kudriavzevii following antibiotic treatment and fungal oral gavage. This has been added as a new Figure 3-supplement 1. We cannot control the amount of Pichia each pup receives, so while we have attempted the early-life supplementation with SCFAs, it is difficult to determine how SCFAs impact colonization. For this reason, the in vivo experiments have been done in adult mice pre-treated with antibiotics.

Overall, although conceptually the manuscript is interesting, there are major concerns related to the robustness of the datasets and comparisons that are drawn between the different experimental systems.

Thank you for your feedback, we hope that we have clarified some of the methods and comparisons now.

Reviewer #3:

Boutin et al. performed a throughout study to investigate the cause of allergic airway disease induced by early fungal colonization. They used the commensal fungus Pichia kudriavzevii as reasonable example in mouse models. They furthermore demonstrate that the disease is only induced when mice are exposed early in life and that the resulting disease is predominantly induced by the fungus and not the resulting microbiome.

I believe this is a well thought out and conducted study. The following points should be considered by the authors for improving the quality and clarity of their study:

Thank you for your positive feedback, we are grateful to this reviewer for taking the time to review our manuscript and for the opportunity to further clarify and expand upon our findings.

The major problem in the manuscript is the unjustified experiments with SCFAs. Suddenly in the manuscript there is a statement that SCFAs have been reported in the literature to inhibit fungi so the authors decided to test some of them for their inhibitory role on P. kudriavzevii. Subsequently and after the successful testing of the inhibitory role of the tested SCFAs in vitro the authors claimed that they have found the mechanism behind colonization of P. kudriavzevii. The authors could support this in several ways:

- There is a huge variation in the P. kudriavzevii levels of the 115 subjects from the Child cohort. A 16S rRNA analysis of these subjects and a correlation analysis with P. kudriavzevii levels could prove that SCFA bacterial producers correlate negatively with P. kudriavzevii levels. The authors could measure the SCFAs in the stool samples of these children to confirm their hypothesis.

Thank you for highlighting this important point. In response to this feedback, we have taken the time to further clarify and more clearly outline the rationale for the SCFA experiments and link these findings to the rest of the paper/existing literature. While we have not directly measured SCFA levels in human stool samples used in the present analysis, our lab’s previous publication in Science Translational Medicine (Arrieta et al., 2015) measured fecal SCFA levels in stool samples from a subset of children in the CHILD cohort and found that acetate was reduced in samples from infants who developed atopy and wheeze later in life. Similarly, we found that acetate levels were reduced in samples collected at 3 months of age from infants in Ecuador who developed atopy and wheeze at age five years (Arrieta et al., 2018). These same infants also had increased Pichia in the same stool samples. This information has been clarified now:

Lines 231-234: “Given that SCFAs have also been demonstrated to protect against asthma development and to be reduced in abundance in stool from infants at risk of asthma in Ecuador (in conjunction with fungal dysbiosis), the CHILD cohort, and other birth cohorts(1,22–26).”

We also agree with this reviewer that our study does not identify the mechanism behind colonization, but rather generates several hypothsesis that require testing in future work. Clarity on the link between Pichia and the SCFA experiments is now provided by directly referencing the association between low levels of acetate and increased Pichia in the fecal samples from children in Ecuador. The rationale behind the SCFA investigation is that the neonatal gut of infants at risk of asthma is uniquely susceptible to transient colonization by microbes encountered by chance due to bacterial dysbiosis and a lack of SCFAs, and that transient colonization subsequently has the potential to alter both local gut microbiota communities and normal immune development. It is also possible that fungal colonization is a chance event that occurs in the general context of the neonatal gut, where colonization resistance is low, which then precipitates both bacterial and fungal dysbiosis during a critical window of concurrent immune development that increases an infant’s risk of developing asthma (i.e. we cannot say whether the bacterial or fungal dysbiosis occurs first). We have made the following changes to add clarity:

Lines 231-236: “Given that SCFAs have also been demonstrated to protect against asthma development and to be reduced in abundance in stool from infants at risk of asthma in Ecuador (in conjunction with fungal dysbiosis), the CHILD cohort, and other birth cohorts, we next determined whether part of the asthma-protective effects of SCFAs could be mediated by preventing colonization of the infant gut by asthma-associated fungi.”

We have also added further clarification to situate these results within the larger context of the story:

Lines 289-294: “Taken together, our results suggest that gut bacterial communities with a reduced capacity for SCFA production create conditions permissive to invasion by transient fungal colonizers. In the neonatal gut. Transient fungal colonization, in turn, may either directly or indirectly through disruption to the normal temporal succession of neonatal gut microbiota communities required for appropriate immune development, further alter immune development and susceptibility to asthma (Figure 4).”

We hope that our study will serve to inform future studies aimed at validating this work further, including correlation analyses between SCFA levels and fungal load in human data sets. To further bring together the 2 parts of our paper, a model putting the story together has now been included as Figure 4.

- In the mice experiments I would like to see that supplementation of the food with these SCFAs indeed leads to colonisation resistance against P. kudriavzevii.

- Alternatively, a concomitant oral gavage of a known strong SCFA bacterial producer and P. kudriavzevii could offer the evidence needed to support the authors hypothesis.

Thank you for this excellent suggestion; this is an important point that our group has discussed at length in an attempt to identify the most appropriate experimental approach. We appreciate the opportunity to further elaborate on several experiments we have performed to address these questions.

We have performed an experiment where adult animals pre-treated with antibiotics (to allow for fungal colonization and mimic the neonatal gut) were supplemented with short-chain fatty acids and orally gavaged with P. kudriavzevii. Specifically, six to seven-week-old male and female mice were housed two per cage and drinking water was supplemented with 0.5mg/mL cefoperazone (Σ catalog #62893-20-3) as previously described (27) on Days 0-3 to clear the intestinal bacterial microbiota. Half of the mice further had their water supplemented with a cocktail of SCFAs according to previously established protocols (23,28) for the duration of the experiment. The cocktail consisted of sodium acetate (67.5mM), sodium propionate (25.9mM), and sodium butyrate (40mM), and the control animals received water that was pH and sodium matched (28). All water was filter sterilized and had Splenda added (8g/L) to improve palatability. On Day 3, all mice were given an oral gavage with 107 cells of P. kudriavzevii obtained from a 48-hour culture generated from a single colony of yeast and grown at 37°C while shaking. Two days after the gavage, fecal samples were collected for plating. Uncolonized mice were removed from the analysis.

We observed that mice supplemented with a cocktail of SCFAs in their drinking water exhibit a trend toward reduced colonization with P. kudriavzevii following antibiotic treatment and fungal oral gavage. This has been added as a new Figure 3-supplement 1. We acknowledge that this experiment has limitations as a result of differences in water consumption by the mice and other technical challenges. Due to experimental restrictions resulting from the Covid-19 pandemic, however, we were unable to troubleshoot the experimental protocol but feel that the results still support our conclusions. We feel that our epithelial cell adhesion assay is a realistic representation of the influence of SCFAs on fungal cell colonization and is sufficient to support our claims.

Lines 248-257: Furthermore, mice supplemented with a cocktail of SCFAs in their drinking water exhibited a trend toward reduced colonization with P. kudriavzevii following antibiotic treatment and fungal oral gavage (Figure 3-supplement 1).

Furthermore, we performed a pilot study wherein we supplemented dams with 4mg/mL Splenda and 20mM sodium acetate in the drinking water (intervention group; n=4 but one dam who received P. kudriavzevii perished due to dehydration) according to previously described methods (22) or water supplemented with Splenda only (control group; n=2) beginning at 14 days gestation. Water was changed every two days until the pups were weaned at three weeks of age. Half of the dams in each water treatment condition were treated with P. kudriavzevii as described in the methods section. The house dust mite (HDM) model of AAD was then used to induce asthma in the pups once they reached six weeks of age. In these pups, we observed a decreased in the severity of AAD in animals treated with acetate, regardless of P. kudriavzevii exposure status, making it difficult to draw direct conclusions of the ability of SCFAs to protect against AAD through a reduction in fungal colonization. These findings further supported our decision to use the epithelial cell adhesion assay rather than in vivo experiments to directly show the ability of SCFAs to affect the ability of fungal cells to adhere to epithelial cells in the gut.

Author response image 12. Number of eosinophils (left) and percentage of IL-17+ (middle) and ICOS+ (right) T cells in the lungs of mice given allergic airway disease via house dust mite extract sensitization and challenge in adulthood.

Author response image 12.

Gating strategies are indicated on the y-axis. Animals were neonatally exposed to the yeast Pichia kudriavzevii (Pichia) or PBC (control) and born to dams supplemented with either both acetate and 4mg/mL Splenda and 200mM sodium acetate (acetate) or Splenda alone (Splenda) in drinking water.

One of the most interesting findings was that: unlike the neonatal exposure, mice exposed to P. kudriavzevii for two weeks in adolescent life (4-6 weeks of age) via oral gavage did not demonstrate increased lung inflammation. However, it is not completely clear to me whether the two exposure groups ("neonatal exposure" and "adult exposure" as stated in the Methods) have the same treatment methods and dosage. Please elaborate more on this.

Thank you for your interest in this finding! We agree that this is one of the most interesting aspects of our analysis and appreciate the opportunity to elaborate. Given the “critical window” hypothesis that bacterial dysbiosis in early life is critical to modulating atopy-associated outcomes later in life, we performed this experiment as a preliminary assessment of whether this hypothesis might hold true in the case of fungal dysbiosis as well. We recognized that it would be difficult to exactly replicate the methods from the early life experiments in older mice, but felt that using the technique of oral gavage would allow us to more tightly regulate how much P. kudriavzevii each animal received while maintaining exposure through the oral route. While it was not possible to regulate exactly how much P. kudriavzevii each pup received in the neonatal experiments, we felt that the oral gavage technique would represent an improved method for the adolescent exposure experiments. We also used a 2-week treatment period to more closely replicate our neonatal experiment methods. Given that we obtained negative results with this experiment and that the experiment was only repeated once, we have qualified our language to avoid overstating the results. We hope the text reflects this nuance now:

Line 146-150: “Notably, mice exposed to P. kudriavzevii for two weeks in adolescent life (4-6 weeks of age) via oral gavage did not show evidence of increased lung inflammation in the context of HDM-induced AAD (Figure 1-supplement 1), highlighting the importance of the previously reported “critical window” of life during which the gut microbiota has the greatest ability to affect immune development relevant to asthma.”

The authors stated in Line 387 of the Methods section that "Successful transfer of colonic bacteria was verified via 16S sequencing", but I did not find relevant results or figures.

Thank you for pointing this out, we now realize that this was not sufficiently fleshed out in the text and have made some changes to clarify this point. We have included Figure 2-supplement 2 to show that the bacterial microbiota communities separate according to the treatment condition of the original donor mice, as expected. All but one bacterial genus (Butyricicoccus-present at low abundance) transferred to the germ-free mice after removing low-frequency features and data filtering/rarefaction.

Line 128: “Bacterial populations of P. kudriavzevii-exposed and -naïve mice separated moderately”

Please supply an effect size measure in the corresponding figure or text to elucidate what a ‘moderate’ effect is in this context.

The term “moderately” has been removed for clarity and the p-value (p=0.01) has been added to the text.

Line 131: High variability and low sample size for a mice-based 16s rRNA analysis, in Figure 3C, 3D, 3F (as main results), although being statistically significant. The authors used Bray-Curtis Dissimilarity as community β-diversity measures, I wonder whether other distance measures (e.g. weighted/unweighted UniFrac) could have higher power in discriminating the two groups.

Thank you for your feedback. We have controlled for variance caused by cage effects (as described in the methods), which is why the R2 and p-values are not as dramatic as you might expect based on looking at the figure. We also saw that mice separated according to treatment condition in an independent experiment. We obtained very similar results using UniFrac metrics, and in some instances the effect size (R2) was less than when using the Bray-Curtis dissimilarity.

Line 132: I would suggest adding the points for individual samples in Figure 3E.

Done for 3E and Figure 2-supplement 2.

Line 272: Is four-week-old mice really "adult exposure" as stated in the subtitle? or, adolescent?

This is now changed to adolescent.

Line 383: were the recipient germ-free mice 12-16-week-old? Based on the figure legend of Figure 3-supplement 1a, AAD induction was at day 42 (week 6). Please confirm and/or clarify.

The recipient mice were 12-16 weeks old. The day 42 refers to the experimental timeline. This is now clarified in the figure legend:

(a) Experimental design (numbers indicate days of experimental timeline beginning from birth of donor mice).

Figure 1: As statement by the authors, the variation is high with respect to fungal counts. If possible, scatter or bee swarm plots would help to assess the variation better.

See response to Reviewer 1, point 1.

Figure 2c In the caption, the pathology score is shown and referenced as "left; 5-20". However, controls clearly show a value below 5. Please correct the range or elucidate.

Thank you for noticing this. This was a mistake, as the range is 4-20 (4 parameters scored on a scale of 1-5). The legends have been updated.

Figure 2-suppl c: Same as with Figure 2C, please correct the caption.

This has been corrected.

Figure 3c-d: Please report a proper effect size in the plot (such as F-values or R2) or in the caption in addition to the p-value.

R2 values have been added here and in the Figure 2-supplement 2.

Figure 3—figure supplement c "Relative abundances of the top 100 sequences at genus level […]"

"Top 100 sequences" does not make sense in this context. Please correct or elucidate. I guess it should be similar to Figure 3—figure supplement E.

Thank you. This has been changed to indicate that it includes all identified genera in the data sets.

Figure 3-suppl e "top 100 genera"

Only 19 genera are shown in the plot (which is reasonable). Please report it properly in the caption.

Corrected.

Please lower case the sub-figure letters in the figure captions (or vice versa).

Thank you, this has been corrected.

References:

1. Arrieta MC, Arévalo A, Stiemsma L, Dimitriu P, Chico ME, Loor S et al. Associations between infant fungal and bacterial dysbiosis and childhood atopic wheeze in a nonindustrialized setting. J Allergy Clin Immunol 2018;142:424-434.e10.

2. Douglass AP, Offei B, Braun-Galleani S, Coughlan AY, Martos AAR, Ortiz-Merino RA et al. Population genomics shows no distinction between pathogenic Candida krusei and environmental Pichia kudriavzevii: One species, four names. PLoS Pathog 2018;14:e1007138.

3. Carvalho A, Costa-De-Oliveira S, Martins ML, Pina-Vaz C, Rodrigues AG, Ludovico P et al. Multiplex PCR identification of eight clinically relevant Candida species. Med Mycol 2007;45:619–627.

4. Tropini C, Moss EL, Merrill BD, Ng KM, Higginbottom SK, Casavant EP et al. Transient Osmotic Perturbation Causes Long-Term Alteration to the Gut Microbiota. Cell 2018;173:1742-1754.e17.

5. Castro-Dopico T, Dennison TW, Ferdinand JR, Mathews RJ, Fleming A, Clift D et al. Anti-commensal IgG Drives Intestinal Inflammation and Type 17 Immunity in Ulcerative Colitis. Immunity 2019;50:1099-1114.e10.

6. Doron I, Leonardi I, Li X V, Kusakabe T, Puel A, Iliev ID. Human gut mycobiota tune immunity via CARD9- dependent induction of anti-fungal IgG antibodies Article Human gut mycobiota tune immunity via CARD9-dependent induction of anti-fungal IgG antibodies. Cell Published Online First: 2021. doi:10.1016/j.cell.2021.01.016.

7. Naujokat C, Berges C, Höh A, Wieczorek H, Fuchs D, Ovens J et al. Proteasomal chymotrypsin-like peptidase activity is required for essential functions of human monocyte-derived dendritic cells. Immunology 2007;120:120–132.

8. Chiba S, Ikushima H, Ueki H, Yanai H, Kimura Y, Hangai S et al. Recognition of tumor cells by Dectin-1 orchestrates innate immune cells for anti-tumor responses. eLife 2014;3:1–20.

9. Boutin RCT., Sbihi H, Dsouza M, Malhotra R, Petersen C, Dai D et al. Mining the infant gut microbiota for therapeutic targets against atopic disease. Allergy 2020;published. doi:https://doi.org/10.1111/all.14244.

10. Arrieta MC, Stiemsma LT, Dimitriu PA, Thorson L, Russell S, Yurist-Doutsch S et al. Early infancy microbial and metabolic alterations affect risk of childhood asthma. Sci Transl Med 2015;7:307ra152.

11. Willart MAM, Deswarte K, Pouliot P, Braun H, Beyaert R, Lambrecht BN et al. Interleukin-1α controls allergic sensitization to inhaled house dust mite via the epithelial release of GM-CSF and IL-33. J Exp Med 2012;209:1505–1517.

12. Schuijs MJ, Willart MA, Vergote K, Gras D, Deswarte K, Ege MJ et al. Farm dust and endotoxin protect against allergy through A20 induction in lung epithelial cells. Science 2015;349:1106–1110.

13. Shao TY, Ang WXG, Jiang TT, Huang FS, Andersen H, Kinder JM et al. Commensal Candida albicans Positively Calibrates Systemic Th17 Immunological Responses. Cell Host Microbe 2019;25:404-417.e6.

14. Park J, Kim M, Kang SG, Jannasch AH, Cooper B, Patterson J et al. Short-chain fatty acids induce both effector and regulatory T cells by suppression of histone deacetylases and regulation of the mTOR–S6K pathway. Mucosal Immunol 2015;8:80–93.

15. Zhang Z, Biagini Myers JM, Brandt EB, Ryan PH, Lindsey M, Mintz-Cole RA et al. β-Glucan exacerbates allergic asthma independent of fungal sensitization and promotes steroid-resistant TH2/TH17 responses. J Allergy Clin Immunol 2017;139:54-65.e8.

16. Skalski JH, Limon JJ, Sharma P, Gargus MD, Nguyen C, Tang J et al. Expansion of commensal fungus Wallemia mellicola in the gastrointestinal mycobiota enhances the severity of allergic airway disease in mice. PLoS Pathog 2018;14:e1007260.

17. Noverr MC, Huffnagle GB. Regulation of Candida albicans Morphogenesis by Fatty Acid Metabolites. Infect 2004;72:6206–6210.

18. Bernardes EVT, Kucha V, Gutierrez MW, Laforest-lapointe I, Jendzjowsky NG, Cavin J et al. in microbiome assembly and immune. 2020;:1–16.

19. Jiang TT, Shao TY, Ang WXG, Kinder JM, Turner LH, Pham G et al. Commensal Fungi Recapitulate the Protective Benefits of Intestinal Bacteria. Cell Host Microbe 2017;22:809-816.e4.

20. Schulthess J, Pandey S, Capitani M, Rue-Albrecht KC, Arnold I, Franchini F et al. The Short Chain Fatty Acid Butyrate Imprints an Antimicrobial Program in Macrophages. Immunity 2019;50:432-445.e7.

21. Smith PM, Howitt MR, Panikov N, Michaud M, Gallini CA, Bohlooly-Y M et al. The microbial metabolites, short-chain fatty acids, regulate colonic Treg cell homeostasis. Science 2013;341:569–573.

22. Thorburn AN, McKenzie CI, Shen S, Stanley D, Macia L, Mason LJ et al. Evidence that asthma is a developmental origin disease influenced by maternal diet and bacterial metabolites. Nat Commun 2015;6:7320.

23. Cait A, Hughes MR, Antignano F, Cait J, Dimitriu PA, Maas KR et al. Microbiome-driven allergic lung inflammation is ameliorated by short-chain fatty acids. Mucosal Immunol 2018;11:785–795.

24. Trompette A, Gollwitzer ES, Yadava K, Sichelstiel AK, Sprenger N, Ngom-Bru C et al. Gut microbiota metabolism of dietary fiber influences allergic airway disease and hematopoiesis. Nat Med 2014;20:159–166.

25. Arrieta M, Stiemsma LT, Dimitriu PA, Thorson L, Russell S, Yurist-doutsch S et al. Early infancy microbial and metabolic alterations affect risk of childhood asthma. Sci Transl Med 2015;7:ra152.

26. Roduit C, Frei R, Ferstl R, Loeliger S, Westermann P, Rhyner C et al. High levels of butyrate and propionate in early life are associated with protection against atopy. Allergy Eur J Allergy Clin Immunol 2019;74:799–809.

27. Noverr MC, Falkowski NR, Mcdonald RA, Mckenzie AN, Huffnagle GB. Development of Allergic Airway Disease in Mice following Antibiotic Therapy and Fungal Microbiota Increase: Role of Host Genetics, Antigen, and Interleukin-13. Infect Immun 2005;73:30–38.

28. Smith PM, Howitt MR, Panikov N, Michaud M, Gallini CA, Bohlooly-Y M et al. The microbial metabolites, short-chain fatty acids, regulate colonic Treg cell homeostasis. Science 2013;341:569–573.

Associated Data

    This section collects any data citations, data availability statements, or supplementary materials included in this article.

    Data Citations

    1. Boutin RCT. 2021. Early life Pichia and asthma: NCBI Sequence Read Archive. PRJNA624902
    2. Boutin RCT. 2021. Pichia Exposure RNAseq. NCBI Sequence Read Archive. PRJNA706731

    Supplementary Materials

    Figure 1—source data 1. qPCR quantification of Pichia kudriavzevii DNA in CHILD Cohort participants.
    Figure 1—source data 2. qPCR quantification of fungal DNA in CHILD Cohort participants.
    Figure 2—source data 1. Neonatal exposure lung cell counts.
    Figure 2—source data 2. Neonatal exposure serum IgE.
    Figure 2—source data 3. Neonatal exposure lung histology scoring.
    Figure 2—source data 4. Neonatal exposure lung histology.
    Figure 2—source data 5. Neonatal exposure lung pathology.
    Figure 2—figure supplement 1—source data 1. Adolescent exposure lung cell counts.
    Figure 2—figure supplement 1—source data 2. Adolescent exposure histology scoring.
    Figure 3—source data 1. Neonatal exposure colony counts.
    Figure 3—source data 2. Neonatal exposure Pichia-specific IgG.
    Figure 3—source data 3. Neonatal exposure colony counts.
    Figure 3—source data 4. Neonatal exposure colony counts.
    Figure 3—figure supplement 1—source data 1. Pichia colonization time course.
    Figure 3—figure supplement 4—source data 1. Germ-free mice lung cell counts.
    Figure 3—figure supplement 4—source data 2. Germ-free mice serum IgE.
    Figure 4—source data 1. SCFA growth curve.
    Figure 4—source data 2. SCFA growth curve.
    Figure 4—source data 3. SCFA growth curve.
    Figure 4—source data 4. SCFA growth curve.
    elife-67740-fig4-data4.xlsx (326.2KB, xlsx)
    Figure 4—source data 5. SCFA growth curve.
    elife-67740-fig4-data5.xlsx (332.7KB, xlsx)
    Figure 4—source data 6. SCFA growth curve.
    elife-67740-fig4-data6.xlsx (213.6KB, xlsx)
    Figure 4—source data 7. SCFA growth curve.
    elife-67740-fig4-data7.xlsx (284.9KB, xlsx)
    Figure 4—source data 8. SCFA growth curve.
    Figure 4—source data 9. SCFA growth curve.
    Figure 4—figure supplement 1—source data 1. SCFA supplementation colonization.
    Source data 1. R code for RNA-seq data.
    elife-67740-data1.zip (1.4KB, zip)
    Transparent reporting form

    Data Availability Statement

    Data Availability: All data generated or analyzed during this study are included in the manuscript and supporting files. Bacterial sequencing data have been deposited in the NCBI SRA under accession code SUB7276684 (https://www.ncbi.nlm.nih.gov/sra/PRJNA624902). RNA-seq data is deposited under Bioproject ID PRJNA706731 (http://www.ncbi.nlm.nih.gov/bioproject/706731).

    The following datasets were generated:

    Boutin RCT. 2021. Early life Pichia and asthma: NCBI Sequence Read Archive. PRJNA624902

    Boutin RCT. 2021. Pichia Exposure RNAseq. NCBI Sequence Read Archive. PRJNA706731


    Articles from eLife are provided here courtesy of eLife Sciences Publications, Ltd

    RESOURCES