

SUMMARY
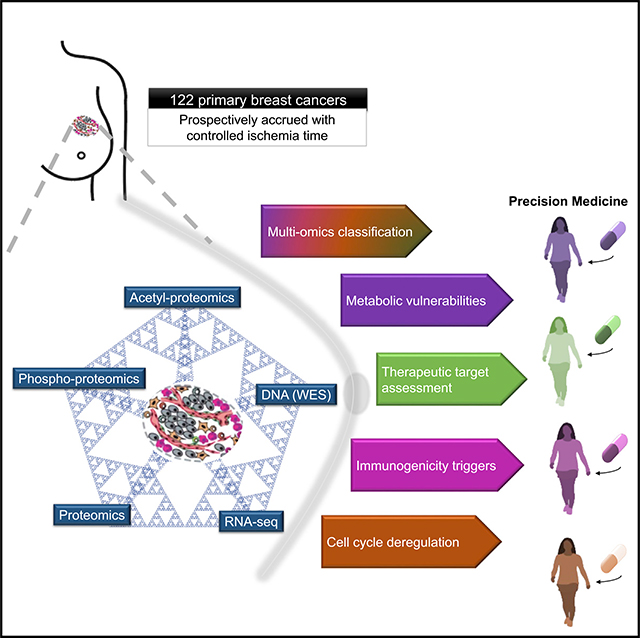
The integration of mass spectrometry-based proteomics with next-generation DNA and RNA sequencing profiles tumors more comprehensively. Here this “proteogenomics” approach was applied to 122 treatment-naive primary breast cancers accrued to preserve post-translational modifications, including protein phosphorylation and acetylation. Proteogenomics challenged standard breast cancer diagnoses, provided detailed analysis of the ERBB2 amplicon, defined tumor subsets that could benefit from immune checkpoint therapy, and allowed more accurate assessment of Rb status for prediction of CDK4/6 inhibitor responsiveness. Phosphoproteomics profiles uncovered novel associations between tumor suppressor loss and targetable kinases.Acetylproteome analysis highlighted acetylation on key nuclear proteins involved in the DNA damage response and revealed cross-talk between cytoplasmic and mitochondrial acetylation and metabolism. Our results underscore the potential of proteogenomics for clinical investigation of breast cancer through more accurate annotation of targetable pathways and biological features of this remarkably heterogeneous malignancy.
In Brief
Breast cancer is a highly heterogeneous disease with variable outcomes and subtype-driven treatment approaches, making precision medicine a considerable challenge. Proteogenomic analyses of 122 primary breast cancers provide insights into clinically relevant biology, including cell cycle dysregulation, tumor immunogenicity, aberrant metabolism, and heterogeneity in therapeutic target expression.
Graphical Abstract
INTRODUCTION
The heterogeneity of breast cancer (BRCA) biology deeply challenges the drive for personalized treatment (Hyman et al., 2017). Contemporary precision therapies target defects in DNA repair, activated protein kinases, the estrogen receptor (ER), and the immune tumor microenvironment, often in combination (Telli et al., 2019). Effective application of these approaches depends on our ability to accurately profile tumors to identify individual therapeutic vulnerabilities, but current methods in early-stage BRCA, including mRNA-based prognostic tests, are inadequate (Coates et al., 2015; Ross et al., 2007). Although more comprehensive genomic techniques are used in the advanced disease setting, the interpretation and clinical implementation of the resulting data have proved to be challenging, with many recurrent mutations currently undruggable (Condorelli et al., 2019). Furthermore, recently introduced treatments, such as CDK4/6 and immune checkpoint inhibitors, do not have robust predictive biomarkers, which can lead to missed therapeutic opportunities and overtreatment (O’Leary et al., 2016; Shindo et al., 2019).
Proteogenomics is an approach to tumor profiling that combines next-generation DNA and RNA sequencing with mass spectrometry-based proteomics to provide deep, unbiased quantification of proteins and post-translational modifications such as phosphorylation (Ruggles et al., 2017). The Clinical Proteomic Tumor Analysis Consortium (CPTAC) seeks to perform deep-scale proteogenomics profiling across multiple cancer types. Our initial proteogenomics analysis of BRCA using residual samples from The Cancer Genome Atlas (TCGA) provided proof of principle that proteogenomics represented an advance in BRCA profiling (Mertins et al., 2016). However, the relatively small number of TCGA samples with sufficient material for deep proteomics represented different fragments from those used for genomics, did not uniformly pass proteomics quality assessment, and were not collected using protocols designed to preserve post-translational modifications (Mertins et al., 2014). Here we describe proteogenomics characterization of the largest cohort to date of BRCA samples that were acquired to minimize ischemic time, maximizing fidelity and reducing pre-analytical variability. We offer the first comprehensive report of the BRCA acetylome; present testable hypotheses regarding therapeutic vulnerabilities, cancer biology, and advancement of diagnostic standards; and provide an extensive resource to stimulate further discovery.
RESULTS
Proteogenomic (PG) Characterization of Prospectively Collected Breast Tumors
We prospectively collected treatment-naive primary tumors under a stringent protocol that controlled tissue ischemia (Table S1) to preserve post-translational modifications. Each tumor was cryopulverized, and DNA, RNA, and protein were extracted from the resulting single homogeneous sample (Figure S1A). Tandem mass tag (TMT)-based isobaric labeling provided precise relative quantification of proteins and phosphorylation and acetylation sites following published CPTAC protocols (Mertins et al., 2018; Figure 1A; Figures S1A and S1B). Stringent criteria for protein identification and quantification resulted in high data quality across 15 tumor TMT-plexes (Figures S1C–S1E) connected by a common reference sample (STAR Methods). Notably, all tumors passed post-data acquisition quality control (QC) metrics for proteomics analysis (Figures S1F–S1H), an improvement compared with our previous study (Mertins et al., 2016). Longitudinal data quality and reproducibility were demonstrated across several months of mass spectrometry data acquisition by periodic analysis of full-process replicates of a proteomics comparative reference sample (CompRef; Mertins et al., 2018) and by assessment of inter-plex common reference and replicate sample reproducibility (Figures S1I–S1L). Across the dataset, appropriate filtering (STAR Methods) yielded identification of 29,647 somatic mutations, 23,692 gene-level copy number events, 23,121 gene transcripts, 10,107 proteins, 38,968 phosphorylation sites, and 9,869 acetylation sites (Figure 1A; Table S2).
Figure 1. Proteogenomics (PG) Landscape of BRCA.

(A) Schematic overview of PG data acquired for this cohort.
(B) Unsupervised multi-omics identified four molecular subtypes. Samples are ordered by cluster and membership score in decreasing order.
(C) Kaplan-Meier curves showing survival outcome of PAM50 LumA samples in the METABRIC database that were assigned by a random forest mRNA-based classifier to the NMF LumA-I (red) or LumB-I subtypes (green) compared with PAM50 LumB samples (blue). The p values were derived from log rank tests.
(D) Heatmap showing the fraction of outlier values in each sample per protein. Proteins shown are kinases highly phosphorylated in each NMF cluster with an FDR of less than 0.01 using BlackSheep. Kinases shown in bold were detected as outliers in the prior study. The top panel shows PAM50 and NMF cluster membership as well as NMF membership score. The left panel indicates whether an inhibitor can be found for a given kinase using the DGIdb (Drug Gene Interaction Database). The right panels depict the abundance of the kinase activation loop and kinase substrate enrichment.
(E) Heatmap showing q values from BlackSheep for enrichment of phosphorylation outliers (y axis) in samples with the indicated mutated gene (x axis). Numbers in parentheses indicate the number of samples in each mutational subgroup. Kinases with an FDR of less than 0.01 are shown, and light gray cells indicate kinases that did not show enrichment (FDR ≥ 0.01).
The PAM50 model was applied to RNA sequencing (RNA-seq) data to determine representation of intrinsic subtypes (Parker et al., 2009; Table 1). Somatic mutation profiles and subtype/somatic mutation associations were consistent with previous reports (Cancer Genome Atlas Network, 2012). This BRCA cohort therefore represented a wide range of established genomic and transcriptomic features (Table 1; Figures S2A and S2B). Somatic copy number alteration (SCNA) data were analyzed to detect focal and arm-level events (Mermel et al., 2011; Figures S2C and S2D) with confirmation of anticipated effects on mRNA and protein abundance (Gillette et al., 2020; Mertins et al., 2016; Zhang et al., 2014). Summaries of the results of these integrative multi-omics analytic approaches are provided (Table 1; Figures S2E–S2G; Table S3).
Table 1.
Summary and Assessment of the Sample Cohort.
| Tumor samples | 134 prospectively collected tumors 125 tumors subjected to proteomic analysis 3 tumors excluded due to low quality RNA-seq data 122 tumors fully analyzed |
| PAM50 classification (Table S1A) | HER2-enriched: 11.5% Basal-like: 23.8% LumA: 46.7% LumB: 13.9% Normal-like: 4.1% |
| SMGs landscape (MutSig2CV Q < 0.1; Table S1A; Figure S2A | TP53 (43%), PIK3CA (33%), MAP3K1 (9%), GATA3 (7%), PTEN (7%), AKT1 (4%) |
| Mutational signature analysis (Figure S2B) | W1: chewing_tobacco (COSMIC 29) W2: aging (COSMIC 1) W3/W7: BRCA_Hrdefect (COSMIC 3) W4: UV (COSMIC 7) W5: CT_APOBEC (COSMIC 2) W7: MSI (COSMIC 6) Notes: One sample classified as basal was characterized by an extraordinarily high number of mutations comprising a dominant UV signature, raising the possibility that it might have been a metastatic melanoma, although the BRAF mutation present (F707I) was not pathognomonic. |
| SNCA landscape (GISTIC2 Q < 0.25) (Figures S2C and S2D; Table S3A) | Arm-level amplifications 1q, 3q, 8p, 8q, 16p, 20p, 20q Arm-level deletions: 4q, 8p, 13q, 14q, 15q, 16p, 16q, 17p, 17q, 18p, 18q, 19p, 19q, 22q |
| SCNA to protein/mRNA correlation (Figure S2E) | Pairwise correlations of SCNAs with mRNA and protein abundances in cis (within a locus) and in trans (across the genome) confirmed the characteristic trans effects of 5q and 16q reported previously (Mertins et al., 2016). |
| LINCS CMAP analysis (Figure S2F; Table S3B) | 21 candidate driver genes, located in chromosomes 1, 5q, 6p, 7q, 8q, 10p, 13q and 16q. Notes: Candidate driver genes differed from those reported previously (Mertins et al., 2016), as expected, given a different technology platform for copy number data generation and significant changes in the underlying LINCS database and calculation of connectivity scores (STAR Methods). |
| mRNA-protein correlation (Figure S2G; Table S3C) | Number of RNA-protein pairs (gene level): 9,108; median r: 0.41 Number of significant correlations (FDR < 0.01): 6,609; median r: 0.51 |
| Proteogenomic events with MS/MS support (Tables S3D and S3E) | 3,444 single amino acid variants: 238 somatic 3,206 germline 891 alternative splice forms |
Non-negative Matrix Factorization-Based Multi-omics Classification of BRCA
To explore intrinsic cohort structure using the full complement of proteogenomics data, single-omic and multi-omics clustering were performed for SCNA, mRNA, protein, and individual phosphosite and acetylation site abundance using non-negative matrix factorization (NMF) (Lee and Seung, 1999, 2001). Although NMF yielded between two and six clusters in single-omic analyses (Figure S3A), integrative multi-omics analysis converged on four NMF clusters, with cluster membership scores indicating the strength of association of each sample with a given cluster (Figure 1B; Figures S3B and S3C; Table S4). Clusters designated luminal A-inclusive (NMF LumA-I) and basal-inclusive (NMF Basal-I) were almost entirely composed of tumors with the corresponding PAM50 assignments. Thus, these samples represent the extremes of the BRCA intrinsic subtype classification (Parker et al., 2009; Figure 1B; Figure S3B). The NMF LumA-I cluster was enriched for hormone (estrogen and progesterone) receptor positivity and wild-type TP53 and demonstrated high stromal infiltration scores (Figures S3B and S3D). The NMF Basal-I cluster contained all but one PAM50 basal sample and was strongly enriched for TP53 mutations and negative clinical hormone receptor status (Figure S3B). Higher levels of immune, stemness, and chromosome instability (CIN) scores (Figures S3D–S3G) as well as strong enrichment of proliferation-associated pathways such as E2F targets and the G2/M checkpoint were observed in NMF Basal-I tumors (Figure S3H).
Two clusters showed sample compositions that were discordant with PAM50 subtypes. The luminal B-inclusive cluster (NMF LumB-I) comprised all but one LumB case but also included a subset of PAM50 LumA samples. Association analysis based on core membership (STAR Methods) showed that NMF LumB-I tumors had fewer PIK3CA mutations than NMF LumA-I (binomial p = 1.50 × 10⁻³) and lower stromal infiltration scores (Figures S3B and S3D). The two luminal clusters also showed remarkable dichotomies in pathway space, supporting the concept that, although heterogeneous, these are biologically separate tumor types. For example, cancer hallmark gene set enrichment scores for LumA-I versus LumB-I were significantly anti-correlated even though estrogen response-related terms were positively enriched in both (Figures S3H and S3I). Notably, a mixed PAM50 LumA/B cluster was also observed when clustering the global RNA data in isolation, indicating that PAM50 classification, a method simplified for clinical purposes, does not capture all biological distinctions between LumA and LumB (Figure S3J).
To further probe NMF luminal cluster assignments, random forest classifiers were trained on protein or mRNA data to distinguish PAM50 LumA samples assigned to the NMF LumB-I cluster from PAM50 LumA samples assigned to the NMF LumA-I cluster. When these classifiers were applied to METABRIC data (Curtis et al., 2012), samples from patients with NMF features that drove PAM50 LumA samples into the NMF LumB-I cluster had outcomes that were intermediate between the remaining PAM50 LumA samples and the PAM50 LumB samples (Figure 1C; Figure S3K). This finding supports the NMF assignment of some PAM50 LumA samples to the higher-risk LumB-I cluster.
The HER2-inclusive cluster (NMF HER2-I) was remarkably heterogeneous. Although predominantly composed of HER2-enriched PAM50 subtype samples and samples with centrally confirmed, clinically positive ERBB2 status, NMF HER2-I also included tumors from all four other PAM50 subtypes, suggesting the presence of unifying biological features in NMF informatic space that are absent in the PAM50-based classification (Figure S3B). An in-depth analysis of HER2-unrelated proteomic and phosphoproteomic features that drove clustering in the NMF HER2-I group (Figure S3L) revealed over-representation of Gene Ontology (GO) terms (Ashburner et al., 2000) for proteins serving functions in the endoplasmic reticulum (EnR) and for biosynthesis of sterols and cholesterol derivatives (produced in the EnR). These functional elements are targetable biological pathways (Dong et al., 2019; Figure S3M; Table S5). As expected, enrichment of immune signaling was seen in the NMF HER2-I and NMF Basal-I clusters (Figures S3E and S3H), and mRNA and phosphoprotein expression of the key immune checkpoint targets PDCD1 (PD1) and CD274 (PD-L1) was also elevated relative to the two luminal NMF clusters (Figure S3N).
Previous studies utilizing proteomics to profile and cluster breast tumors (Figure S4A) have reported varying resemblance of proteomic subtypes to PAM50 subtypes (Bouchal et al., 2019; Johansson et al., 2019; Tyanova et al., 2016). We analyzed and compared the data in these studies with results of our NMF analyses (detailed in Figures S4B–S4H). Integration of the current dataset with that of Johansson et al. (2019) supported NMF reassignment of some PAM50 LumA samples into the LumB-I group and suggested that their “basal immune” cluster was chiefly defined by an active immune microenvironment (Figures S4B–S4E). The subtype and “proteotype” markers of Tyanova et al. (2016) and Bouchal et al. (2019) were substantially reproduced in our dataset (Figures S4F–S4H).
Subtype-Specific Expression of Targetable, Highly Phosphorylated Kinases
To identify putative therapeutic targets specific for each NMF subtype, phosphoproteomic data were used as kinase activation surrogates (Flockhart and Corbin, 1982; Smith et al., 1993; Wang and Wu, 2002). Phosphorylated kinases enriched in each NMF subtype were identified using outlier enrichment analysis (Black-Sheep Python package) (Blumenberg et al., 2019; Figure 1D; Table S4). Many enriched kinases (false discovery rate [FDR] < 0.01) observed in each PAM50 subtype in our initial study (Mertins et al., 2016) were also enriched in this dataset using NMF subtypes, including PRKDC, MAP4K4 and SPEG in the NMF Basal-I subtype; ERBB2 and CDK12 in NMF HER2-I samples; and DCLK1 in NMF LumA-I samples (Figure 1D). These putatively activated kinases are candidates for subtype-specific treatment (Cotto et al., 2018).
The BlackSheep approach also associated phosphorylated kinase outliers with recurrent somatic mutations (Figure 1E). A noteworthy example was the increased phosphorylation levels of TRAF2- and NCK-interacting kinase (TNIK) in ARID1A mutant cases because TNIK is a therapeutic target due to its role in the WNT pathway (Masuda and Yamada, 2017). Upregulation of phosphorylated RIPK3 in tumors with MAP3K1 mutation was also of interest because loss-of-function mutations in this stress kinase are a poorly understood but highly recurring event in luminal BRCA. Although RIPK3 has a role in triggering necroptosis, it may also have a tumor-promoting role under some circumstances (Lin et al., 2020). The high levels of phosphorylation of MAST4 and DCLK1, microtubule-associated kinases and neuroendocrine markers, in the context of GATA3 mutation are newly described here and therefore require validation. A final example of these novel connections was increased phosphorylation of SLK/LATS1 in AKT mutated tumors, which may reflect cross-talk between the mTOR and HIPPO pathways (Chiang and Martinez-Agosto, 2012; Shin and Nguyen, 2016).
Proteogenomic Metabolic Profiling and Acetylproteomics Highlight Subtype-Specific Metabolism
Therapeutic targeting of abnormal cancer metabolism is garnering increased attention (Pavlova and Thompson, 2016; Phan et al., 2014). Tumor metabolic characteristics were profiled at the level of the proteome, and unsupervised clustering of differentially expressed (DE) metabolism-related proteins (STAR Methods) grouped samples into 4 clusters that closely reflected the 4 NMF clusters described in Figure 1A (Figure 2A). Metabolism-driven cluster 1 almost exclusively represented NMF Basal-I tumors with upregulation of proteins involved in DNA elongation, translation, and metabolism of carbohydrates and downregulation of cholesterol biosynthesis, metabolism of amino acids, and vitamins and cofactors. Metabolism-driven clusters 2 and 3 largely coincided with NMF LumA-I and NMF LumB-I, respectively, with an inverse overall metabolic feature profile relative to NMF Basal-I. Only NMF LumA-I showed upregulated glycosaminoglycan metabolism, which may reflect the stroma-enriched features of these tumors (Figure S3D). Metabolism-driven cluster 4, dominated by NMF HER2-I tumors, showed upregulation of cholesterol biosynthesis and lipid metabolism as a HER2-I feature that is independent of ERBB2 amplification status (Figures S3I and S3J).
Figure 2. Proteogenomics (PG) Metabolic Profiling.

(A) Heatmap showing unsupervised clustering of DE metabolic proteins across NMF clusters (Kruskal-Wallis test, FDR p < 5×10−05). The bottom heatmap shows DE normalized Ac values (normalized to protein abundance; Kruskal-Wallis test, FDR p < 0.005) with the same sample ordering as the top heatmap.
(B) Pathway schematic showing DE metabolic proteins and normalized Ac sites (Wilcoxon test, FDR p < 0.05) mapped onto key metabolic pathways.
(C) Bubble chart showing breakdown of upregulated and downregulated proteins and normalized Ac sites in NMF Basal-I compared with any other subtype by cell compartment.
(D) Significant associations (linear model coefficient FDR p < 0.1) between protein expression of mitochondrial HDACs (histone deacetylases) and HATs (histone acetyltransferases) (columns) and Ac of mitochondrial metabolic proteins (rows).
(E) Heatmap showing unsupervised clustering of nuclear protein acetylation, which was differentially expressed across NMF clusters (Kruskal-Wallis test, FDR p < 0.05).
(F) Protein scores of DNA repair pathways across clusters defined in (E). Wilcoxon test p value significance is shown compared with cluster 1. *p < 0.05, **p < 0.01, ***p < 0.001, ****p < 0.0001. BER, base excision repair; NER, nucleotide excision repair; SSBR, single-strand break repair; DSBR, double-strand break repair; FA, Fanconi anemia; HR, homologous recombination. Boxplots show 1.5× the interquartile range for each group, centered on the median.
(G) Scatterplot showing global differential protein expression and Ac analysis results in cluster 1 versus cluster 3, representing the two subgroups of NMF Basal-I. The x axis shows the protein median fold change multiplied by −log10(FDR p value). The y axis shows the Ac site median fold change multiplied by −log10(FDR p value). Ac or protein changes were considered significantly different if FDR p value < 0.05 and median fold change > 0.5. The “Ac up in cluster 1” group is defined by significantly different Ac sites for which the Ac median fold change is positive and the protein change is not significant. The “protein up in cluster 1” group is defined by significantly different proteins for which the protein median fold change is positive and the Ac change is not significant.
(H) Significantly different Ac sites in cluster 1 versus cluster 3 are found in HATs, their complex partners, histone proteins, and the NHEJ pathway. Boxplots show 1.5× the interquartile range for each group, centered on the median.
Protein acetylation (Ac) has been implicated in cellular metabolism in addition to roles in epigenetic regulation (Ali et al., 2018; Choudhary et al., 2009; Verdin and Ott, 2015). Here, Ac levels normalized to protein abundance were used to identify NMF cluster-specific protein Ac events (STAR Methods). Uniform upregulation of Ac for TCA cycle and β-oxidation proteins in the NMF Basal-I cluster and for glucose metabolism and interleukin-1 (IL-1) signaling-related proteins in the NMF LumB-I clusters was observed in these analyses (Figure 2A). Ac levels were also differentially distributed across cellular compartments. Most of the DE mitochondrial Ac sites were upregulated in NMF Basal-I, whereas two thirds of DE cytoplasmic Ac sites were downregulated compared with LumB-I, implying compartment-specific regulation of Ac in the NMF Basal-I subtype (Figures 2B and 2C). This suggests that major cytoplasmic and mitochondrial metabolic pathways are differentially regulated between NMF Basal-I and LumB-I subtypes. For example, for NMF Basal-I samples, the central metabolic pathway in the cytoplasm, glycolysis, was upregulated at the protein level (HK3, PFKP, GAPDH, ENO1, and LDHB) and hypoacetylated at the post-translational level (GPI, TPI1, GAPDH, PGK1, PGAM1, ENO1, PKM, and LDHA) (Figure 2B; Figures S5A and S5B). Serine synthesis proteins were also upregulated (PHGDH and PSAT1).
Copy number was correlated with metabolic enzyme expression in NMF Basal-I tumors but not in other subtypes, suggesting that activation of glycolysis and serine synthesis pathways might be uniquely driven by chromosomal aberrations in the NMF Basal-I subtype (Figure S5C). As further examples of NMF Basal-I-specific metabolism, mitochondrial pyruvate dehydrogenase complex (PDC), TCA cycle, and β-oxidation enzyme proteins were specifically hyperacetylated (Figures 2B; Figures S5A and S5B). An unbiased search for potential regulators of metabolic protein Ac revealed significant negative associations between protein levels of the mitochondrial deacetylase SIRT3 and Ac of mitochondrial proteins (Figure 2D), suggesting that deregulation of SIRT3 protein expression (Figure S5D) could broadly affect mitochondrial Ac in BRCA. This is consistent with the role of SIRT3 in suppressing acetyl-coenzyme A (CoA)-mediated non-enzymatic mitochondrial Ac (Weinert et al., 2015). Although SIRT3 inhibition modulates cell survival and proliferation (Alhazzazi et al., 2016), SIRT3 has roles as a tumor suppressor and an oncogene (Chen et al., 2014; Xiong et al., 2016), leaving open the question of whether SIRT3 is a viable therapeutic target.
Unsupervised clustering of nuclear protein Ac revealed two subgroups of NMF-Basal-I tumors (Figure 2E; Figure S3A). The nuclear Ac Basal-I cluster 1 (N-Ac Basal-I C1) showed significantly higher protein mean expression levels for multiple DNA repair pathways, such as the base excision repair (BER), nucleotide excision repair (NER), double-strand break repair (DSBR), single-strand break repair (SSBR), homologous recombination (HR), and Fanconi anemia pathways than the other N-Ac Basal-I cluster (C3) (Figure 2F). Table S6 includes mean expression levels for unique proteins from specific repair pathways (Anurag et al., 2018a) as well as for more inclusive SSBR and DSBR gene sets. The two N-Ac Basal-I clusters were distinguished by differential Ac of a number of specific Ac sites without change in the corresponding protein levels (Figure 2G; Figure S5E). These differentially acetylated proteins were enriched for nucleoplasmic proteins, RNA metabolism, chromatin-modifying enzymes, and histone Ac by the histone acetyltransferase (HAT) pathway (Figure S5F). Interestingly, elevated Ac in the activation loop of CREBBP-K1591K1592 may explain the observed hyperacetylation of nuclear proteins in N-Ac C1 (Figure 2H). The presence of active CREBBP was suggested by high Ac of multiple histone H2B N-terminal Ac sites (Figure 2H), as observed previously (Weinert et al., 2018). Other lysine acetyltransferases (KAT7 and KAT6A/B) and their complex partners (JADE3, BRPF3, BRD1, ING4, and MEAF6) were also hyperacetylated in N-Ac C1, although the effect of Ac on these proteins is largely unexplored. However, the increased Ac of histone H4 at site K13 and H3.3 at site K15 (Figure 2H), known targets of KAT7 acetyltransferase (Miotto and Struhl, 2010; Mishima et al., 2011), suggests higher activity in N-Ac Basal-I C1. Finally, both subunits of the Ku70/80 complex from the non-homologous end joining (NHEJ) pathway demonstrated elevated Ac of Ac sites located in the DNA-PK binding (Figure 2H, XRCC5-K702) and C-terminal arm domains (Figure 2H, XRCC6-K516).
Proteogenomics Analysis of ERBB2+ BRCAs
We recently explored ERBB2 status using microscaled proteogenomics analyses of core needle breast cancer biopsy specimens from ERBB2+ BRCA patients treated with neoadjuvant anti-ERBB2 antibody therapy (DP1; Satpathy et al., 2020). In addition to an unresponsive tumor lacking ERBB2 amplification by exome sequencing and ERBB2 protein by mass spectrometry, these analyses determined that two treatment-resistant cases (of a total of 13 cases with ERBB2 gene amplification) had “pseudo-ERBB2+” status, with low-level ERBB2 protein expression (more similar to non-amplified cases than amplified cases with pathologic complete response [pCR]) despite evidence of ERBB2 amplification by exome sequencing (DP1 samples in Figure 3A; Figure S6A). Because these pseudo-ERBB2+ samples are examples where anti-ERBB2 treatment may not have been effective because of lack of drug target expression, proteogenomics approaches were used to assess ERBB2 driver status in the current dataset and our earlier cohort (Mertins et al., 2016; Figures 3A and 3B; Figures S6A and S6B). Analysis of the current cohort classified 15 tumors proteogenomically as ERBB2+ (PG+) (“Prospective” samples in Figures 3A and 3B; Figures S6A and S6B). Central immunohistochemistry (IHC) testing was used to refine ERBB2 status where possible (68 tumors), and all of the ERBB2 PG+ samples were classified according to ASCO-CAP guidelines (https://www.cap.org/) as ERBB2+ (IHC score of 3+ or IHC score of 2+ and amplified by fluorescence in situ hybridization [FISH]) or with equivocal status (IHC score of 2+ without FISH results or amplified by FISH without IHC results). Similar to the data in DP1, cases of pseudo-ERBB2 positivity were identified, with two of 17 instances of ERBB2 gene amplification in the current cohort and one of 16 in the retrospective cohort being associated with protein expression levels that were within the distribution for ERBB2 PG− samples (Figures 3A and 3B; Figures S6A and S6B). The DP1 study also identified a pseudo-ERBB2+ case with amplification and overexpression of TOP2A, suggesting an alternative chromosome 17 amplicon driver in some cases (Harris et al., 2009). Supporting this hypothesis, TOP2A amplification and protein overexpression in the absence of ERBB2 protein overexpression were observed in one pseudo-ERBB2+ case each in the present and retrospective cohorts (Figure 3A; Figure S6A).
Figure 3. PG Classification of ERBB2 Tumors.

(A) Proteogenomics analysis of the ERBB2 locus in this study (“Prospective”), biopsies from ERBB2+ BRCA tumors (“DP1”; Satpathy et al., 2020), and TCGA tumors (“Retrospective”; Mertins et al., 2016). The heatmap depicts clinical data (top panel), copy number alterations (center panel), and protein expression (bottom panel) of genes proximal to ERBB2 on chromosome 17q for samples that were PAM50 HER2E, clinical ERBB2+/equivocal by immunohistochemistry (IHC) and/or in situ hybridization (ISH), or ERBB2 PG+. PG amplification of TOP2A, a potential alternative driver in the locus, is indicated by red arrowheads.
(B) Outlier analysis of ERBB2 and STARD3 or GRB7 confirms higher protein levels in most ERBB2-amplified samples (purple histogram) relative to the distribution of ERBB2 protein in non-amplified samples (blue histogram) in the prospective and retrospective datasets. Amplified samples with protein levels falling within the distribution of ERBB2 non-amplified samples are considered “pseudo-ERBB2+.”
(C) Phosphopeptide levels for components of the KEGG ErbB signaling pathway in HER2-associated tumors (PAM50 HER2E and ERBB2 PG+). The top panel of the heatmap shows subtype classifications and clinical marker status for each of these samples, and the bottom panel indicates somatic copy number aberrations (SCNAs) for genes in the amplicon closely linked to ERBB2, followed by the corresponding protein levels. The bottom panel depicts abundances of phosphopeptides from the ERBB2 pathway.
The lack of close alignment between ERBB2 positivity and intrinsic subtype was also investigated. Only seven of 15 ERBB2 PG+ samples were classified as HER2E by PAM50 subtyping, whereas an additional seven HER2E samples were not ERBB2 PG+ (Figure 3A; Figure S6C). To better understand biological characteristics that cause samples to cluster within the HER2E group despite inconsistent ERBB2 status, an analysis of phosphosites from the human Kyoto Encyclopedia of Genes and Genomes (KEGG) (Kanehisa and Goto, 2000) ERBB signaling pathway (hsa04012) was performed. As expected, all PAM50 HER2E/ERBB2 PG+ samples had high levels of ERBB2 phosphopeptides, whereas PAM50 HER2E/ERBB2 PG− samples had markedly lower levels but showed elevated levels of phosphorylation of other ERBB family members and of the mitogen-activated protein kinase (MAPK) signaling pathway compared with PG+ samples (Figure 3C). This suggests that alternative drivers of ERBB signaling could be targeted in PAM50 HER2E tumors without ERBB2 amplification.
PG Analysis of the Immune Tumor Microenvironment (I-TME) Suggests Broader Applicability of Immunotherapy in BRCA
RNA-based immune cell deconvolution signatures and protein-level signatures for immune modulators (Thorsson et al., 2019) revealed a range of immune-related features across all four intrinsic subtypes (Table S6), including the immune checkpoint proteins PD1 and PD-L1 at the RNA and phosphosite levels (Figures 4A and 4B; Figures S7A and S7B). Anti-CD3 (pan-T cell) IHC validated evidence of an active I-TME (Figures 4A, 4C, and 4D), with significant correlations between CD3+ T cell tumor infiltration and RNA-based estimates of overall I-TME provided by CIBERSORT absolute scores (Figure 4E). A stimulatory immune modulator protein signature was even more highly correlated with the IHC I-TME data (Figure 4F). RNA level profiles inferred for individual acquired and innate immune cell types (including B cells; cytotoxic, helper, and regulatory T cells; natural killer (NK) cells; dendritic cells (DCs); eosinophils; and macrophages) generally tracked with CIBERSORT absolute scores in each subtype (e.g., cluster 1; Figure S7A). However, effector memory CD4+ and activated CD4+ and CD8+ signatures, which do not appear to be well correlated with the CIBERSORT score, were lower in the PAM50 LumA subtype than in all other subtypes (cluster 3; Figure S7A). Furthermore, interferon gamma (IFNG) and antigen presentation machinery (APM1) protein signatures (Thorsson et al., 2019) appeared to track the immune score in all PAM50 subtypes except LumA, where they were lower than in Basal (cluster 4; Figure S7A). Finally, stromal, fibroblast, mast cell, endothelial cell, and neutrophil signatures were elevated in PAM50 LumA tumors with higher CIBERSORT scores but lower overall in LumB and Basal tumors (cluster 2; Figure S7A). Thus, acquired immune response hallmarks generally appear not to be activated in LumA, whereas other PAM50 subtypes, including LumB, exhibit features consistent with activation of acquired immunity, a finding consistent with previous comprehensive immune cell profiling of the METABRIC dataset (Curtis et al., 2012; Varn et al., 2016). This analysis extends recent reports suggesting that a significant proportion of PAM50 LumB tumors have an active I-TME and overexpress immune checkpoint and STAT1/IFNG genes (Anurag et al., 2020). This suggests that immunotherapy should be considered for subsets of luminal tumors with an active I-TME.
Figure 4. Immunological Landscape of BRCA.

(A) Heatmap showing the wide range of expression levels for immune-related features in each PAM50 subtype. Z scores of RNA-based immune signatures from CIBERSORT, ESTIMATE, and xCell and for protein-derived signatures for immune modulator gene sets from Thorsson et al. (2019) are shown in the top two data panels. The third data panel shows log2 ratios for normalized RNA-seq and proteomics data (phosphoprotein is the median for all sites on a given protein) for FDA-approved immune checkpoint targets PD-L1, PD1, and CTLA4. The bottom panel shows CD3 IHC results for samples available for centralized IHC. Within each subtype, samples are ordered by increasing CIBERSORT immune score.
(B) Distribution of CIBERSORT immune scores in each PAM50 subtype. Boxplots show 1.5× the interquartile range for each group, centered on the median.
(C) Representative images for CD3 IHC for samples classified as CD3− (top) and CD3-excluded (bottom).
(D) Images showing examples of CD3+ samples with elevated CIBERSORT scores in each PAM50 subtype.
(E) Spearman-rank correlation of CD3+ cell counts with CIBERSORT score.
(F) Spearman-rank correlation of CD3+ cell counts with stimulatory immune modulator protein scores.
APOBEC-Mediated Mutagenesis Correlates with an Active I-TME in Luminal BRCA
To identify potential drivers of immunogenicity across common BRCA subtypes, PD-L1 mRNA levels were correlated separately with proteomics data from PAM50 luminal and basal cases (Figure 5A; Figure S7C). Several mostly immune-related proteins, including APOBEC3G, showed strong positive correlation with PD-L1 in both subtypes. APOBEC3G protein levels were also correlated with the CIBERSORT immune score and were associated with APOBEC mutagenesis signatures (Figure 5B). Applying a stringent filter for APOBEC enrichment to whole-exome data (STAR Methods), six cases were diagnosed as APOBEC-enriched (one PAM50 HER2E, three PAM50 LumA, and two PAM50 LumB), and two of the luminal samples were also positive for the SBS13 APOBEC Catalogue Of Somatic Mutations In Cancer (COSMIC) signature, which has been associated previously with lymphocyte infiltration in ER+ BRCA (Smid et al., 2016). High activity of APOBEC enzymes, particularly APOBEC3B, has been associated with a hypermutation phenotype (Roberts and Gordenin, 2014). Consistent with this association, APOBEC-enriched cases had higher mutation loads and higher APOBEC3B protein levels compared with the rest of the tumors (Figure 5B; Figure S7D; p = 0.008 and p = 0.1 respectively, Wilcoxon test). Most of the samples with high APOBEC-associated SBS2 and SBS13 signature scores (from COSMIC v.3; Tate et al., 2019) also had high levels of APOBEC3G. These observations suggest that APOBEC-driven mutagenesis can contribute to an active immune microenvironment in ER+ BRCA with links to PD-L1 mRNA expression.
Figure 5. Association of APOBEC Mutations and DNA Damage Repair Pathway Levels with the Immune Microenvironment in Luminal Tumors.

(A) Correlation of protein levels with PD-L1 mRNA in PAM50 basal (x axis) and luminal (LumA and LumB, y axis) samples. Signed log10 FDR-corrected p values of Spearman-rank correlations are plotted. Protein data for PD-L1 was sparse in this study, but we observed high correlation between PD-L1 RNA and protein in the DP1 study, indicating that the RNA is a suitable surrogate for protein (Figure S7C).
(B) Although mutation load is correlated with the immune microenvironment in PAM50 luminal and basal BRCA, luminal samples with a high mutation load specifically show enrichment for APOBEC mutations. Luminal samples without APOBEC enrichment, luminal samples with APOBEC enrichment, basal samples (no APOBEC enrichment), PAM50 HER2E samples without APOBEC enrichment, and HER2E samples with APOBEC enrichment are ordered by increasing CIBERSORT scores. SBS13 and SBS2 are similarity scores for the whole-exome sequencing (WES)-derived mutation profile of a given sample with the corresponding COSMIC signature. APOBEC mutation fraction indicates the fraction of mutations that are APOBEC-associated mutations. APOBEC3G and APOBEC3B protein levels are also shown.
(C) Nucleotide excision repair (NER), mRNA processing, and RNA splicing are negatively correlated with PD-L1 in PAM50 luminal but not basal BRCA. The bar graph shows normalized enrichment scores (NESs) for the top GO biological process gene sets correlated with PD-L1 mRNA in luminal samples (blue bars) together with the corresponding NES for basal samples (red bars) from the gene set enrichment analysis (GSEA) of signed log10 p values from (A).
(D) The mean log2 TMT ratio for proteins from the GO BP NER pathway is negatively correlated (Spearman) with PD-L1 RNA expression in PAM50 luminal but not basal samples in the prospective (top) and retrospective (bottom) datasets. Scatterplots show the mean log2 TMT ratios on the y axis and log2 mRNA ratios (median-MAD-normalized data) on the x axis. Blue points show PAM50 luminal (LumA and LumB) samples, red points show PAM50 basal samples, and lines show the linear fit for each group.
(E) Heatmaps showing pairwise Spearman-rank correlations within the PAM50 luminal (combined A and B) samples from the prospective (left) and retrospective (right) datasets for immune microenvironment features (CTLA4, PD1, and PD-L1 RNA and CIBERSORT and protein-based signatures from A), GO BP scores anti-correlated with PD-L1 in luminal tumors (C), specific DNA repair pathway scores, single- and double-strand break repair (SSBR and DSBR) scores, mutation load (not included for retrospective), APOBEC mutation signatures (SBS2 and SBS13), chromosomal instability (CIN, also not included for retrospective), and RNA processing/splicing. MMR, mismatch repair; BER, base excision repair; NER, nucleotide excison repair; TLS, translesion synthesis; HR, homologous recombination; FA, Fanconi anemia; DR, direct repair; NHEJ, non-homologous end joining; DDR, DNA damage response (primarily checkpoint proteins). Gene set-based scores are the mean protein levels of all genes in the set.
Loss of SSBR Proteins Promotes Immunity in Luminal BRCA
Gene set enrichment analysis (GSEA) (Subramanian et al., 2005) for GO biological processes (GO BP) using the correlation analysis results from Figure 5A confirmed that multiple immune-related processes were positively correlated with PD-L1 expression in PAM50 basal and luminal samples (Figure 5C). In contrast, NER, RNA splicing, and mRNA processing were negatively correlated with PD-L1 in PAM50 luminal samples only, suggesting loss of these processes in luminal tumors with active immunity. The mean expression level of GO NER proteins was also negatively correlated with PD-L1 RNA specifically in the luminal but not the basal PAM50 subtypes in the TCGA retrospective study, providing supportive evidence of these associations (Figure 5D). Because increased PD-L1 expression has been associated previously with DNA repair deficiency in breast tumors (Parkes et al., 2016), and loss of expression of NER and BER genes was associated with resistance to endocrine therapy in ER+ BRCA (Anurag et al., 2018a; Haricharan et al., 2017), the consistent anti-correlation of NER proteins with PD-L1 expression suggests therapeutic potential for immunotherapy in endocrine-resistant ER+ BRCA. Importantly, low protein levels for the GO NER pathway were associated with high mutation load in luminal but not basal samples (Figure S7E). Upregulated immune checkpoint components in endocrine therapy-resistant LumB BRCA have been noted previously (Anurag et al., 2020), suggesting that NER deficiency is a potential link between upregulated immune checkpoints and endocrine therapy resistance. Because the GO BP NER pathway contains genes that overlap with other DNA repair pathways, pairwise Spearman correlations of immune features with scores from Table S6 for specific DNA repair pathways were examined together with the negatively correlated GO BP pathways. Although the unique NER protein score was not significantly anti-correlated with PD-L1, it was negatively correlated with the CIBERSORT immune score (Figure 5E; Table S7). Indeed, nearly all SSBR pathways, which include BER, mismatch repair (MMR), and NER, were anti-correlated with the CIBERSORT as well as the protein-derived stimulatory and inhibitory immune modulator scores, associations that were confirmed in the retrospective dataset. As with NER, the associations between low levels of other SSBR protein levels and an active tumor microenvironment appeared to be specific for PAM50 luminal tumors and were not observed in basal-like tumors (Figure 5E; Figure S7F; Table S7).
ER signaling modulates the DNA damage response (DDR) (Caldon, 2014). Therefore, outlier phosphopeptide abundance DDR scores for a set of ataxia telangiectasia mutated (ATM)/ATR/DNAPK target SQ/TQ peptides, shown previously to be induced in response to DNA damage, were examined (Matsuoka et al., 2007). DDR scores, an ATM auto-phosphorylation site, and the downstream Chk2 protein were lower in PAM50 luminal samples than in basal samples (Figures S7G and S7H). Notably, differences in ATM activity were present only in phosphoproteomic data, with the RNA and protein levels showing no significant differences between PAM50 luminal and basal subtypes (Figure S7G). This suggests that luminal samples may have relatively suppressed DNA damage checkpoint activity, possibly because of inhibition of ATM by ESR1 (Anurag et al., 2018a; Haricharan et al., 2017). This could facilitate tolerance for single-strand break repair defects (NER, BER, and MMR) in luminal BRCA and also de-repress CDK4/6, consistent with recent postulates on the efficacy of CDK4/6i in ER+ BRCA (Haricharan et al., 2017; Pernas et al., 2018).
PG Analysis of Rb Status May Inform the Response to CDK4/6 Inhibitor Therapy
Proliferation rate is a critical prognostic feature in BRCA, and the cell cycle is a target for endocrine therapy (Ellis et al., 2017) and CDK4/6 inhibition in ER+, ERBB2− advanced BRCA (Pernas et al., 2018). CDK4 and CDK6, in complex with Cyclin D, promote cell cycle progression by phosphorylating and inactivating the Retinoblastoma transcriptional inhibitor (Rb) during G1, whereas the Cyclin E/CDK2 complex further contributes to inhibition of Rb during G1-S transition (Goel et al., 2018). To compare PG features with cell cycle control in hormone receptor (HR)+/ERBB2 PG− and triple-negative BRCA (TNBC) tumors, the multi-gene proliferation score (MGPS; Figure 6A; Table S6) was generated for each sample (Ellis et al., 2017; Whitfield et al., 2002). Multi-omics analyses of Cyclin E (CCNE1) and CDK2, stemness scores, E2F activity scores (derived from their target genes in the Molecular Signatures Database (MSigDB; Liberzon et al., 2015), and CDK2 activity scores (derived from kinase target sites; Hornbeck et al., 2015; Krug et al., 2019) revealed positive correlations with MGPSs in both groups (Figures 6A and 6B; Table S7), although the MGPS was higher in TNBC than in HR+/ERBB2− samples (p = 3.1 × 10⁻⁵, Wilcoxon rank-sum test; Figure 6A). Although Cyclin D1 (CCND1) RNA, protein, and phosphorylation levels showed weak or no correlation with MGPS in both groups, these features were significantly higher in HR+/ERBB2− samples than in TNBC samples (p = 1.0 × 10⁻⁷, 1.7 × 10⁻⁶, and 0.023, respectively; Wilcoxon rank-sum test). Despite lack of correlation between Cyclin D1 and MGPS, CDK4 and CDK6 activity levels were positively correlated with MGPS in HR+/ERBB2− samples but had weakly negative or no correlation in TNBC samples (Figures 6A and 6B; Table S7), suggesting that variability in CDK4/6 activity controls the variability in proliferation rates in HR+ BRCA but not in highly proliferative TNBC tumors. More distinctly, although Rb RNA levels did not show significant correlation with MGPS (Spearman rho = −0.069, p = 0.55 for HR+/ERBB2−, rho = −0.36, p = 0.060 for TNBC), Rb protein and phosphoprotein levels were significantly positively correlated in HR+/ERBB2− samples (Spearman rho = 0.24, p = 0.035 for protein and rho = 0.53, p = 1.06 × 10⁻⁶ for median of all Rb phosphosites) but significantly negatively correlated in TNBC samples (Spearman rho = −0.54, p = 0.003 for protein and rho = −0.46, p = 0.015 for phosphorylation; Figures 6A and 6C). Loss of Rb in TNBC leading to higher proliferation is consistent with the inhibitory role of Rb in cell cycle progression, but the association of higher Rb levels with greater proliferation in HR+ samples is contrary to its role as negative regulator of proliferation (Goel et al., 2018). However, phosphorylation of Rb by cyclin-dependent kinases relieves this inhibition, and, consistent with these regulatory events, phosphorylation levels of Rb showed a stronger correlation with MGPS in HR+/ERBB2− cases than Rb protein levels (Spearman rho = 0.53, p = 1.1 × 10⁻⁶ for mean of Rb phosphosites and rho = 0.24, p = 0.035 for protein; Figure 6A; Table S7).
Figure 6. Rb Phosphorylation Status Indicates Potential Candidates for CDK4/6 Inhibitor Therapy in TNBC.

(A) Heatmap of PG features related to regulation of cell cycle by the Rb protein. Samples are ordered by RNA-based multi-gene proliferation score (MGPS; Ellis et al., 2017) within HR+ (ER+ or PR+) / ERBB2 PG− and TNBC subtypes. Correlation of each feature with the MGPS in each subtype is indicated by the bar plots along the side. The pathway diagram on the left depicts how the features included in the heatmap regulate G1-S progression to promote E2F transcription. Red boxes for SCNAs indicate gene amplification, whereas blue boxes indicate gene deletions. Phosphoprotein levels are represented by the median log2 TMT ratio of all phosphosites for a given gene. Z scores of kinase target NESs from single sample post-translational modification-signature enrichment analysis (PTM-SEA), of single sample GSEA NES values using MSigDb Hallmark sets, and of the stemness and CIBERSORT (CS) immune scores are also shown.
(B) Plot of Spearman correlations of kinase activity scores (kinase target PTM-SEA NES) for each Cyclin-dependent kinase (CDK) with MGPS, showing strong positive correlations between CDK4 and CDK6 with MGPS in hormone receptor+ (HR+) / ERBB2 PG− but not TNBC samples. Density plots of the distributions of the activity scores in each of the groups are shown below the corresponding point for each kinase. P values were derived from Wilcoxon rank-sum tests.
(C) Loss of Rb drives proliferation in TNBC samples, whereas phosphorylation of Rb is strongly associated with proliferation in HR+/ERBB2− samples. A scatterplot of Rb phosphoprotein (median of all phosphosites) log2 TMT ratios versus MGPS shows strong negative correlation between phospho-Rb and proliferation in TNBC samples, whereas phospho-Rb is positively correlated in HR+ / ERBB2 PG− samples. Points are colored by subtype. Red, TNBC; blue, HR+ / ERBB2 PG−.
(D) Response to palbociclib (AUC, area under the dose-response curve) in ER+ / HER2− (circles) and ER− / HER2− (triangles) BRCA cell lines from the Genomics of Drug Sensitivity to Cancer (GDSC) database (Iorio et al., 2016; Yang et al., 2013). ER− / HER2− cell lines with RB1 mutations/deletions are refractory to treatment (AUC), whereas ER− / HER2− cell lines with wild-type RB1 show similar sensitivity as ER+ / HER2− cell lines. Boxplots show 1.5× the interquartile range for each group, centered on the median. P value is from the Kruskal-Wallis test.
(E) Rb protein levels are negatively correlated with response to palbociclib across all HER2− BRCA cell lines from the GDSC. A scatterplot shows log2 TMT ratios for Rb protein on the y axis and AUC on the x axis. Shown are cell lines from (D) with Rb protein data. Gray triangles, wild-type (WT) ER+ / HER2− cells; gray circles, WT ER− / HER2− cells; green circles, RB1 deletion or frameshift mutant ER− / HER2− cells; yellow circles, RB1 missense ER− / HER2− cells. A line shows the linear regression fit for Rb protein versus AUC. Spearman correlation rho and p values are also shown.
Consistent with expectations (Cancer Genome Atlas Network, 2012), the TNBC cases here were often TP53 mutant, with active CDK2 and high levels of Cyclin E mRNA and phosphoprotein (Figure 6A; p = 1.04 × 10⁻⁷ for CDK2 activity, p = 6.2 × 10⁻¹² for CCNE1 RNA, and p = 7.3 × 10⁻¹⁰ for CCNE1 phosphoprotein, Wilcoxon rank-sum tests comparing TNBC with HR+/ERBB2−). However, there was a clear separation of TNBC samples into Rb-low and Rb-high phosphoprotein groups (n = 16 for Rb low and n = 12 for Rb high; Figure S7I). This difference reflects Rb protein levels and CDK4/6 activity. For example, the inferred activities for CDK4 and CDK6 were higher in TNBC tumors with high levels of Rb phosphorylation compared with TNBC tumors with low Rb phosphorylation (Figure S7J). Predictably, three of the four TNBC tumors with RB1 mutations/deletions had low levels of Rb phosphorylation. The role of Rb in CDK4/6 regulation in TNBC was further probed by examining published cell line perturbation experiments from the Genomics of Drug Sensitivity in Cancer (GDSC) resource (Iorio et al., 2016; Yang et al., 2013). In this dataset, TNBC cells with RB1 mutations or deletions did not respond to the CDK4/6 inhibitor palbociclib, whereas some wild-type TNBC lines were responsive (Figures 6A and 6D). This suggests that knowledge of genomic Rb status could prove useful for repurposing CDK4/6 inhibitors for TNBC. However, TNBC samples often showed loss of Rb protein without a detectable genomic aberration in the RB1 gene (Figure 6A). This raised the question of whether Rb protein estimates could contribute to prediction of CDK4/6 inhibitor activity when the RB1 status is wild type according to genomic analysis. Consistent with this hypothesis, further analysis of the GDSC data revealed examples of RB1 wild-type cell lines with low levels of Rb protein that were indeed less responsive to CDK4/6 inhibitor treatment (Figure 6E). In general, Rb protein levels were correlated with response to palbociclib regardless of RB1 genotype (Spearman rho = −0.61, p = 0.022; Figure 6E). An exception was a cell line that had high levels of Rb protein but showed a poor response; however, this example harbored two hotspot RB1 missense mutations in the pocket domain that is required for transcriptional repression (I388S and P515L) (Chow and Dean, 1996). A second line with an in-frame deletion of N480 in RB1 was resistant and had low Rb levels (Figure 6E), consistent with reports that the N480 mutation may destabilize the Rb protein (Harbour, 2001; Lee et al., 1998). Thus, analysis of Rb provides a good example of how PG data integration could enhance prediction of drug efficacy.
To further investigate Rb-associated heterogeneity of proliferation within TNBC samples, TNBCtype was deployed (Chen et al., 2012). Tumors classified as basal-like 1 (BL1) had higher proliferation scores, and most showed loss of Rb (seven of 10 BL1 TNBC samples were Rb low) as well as TP53 mutations (nine of 10) (Figure 6A). The few TP53 wild-type TNBC tumors were predominantly classified as luminal androgen receptor (LAR) tumors, with lower proliferation scores than BL1 tumors (p = 0.014, Wilcoxon rank-sum test), the highest protein levels of androgen receptor (AR) within TNBC, and the presence of PIK3CA mutations (Figure 6A). However, only two of the four LAR tumors were classified as Rb high, and AR protein did not show strong correlation with Rb protein (Spearman Rho = 0.27, p = 0.17) or phosphoprotein (Spearman Rho = 0.12, p = 0.54) levels in TNBC samples, in contrast to a previous study showing that 83% of AR+ samples were also Rb+ (by IHC) (Patel et al., 2020). Of note, inferred mTOR kinase activity was also higher in TNBC tumors with elevated Rb phosphoprotein levels compared with Rb-low tumors, suggesting activation of the PIK3-AKT-mTOR pathway (p = 0.037, Wilcoxon rank-sum test; Figure S7J) despite similar frequencies of PIK3CA mutations in both groups (Figure 6A). Thus, TNBC tumors with features demonstrating intact Rb and/or LAR represent a complex setting where PIK3CA, CDK4/6, and AR inhibition are therapeutic options to consider depending on the specific molecular characteristics of a particular tumor (Asghar et al., 2017; Lehmann et al., 2014; Liu et al., 2017; Yamamoto et al., 2019).
DISCUSSION
The high-quality, multi-omics resource we created allows investigators to explore correlations between the genomic landscape and the downstream effects in the BRCA proteome, phosphoproteome, and acetylproteome, extending and refining analytical opportunities provided by prior studies (Bouchal et al., 2019; Johansson et al., 2019; Mertins et al., 2016; Tyanova et al., 2016). Numerous observations with diagnostic or therapeutic potential emerged from our analyses. In the case of ERBB2+ BRCA, we suggest that integrated DNA and protein level analysis of the long arm of chromosome 17 could be a more quantitative approach than FISH/IHC. Integrated analysis of mutational signatures and DNA repair processes, I-TME profiles, and expression of targets for immune checkpoint (IC)-directed therapies defined subsets of LumA and LumB tumors with APOBEC-mediated mutagenesis or single-strand break repair defects that could benefit from IC treatment. Our data also hint that accurate PG assessment of Rb could prove useful as a predictive marker that could enable the use of CDK4/6 inhibitors in a subset of TNBC.
Deep, quantitative analyses of phosphorylation and acetylation by proteomics provided unique observations with potential clinical effects. For example, phosphoproteomics identified new connections between tumor suppressor loss and signaling, including upregulation of RIPK3 in MAP3K1 mutant tumors, the WNT pathway mediator TNIK1 in ARID1A mutant tumors, and the microtubule-associated kinase and neuroendocrine differentiation markers MAST4 and DCLK1 (Liu et al., 2016) in GATA3 mutant tumors. The first two findings suggest potential therapeutic directions in the difficult arena of targeting tumor suppressor loss, whereas DCLK1 inhibition via the small-molecule kinase inhibitor LRRK2-IN-1 has shown preclinical efficacy in some cancers (Kawamura et al., 2017; Suehiro et al., 2018; Weygant et al., 2014). Proteomics and acetylproteomics profiling in the context of metabolism also revealed, for the first time in a large BRCA cohort, marked differences in metabolic enzyme expression and acetylation between luminally- and basally-enriched subtypes, which may translate to a better understanding of metabolic vulnerabilities. Suppression of serine metabolic enzymes such as PHGDH selectively decreases proliferation in cells with elevated serine flux (Possemato et al., 2011), opening a potential therapeutic alternative for difficult-to-treat basal tumors (Mullarky et al., 2019; Murphy et al., 2018; Weinstabl et al., 2019). Our results suggest a synergistic interaction between hypoacetylation and elevated protein expression leading to increased activity of the glycolysis pathway in the NMF Basal-I subtype; in contrast, mitochondrial function appeared to be suppressed by hyperacetylation mediated by depleted SIRT3. Broad dependence of tissues on glucose and products of respiration suggests that the therapeutic window for targeting increased aerobic glycolysis or compromised TCA cycle enzymes is narrow (Luengo et al., 2017). Nevertheless, the prospect of effective therapeutic targeting of metabolism is predicated on such nuanced insights into the metabolic phenotypes of specific disease states (Vander Heiden and DeBerardinis, 2017).
There are limitations to this study and to multi-omics resource studies in general. Investment in prospective sample collection promoted data quality but meant that the sample population might not be optimized for subgroup or demographic representation. Use of cryopulverized bulk tumor material improved the depth and internal concordance of molecular analysis but sacrificed architectural information and the cellular resolution afforded by methods such as imaging mass cytometry (Jackson et al., 2020). Higher spatial resolution could be achieved by approaches optimized for smaller amounts of input material (Hunt et al., 2019; Satpathy et al., 2020) or thoughtful integration of single-cell genomics and proteomics. The type of associations described throughout this manuscript are hypothesis generating and therefore cannot be understood in terms of firm biological conclusions or direct evidence of specific therapeutic interventions. Nevertheless, successful integration of deep-scale proteomics and post-translational modification (PTM) data from a large, prospectively collected BRCA sample set represents a substantial advance over prior genomics studies and an important complement to other PG efforts.
Deep PG analyses of high-quality tissues from well-annotated cancer patient cohorts are an important resource for the clinical and research communities. The future direction of PG requires full integration of these analytical approaches into therapeutic trials and, ultimately, clinical care. Most clinical decision-making is based on core needle biopsies, hence our emphasis on microscaled workflows that reduce sample requirements in comparison with the surgical specimen-scale analyses described here (Satpathy et al., 2020). Microscaled PG will also facilitate detection of treatment perturbations that shed light on mechanisms of response and resistance to therapy. The results of such studies could then be used to develop candidate lists of peptides and their modifications for targeted, rapid, mass spectrometry-based assays that could be implemented in the clinic (Gillette and Carr, 2013; Zhang et al., 2019). Thus, we propose that strategic introduction of PG into clinical workflows will enable more rapid progress of precision diagnostics and therapeutics.
STAR⋆METHODS
RESOURCE AVAILABILITY
Lead Contact
This study did not generate new unique reagents. Further information and requests should be directed to and will be fulfilled by the lead author, Michael A. Gillette (gillette@broadinstitute.org).
Materials Availability
This study did not generate new unique reagents.
Data and Code Availability
Proteomics raw and characterized datasets are publicly available though the CPTAC data portal https://cptac-data-portal.georgetown.edu/study-summary/S060 and at the Proteomic Data Commons (https://pdc.cancer.gov/pdc/). The accession number for the proteomic data at the CPTAC data portal is S060. The accession number for the proteomic data characterized by the Proteomic Data Commons is PDC: PDC000120. The proteomics raw data consists of 17 plexes. Plexes 1–13 and 16–17 are tumor-only plexes and 14–15 are normal adjacent tissue (NAT)-only plexes. Results reported in this study are solely based on tumor-only plexes.
Raw genomic data (WES, RNA-seq, miRNA-seq,) associated with this study (harmonized with the GRCh38 reference genome) has been released at the Genomic Data Commons (https://gdc.cancer.gov) and is accessible via the database of Genotypes and Phenotypes (dbGaP). The accession number for the raw genomics data (WES, RNA-seq, miRNA-seq,) reported in this paper is dbGaP: phs000892.
Sample annotation, processed and normalized data files are provided in Tables S1 and S2. In addition, all processed data matrices will be available at LinkedOmics (Vasaikar et al., 2018) (http://www.linkedomics.orglogin.php) upon publication, where computational tools are available for further exploration of this dataset.
A website for interactive visualization of the multi-omics dataset is available at: http://prot-shiny-vm.broadinstitute.org:3838/CPTAC-BRCA2020. The heatmap depicts somatic copy number aberrations, mRNA, protein, phosphosite and acetylsite abundances across 122 tumors. Copy number alterations are relative to matched normal blood samples and are on log2(CNA)-1 scale. For other data types the heatmap depicts abundances relative to the common reference (proteomics) or the median abundance across all tumors (RNA-seq).
The entire workflow described under ‘Multi-omics clustering’ has been implemented as a module for Broad’s cloud platform Terra (https://app.terra.bio/). The docker containers encapsulating the source code and required R-packages for NMF clustering and ssGSEA have been submitted to Dockerhub (broadcptac/pgdac_mo_nmf:9, broadcptac/pgdac_ssgsea:5). The source code for ssGSEA and PTM-SEA is available on GitHub: https://github.com/broadinstitute/ssGSEA2.0.
EXPERIMENTAL MODEL AND SUBJECT DETAILS
Human subjects
A total of 134 participants were included in the study. Histopathologically-defined adult breast tumors from newly diagnosed patients were considered for analysis. The cohort ranged in age from 30–95. Institutional review boards at tissue source sites reviewed protocols and consent documentation adhering to the Clinical Proteomic Tumor Analysis Consortium (CPTAC) guidelines.
METHOD DETAILS
Specimens and clinical data
Tumor, adjacent normal, and blood samples were collected by several tissue source sites in strict accordance with the CPTAC2 breast procurement protocol (https://brd.nci.nih.gov/brd/sop/download-pdf/301). All patients provided written informed consent. Inclusion criteria included newly diagnosed, untreated patients undergoing definitive surgery for breast cancer (stage IIA-IIIC) or undergoing core needle biopsy at the time of placement of a vascular access device prior to neoadjuvant therapy for breast cancer. Patients with more than one newly detected and independent breast masses were allowed. Cases with prior history of other malignancies within the past 12 months were excluded. Cases with any prior systemic chemotherapy, endocrine therapy or biological therapy for any cancer, or prior history of radiation therapy involving the breast such as mantle field radiation for Hodgkins Disease or radiotherapy for lung cancer, were excluded. Patients who were found to have a diagnosis other than invasive breast cancer as a result of the surgery were also excluded. Peripheral venous blood samples from each patient were collected prior to administration of anesthesia. Samples were qualified for the study if two or more tumor tissue core biopsies or surgical resection segments had a minimum mass of 200 mg and demonstrated greater than 60% tumor cell nuclei and less than 20% tumor necrosis on frozen tissue section review.
To ensure tissue suitability for phosphoprotein analysis, the tumor and normal adjacent tissue specimens were collected in less than 30 minutes total ischemic time from interruption of the vascular supply and embedded in optimal cutting temperature (OCT) compound for processing at a common CPTAC-2 specimen core resource center. Pathologically qualified cases underwent further molecular qualification for extraction and co-isolation of nucleic acids. Tissue segments that were qualified both for pathology and for molecular integrity were shipped to the proteomic characterization centers. DNA and RNA from the same tumor segment and DNA from germline blood were further aliquoted and quantified per protocol. DNA quality was confirmed using gel electrophoresis and Nanodrop methods. RNA quality was confirmed using Nanodrop and Agilent bioanalyzer. Sufficient yield, a good gel score and passing value of 7 or greater RNA Integrity Number (RIN) qualified the DNA and RNA, respectively, for sequencing. The analytes were then shipped to the sequencing center.
Patient history, procedural details, and other relevant clinical and diagnostic information were collected using case report forms. The corresponding clinical data were formatted and distributed through the CPTAC data coordinating center (https://cptac-data-portal.georgetown.edu/study-summary/S039). One year follow-up forms captured updated histories after completion of the initial treatment regimen. Deidentified Pathology Reports (AJCC 7th edition 2013) including ER (estrogen receptor), PGR (progesterone receptor), and HER2 (ERBB2) status and representative diagnostic slide images were utilized to review and qualify cases for this study. Final clinical assessment of hormone receptor status by IHC and FISH classified tumors as follows: ER and/or PR positive: 83; HER2 positive: 13; ER/PR/HER2 negative: 16; ER/PR negative with equivocal or unknown HER2 status: 12. PAM50-based classification of tumors was also performed (Parker et al., 2009), confirming that available samples represented all major subtypes, including 14 Her2 enriched (HER2-E), 29 Basal, 57 Luminal A (LumA), 17 Luminal B (LumB) and 5 Normal-like tumors (Table S1). To support ERBB2-focused analyses, additional, centralized HER2 IHC was performed on sections from 68 tumors for which remaining tissue was available. ERBB2 clinical status was defined using a combination of the updated ERBB2 IHC scores where available (original IHC scores from the pathology reports were used for samples for which additional tissue was not available) and ERBB2 fluorescence in situ hybridization (FISH) results from the pathology reports. Samples were classified in a manner consistent with ASCO-CAP guidelines (https://www.cap.org/); specifically, clinical ERBB2 negative cases were those where the IHC score was 0 or 1+ or FISH was negative, clinical ERBB2 positive cases were those where the IHC score was 3+ and FISH was positive or not available or where the IHC score was 2+ and FISH was positive, and equivocal cases were those with IHC score of 2+ that lacked FISH confirmation or had a positive FISH result without IHC confirmation (ASCO guidelines require further testing for these equivocal cases, but this was not possible here). Central staining for ER was consistent with ER status from the pathology reports. Triple negative breast cancer (TNBC) status was classified using the clinical status for ER and PR from IHC and the ERBB2 proteogenomic (PG) status applied to all samples as described below. Samples that were positive for any of these markers were classified as TNBC negative whereas samples that were negative for all three were classified as TNBC positive (samples that were missing classification for ER or PR but negative for all other markers were classified as NA because clinical status of all 3 markers could not be assessed). The known propensity of TNBC to affect patients with African ancestry (Dietze et al., 2015) was observed in the present dataset (p = 0.0009 versus Caucasian, Fisher’s exact test).
Centralized Immunohistochemistry
For immunohistochemistry (IHC) cut tissue sections (5μm) on charged glass slides were baked for 10–12 hours at 58°C in a dry slide incubator, deparaffinized in xylene and rehydrated via an ethanol step gradient. Heat-induced antigen retrieval steps were performed at pH 9.0 for all targets. All primary antibodies were incubated at room temperature for 1 hour [clone, manufacturer, dilution: Her2 (SP3, Neomarkers, 1:100); ER (6F11, Leica, 1:200); CD3 (polyclonal, Dako, 1:100)] followed by a standard chromogenic staining protocol with the Envision Polymer-HRP anti-mouse/3,3′diaminobenzidine (DAB, Dako) process. Slides were counterstained in Harris hematoxylin. Immunohistochemistry scoring was performed using established guidelines, when appropriate. All IHC results were evaluated against positive and negative tissue controls.
Sequencing Sample preparation
Whole exome sequencing (WES)
Genomic DNA samples were used to prepare indexed libraries using the Nextera Rapid Capture Exome kit from Illumina. Library preparation was performed using a semi-automated 96-well plate method, with washing and clean-up/concentration steps performed on the Beckman Coulter Biomek NXP platform and with ZR-96 DNA Clean & Concentrator-5 plates, respectively. Libraries were quantified using the Agilent 2100 Bioanalyzer. Pooled libraries were run on HiSeq4000 (2×150 paired end runs) to achieve a minimum of 150x on-target coverage per sample library. The raw Illumina sequence data was demultiplexed and converted to fastq files, and adaptor and low-quality sequences were trimmed. WES data was used for somatic mutation detection, microsatellite instability prediction, and somatic copy number alteration (SCNA) analysis as described below.
mRNA sequencing
Indexed cDNA sequencing libraries were prepared from the RNA samples using the TruSeq Stranded RNA Sample Preparation Kit and bar-coded with individual tags. Library preparation was performed similarly to the WES. Quality control was performed at every step, and the libraries were quantified using the Agilent 2100 Bioanalyzer. Indexed libraries were prepared as equimolar pools and run on HiSeq4000 (2×150 paired end runs) to generate a minimum of 30 million paired-end reads per sample library. The raw Illumina sequence data was demultiplexed and converted to fastq files, and adaptor and low-quality sequences were trimmed.
Proteomic analysis
The proteomic, phosphoproteomic, and acetylproteomic analyses of breast cancer samples were structured as TMT-10-plex experiments. To facilitate quantitative comparison between all samples across experiments, a tumor-only common reference sample was included in each 10-plex. A common physical, rather than in silico reference was used for this purpose for optimal quantitative precision between TMT-10 experiments. 125 unique samples representing 122 tumors and three process replicates were distributed among 15 10-plex experiments. Eighteen normal adjacent samples were also included in two additional 10-plex experiments, for a total of 17 10-plex experiments. For each experiment, nine individual samples occupied the first nine channels and the 10th channel was reserved for the tumor-only reference sample (Figure S1B). To avoid systematic bias in sample processing or missing values in detection across the experiments, samples underwent stratified randomization before processing, with each intrinsic subtype proportionally represented in each processing tranche and subsequent incorporation to each 10-plex (Table S1). Longitudinal quality control of the process was tested by periodic analysis of full process replicates of a comparative reference (CompRef; Mertins et al., 2018) sample composed of a basal and a luminal patient-derived xenograft tumor. Four interstitial CompRef experiments were performed, before plex one and after plexes five, 10, and 17. The protocols below for protein extraction, tryptic digestion, TMT-10 labeling of peptides, peptide fractionation by basic reversed-phase liquid chromatography, phosphopeptide enrichment using immobilized metal affinity chromatography, and LC-MS/MS were performed as previously described in depth (Mertins et al., 2018).
Common reference pool construction
Considerations informing generation of the common reference sample were that it needed to be available at the onset of discovery work, of adequate quantity to cover all planned experiments with overhead for additional possible experiments, and broadly representative of the population of breast cancer samples in the overall sample cohort. To ensure capacity for additional samples or experiments given a target input of 400 ug protein per channel per experiment, 12 mg total was targeted for reference material. To meet these collective requirements, 40 samples with an average of 2.7 mg total protein yield were selected based on hormone receptor status, including 9 triple negative, 12 HER2 positive, and 19 estrogen receptor positive specimens. After reserving 400 ug protein / sample for individual sample analysis, an additional amount of 300 ug for each of the 40 samples was pooled. The resulting 12 mg of pooled reference material was divided into 400 ug aliquots and frozen at −80°C until use.
Making the internal reference representative of the study as a whole was particularly important since by definition only analytes represented in the reference sample would be included in the final ratio-based data analyses. To accomplish this goal, similar percentages found in the total sample population of specific subtypes were implemented in the internal reference. As noted, samples were selected on this basis of hormone receptor status, as PAM50 status was not available at the time of reference preparation; however, of the 40 samples included in the internal reference, 11 were subsequently shown to be basal, 7 were HER2+, 12 were Luminal A, 8 were Luminal B, 1 was normal-like, and 1 was not determined.
Protein extraction and digestion
Cryopulverized human breast cancer patient tumor samples were homogenized in lysis buffer at a ratio of 750 uL lysis buffer for every 100–125 mg wet weight tissue. The lysis buffer consisted of 8 M urea, 75 mM NaCl, 1mM EDTA, 50 mM Tris HCl (pH 8), 10 mM NaF, phosphatase inhibitor cocktail 2 (1:100; Sigma, P5726) and cocktail 3 (1:100; Sigma, P0044), 2 μg/mL aprotinin (Sigma, A6103), 10 μg/mL Leupeptin (Roche, 11017101001), and 1 mM PMSF (Sigma, 78830). Lysates were centrifuged at 20,000 g for 10 minutes and protein concentrations of the clarified lysates were measured by BCA assay (Pierce). Protein lysates were subsequently reduced with 5 mM dithiothreitol (Thermo Scientific, 20291) for 45 minutes at room temperature and alkylated with 10 mM iodoacetamide (Sigma, A3221) for 45 minutes in the dark. Prior to digestion, samples were diluted 4-fold to achieve 2 M urea with 50mM Tris HCl (pH 8). Digestion was performed with LysC (Wako, 100369–826) for 2 hours and with trypsin (Promega, V511X) overnight, both at a 1:50 enzyme-to-protein ratio and at room temperature. Digested samples were acidified with formic acid (FA; Fluka, 56302) to achieve a final volumetric concentration of 1% (final pH of ~3), and centrifuged at 1,500 g for 15 minutes to clear precipitated urea from peptide lysates. Samples were desalted on C18 SepPak columns (Waters, 100mg, WAT036820) and dried down using a SpeedVac apparatus.
TMT-10 labeling of peptides
400 ug of desalted peptides per sample (based on protein-level BCA prior to digestion) were labeled with 10-plex TMT reagents according to the manufacturer’s instructions (Thermo Scientific; Pierce Biotechnology, Germany). For each 400 ug peptide aliquot of an individual breast tumor sample, 3.2 mg of labeling reagent was used. Peptides were dissolved in 400 μL of 50 mM HEPES (pH 8.5) solution and labeling reagent was added in 164 μL of acetonitrile. After 1 h incubation with shaking and after confirming good label incorporation, 32 uL of 5% hydroxylamine was added to quench the unreacted TMT reagents. Good label incorporation was defined as having a minimum of 95% fully labeled MS/MS spectra in each sample, as measured by LC-MS/MS after taking out a 2 μg aliquot from each sample and analyzing 1μg. If a sample did not have sufficient label incorporation, additional TMT was added to the sample and another 1 h incubation was performed with shaking. At the time that the labeling efficiency quality control samples were taken out, an additional 2 μg of material from each sample was taken out and combined as a mixing control. After analyzing the mixing control sample by LC-MS/MS, intensity values of the individual TMT reporter ions were summed across all peptide spectrum matches and compared to ensure that the total reporter ion intensity of each sample met a threshold of ± 25% of the internal reference. If necessary, adjustments were made by either labeling additional material or reducing an individual sample’s contribution to the mixture, and analyzing a subsequent mixing control, until all samples met the threshold and were thus approximately 1:1:1. Differentially labeled peptides were then mixed (10 × 400 ug) and dried down via vacuum centrifuge, and the quenched, combined sample was subsequently desalted on a 500 mg C18 SepPak column.
Peptide fractionation
To reduce sample complexity, peptide samples were separated by high pH reversed-phase (RP) chromatography as described previously. A desalted 4 mg, 10-plex TMT-labeled experiment (based on protein-level BCA prior to digestion) was reconstituted in 900 μL 0.0455% ammonium formate (pH 10) and 2% acetonitrile, loaded on a 4.6 mm x 250 mm column RP Zorbax 300 A Extend-C18 column (Agilent, 3.5 μm bead size), and separated on an Agilent 1100 Series HPLC instrument using basic pH reversed-phase chromatography. Solvent A (2% acetonitrile, 4.4 mM ammonium formate, pH 10) and a nonlinear increasing concentration of solvent B (90% acetonitrile, 4.5 mM ammonium formate, pH 10) were used to separate peptides. The 4.5 mM ammonium formate solvents were made by 40–fold dilution of a stock solution of 180 mM ammonium formate, pH 10. To make 200 mL of stock solution, slowly add 4.6 mL of 30% (wt/vol) ammonium hydroxide (Ammonia solution 28.0%–30.0% (NH3 basis) ACS, 0.9 g/ml, Fluka) to ~150mL of HPLC grade water, then titrate to pH 10.0 with ~9.0 mL of concentrated formic acid (> 95% Sigma-Aldrich); bring to final volume of 200 mL with HPLC grade water. The 96 minute separation LC gradient followed this profile: (min: %B) 0:0; 7:0; 13:16; 73:40; 77:44; 82:60; 96:60. The flow rate was 1 mL/min. For each 4 mg separation, 77 fractions were collected into a 96 deep-well 2mL plate (What-man, #7701– 5200), with fractions combined in a stepwise concatenation strategy and acidified to a final concentration of 0.1% FA as reported previously. An additional 12 fractions were collected from the 96 deep-well plate for fraction A, representing the early-eluting fractions that tend to contain multi-phosphorylated peptides. 5% of the volume of each of the 24+A proteome fractions was allocated for proteome analysis, dried down, and re-suspended in 3% MeCN/0.1% FA (MeCN; acetonitrile) to a peptide concentration of 0.5 μg/uL for LC-MS/MS analysis. The remaining 95% of 24 concatenated fractions were further combined into 12 fractions, with fraction A as a separate fraction. These 13 fractions were then enriched for phosphopeptides as described below.
Phosphopeptide enrichment
Ni-NTA agarose beads were used to prepare Fe3+-NTA agarose beads. In each phosphoproteome fraction, ~317 μg peptides (based on protein-level BCA prior to digestion, with uniform distribution across fractions presumed) was reconstituted in 633 μL 80% MeCN/0.1% TFA (trifluoroacetic acid) solvent and incubated with 10 μL of the IMAC beads for 30 minutes on a shaker at RT. After incubation, samples were briefly spun down on a tabletop centrifuge; clarified peptide flow-throughs were separated from the beads; and the beads were reconstituted in 200 μL IMAC binding/wash buffer (80 MeCN/0.1% TFA) and loaded onto equilibrated Empore C18 silica-packed stage tips (3M, 2315). Samples were then washed twice with 50 μL of IMAC binding/wash buffer and once with 50 uL 1% FA, and were eluted from the IMAC beads to the stage tips with 3 × 70 uL washes of 500 mM dibasic sodium phosphate (pH 7.0, Sigma S9763). Stage tips were then washed once with 100 μL 1% FA and phosphopeptides were eluted from the stage tips with 60 uL 50% MeCN/0.1% FA. Phosphopeptides were dried down and resuspended in 9 μL 50% MeCN/0.1%FA for LC-MS/MS analysis, with 4 μL injected per run.
Acetylpeptide enrichment
Acetylated lysine peptides were enriched using an antibody against the Acetyl-Lysine motif (CST PTM-SCAN Catalogue No. 13416) as described before (Gillette et al., 2020; Udeshi et al., 2020). IMAC eluents were concatenated into 6 fractions (~330 μg peptides per fraction) and dried down using a SpeedVac apparatus. Peptides were reconstituted with 1.4ml of IAP buffer (5 mM MOPS pH 7.2, 1 mM Sodium Phosphate (dibasic), 5 mM NaCl) per fraction and incubated for 2 hours at 4°C with pre-washed (4 times with IAP buffer) agarose beads bound to acetyl-lysine motif antibody. Peptide-bound beads were washed 4 times with ice-cold PBS followed by elution with 100ul of 0.15% TFA. Eluents were desalted using C18 stage-tips, eluted with 50% ACN and dried down. Acetylpeptides were suspended in 7ul of 0.1% FA and 3% ACN, with 4ul injected per run.
LC-MS/MS for proteomic analysis
Liquid chromatography
Online separation was done with a nanoflow Proxeon EASY-nLC 1200 UHPLC system (Thermo Fisher Scientific). In this set up, the LC system, column, and platinum wire used to deliver electrospray source voltage were connected via a stainless-steel cross (360 μm, IDEX Health & Science, UH-906x). The column was heated to 50°C using a column heater sleeve (Phoenix-ST) to prevent over-pressuring of columns during UHPLC separation. Each peptide fraction containing ~1ug (based on protein-level BCA prior to digestion, with uniform distribution of fraction content presumed), the equivalent of 12% of each global proteome sample in a 2 ul injection volume or 50% of each phosphoproteome sample in a 4 ul injection volume, was injected onto an in-house packed 20cm x 75um diameter C18 silica picofrit capillary column (1.9 μm ReproSil-Pur C18-AQ beads, Dr. Maisch GmbH, r119.aq; Picofrit 10um tip opening, New Objective, PF360–75-10-N-5). Mobile phase flow rate was 200 nL/min, comprising 3% acetonitrile/0.1% formic acid (Solvent A) and 90% acetonitrile/0.1% formic acid (Solvent B). The 110-minute LC-MS/MS method consisted of a 10-min column-equilibration procedure, a 20-min sample-loading procedure, and the following gradient profile: (min:%B) 0:2; 1:6; 85:30; 94:60; 95;90; 100:90; 101:50; 110:50 (the last two steps at 500 nL/min flow rate).
Mass spectrometry
Samples were analyzed with a benchtop Orbitrap Fusion Lumos mass spectrometer (Thermo Fisher Scientific) equipped with a NanoSpray Flex NG ion source. Data-dependent acquisition was performed using Xcalibur QExactive v2.1 software in positive ion mode at a spray voltage of 1.8 kV. MS1 spectra were measured with a resolution of 60,000, an AGC target of 4e5 and a mass range from 350 to 1800 m/z. The data-dependent mode cycle time was set at 2 s with an MS2 resolution of 50,000, an AGC target of 1e5, an isolation window of 0.7 m/z, a maximum injection time of 105 msec, and an HCD collision energy of 38%. Peptide mode was selected for monoisotopic peak determination, and charge state screening was enabled to only include precursor charge states 2–6, with an intensity threshold of 1e4. Peptides that triggered MS/MS scans were dynamically excluded from further MS/MS scans for 45 s, with a ± 10 ppm mass tolerance. “Perform dependent scan on single charge state per precursor only” was enabled.
QUANTIFICATION AND STATISTICAL ANALYSIS
Genomic data analysis
Somatic mutation and copy number detection
WES data were analyzed on the Terra cloud-based analysis platform (https://terra.bio/).
Somatic mutations were detected using the Cancer Genome Analysis WES Characterization Pipeline (available on Terra – https://portal.firecloud.org/?return=terra#methods/getzlab/CGA_WES_Characterization_Pipeline_v0.1_Dec2018/2). This pipeline is the Getz Lab’s standard computational workflow for characterizing a tumor sample’s somatic variants through contrastive computational analysis of matched tumor-normal WES BAMs. The pipeline includes state-of-the-art tools for quality control (QC) and characterization of paired (tumor/normal) whole exome sequencing data. The pipeline is organized into five modules: (1) DNA Sequence Data Quality Control such as ContEst for detecting cross-patient contamination (Cibulskis et al., 2011), (2) Variant Discovery including MuTect for detection of somatic single nucleotide variants (Cibulskis et al., 2013) and Strelka for detecting small insertions and deletions (Kim et al., 2018), (3) Copy Number Characterization employing AllelicCapSeg for assessing allele-specific copy-number alterations and ABSOLUTE for estimating tumor purity, ploidy, absolute allelic copy number and Cancer Cell Fraction (CCFs) (Carter et al., 2012), (4) Variant rescue, Annotation and Filtering including deTiN, which estimates potential tumor-in-normal contamination (Taylor-Weiner et al., 2018), and (5) Visualization. Each of these modules consists of multiple additional tools (McLaren et al., 2016; Ramos et al., 2015). Note that we conducted our analysis on hg19, requiring replacing the hg38 reference file inputs with their hg19 analogs.
The MAF Panel of Normals (PoN) Filter is a method within the Variant rescue, Annotation and Filtering module. It is a highly effective tool for filtering false-positive germline variants and common artifacts from somatic mutation calls. This tool requires as input a Panel of Normals (PoN) constructed from a collection derived from BAMs of normal samples. To be effective at filtering artifacts, the library preparation and sequencing technology used for the PoN’s normal samples should mirror that used in the processing of the matched tumor/normal pairs within the study cohort. For this analysis, we used a TCGA-based PoN and an ICE PoN.
Germline short variant discovery from WES
Germline mutations were also analyzed on the Terra cloud-based analysis platform utilizing the GATK4 SNPS + Indels best practice workflow (https://gatk.broadinstitute.org?id=11145) (McKenna et al., 2010). This workflow consists of three sub-workflows: (i) Processing-For-Variant-Discovery workflow, which takes a single sample’s sequencing data in unmapped BAM (uBAM) format and outputs a clean BAM file and its index, suitable for variant discovery analysis, (ii) Haplotypecaller-GVCF workflow, which runs the HaplotypeCaller tool (Poplin et al., 2017) from GATK4 in GVCF mode on the BAM and BAI created in the previous step, and (iii) Joint-Discovery workflow, which conducts the joint-calling and VQSR-filtering portions of the GATK Best Practices for germline SNP and Indel discovery. In our analysis, Processing-For-Variant-Discovery was skipped, as our WES pipeline produced BAM files compatible for the next step of analysis and an Illumina-compatible interval list was used. Details regarding the specific Terra workflows used to conduct this analysis can be found in the public workspace (https://app.terra.bio/#workspaces/help-gatk/Germline-SNPs-Indels-GATK4-hg38). Note that we conducted our analysis on hg19, requiring replacing the hg38 reference file inputs with their hg19 analogs.
RNA quantification
The raw Illumina sequence data from HiSeq4000 was demultiplexed and converted to .fastq files. Read quality was examined using FastQC (version 0.10.1) and adaptor and low quality sequences were trimmed using Trim Galore (version 0.3.3) using a quality score cutoff of Q < 30 and Length < 50 bp.. Trimmed reads were mapped to the hg19 reference genome using MapSplice (version 2.1.8). Transcripts were assembled and RNA expressions were quantified in Fragments Per Kilobase of transcript per Million mapped reads (FPKM) using Cufflinks (v2.1.1) (Trapnell et al., 2010) and transcript coverage was calculated using (bedtools version 2.20.1). Relevant QC metrics and statistics can be found in Table S1B. Derived data matrix of FPKM values was further processed in R. FPKM values of transcripts mapping to the same HGNC symbol were averaged within a sample to create a gene-centric data matrix. FPKM values of 0 were considered as missing values and replaced by NA before applying log2 transformation. For integrative multi-omics subtyping, we first normalized each gene by the median log2(FPKM) across all tumors (gene-centering) before applying a robustified z-score transformation (median-centered, MAD-scaled) per sample.
GISTIC and MutSig analysis
Genomic Identification of Significant Targets in Cancer (GISTIC2.0) algorithm (Mermel et al., 2011) was used to identify significantly amplified or deleted focal-level and arm-level events, with q values smaller than 0.25 considered significant. The following parameters were used:
Amplification Threshold = 0.1
Deletion Threshold = −0.1
Cap Values = 1.5
Broad Length Cutoff = 0.98
Remove X-Chromosome = 0
Confidence Level = 0.99
Join Segment Size = 4
Arm Level Peel-Off = 1
Maximum Sample Segments = 2000
Gene GISTIC = 1
Each gene of every sample is assigned a thresholded copy number level that reflects the magnitude of its deletion or amplification. These are integer values ranging from −2 to 2, where 0 means no amplification or deletion of magnitude greater than the threshold parameters described above. Amplifications are represented by positive numbers: 1 means amplification above the amplification threshold; 2 means amplification larger than the arm level amplifications observed in the sample. Deletions are represented by negative numbers: −1 means deletion beyond the threshold; −2 means deletions greater than the minimum arm-level copy number observed in the sample.
The somatic variants were filtered through a panel of normals to remove potential sequencing artifacts and undetected germline variants (see “Somatic Mutation and Copy Number Detection”). MutSig2CV (Lawrence et al., 2014) was run on these filtered results to evaluate the significance of mutated genes and estimate mutation densities of samples. These results were constrained to genes given in (Nik-Zainal et al., 2016), with false discovery rates (q values) recalculated. Genes of q value < 0.1 were declared significant.
De novo mutational signature extraction
For results reported in Figure 2A, non-negative matrix factorization algorithm (NMF) was used to decipher de novo mutation signatures in cancer somatic mutations stratified by 96 base substitutions in tri-nucleotide sequence contexts. To obtain a reliable signature profile, we used somaticwrapper to call mutations from WGS data (https://github.com/ding-lab/somaticwrapper). SignatureAnalyzer exploited the Bayesian variant of the NMF algorithm and enabled an inference for the optimal number of signatures from the data itself at a balance between data fidelity (likelihood) and model complexity (regularization) (Kasar et al., 2015; Kim et al., 2016; Tan and Févotte, 2013). After decomposing into signatures, the inferred signatures were compared against known signatures derived from COSMIC (Tate et al., 2019) and cosine similarity was calculated to identify the best match.
Mutational signature projection (used in Figure 5B and Figure S7D)
For results reported in Figure 5B and Figure S7D, parallel approach based COSMIC signature scores for every sample were estimated using deconstructSigs (Rosenthal et al., 2016) package in R. In addition to COSMIC signatures SBS 2 and 13, APOBEC enrichment was also assessed using TrinucleotideMatrix and plotApobecDiff functions of the maftool package (Mayakonda et al., 2018). APOBEC enrichment scores greater than four were used to identify high confidence APOBEC-enriched cases.
Proteomics data analysis
Spectrum quality filtering and database searching
All MS data were interpreted using the Spectrum Mill software package v7.0 pre-release (Agilent Technologies, Santa Clara, CA) co-developed by Karl Clauser of the Carr laboratory (https://www.broadinstitute.org/proteomics). Similar MS/MS spectra acquired on the same precursor m/z within ± 40 s were merged. MS/MS spectra were excluded from searching if they failed the quality filter by not having a sequence tag length > 0 (i.e., minimum of two masses separated by the in-chain mass of an amino acid) or did not have a precursor MH+ in the range of 800–6000. MS/MS spectra were searched against a RefSeq-based sequence database containing 37,579 proteins mapped to the human reference genome (hg19) obtained via the UCSC Table Browser (https://genome.ucsc.edu/cgi-bin/hgTables) on September 14, 2016, with the addition of 13 proteins encoded in the human mitochondrial genome, 150 common laboratory contaminant proteins, and 553 non-canonical small open reading frames (38,295 total sequences). Scoring parameters were ESI-QEXACTIVE-HCD-v2, for whole proteome datasets, and ESI-QEXACTIVE-HCD-v3, for phosphoproteome datasets. All spectra were allowed ± 20 ppm mass tolerance for precursor and product ions, 30% minimum matched peak intensity, and “trypsin allow P” enzyme specificity with up to 4 missed cleavages. Allowed fixed modifications included carbamidomethylation of cysteine and selenocysteine. TMT labeling was required at lysine, but peptide N-termini were allowed to be either labeled or unlabeled. Allowed variable modifications for whole proteome datasets were acetylation of protein N-termini, oxidized methionine, deamidation of asparagine, hydroxylation of proline in PG motifs, pyro-glutamic acid at peptide N-terminal glutamine, and pyro-carbamidomethylation at peptide N-terminal cysteine with a precursor MH+ shift range of −18 to 97 Da. For the phosphoproteome dataset the allowed variable modifications were revised to allow phosphorylation of serine, threonine, and tyrosine, allow deamidation only in NG motifs, and disallow hydroxylation of proline with a precursor MH+ shift range of −18 to 272 Da. For the acetylproteome dataset the allowed variable modifications were revised to allow acetylation of lysine, allow deamidation only in NG motifs, and disallow hydroxylation of proline with a precursor MH+ shift range of −400 to 70 Da.
PSM quality control
Identities interpreted for individual spectra were automatically designated as confidently assigned using the Spectrum Mill autovalidation module to use target-decoy-based false discovery rate (FDR) estimates to apply score threshold criteria. For the whole proteome dataset, thresholding was done in 3 steps: at the peptide spectrum match (PSM) level, the protein level for each TMT-plex, and the protein level for all 17 TMT-plexes. For the phosphoproteome and acetylproteome datasets, thresholding was done in two steps: at the PSM and variable modification (VM) site levels.
In step 1 for all datasets, PSM-level autovalidation was done first and separately for each TMT-plex experiment consisting of either 25 LC-MS/MS runs (whole proteome), 13 LC-MS/MS runs (phosphoproteome), or 6 LC-MS/MS runs (acetylproteome), using an auto-thresholds strategy with a minimum sequence length of 7; automatic variable range precursor mass filtering; and score and delta Rank1 – Rank2 score thresholds optimized to yield a PSM-level FDR estimate for precursor charges 2 through 4 of < 0.6% for each precursor charge state in each LC-MS/MS run. To achieve reasonable statistics for precursor charges 5–6, thresholds were optimized to yield a PSM-level FDR estimate of < 0.3% across all runs per TMT-plex experiment (instead of per each run), since many fewer spectra are generated for the higher charge states.
In step 2 for the whole proteome dataset, protein-polishing autovalidation was applied separately to each TMTplex experiment to further filter the PSMs using a target protein-level FDR threshold of zero. The primary goal of this step was to eliminate peptides identified with low scoring PSMs that represent proteins identified by a single peptide, so-called “one-hit wonders.” After assembling protein groups from the autovalidated PSMs, protein polishing determined the maximum protein level score of a protein group that consisted entirely of distinct peptides estimated to be false-positive identifications (PSMs with negative delta forward-reverse scores). PSMs were removed from the set obtained in the initial peptide-level autovalidation step if they contributed to protein groups that had protein scores below the maximum false-positive protein score. Step 3 was then applied, consisting of protein-polishing autovalidation across all TMT plexes together using the protein grouping method “expand subgroups, top uses shared” to retain protein subgroups with either a minimum protein score of 25 or observation in at least 2 TMT plexes. The primary goal of this step was to eliminate low-scoring proteins that were infrequently detected in the sample cohort. As a consequence of these two protein-polishing steps, each identified protein reported in the study comprised multiple peptides, unless a single excellent scoring peptide was the sole match and that peptide was observed in at least 2 TMT-plexes. In calculating scores at the protein level and reporting the identified proteins, peptide redundancy was addressed in Spectrum Mill as follows: The protein score was the sum of the scores of distinct peptides. A distinct peptide was the single highest scoring instance of a peptide detected through an MS/MS spectrum. MS/MS spectra for a particular peptide may have been recorded multiple times (e.g., as different precursor charge states, in adjacent bRP fractions, modified by deamidation at asparagine or oxidation of methionine, or with different phosphosite localization), but were still counted as a single distinct peptide. When a peptide sequence of > 8 residues was contained in multiple protein entries in the sequence database, the proteins were grouped together and the highest scoring one and its accession number were reported. In some cases when the protein sequences were grouped in this manner, there were distinct peptides that uniquely represent a lower scoring member of the group (isoforms, family members, and different species). Each of these instances spawned a subgroup. Multiple subgroups were reported, counted toward the total number of proteins, and were given related protein subgroup numbers (e.g., 3.1 and 3.2 for group 3, subgroups 1 and 2). For the whole proteome datasets the above criteria yielded false discovery rates (FDR) for each TMT-plex experiment of < 0.5% at the peptide-spectrum match level and < 0.6% at the distinct peptide level. After assembling proteins with all the PSMs from all the TMT-plex experiments together, the aggregate FDR estimates were 0.41% at the peptide-spectrum match level, 1.6% at the distinct peptide level, and < 0.01% (1/10,633) at the protein group level. Since the protein-level FDR estimate neither explicitly required a minimum number of distinct peptides per protein nor adjusted for the number of possible tryptic peptides per protein, it may underestimate false positive protein identifications for large proteins observed only on the basis of multiple low scoring PSMs.
In step 2 for the phosphoproteome and acetylproteome datasets, variable modification (VM) site polishing autovalidation was applied across all 17 TMT plexes to retain all VM-site identifications with either a minimum id score of 8.0 or observation in at least 3 TMT plexes. The intention of the VM-site polishing step is to control FDR by eliminating unreliable VM site-level identifications, particularly low-scoring VM sites that are only detected as low-scoring peptides that are also infrequently detected across all of the TMT plexes in the study. In calculating scores at the VM site level and reporting the identified VM sites, redundancy was addressed in Spectrum Mill as follows: A VM site table was assembled with columns for individual TMT-plex experiments and rows for individual VM sites. PSMs were combined into a single row for all non-conflicting observations of a particular VM site (e.g., different missed cleavage forms, different precursor charges, confident and ambiguous localizations, and different sample-handling modifications). For related peptides, neither observations with a different number of VM sites nor different confident localizations were allowed to be combined. Selecting the representative peptide from the combined observations was done such that once confident VM site localization was established, higher identification scores and longer peptide lengths were preferred. While a Spectrum Mill identification score was based on the number of matching peaks, their ion type assignment, and the relative height of unmatched peaks, the VM site localization score was the difference in identification score between the top two localizations. The score threshold for confident localization, > 1.1, essentially corresponded to at least 1 b or y ion located between two candidate sites that had a peak height > 10% of the tallest fragment ion (neutral losses of phosphate from the precursor and related ions as well as immonium and TMT reporter ions were excluded from the relative height calculation). The ion type scores for b-H3PO4, y-H3PO4, b-H2O, and y-H2O ion types were all set to 0.5. This prevented inappropriate confident localization assignment when a spectrum lacked primary b or y ions between two possible sites but contained ions that could be assigned as either phosphate-loss ions for one localization or water-loss ions for another localization. VM site polishing yielded 63,416 phosphosites with an aggregate FDR of 0.44% at the phosphosite level. In aggregate, 70% of the reported phosphosites in this study were fully localized to a particular serine, threonine, or tyrosine residue. VM site polishing yielded 18,392 acetylsites with an aggregate FDR of 0.57% at the acetylsite level. In aggregate, 99% of the reported acetylsites in this study were fully localized to a particular lysine residue. The overall peptide identifications enabled calculation of enrichment rates (modified peptides/all peptides) for phosphopeptides (by IMAC) and acetylpeptides (by anti-acetyl-Lysine antibodies). Phospho-STY enrichment rates for each plex ranged from 88%–97% (plex 2 was an outlier at 71%). Acetyl-K enrichment rates for each plex ranged from 45%–69% (plex 11 was an outlier at 24%).
Quantification using TMT ratios
Using the Spectrum Mill Protein/Peptide Summary module, a protein comparison report was generated for the proteome dataset using the protein grouping method “expand subgroups, top uses shared” (SGT). For the phosphoproteome and acetylproteome datasets, a Variable Modification site comparison report limited to either phospho or acetyl sites, respectively, was generated using the protein grouping method “unexpand subgroups.” Relative abundances of proteins and VM sites were determined in Spectrum Mill using TMT reporter ion intensity ratios from each PSM. TMT reporter ion intensities were corrected for isotopic impurities in the Spectrum Mill Protein/Peptide summary module using the afRICA correction method, which implements determinant calculations according to Cramer’s Rule (Shadforth et al., 2005) and correction factors obtained from the reagent manufacturer’s certificate of analysis (https://www.thermofisher.com/order/catalog/product/90406) for TMT10 lot number QK226692A. A protein-level, phosphosite-level, or acetylsite-level TMT ratio was calculated as the median of all PSM-level ratios contributing to a protein subgroup, phosphosite, or acetylsite. PSMs were excluded from the calculation if they lacked a TMT label, had a precursor ion purity < 50% (MS/MS has significant precursor isolation contamination from co-eluting peptides), or had a negative delta forward-reverse identification score (half of all false-positive identifications). Lack of TMT label led to exclusion of PSMs per TMT plex with a range of 1.8 to 3.1% for the proteome, 1.2 to 3.8% for the phosphoproteome, and 1.5 to 5.2% (outliers were plex 11 at 37% and plex 14 at 8.6%) for the acetylproteome datasets. Low precursor ion purity led to exclusion of PSMs per TMT plex with a range of 3.7 to 6.4% for the proteome, 2.1 to 2.9% for the phosphoproteome, and 3.0 to 6.5% for the acetylproteome datasets.
Two-component normalization of TMT ratio
It was assumed that for every sample there would be a set of unregulated proteins or phosphosites that had abundance comparable to the common reference (CR) sample. In the normalized sample, these proteins, phosphosites, or acetylsites should have a log TMT ratio centered at zero. In addition, there were proteins, phosphosites, and acetylsites that were either up- or downregulated compared to the CR. A normalization scheme was employed that attempted to identify the unregulated proteins and phosphosites, and centered the distribution of these log-ratios around zero in order to nullify the effect of differential protein loading and/or systematic MS variation. A 2-component Gaussian mixture model-based normalization algorithm was used to achieve this effect. The two Gaussians (μi1,1) and N(μi2,σi2) for a sample i were fitted and used in the normalization process as follows: the mode mi of the logratio distribution was determined for each sample using kernel density estimation with a Gaussian kernel and Shafer-Jones band-width. A two-component Gaussian mixture model was then fit with the mean of both Gaussians constrained to be mi, i.e., μi1 = μi2= mi. The Gaussian with the smaller estimated standard deviation was assumed to represent the unregulated component of proteins/phosphosites/acetylsites, and was used to normalize the sample. The sample was standardized using (mi,) by subtracting the mean mi from each protein/phosphosite/acetylsite and dividing by the standard deviation σi.
Identification of patient-specific single amino acid variants, indels, and spliceforms
For each of the 122 patients’ tumors analyzed in this study, whole exome DNA sequencing and Illumina RNA-seq data generated from aliquots of the cryopulverized tumors and accompanying germline DNA samples were obtained under controlled access. Tumor-specific somatic DNA-variant calls and germline DNA-variant calls from the same individual, and splice junctions predicted from RNA-seq assemblies were generated as described above (Genomic Data Analysis). The proteogenomic database tool QUILTS v3.0 (http://openslice.fenyolab.org/cgi-bin/pyquilts_cgi.pl) (Ruggles et al., 2015) was used to incorporate the germline and somatic non-synonymous single nucleotide variant calls (SNVs), indels, RNA-seq predicted splice junctions and gene fusions into a protein sequence database for each patient. The human RefSeq protein database (version 20160914) was used as a reference for the hg19 proteome and genome. QUILTS was run with the following thresholds for number of RNA-seq reads supporting splice junctions: both exon boundaries annotated (2), left boundary annotated (3), and no boundaries annotated (3).
The QUILTS personalized databases for each patient were merged for searching the MS/MS spectra to accommodate the multiplexed samples used in LC-MS/MS data generation. Since each of the 15 plexes of TMT10 labeled tumor samples was prepared by combining 9 individual tumor samples plus an aliquot of common reference (which was a mixture of 40 tumors), each MS/MS spectrum could be derived from a peptide sequence shared by up to 49 individual tumors. One combined sequence database was made by concatenating the QUILTS-generated 122 individual FASTA files. When concatenating, variant and spliceform summary files for the whole exome and RNA-seg derived information, respectively, were generated with the Spectrum Mill Protein Databases utilities to enable subsequent matching of individual tumors to sequence identifiers and positions of genomic features. Completely novel junctions, with both boundaries matching no known exons, were omitted. The concatenated file was made non-redundant by removing repeat entries with identical full-length sequences. Protein sequences with length < 7 amino acids were also removed. The resulting non-redundant, patient-specific protein sequence database containing somatic and germline single amino acid variants (179,768 sequences), spliceforms (283,149 sequences), indels (11,586 sequences), and gene fusions (1601 sequences), was concatenated together with the human reference database, RefSeq version 20160914 (38,281 sequences), to yield the database (514,385 total sequences) used for searches with MS/MS spectra.
MS/MS spectra from the whole proteome datasets were searched in two stages: 1) all spectra against the RefSeq reference database, as described above, then 2) the remaining unidentified spectra against the patient-specific sequence database as described here. This was done to control the false-discovery rate since there are several orders of magnitude fewer high confidence PSM’s expected to the patient-specific sequences not present in the reference database. Search parameters other than the database were the same as the stage 1 searches.
Separate PG event tables for the two primary PG event types, variants and spliceforms (including indels and frameshifts), were assembled with columns for individual iTRAQ 4-plex experiments and rows for individual PG events. PSM’s with a minimum identification score of 8.0 were combined into a single row for all non-conflicting observations of a particular PG event (i.e., multiple peptides containing altered coding sequence due to a frameshift, different trypsin missed cleavage forms of peptides that span a splice junction or contain an SAAV or new protein C terminus resulting from introduction of a novel stop codon, different precursor charges, different sample handling modifications of the same peptide, and repeat observations in adjacent bRP fractions). The representative peptide reported from the combined observations is the one with the highest identification score. A polishing step was manually applied to each table to further filter the PG events to reach a suitable PG-event level identification FDR. The following thresholds were applied to the representative peptide of each PG event: delta Rank1 – Rank2 score > 1.0, minimum sequence length > 7 (variants), > 8 (spliceforms). Lower-scoring, infrequently observed spliceforms were further filtered to exclude those with both a score < 9.3 and detection in < 3 TMT10 plexes. Consequently, the final PG event-level cumulative FDR estimates were variants (1.0%), and spliceforms (1.1%).
Relative abundances of each PG event in a patient sample were determined in Spectrum Mill using TMT reporter ion intensity ratios from each PSM. A PG event-level TMT ratio was calculated as the median of all PSM level ratios contributing to each event remaining after excluding those PSM’s lacking a TMT label, having a negative delta forward-reverse score (half of all false-positive identifications), or having a precursor ion purity < 50% (MS/MS has significant precursor isolation contamination from co-eluting peptides). The ratios for all PG events for a patient were then standardized by subtracting the centering factor and dividing by the scaling factor of the protein-level TMT ratios for that patient derived from the results of the stage 1 search (reference database only). Since each MS/MS spectrum has 10 TMT reporter ions for 9 patients and the common control (40 patients), the detection of a rare PG event can typically be attributed to a specific patient when 1 ratio is significantly higher than the other 9.
Systems biology analysis
Sample exclusion
Typical TMT LC-MS/MS experiments exhibit TMT log2 ratios (individual sample / common reference) with the median ratio value of all peptides from a sample being approximately constant across the LC retention time range of each LC-MS/MS run in an experiment. However, for all 18 normal adjacent samples (constituting plexes 14 and 15), the median ratios steadily rose by 1 to 2 log2 units from the beginning to the end of the LC gradient in all fractions of all data types (proteome, phosphoproteome, and acetylome). This behavior would be consistent with elution failure from a desalting step prior to fractionation. Consequently, the resulting quantitative data for 18 normal adjacent samples were considered to not meet quality standards for inclusion in subsequent analyses. Notably, all QC-fail samples in our prior study (Mertins et al., 2016) exhibited this chromatographic behavior, though it was not appreciated at the time.
Dataset filtering
Proteins (global proteome), phosphosites and acetylsites present in fewer than 30% of samples (i.e., missing in > 70% of samples) were removed from the respective datasets. Furthermore:
Proteins were required to have at least two observed TMT ratios in > 25% of samples in order to be included in the proteome dataset. Phosphosites and acetylsites were required to have at least one observed TMT ratio in > 25% of samples.
Proteins, phosphosites and acetylsites were required to have TMT ratios with an overall standard deviation > 0.5 across all the samples where they were observed. This ensured that a small number of proteins, phosphosites and acetylsites that did not vary much over the set of samples were excluded to minimize noise.
Replicate samples in the dataset were merged by taking the mean of the respective expression values or ratios.
Some of the filtering steps were modified for specific analyses in the study. For many of the marker selection and gene set enrichment analyses, at least 50% of samples were required to have non-missing values for proteins/phosphosites/acetylsites, since missing values were imputed, and excessive missing values can result in poor imputation. Alternate filtering has been noted in descriptions of the relevant methods and are summarized Table S2A.
CNA-driven cis and trans effects
Correlations between copy number alterations (CNA) and RNA, proteome, phosphoproteome and acetylproteome (with proteome and PTM data mapped to genes, by choosing the most variable protein isoform/PTM site as the gene-level representative) were determined using Pearson correlation of common genes present in CNA-RNA-proteome (8,668 genes), CNA-RNA-phosphoproteome (4,534 genes) and CNA-RNA-acetylproteome (1,604 genes). In addition, p-values (corrected for multiple testing using Benjamini-Hochberg FDR; Benjamini and Hochberg, 1995) for assessing the statistical significance of the correlation values were also calculated. CNA trans-effects for a given gene were determined by identifying genes with statistically significant (FDR < 0.05) positive or negative correlations.
CMAP analysis
Candidate genes driving response to copy number alterations were identified using large-scale Connectivity Map (CMAP) queries. The CMAP (Lamb et al., 2006; Subramanian et al., 2017) is a collection of about 1.3 million gene expression profiles from cell lines treated with bioactive small molecules (~20,000 drug perturbagens), shRNA gene knockdowns (~4,300) and ectopic expression of genes. The CMAP dataset is available on GEO (Series GSE92742). For this analysis, we use the Level 5 (signatures from aggregating replicates) TouchStone dataset with 473,647 total profiles, containing 36,720 gene knock-down profiles, with measurements for 12,328 genes. See https://clue.io/GEO-guide for more information.
To identify candidate driver genes, proteome profiles of copy number-altered samples were correlated with gene knockdown mRNA profiles in the above CMAP dataset, and enrichment of up/downregulated genes was evaluated. Normalized log2 copy number values less than −0.3 defined deletion (loss), and values greater than +0.3 defined copy number amplifications (gains). In the copy number-altered samples (separately for CNA amplification and CNA deletion), the trans-genes (identified by significant correlation in “CNA driven cis and trans effects” above) were grouped into UP and DOWN categories by comparing the protein ratios of these genes to their ratios in the copy number neutral samples (normalized log2 copy number between −0.3 and +0.3). The lists of UP and DOWN trans-genes were then used as queries to interrogate CMAP signatures and calculate weighted connectivity scores (WTCS) using the single-sample GSEA algorithm (Krug et al., 2019). The weighted connectivity scores were then normalized for each perturbation type and cell line to obtain normalized connectivity scores (NCS). See (Subramanian et al., 2017) for details on WTCS and NCS. For each query we then identified outlier NCS scores, where a score was considered an outlier if it fell beyond 1.5 times the interquartile range of score distribution for the query. The query gene was a candidate driver if (i) the score outliers were statistically cis-enriched (Fisher test with BH-FDR multiple testing correction) and (ii) the gene had statistically significant and positive cis-correlation.
For a gene to be considered for inclusion in a CMAP query it needed to i) have a copy number change (amplification or deletion) in at least 15 samples; ii) have at least 20 significant trans genes; and iii) be on the list of shRNA knockdowns in the CMAP. Of the genes satisfying these conditions, the top 501 genes (sorted based on the number of trans-events) were used for the analysis, and resulted in 910 queries (CNA amplification and deletion combined) that were tested for enrichment. 21 candidate driver genes were identified with Fisher test FDR < 0.26 using this process.
In order to ensure that the identified candidate driver genes were not a random occurrence, we performed a permutation test to determine how many candidate driver genes would be identified with random input (Mertins et al., 2016). For the 910 queries used, we substituted the bona-fide trans-genes with randomly chosen genes, and repeated the CMAP enrichment process. To determine FDR, each permutation run was treated as a Poisson sample with rate λ, counting the number of identified candidate driver genes. Given the small n ( = 10) and λ, a Score confidence interval was calculated (Barker, 2002) and the midpoint of the confidence interval used to estimate the expected number of false positives. Using 10 random permutations, we determined the overall false discovery rate to be FDR = 0.26, with a 95% CI of (0.19, 0.32).
To identify how many trans-correlated genes for all candidate regulatory genes could be directly explained by gene expression changes measured in the CMAP shRNA perturbation experiments, knockdown gene expression consensus signature z-scores (knockdown/control) were used to identify regulated genes with α = 0.05, followed by counting the number of trans-genes in this list of regulated genes.
To obtain biological insight into the list of candidate driver genes, we performed (i) enrichment analysis on samples with extreme CNA values (amplification or deletion) to identify statistically enriched sample annotation subgroups; and (ii) GSEA on cis/trans-correlation values to find enriched pathways.
Note that the connectivity score calculation described above, and the underlying CMAP data, was based on a recent publication (Lamb et al., 2006; Subramanian et al., 2017) and was different from that used in Mertins et al. (2016). Furthermore, the CNA data in the current publication was derived from WES sequencing data, in contrast to SNP array-based CNA data used in Mertins et al. (2016). Thus, given a different technology platform for copy number data generation and significant changes in both the underlying CMAP database and the calculation of connectivity scores, the candidate driver genes identified here do not overlap with those reported in Mertins et al. (2016).
RNA-protein correlation
Correlations between mRNA expression and protein abundance for each gene-protein pair were measured using Pearson correlation. To assess the statistical significance of the correlation, a p value (adjusted for multiple testing using FDR) was also calculated. RefSeq protein IDs in the protein data were mapped to HUGO gene symbols. In total, 8,362 genes were quantified in both mRNA and protein data and subsequently used for RNA-protein correlation calculations.
Kinase activity prediction via PTM-SEA
Kinase activity scores were inferred from phosphorylation sites by employing PTM signature enrichment analysis (PTM-SEA) using the PTM signatures database (PTMsigDB) v1.9.0 (https://github.com/broadinstitute/ssGSEA2.0). Sequence windows flanking the phosphorylation site by 7 amino acids in both directions were used as unique site identifiers. Only fully localized phosphorylation sites as determined by Spectrum Mill software were taken into consideration. Phosphorylation sites on multiply phosphorylated peptides were resolved using the approach described in Krug et al. (2019) resulting in a total of 29,406 phosphorylation sites that were subjected to PTM-SEA analysis using the following parameters:
gene.set.database = “ptm.sig.db.all.flanking.human.v1.9.0.gmt”
sample.norm.type = “rank”
weight = 0.75
statistic = “area.under.RES”
output.score.type = “NES”
nperm = 1000
global.fdr = TRUE
min.overlap = 5
correl.type = “z.score”
NMF subtype-specific PTM-SEA was based on signed log-transformed p values derived from a two-sample moderated t test (Ritchie et al., 2015) comparing each cluster to all other clusters. The same parameters as described above were used with the exception of “weight = 1.”
Pathway projection using ssGSEA
The Gene Set Enrichment Analysis (ssGSEA) implementation available on https://github.com/broadinstitute/ssGSEA2.0 was used to separately project mRNA abundances to signaling pathways. The gene-centric and row-normalized (gene-centered) RNA data matrix derived as described in “RNA Quantitation” was then subjected to ssGSEA using the following parameters:
gene.set.database = “h.all.v6.2.symbols.gmt”
sample.norm.type = “rank”
weight = 0.75
statistic = “area.under.RES”
output.score.type = “NES”
nperm = 1000
global.fdr = TRUE
min.overlap = 10
correl.type = “z.score”
Analysis of acetylation data
We used the Reactome (Fabregat et al., 2018) Metabolism gene set containing 2,212 genes to define proteins involved in metabolism. Unsupervised clustering was performed on metabolic proteins differentially expressed between NMF clusters (Kruskal–Wallis test FDR p value < 5e-05). Differentially acetylated normalized (see below) metabolic Ac sites were selected using a similar procedure with FDR p value < 0.005. All p values were adjusted to FDR using the Benjamini-Hochberg procedure. Normalization of acetylation abundance was performed globally using a linear regression model Acsite ≈ β0 + β1 * Pr + ε where Ac = acetylation abundance of a given protein Ac site; Pr = protein abundance of a given protein; β1 = predicted coefficient between Pr and Ac; β0 = constant, and ε = residual values. The residual value ε of every fitted model was used as a new normalized acetylation value not explained by protein abundance.
Subcellular location of metabolic proteins was identified using the COMPARTMENTS database (Binder et al., 2014), filtered by evidence score > 4. An unpaired two-sample Wilcoxon test was used to find proteins and normalized Ac sites differentially expressed between pairs of NMF clusters as shown in Figures 2B and S2A (FDR p value < 0.05).
Association between histone acetyltransferases and histone deacetylases was tested using a linear regression model:Acsubstrate site≈β0 + β1 * Prsubstrate + β2 * PrHAT/HDAC + ε. P values of β2 coefficients were adjusted to FDR using Benjamini-Hochberg procedure. The following HATs and HDACs were used to test association with all possible metabolic Ac sites: CREBBP, EP300, HAT1, KAT2A, KAT2B, TAF1, KAT5, KAT6A, KAT6B, KAT7, KAT8, CLOCK, NCOA1, NCOA3, MCM3AP, ATF2, ELP3, HDAC1, HDAC2, HDAC3, HDAC4, HDAC5, HDAC6, HDAC7, HDAC8, HDAC9, HDAC10, HDAC11, SIRT1, SIRT2, SIRT3, SIRT5, SIRT6, SIRT7. Significant (FDR p value < 0.1) associations between mitochondrial HATs and HDACs and mitochondrial substrates Ac sites were defined by FDR p value < 0.1 and are shown in Figure 2D.
Nuclear proteins were determined by the COMPARTMENTS database with the nucleus score = 5. Samples with the highest acetylation coverage (N = 92, > 80% of nuclear Ac sites detected) were used for clustering. Acetylation sites differentially abundant between NMF clusters (not normalized to the protein abundance) were selected for analysis (Kruskal–Wallis test FDR p value < 0.05). Global comparison of acetylation sites abundance and protein abundance between clusters 1 and 3 (Figure 2E) was performed using a nonparametric Wilcoxon test. Acetylation or protein changes were considered significantly different if they had FDR p value < 0.05 and median fold change > 0.5. The ‘Acetylation up in cluster 1’ group is defined by significantly different Ac sites in which the acetylation median fold change is positive, while the protein change is not significant; the ‘Protein up in cluster 1’ group is defined by significantly different proteins in which the protein median fold change is positive, while the acetylation change is not significant. Pathway and GO terms overrepresentation testing was performed using gProfiler (Reimand et al., 2018).
Kinase phosphorylation outliers
To nominate kinase activity characteristic to each PAM50 and NMF cluster, as in previous studies (Dou et al., 2020; Mertins et al., 2016), we used BlackSheep’s differential extreme value analysis module (Blumenberg et al., 2019). For each phosphosite, the median and interquartile range (IQR) were calculated across all tumors. A site was defined as an outlier if it was more than 1.5 times the IQR above the median. Phosphosites were then collapsed into proteins by counting outlier and non-outlier values per sample. For each group of interest (e.g., NMF clusters), proteins not enriched in outliers in that group and proteins without at least 30% of samples with an outlier were removed. Following filtering, outlier and non-outlier sites per gene were counted for each group of interest and a Fisher’s exact test was used to calculate a p value. P values were corrected for multiple hypothesis testing using the Benjamini-Hochberg procedure. For additional insight into kinase activity, we visualized enrichment of kinase activation loops phosphorylation, calculated by a rank sum test, of loops taken from a curated list from Schmidlin et al. (2019); in addition we visualized enrichment of phosphorylation of kinase substrate sets from the PTM-SEA analysis (Krug et al., 2019).
Multi-omics clustering
Non-negative matrix factorization (NMF) implemented in the NMF R-package (Gaujoux and Seoighe, 2010) was used to perform unsupervised clustering of tumor samples and to identify proteogenomic features (proteins, phosphosites, acetylsites, RNA transcripts and somatic copy number alterations) that showed characteristic abundance patterns for each cluster. Briefly, given a factorization rank k (where k is the number of clusters), NMF decomposes a p x n data matrix V into two matrices W and H such that multiplication of W and H approximates V. Matrix H is a k x n matrix whose entries represent weights for each sample (1 to N) to contribute to each cluster (1 to k), whereas matrix W is a p x k matrix representing weights for each feature (1 to p) to contribute to each cluster (1 to k). Matrix H was used to assign samples to clusters by choosing the k with maximum score in each column of H. For each sample, we calculated a cluster membership score as the maximal fractional score of the corresponding column in matrix H. We defined a “cluster core” as the set of samples with cluster membership score > 0.5. Matrix W containing the weights of each feature in a certain cluster was used to derive a list of representative features separating the clusters using the method proposed in Kim and Park (2007). Cluster-specific features were further subjected to a 2-sample moderated t test (Ritchie et al., 2015) comparing the feature abundance between the respective cluster and all other clusters. Derived p values were adjusted for multiple hypothesis testing using the methods proposed in Benjamini and Hochberg (1995).
To enable integrative multi-omics clustering, we required all data types (and converted if necessary) to represent ratios to either a common reference measured in each TMT plex (proteome, phosphoproteome, acetylproteome) or an in-silico common reference calculated as the median abundance across all samples (mRNA, see “RNA quantification”). All data tables were then concatenated and only features quantified in all tumors were used for subsequent analysis. Features with the lowest standard deviation (bottom 5th percentile) across all samples were deemed uninformative and were removed from the dataset. Each row in the data matrix was further scaled and standardized such that all features from different data types were represented as z-scores.
Since NMF requires a non-negative input matrix, the data matrix of z-scores was further converted into a non-negative matrix as follows:
Create one data matrix with all negative numbers zeroed.
Create another data matrix with all positive numbers zeroed and the signs of all negative numbers removed.
Concatenate both matrices resulting in a data matrix twice as large as the original, but with positive values only and zeros and hence appropriate for NMF.
The resulting matrix was then subjected to NMF analysis leveraging the NMF R-package (Gaujoux and Seoighe, 2010) and using the factorization method described in Brunet et al. (2004). To determine the optimal factorization rank k (number of clusters) for the multi-omic data matrix, a range of clusters between k = 2 and 8 was tested. For each k we factorized matrix V using 50 iterations with random initializations of W and H. To determine the optimal factorization rank we calculated two metrics for each k: 1) cophenetic correlation coefficient measuring how well the intrinsic structure of the data was recapitulated after clustering and 2) the dispersion coefficient of the consensus matrix as defined in Kim and Park (2007) measuring the reproducibility of the clustering across 50 iterations. The optimal k was defined as the maximum of the product of both metrics for cluster numbers between k = 3 and 8 (Figures S3C and S4B).
Having determined the optimal factorization rank k, and in order to achieve robust factorization of the multi-omics data matrix V, the NMF analysis was repeated using 1000 iterations with random initializations of W and H and partitioning of samples into clusters as described above. Due to the non-negative transformation applied to the z-scored data matrix as described above, matrix W of feature weights contained two separate weights for positive and negative z-scores of each feature, respectively. In order to reverse the non-negative transformation and to derive a single signed weight for each feature, each row in matrix W was first normalized by dividing by the sum of feature weights in each row. Weights per feature and cluster were then aggregated by keeping the maximal normalized weight and multiplying with the sign of the z-score from the initial data matrix. Thus, the resulting transformed version of matrix Wsigned contained signed cluster weights for each feature present in the input matrix.
In order to functionally characterize the clustering results, normalized enrichment scores (NES) of cancer-relevant gene sets were calculated by projecting the matrix of signed multi-omic feature weights (Wsigned) onto Hallmark pathway gene sets (Liberzon et al., 2015) using ssGSEA (Barbie et al., 2009). To derive a single weight for each gene measured across multiple omics data types (protein, RNA, phosphorylation site, acetylation site) we retained the weight with maximal absolute amplitude. We used the ssGSEA implementation available on https://github.com/broadinstitute/ssGSEA2.0 using the following parameters:
gene.set.database = “h.all.v6.2.symbols.gmt”
sample.norm.type = “rank”
weight = 1
statistic = “area.under.RES”
output.score.type = “NES”
nperm = 1000
global.fdr = TRUE
min.overlap = 5
correl.type = “z.score”
To test the association between the resulting clusters and clinical variables, either a Fisher’s exact test (R function fisher.test) for discrete variables or a Wilcoxon rank-sum test (ggpubr R-package) in case of continuous variables was used to assess overrepresentation in the set of samples defining the cluster core as described above.
Survival analysis
To explore differences in prognosis for PAM50 LumA samples in the NMF LumA-I cluster compared to those in the NMF LumB-I cluster, we leveraged outcome data from the METABRIC study [METABRIC data was downloaded from cBioPortal (https://www.cbioportal.org/study/summary?id=brca_metabric) on Jun 2, 2020]. We trained random forest classifiers to discriminate these two groups–(A) PAM50 Luminal A in NMF LumA-I versus (B) PAM50 Luminal A in mixed Luminal A/B NMF LumB-I–using RNA-seq expression data from this study. The classifier was trained on genes common to our dataset and METABRIC, using the caret package in R. Cross validation (10-fold) over the training data was used to optimize model parameters. The final model was trained on the entire training dataset using the optimal parameters, and then used to predict NMF cluster assignment for all PAM50 LumA samples in METABRIC. Kaplan-Meier plots and log-rank tests for statistical significance were executed using the survival and survminer packages in R. For comparison, survival information for PAM50 LumB samples in METABRIC were included. Similar results were obtained when the classifier was trained using gene-level global proteome data (Figure S3K).
Single-omics clustering and application to the Johansson et al. breast proteogenomic dataset
The NMF pipeline described above was applied to each data type individually using the same parameters as for multi-omics analysis except for 500 random restarts of the factorization. An identical NMF clustering approach was applied to the Johansson et al. (2019) dataset (their Supplementary Data 1). To allow integrative analysis of our protein data with the protein data in Johansson et al. (2019) (Figure S4D), we first aggregated the protein-level data from our study to generate a gene-level data matrix by retaining the dominant isoform (identified by the lowest protein subgroup number) associated with each gene symbol. Both gene-level protein data matrices were then separately subjected to gene-level z-score transformation before joining the matrices using the unique gene symbols as a key. The NMF pipeline was applied to the integrated protein data matrix using 500 random restarts to cluster all 167 tumors into six clusters, a number pre-specified to correspond to the number of clusters identified in the Johansson et al. (2019) analysis.
LinkedOmics data preparation
Sample metadata, gene-centric GISTIC copy number log ratios, median-MAD normalized RNA expression levels, and 2-component normalized TMT log ratios for proteome, phosphoproteome, and acetylproteome datasets were deposited in LinkedOmics. Since LinkedOmics is a gene-centric database, proteome data was aggregated to the gene level according to the following process: for each subgroup, the HGNC symbol for the dominant protein in the subgroup, which was aggregated from common PSMs for the subgroup as well as unique PSMs for that protein by Spectrum Mill, was retained. If other proteins in the subgroup were reported (aggregated from unique PSMs by Spectrum Mill), the median of all entries from the subgroup for each unique HGNC symbol (other than the dominant protein gene) was retained. The median of each entry for each retained gene was uploaded into LinkedOmics. Data processed in this manner was also used for the ERBB2 proteogenomic analysis reported in Figures 3A and 3B, the immune analysis in Figures 4 and 5, and the cell cycle analysis in Figure 6. Gene level data for the phosphor- and acetylproteomes was aggregated by the median of all sites assigned to each HGNC symbol, and site level data was aggregated by taking the median of all PSMs with high confidence localization (best score VML > = 1.1) for each phospho/acetyl site position in each protein.
Proteogenomic status of ERBB2 and TOP2A
Samples were classified as proteogenomic (PG) positive for a given gene amplification when that amplification led to high levels of protein relative to the population of samples without the gene amplification. Gene-amplified samples were defined by a GISTIC threshold score of 2. All other samples were considered non-amplified. Protein Z-scores were calculated for each amplified sample relative to the distribution of log2 TMT ratios for the non-amplified samples using an outlier approach described previously (Satpathy et al., 2020), in which the Z-score was the number of non-amplified set standard deviations above the mean of the non-amplified samples that the protein expression represented in a given amplified sample. Z-scores above 2 were considered to show elevated protein expression. For ERBB2 PG+ samples, we also required PG amplification of either the STARD3 or GRB7 gene flanking ERBB2 in the amplicon. The same procedure was applied to log2 iTraq protein data and GISTIC data downloaded from LinkedOmics (http://linkedomics.org) for the retrospective cohort (Mertins et al., 2016).
Immune profiling and downstream analysis
To calculate RNA-based tumor immune scores and estimate immune-cell-specific contributions to each tumor, FPKM data was analyzed using ESTIMATE (R package) (Yoshihara et al., 2013), CIBERSORT in absolute mode (Newman et al., 2015), xCell (Aran et al., 2017) and MCPcounter (R package) (Becht et al., 2016b). We also inferred the immune cell infiltration by ssGSEA using a recently published immune gene signature (Angelova et al., 2015). Protein-based immune scores for stimulatory and inhibitory immune modulators and the set of HLA proteins were calculated as the mean of the protein log ratios in each set defined in Thorsson et al. (2019). Immune protein eigenvectors and signatures were calculated using protein data with the protocol and gene sets described in Thorsson et al. (2019). Then the two top protein signatures closest by Euclidean distance to each of the five eigenvectors were shown in Figure S7A.
PD-L1 correlation analysis
LinkedOmics (http://linkedomics.org; Vasaikar et al., 2018) was used to identify proteins correlated with PD-L1 mRNA levels within the PAM50 luminal samples (luminal A + luminal B) and the PAM50 basal samples separately. Benjamini-Hochberg corrected p values for Spearman rank correlations between PD-L1 and each protein are shown in Figure 5A. WebGestalt (Liao et al., 2019; http://webgestalt.org) was used to perform GSEA for GO biological process sets (Ashburner et al., 2000) using the signed log P values (uncorrected) from the Spearman rank correlations of protein TMT log ratios with PD-L1 for each set of samples. For pairwise Spearman-rank correlation analysis within the luminal and basal PAM50 subsets, pathway scores were calculated as the mean of all TMT log ratios for proteins in each set for a given sample (Table S6). Gene sets for this analysis included the aforementioned immune modulator sets (Thorsson et al., 2019), GO biological process sets for nucleotide excision repair (GO:0006289), mRNA processing (GO:0006397), and RNA splicing (GO:0006397) and unique proteins from DNA repair pathway sets (also used for analysis in Figure 2) for base excision repair, direct repair, DNA damage checkpoint signaling, Fanconi anemia pathway, homologous recombination, mismatch repair, non-homologous end joining, nucleotide excision repair, and translesion synthesis defined by Anurag et al. (2018b). Pairwise Spearman-rank correlation analysis was repeated for the retrospective cohort (Mertins et al., 2016) using scores generated by averaging protein data for the same protein sets and from running CIBERSORT (Newman et al., 2015) on RPKM RNA-seq data downloaded from LinkedOmics.
DNA damage response score
To estimate the activity of the DNA double-stranded break response (DDR) pathway, we focused on phosphopeptide abundance of SQ/TQ sites that have been previously shown to increase in abundance following irradiation-induced double stranded breaks (Matsuoka et al., 2007). We found phosphopeptides from Matsuoka et al. (2007) that were also detected in our study by matching peptide sequences (N = 297). Since DDR often increases target peptide phosphorylation from undetectable to highly abundant, we converted values into up and down outliers using BlackSheep (described above). DDR score was the mean of outlier values for the DDR peptides per sample.
Chromosome instability score
The Chromosome instability (CIN) score was used to summarize the genome-wide SCNA intensity. From the SCNA segmentation results, we used a straightforward weighted-sum approach to derive the CIN score for each sample as described in Vasaikar et al. (2019). Specifically, the absolute log2 ratios of all segments (indicating the copy number alteration of these segments) within a chromosome were summed, while being weighted by the segment length to derive the instability score for the chromosome. The genome-wide chromosome instability index was further derived by summing the instability score of all 22 autosomes.
Determination of stemness score
Stemness scores were calculated as previously described (Malta et al., 2018). First we used MoonlightR (Colaprico et al., 2020) to query, download, and preprocess the pluripotent stem cell samples (ESC and iPSC) from the Progenitor Cell Biology Consortium (PCBC) dataset (Daily et al., 2017; Salomonis et al., 2016). Second, to calculate the stemness scores based on mRNA expression, we built a predictive model using one-class logistic regression (OCLR) (Sokolov et al., 2016) on PCBC dataset.
For mRNA expression-based signatures, to ensure compatibility with the CPTAC BRCA cohort, we first mapped the gene names from Ensembl IDs to Human Genome Organization (HUGO), dropping any genes that had no such mapping. The resulting training matrix contained 12,954 mRNA expression values measured across all available PCBC samples. We used gene-centered FPKM mRNA expression values for all CPTAC BRCA tumors to generate the mRNASi (mRNA stemness index) for each sample. We used the function TCGAanalyze_Stemness from the package TCGAbiolinks (Colaprico et al., 2016) following our previously-described workflow (Mounir et al., 2019), with “stemSig” argument set to PCBC_stemSig.
CDK4/6-related cell cycle analysis
Multi-Gene Proliferation Scores (MGPS) were calculated from the median-MAD normalized RNA-seq data as described previously (Ellis et al., 2017). Briefly, MGPS was calculated as the mean expression level of all cell cycle-regulated genes identified by Whitfield et al. (2002) in each sample. Apoptosis and E2F target gene scores were the ssGSEA normalized enrichment scores from the corresponding MSigDB Hallmark gene sets calculated above (Pathway projection using ssGSEA). Likewise, CDK1–7 and CDK9 target site/activity scores were the PTM-SEA scores calculated above for ssGSEA enrichment of PhosphositePlus (Hornbeck et al., 2015) target sites for each of these kinases (Kinase activity prediction via PTM-SEA). TNBCtype (Chen et al., 2012) was applied to assign triple-negative breast cancer samples to the four TNBC subtypes (BL1, BL2, M and LAR) based on RNaseq FPKM data (Lehmann et al., 2011, 2016).
RB1 analysis in Cell lines
RB1 mutation status, copy number, and protein abundance for Cancer Cell Line Encyclopedia (CCLE) breast cancer cell lines along with ER and HER2 annotations were downloaded from DepMap (DepMap, Broad (2020): DepMap 20Q2 Public. figshare. Dataset. https://figshare.com/articles/DepMap_20Q2_Public/12280541/4; Ghandi et al., 2019; Nusinow et al., 2020). Area Under the Curve (AUC) drug responses to a CDK4/6 inhibitor, palbociclib, were retrieved from the Sanger/Massachusetts General Hospital Genomics of Drug Sensitivity Dataset 1 (Iorio et al., 2016; Yang et al., 2013). High AUC values indicate low sensitivity to the drug while low AUC values indicate high sensitivity. Cell lines with RB1 gene level copy number < −1 or having a deletion-causing frameshift mutation were categorized as RB1 deleted/frameshift. Cell lines with an in-frame deletion or missense mutations in RB1 were categorized as RB1 missense. All other cell lines were RB1 WT. For Figure 6D, a Kruskal-Wallis test was performed to test for differences in palbociclib response among cell lines stratified by RB1 status and ER/HER2 subtypes. For Figure 6E, Spearman’s correlation coefficient was calculated using cell lines with RB1 protein measurements from Figure 6D to test the association between RB1 protein abundance and palbociclib response.
ADDITIONAL RESOURCES
CPTAC program website, detailing program initiatives, investigators, and datasets, is available at https://proteomics.cancer.gov/programs/cptac.
Supplementary Material
KEY RESOURCES TABLE.
| REAGENT or RESOURCE | SOURCE | IDENTIFIER |
|---|---|---|
| Antibodies | ||
| Mouse monoclonal anti-CD8 (C8/144B) | Cellmarque | Catalog #108M; RRID: AB_1158205-1158210 |
| Rabbit monoclonal anti-CD4 (SP35) | Roche | Catalog #790-4423; RRID: AB_2335982 |
| Liquid Concentrated Monoclonal Antibody anti-CD163 | Leica Biosystems | Catalog #NCL-L-163; RRID: AB_2756375 |
| PTMScan Acetyl-lysine Kit | Cell Signaling Technology | Catalog: 13416 |
| Biological Samples | ||
| Primary tumor samples | See Experimental Model and Subject Details | N/A |
| Chemicals and Reagents | ||
| HPLC-grade water | J.T. Baker | Catalog: 4218-03 |
| Urea | Sigma | Catalog: U0631 |
| Sodium chloride | Sigma | Catalog: 71376 |
| 1M Tris, pH 8.0 | Invitrogen | Catalog: AM9855G |
| Ethylenediaminetetraacetic acid | Sigma | Catalog: E7889 |
| Aprotinin | Sigma | Catalog: A6103 |
| Leupeptin | Roche | Catalog: 11017101001 |
| Phenylmethylsulfonyl fluoride | Sigma | Catalog: 78830 |
| Sodium fluoride | Sigma | Catalog: S7920 |
| Phosphatase inhibitor cocktail 2 | Sigma | Catalog: P5726 |
| Phosphatase inhibitor cocktail 3 | Sigma | Catalog: P0044 |
| Dithiothretiol, No-Weigh Format | Fisher Scientific | Catalog: 20291 |
| Iodoacetamide | Sigma | Catalog: A3221 |
| Lysyl endopeptidase | Wako Chemicals | Catalog: 129-02541 |
| Sequencing-grade modified trypsin | Promega | Catalog: V511X |
| Formic acid | Sigma | Catalog: F0507 |
| Acetonitrile | Honeywell | Catalog: 34967 |
| Trifluoroacetic acid | Sigma | Catalog: 302031 |
| Tandem Mass Tag reagent kit – 10plex | ThermoFisher | Catalog: 90406 |
| 0.5M HEPES, pH 8.5 | Alfa Aesar | Catalog: J63218 |
| Hydroxylamine solution, 50% (vol/vol) in H2O | Aldrich | Catalog: 467804 |
| Methanol | Honeywell | Catalog: 34966 |
| Ammonium hydroxide solution, 28% (wt/vol) in H2O | Sigma | Catalog: 338818 |
| Ni-NTA agarose beads | QIAGEN | Catalog: 30410 |
| Iron (III) chloride | Sigma | Catalog: 451649 |
| Acetic acid, glacial | Sigma | Catalog: AX0073 |
| Potassium phosphate, monobasic | Sigma | Catalog: P0662 |
| Potassium phosphate, dibasic | Sigma | Catalog: P3786 |
| MOPS | Sigma | Catalog: M5162 |
| Sodium hydroxide | VWR | Catalog: BDH7225 |
| Sodium phosphate, dibasic | Sigma | Catalog: S9763 |
| Phosphate-buffered saline | Fisher Scientific | Catalog: 10010023 |
| iVIEW DAB Detection Kit | Roche | Catalog: 760-091 |
| Equipment | ||
| Reversed-phase tC18 SepPak, 1cc 100mg | Waters | Catalog: WAT\036820 |
| Solid-phase C18 disk, for Stage-tips | Empore | Catalog: 66883-U |
| Stage-tip needle | Cadence | Catalog: 7928 |
| Stage-tip puncher, PEEK tubing | Idex Health & Science | Catalog: 1581 |
| PicoFrit LC-MS column | New Objective | Catalog: PF360-75-10-N-5 |
| ReproSil-Pur, 120 Å, C18-AQ, 1.9-μm resin | Dr. Maisch | Catalog: r119.aq |
| Nanospray column heater | Phoenix S&T | Catalog: PST-CH-20U |
| Column heater controller | Phoenix S&T | Catalog: PST-CHC |
| 300 μL LC-MS autosampler vial and cap | Waters | Catalog: 186002639 |
| Offline HPLC column, 3.5-μm particle size, 4.6 um × 250 mm | Agilent | Catalog: Custom order |
| Offline 96-well fractionation plate | Whatman | Catalog: 77015200 |
| 700 μL bRP fractionation autosampler vial | ThermoFisher | Catalog: C4010-14 |
| 700 μL bRP fractionation autosampler cap | ThermoFisher | Catalog: C4010-55A |
| 96-well microplate for BCA | Greiner | Catalog: 655101 |
| Microplate foil cover | Corning | Catalog: PCR-AS-200 |
| Vacuum centrifuge | ThermoFisher | Catalog: SPD121P-115 |
| Centrifuge | Eppendorf | Catalog: 5427 R |
| Benchtop mini centrifuge | Corning | Catalog: 6765 |
| Benchtop vortex | Scientific Industries | Catalog: SI-0236 |
| Incubating shaker | VWR | Catalog: 12620-942 |
| 15 mL centrifuge tube | Corning | Catalog: 352097 |
| 50 mL centrifuge tube | Corning | Catalog: 352070 |
| 1.5 mL microtube w/o cap | Sarstedt | Catalog: 72.607 |
| 2.0 mL microtube w/o cap | Sarstedt | Catalog: 72.608 |
| Microtube caps | Sarstedt | Catalog: 72.692 |
| 1.5 mL snapcap tube | ThermoFisher | Catalog: AM12450 |
| 2.0 mL snapcap tube | ThermoFisher | Catalog: AM12475 |
| Instrumentation | ||
| Microplate Reader | Molecular Devices | Catalog: M2 |
| Offline HPLC System for bRP fractionation | Agilent | Catalog: G1380-90000 |
| Online LC for LC-MS | ThermoFisher | Catalog: LC140 |
| Q Exactive Plus Mass Spectrometer | ThermoFisher | Catalog: IQLAAEGA APFALGMBDK |
| Orbitrap Fusion LumosTribrid Mass Spectrometer | ThermoFisher | Catalog: IQLAAEGA APFADBMBHQ |
| Critical Commercial Assays | ||
| TruSeq Stranded Total RNA Library Prep Kit with Ribo-Zero Gold | Illumina | Catalog: RS-122-2301 |
| Infinium MethylationEPIC Kit | Illumina | Catalog: WG-317-1003 |
| Nextera DNA Exosome Kit | Illumina | Catalog: 20020617 |
| KAPA Hyper Prep Kit, PCR-free | Roche | Catalog: 07962371001 |
| BCA Protein Assay Kit | ThermoFisher | Catalog: 23225 |
| Deposited Data | ||
| Proteomics data | CPTAC Data Portal (https://cptac-data-portal.georgetown.edu) | https://cptac-data-portal.georgetown.edu/study-summary/S060 |
| Proteomics data | Proteomic Data Commons (https://pdc.cancer.gov) | PDC000120 |
| Genomics data | dbGaP | phs000892 |
| Software and Algorithms | ||
| Terra | Broad Institute data science platform. | https://terra.bio/ |
| ContEst | Cibulskis et al., 2011 | https://software.broadinstitute.org/cancer/cga/contest |
| MuTect | Cibulskis et al., 2013 | https://software.broadinstitute.org/cancer/cga/mutect |
| Strelka | Kim et al., 2018 | https://github.com/Illumina/strelka |
| AllelicCapSeg | https://github.com/aaronmck/CapSeg | |
| ABSOLUTE | Carter et al., 2012 | https://software.broadinstitute.org/cancer/cga/absolute |
| deTiN | Taylor-Weiner et al., 2018 | https://github.com/getzlab/deTiN |
| GATK4 | McKenna et al., 2010 | https://gatk.broadinstitute.org/hc/en-us |
| Oncotator | Ramos et al., 2015 | https://software.broadinstitute.org/cancer/cga/oncotator |
| The Ensembl Variant Effect Predictor | McLaren et al., 2016 | http://useast.ensembl.org//uswest.ensembl.org/info/docs/tools/vep/index.html?redirectsrc=//useast.ensembl.org%2Finfo%2Fdocs%2Ftools%2Fvep%2Findex.html |
| HaplotypeCaller | Poplin et al., 2017 | https://gatk.broadinstitute.org/hc/en-us/articles/360037225632-HaplotypeCaller |
| Cufflinks | Trapnell et al., 2010 | http://cole-trapnell-lab.github.io/cufflinks/ |
| GISTIC2.0 | Mermel et al., 2011 | http://portals.broadinstitute.org/cgi-bin/cancer/publications/pub_paper.cgi?mode=view&paper_id=216&p=t |
| MutSig2CV | Lawrence et al., 2014 | https://software.broadinstitute.org/cancer/cga/msp |
| SignatureAnalyzer | Kim et al., 2016 | https://software.broadinstitute.org/cancer/cga/ |
| COSMIC | Tate et al., 2019 | https://cancer.sanger.ac.uk/cosmic |
| deconstructSigs (R-package) | Rosenthal et al., 2016 | https://cran.r-project.org/web/packages/deconstructSigs/ |
| Maftool (R-package) | Mayakonda et al., 2018 | https://bioconductor.org/packages/release/bioc/html/maftools.html |
| Spectrum Mill software package v7.0 | Agilent Technologies, Santa Clara, CA | https://proteomics.broadinstitute.org/ |
| CMap | Lamb et al., 2006; Subramanian et al., 2017 | https://clue.io/cmap |
| QUILTS v3.0 | Ruggles et al., 2015 | http://openslice.fenyolab.org/cgi-bin/pyquilts_cgi.pl |
| PTM-SEA | Krug et al., 2019 | https://github.com/broadinstitute/ssGSEA2.0 |
| Protigy | Broad Institute, Proteomics Platform | https://github.com/broadinstitute/protigy |
| Reactome | Fabregat et al., 2018 | https://reactome.org/ |
| COMPARTMENTS | Binder et al., 2014 | https://compartments.jensenlab.org/Search |
| Blacksheep | Ruggles/Fenyo lab | https://www.biorxiv.org/content/10.1101/825067v2, https://github.com/ruggleslab/blackSheep, https://github.com/ruggleslab/blackSheepr |
| NMF (R-package) | Gaujoux and Seoighe, 2010 | https://cran.r-project.org/web/packages/NMF/index.html |
| TCGAbiolinks | Colaprico et al., 2016 | https://bioconductor.org/packages/release/bioc/html/TCGAbiolinks.html |
| LinkedOmics | Vasaikar et al., 2018 | http://www.linkedomics.orglogin.php |
| WebGestalt | Liao et al., 2019 | http://www.webgestalt.org/ |
| MoonlightR | Colaprico et al., 2020 | https://bioconductor.org/packages/release/bioc/html/MoonlightR.html |
| Cibersort | Newman et al., 2015 | https://cibersort.stanford.edu/ |
| xCell | Aran et al., 2017 | https://xcell.ucsf.edu/ |
| ESTIMATE (R-package) | Yoshihara et al., 2013 | https://bioinformatics.mdanderson.org/estimate/rpackage.html |
Highlights.
Comprehensive proteogenomics resource from prospectively collected breast tumors
Proteogenomics defines ERBB2 and Rb status with clinical implications
Acetylproteome profiling yields insights into subtype-specific cancer metabolism
Immune profiling nominates subsets of luminal tumors for immune therapy
ACKNOWLEDGMENTS
This work was supported by the National Cancer Institute (NCI) Clinical Proteomic Tumor Analysis Consortium through grants U24CA160034 (to S.A.C.), U24CA210986 (to S.A.C. and M.A.G.), U01CA214125 (to M.J.E. and S.A.C.), U24CA210979 (to D.R.M. and G.G.), U24CA210954 (to B.Z.), and U24CA210972 (to L.D. and D.F.) and by NIH grant T32CA203690 (to J.T.L.). M.J.E. is a Susan G. Komen Foundation Scholar, a McNair Scholar supported by the McNair Medical Institute at The Robert and Janice McNair Foundation, and a recipient of a CPRIT (Cancer Prevention and Research Institute of Texas) Established Investigator Award (RR140027).
Footnotes
DECLARATION OF INTERESTS
M.J.E reports ownership and royalties associated with Bioclassifier LLC through sales by Nanostring LLC and Veracyte for the “Prosigna” breast cancer prognostic test. He also reports ad hoc consulting for AstraZeneca, Foundation Medicine, G1 Therapeutics, Novartis, Sermonix, Abbvie, Lilly and Pfizer. B.Z. has received research funding from Bristol-Myers Squibb. S.A.C. is a scientific advisory board member of Kymera, PTM BioLabs, and Seer and ad hoc consultant to Pfizer and Biogen.
CONSORTIA
The members of the Clinical Proteomic Tumor Analysis Consortium are Meenakshi Anurag, Shayan C. Avanessian, Erik Bergstrom, Chet Birger, Lili Blumenberg, Emily Boja, Shuang Cai, Song Cao, Steven A. Carr, Daniel Chan, Xian Chen, Karl R. Clauser, Antonio Colaprico, Li Ding, Yongchao Dou, Nathan J. Edwards, Matthew J. Ellis, David Fenyö, Yifat Geffen, Gad Getz, Michael A. Gillette, David I. Heiman, Tara Hiltke, Andrew N. Hoofnagle, Chen Huang, Eric J. Jaehnig, M. Harry Kane, Alla Karpova, Karen A. Ketchum, Christopher R. Kinsinger, Ramani B. Kothadia, Karsten Krug, Eric Kuhn, Jonathan T. Lei, Douglas A. Levine, Shunqiang Li, Yuxing Liao, Daniel C. Liebler, Tao Liu, Jingqin Luo, Subha Madhavan, Chris Maher, D. R. Mani, Yosef Maruvka, Jason E. McDermott, Peter B. McGarvey, Philipp Mertins, Mehdi Mesri, George Miles, Mauricio Oberti, Akhilesh Pandey, Samuel H. Payne, David F. Ransohoff, Robert C. Rivers, Ana I. Robles, Karin D. Rodland, Henry Rodriguez, Paul Rudnick, Kelly V. Ruggles, Melinda E. Sanders, Shankha Satpathy, Kenna M. Shaw, Zhiao Shi, Ie-Ming Shih, Robbert J. C. Slebos, Richard D. Smith, Michael Snyder, Stephen E. Stein, David L. Tabb, Lauren C. Tang, Ratna R. Thangudu, Mathangi Thiagarajan, Stefani Thomas, Jarey Wang, Yue Wang, Bo Wen, Thomas F. Westbrook, Forest M. White, Jeffrey R. Whiteaker, Gordon A. Whiteley, Maciej Wiznerowicz, Matthew A. Wyczalkowski, Bing Zhang, Hui Zhang, Zhen Zhang, Yingming Zhao, Heng Zhu, and Lisa J. Zimmerman.
SUPPLEMENTAL INFORMATION
Supplemental Information can be found online at https://doi.org/10.1016/j.cell.2020.10.036.
REFERENCES
- Alhazzazi TY, Kamarajan P, Xu Y, Ai T, Chen L, Verdin E, and Kapila YL (2016). A Novel Sirtuin-3 Inhibitor, LC-0296, Inhibits Cell Survival and Proliferation, and Promotes Apoptosis of Head and Neck Cancer Cells. Anticancer Res. 36, 49–60. [PMC free article] [PubMed] [Google Scholar]
- Ali I, Conrad RJ, Verdin E, and Ott M (2018). Lysine Acetylation Goes Global: From Epigenetics to Metabolism and Therapeutics. Chem. Rev. 118, 1216–1252. [DOI] [PMC free article] [PubMed] [Google Scholar]
- Angelova M, Charoentong P, Hackl H, Fischer ML, Snajder R, Krogsdam AM, Waldner MJ, Bindea G, Mlecnik B, Galon J, and Trajanoski Z (2015). Characterization of the immunophenotypes and antigenomes of colorectal cancers reveals distinct tumor escape mechanisms and novel targets for immunotherapy. Genome Biol. 16, 64. [DOI] [PMC free article] [PubMed] [Google Scholar]
- Anurag M, Punturi N, Hoog J, Bainbridge MN, Ellis MJ, and Haricharan S (2018a). Comprehensive Profiling of DNA Repair Defects in Breast Cancer Identifies a Novel Class of Endocrine Therapy Resistance Drivers. Clin. Cancer Res. 24, 4887–4899. [DOI] [PMC free article] [PubMed] [Google Scholar]
- Anurag M, Ellis MJ, and Haricharan S (2018b). DNA damage repair defects as a new class of endocrine treatment resistance driver. Oncotarget 9, 36252–36253. [DOI] [PMC free article] [PubMed] [Google Scholar]
- Anurag M, Zhu M, Huang C, Vasaikar S, Wang J, Hoog J, Burugu S, Gao D, Suman V, Zhang XH, et al. (2020). Immune Checkpoint Profiles in Luminal B Breast Cancer (Alliance). J. Natl. Cancer Inst 112, 737–746. [DOI] [PMC free article] [PubMed] [Google Scholar]
- Aran D, Hu Z, and Butte AJ (2017). xCell: digitally portraying the tissue cellular heterogeneity landscape. Genome Biol. 18, 220. [DOI] [PMC free article] [PubMed] [Google Scholar]
- Asghar US, Barr AR, Cutts R, Beaney M, Babina I, Sampath D, Giltnane J, Lacap JA, Crocker L, Young A, et al. (2017). Single-Cell Dynamics Determines Response to CDK4/6 Inhibition in Triple-Negative Breast Cancer. Clin. Cancer Res. 23, 5561–5572. [DOI] [PMC free article] [PubMed] [Google Scholar]
- Ashburner M, Ball CA, Blake JA, Botstein D, Butler H, Cherry JM, Davis AP, Dolinski K, Dwight SS, Eppig JT, et al. ; The Gene Ontology Consortium (2000). Gene ontology: tool for the unification of biology. Nat. Genet. 25, 25–29. [DOI] [PMC free article] [PubMed] [Google Scholar]
- Barbie DA, Tamayo P, Boehm JS, Kim SY, Moody SE, Dunn IF, Schinzel AC, Sandy P, Meylan E, Scholl C, et al. (2009). Systematic RNA interference reveals that oncogenic KRAS-driven cancers require TBK1. Nature 462, 108–112. [DOI] [PMC free article] [PubMed] [Google Scholar]
- Barker L (2002). A comparison of nine confidence intervals for a Poisson parameter when the expected number of events is ≤ 5. Am. Stat. 56, 85–89. [Google Scholar]
- Becht E, Giraldo NA, Lacroix L, Buttard B, Elarouci N, Petitprez F, Selves J, Laurent-Puig P, Sautè s-Fridman C, Fridman WH, and de Reyniè s A (2016a). Erratum to: Estimating the population abundance of tissue-infiltrating immune and stromal cell populations using gene expression. Genome Biol. 17, 249. [DOI] [PMC free article] [PubMed] [Google Scholar]
- Becht E, Giraldo NA, Lacroix L, Buttard B, Elarouci N, Petitprez F, Selves J, Laurent-Puig P, Sautè s-Fridman C, Fridman WH, and de Reyniè s A (2016b). Estimating the population abundance of tissue-infiltrating immune and stromal cell populations using gene expression. Genome Biol. 17, 218. [DOI] [PMC free article] [PubMed] [Google Scholar]
- Benjamini Y, and Hochberg Y (1995). Controlling the False Discovery Rate: A Practical and Powerful Approach to Multiple Testing. J. R. Stat. Soc. Series B Methodol. 57, 289–300. [Google Scholar]
- Binder JX, Pletscher-Frankild S, Tsafou K, Stolte C, O’Donoghue SI, Schneider R, and Jensen LJ (2014). COMPARTMENTS: unification and visualization of protein subcellular localization evidence. Database (Oxford) 2014, bau012. [DOI] [PMC free article] [PubMed] [Google Scholar]
- Blumenberg L, Kawaler E, Cornwell M, Smith S, Ruggles K, and Fenyö D (2019). BlackSheep: A Bioconductor and Bioconda package for differential extreme value analysis. bioRxiv. 10.1101/825067. [DOI] [PMC free article] [PubMed] [Google Scholar]
- Bouchal P, Schubert OT, Faktor J, Capkova L, Imrichova H, Zoufalova K, Paralova V, Hrstka R, Liu Y, Ebhardt HA, et al. (2019). Breast Cancer Classification Based on Proteotypes Obtained by SWATH Mass Spectrometry. Cell Rep. 28, 832–843.e7. [DOI] [PMC free article] [PubMed] [Google Scholar]
- Brunet J-P, Tamayo P, Golub TR, and Mesirov JP (2004). Metagenes and molecular pattern discovery using matrix factorization. Proc. Natl. Acad. Sci. USA 101, 4164–4169. [DOI] [PMC free article] [PubMed] [Google Scholar]
- Caldon CE (2014). Estrogen signaling and the DNA damage response in hormone dependent breast cancers. Front. Oncol. 4, 106. [DOI] [PMC free article] [PubMed] [Google Scholar]
- Cancer Genome Atlas Network (2012). Comprehensive molecular portraits of human breast tumours. Nature 490, 61–70. [DOI] [PMC free article] [PubMed] [Google Scholar]
- Carter SL, Cibulskis K, Helman E, McKenna A, Shen H, Zack T, Laird PW, Onofrio RC, Winckler W, Weir BA, et al. (2012). Absolute quantification of somatic DNA alterations in human cancer. Nat. Biotechnol. 30, 413–421. [DOI] [PMC free article] [PubMed] [Google Scholar]
- Chen X, Li J, Gray WH, Lehmann BD, Bauer JA, Shyr Y, and Pietenpol JA (2012). TNBCtype: A Subtyping Tool for Triple-Negative Breast Cancer. Cancer Inform. 11, 147–156. [DOI] [PMC free article] [PubMed] [Google Scholar]
- Chen Y, Fu LL, Wen X, Wang XY, Liu J, Cheng Y, and Huang J (2014). Sirtuin-3 (SIRT3), a therapeutic target with oncogenic and tumor-suppressive function in cancer. Cell Death Dis. 5, e1047. [DOI] [PMC free article] [PubMed] [Google Scholar]
- Chiang J, and Martinez-Agosto JA (2012). Effects of mTOR Inhibitors on Components of the Salvador-Warts-Hippo Pathway. Cells 1, 886–904. [DOI] [PMC free article] [PubMed] [Google Scholar]
- Choudhary C, Kumar C, Gnad F, Nielsen ML, Rehman M, Walther TC, Olsen JV, and Mann M (2009). Lysine acetylation targets protein complexes and co-regulates major cellular functions. Science 325, 834–840. [DOI] [PubMed] [Google Scholar]
- Chow KN, and Dean DC (1996). Domains A and B in the Rb pocket interact to form a transcriptional repressor motif. Mol. Cell. Biol. 16, 4862–4868. [DOI] [PMC free article] [PubMed] [Google Scholar]
- Cibulskis K, McKenna A, Fennell T, Banks E, DePristo M, and Getz G (2011). ContEst: estimating cross-contamination of human samples in next-generation sequencing data. Bioinformatics 27, 2601–2602. [DOI] [PMC free article] [PubMed] [Google Scholar]
- Cibulskis K, Lawrence MS, Carter SL, Sivachenko A, Jaffe D, Sougnez C, Gabriel S, Meyerson M, Lander ES, and Getz G (2013). Sensitive detection of somatic point mutations in impure and heterogeneous cancer samples. Nat. Biotechnol. 31, 213–219. [DOI] [PMC free article] [PubMed] [Google Scholar]
- Coates AS, Winer EP, Goldhirsch A, Gelber RD, Gnant M, Piccart-Gebhart M, Thürlimann B, and Senn H-J; Panel Members (2015). Tailoring therapies–improving the management of early breast cancer: St Gallen International Expert Consensus on the Primary Therapy of Early Breast Cancer 2015. Ann. Oncol. 26, 1533–1546. [DOI] [PMC free article] [PubMed] [Google Scholar]
- Colaprico A, Silva TC, Olsen C, Garofano L, Cava C, Garolini D, Sabedot TS, Malta TM, Pagnotta SM, Castiglioni I, et al. (2016). TCGAbiolinks: an R/Bioconductor package for integrative analysis of TCGA data. Nucleic Acids Res. 44, e71. [DOI] [PMC free article] [PubMed] [Google Scholar]
- Colaprico A, Olsen C, Bailey MH, Odom GJ, Terkelsen T, Silva TC, Olsen AV, Cantini L, Zinovyev A, Barillot E, et al. (2020). Interpreting pathways to discover cancer driver genes with Moonlight. Nat. Commun. 11, 69. [DOI] [PMC free article] [PubMed] [Google Scholar]
- Condorelli R, Mosele F, Verret B, Bachelot T, Bedard PL, Cortes J, Hyman DM, Juric D, Krop I, Bieche I, et al. (2019). Genomic alterations in breast cancer: level of evidence for actionability according to ESMO Scale for Clinical Actionability of molecular Targets (ESCAT). Ann. Oncol. 30, 365–373. [DOI] [PubMed] [Google Scholar]
- Cotto KC, Wagner AH, Feng Y-Y, Kiwala S, Coffman AC, Spies G, Wollam A, Spies NC, Griffith OL, and Griffith M (2018). DGIdb 3.0: a redesign and expansion of the drug-gene interaction database. Nucleic Acids Res. 46 (D1), D1068–D1073. [DOI] [PMC free article] [PubMed] [Google Scholar]
- Curtis C, Shah SP, Chin S-F, Turashvili G, Rueda OM, Dunning MJ, Speed D, Lynch AG, Samarajiwa S, Yuan Y, et al. ; METABRIC Group (2012). The genomic and transcriptomic architecture of 2,000 breast tumours reveals novel subgroups. Nature 486, 346–352. [DOI] [PMC free article] [PubMed] [Google Scholar]
- Daily K, Ho Sui SJ, Schriml LM, Dexheimer PJ, Salomonis N, Schroll R, Bush S, Keddache M, Mayhew C, Lotia S, et al. (2017). Molecular, phenotypic, and sample-associated data to describe pluripotent stem cell lines and derivatives. Sci. Data 4, 170030. [DOI] [PMC free article] [PubMed] [Google Scholar]
- Dietze EC, Sistrunk C, Miranda-Carboni G, O’Regan R, and Seewaldt VL (2015). Triple-negative breast cancer in African-American women: disparities versus biology. Nat. Rev. Cancer 15, 248–254. [DOI] [PMC free article] [PubMed] [Google Scholar]
- Dong H, Adams NM, Xu Y, Cao J, Allan DSJ, Carlyle JR, Chen X, Sun JC, and Glimcher LH (2019). The IRE1 endoplasmic reticulum stress sensor activates natural killer cell immunity in part by regulating c-Myc. Nat. Immunol. 20, 865–878. [DOI] [PMC free article] [PubMed] [Google Scholar]
- Dou Y, Kawaler EA, Cui Zhou D, Gritsenko MA, Huang C, Blumenberg L, Karpova A, Petyuk VA, Savage SR, Satpathy S, et al. ; Clinical Proteomic Tumor Analysis Consortium (2020). Proteogenomic Characterization of Endometrial Carcinoma. Cell 180, 729–748.e26. [DOI] [PMC free article] [PubMed] [Google Scholar]
- Ellis MJ, Suman VJ, Hoog J, Goncalves R, Sanati S, Creighton CJ, DeSchryver K, Crouch E, Brink A, Watson M, et al. (2017). Ki67 Proliferation Index as a Tool for Chemotherapy Decisions During and After Neoadjuvant Aromatase Inhibitor Treatment of Breast Cancer: Results From the American College of Surgeons Oncology Group Z1031 Trial (Alliance). J. Clin. Oncol. 35, 1061–1069. [DOI] [PMC free article] [PubMed] [Google Scholar]
- Fabregat A, Jupe S, Matthews L, Sidiropoulos K, Gillespie M, Garapati P, Haw R, Jassal B, Korninger F, May B, et al. (2018). The Reactome Pathway Knowledgebase. Nucleic Acids Res. 46 (D1), D649–D655. [DOI] [PMC free article] [PubMed] [Google Scholar]
- Flockhart DA, and Corbin JD (1982). Regulatory mechanisms in the control of protein kinases. CRC Crit. Rev. Biochem. 12, 133–186. [DOI] [PubMed] [Google Scholar]
- Gaujoux R, and Seoighe C (2010). A flexible R package for nonnegative matrix factorization. BMC Bioinformatics 11, 367. [DOI] [PMC free article] [PubMed] [Google Scholar]
- Ghandi M, Huang FW, Jané-Valbuena J, Kryukov GV, Lo CC, McDonald ER 3rd, Barretina J, Gelfand ET, Bielski CM, Li H, et al. (2019). Next-generation characterization of the Cancer Cell Line Encyclopedia. Nature 569, 503–508. [DOI] [PMC free article] [PubMed] [Google Scholar]
- Gillette MA, and Carr SA (2013). Quantitative analysis of peptides and proteins in biomedicine by targeted mass spectrometry. Nat. Methods 10, 28–34. [DOI] [PMC free article] [PubMed] [Google Scholar]
- Gillette MA, Satpathy S, Cao S, Dhanasekaran SM, Vasaikar SV, Krug K, Petralia F, Li Y, Liang W-W, Reva B, et al. ; Clinical Proteomic Tumor Analysis Consortium (2020). Proteogenomic Characterization Reveals Therapeutic Vulnerabilities in Lung Adenocarcinoma. Cell 182, 200–225.e35. [DOI] [PMC free article] [PubMed] [Google Scholar]
- Goel S, DeCristo MJ, McAllister SS, and Zhao JJ (2018). CDK4/6 Inhibition in Cancer: Beyond Cell Cycle Arrest. Trends Cell Biol. 28, 911–925. [DOI] [PMC free article] [PubMed] [Google Scholar]
- Harbour JW (2001). Molecular basis of low-penetrance retinoblastoma. Arch. Ophthalmol. 119, 1699–1704. [DOI] [PubMed] [Google Scholar]
- Haricharan S, Punturi N, Singh P, Holloway KR, Anurag M, Schmelz J, Schmidt C, Lei JT, Suman V, Hunt K, et al. (2017). Loss of MutL Disrupts CHK2-Dependent Cell-Cycle Control through CDK4/6 to Promote Intrinsic Endocrine Therapy Resistance in Primary Breast Cancer. Cancer Discov. 7, 1168–1183. [DOI] [PMC free article] [PubMed] [Google Scholar]
- Harris LN, Broadwater G, Abu-Khalaf M, Cowan D, Thor AD, Budman D, Cirrincione CT, Berry DA, Winer EP, Hudis CA, et al. (2009). Topoisomerase IIalpha amplification does not predict benefit from dose-intense cyclophosphamide, doxorubicin, and fluorouracil therapy in HER2-amplified early breast cancer: results of CALGB 8541/150013. J. Clin. Oncol. 27, 3430–3436. [DOI] [PMC free article] [PubMed] [Google Scholar]
- Hornbeck PV, Zhang B, Murray B, Kornhauser JM, Latham V, and Skrzypek E (2015). PhosphoSitePlus, 2014: mutations, PTMs and recalibrations. Nucleic Acids Res. 43, D512–D520. [DOI] [PMC free article] [PubMed] [Google Scholar]
- Hunt AL, Bateman NW, Hood BL, Conrads KA, Zhou M, Litzi TJ, Oliver J, Mitchell D, Gist G, Blanton B, et al. (2019). Extensive Intratumor Proteogenomic Heterogeneity Revealed by Multiregion Sampling in a High-Grade Serous Ovarian Tumor Specimen. bioRxiv. 10.1101/761155. [DOI] [Google Scholar]
- Hyman DM, Taylor BS, and Baselga J (2017). Implementing GenomeDriven Oncology. Cell 168, 584–599. [DOI] [PMC free article] [PubMed] [Google Scholar]
- Iorio F, Knijnenburg TA, Vis DJ, Bignell GR, Menden MP, Schubert M, Aben N, Gonc¸ alves E, Barthorpe S, Lightfoot H, et al. (2016). A Landscape of Pharmacogenomic Interactions in Cancer. Cell 166, 740–754. [DOI] [PMC free article] [PubMed] [Google Scholar]
- Jackson HW, Fischer JR, Zanotelli VRT, Ali HR, Mechera R, Soysal SD, Moch H, Muenst S, Varga Z, Weber WP, and Bodenmiller B (2020). The single-cell pathology landscape of breast cancer. Nature 578, 615–620. [DOI] [PubMed] [Google Scholar]
- Johansson HJ, Socciarelli F, Vacanti NM, Haugen MH, Zhu Y, Siavelis I, Fernandez-Woodbridge A, Aure MR, Sennblad B, Vesterlund M, et al. ; Consortia Oslo Breast Cancer Research Consortium (OSBREAC) (2019). Breast cancer quantitative proteome and proteogenomic landscape. Nat. Commun. 10, 1600. [DOI] [PMC free article] [PubMed] [Google Scholar]
- Kanehisa M, and Goto S (2000). KEGG: kyoto encyclopedia of genes and genomes. Nucleic Acids Res. 28, 27–30. [DOI] [PMC free article] [PubMed] [Google Scholar]
- Kasar S, Kim J, Improgo R, Tiao G, Polak P, Haradhvala N, Lawrence MS, Kiezun A, Fernandes SM, Bahl S, et al. (2015). Whole-genome sequencing reveals activation-induced cytidine deaminase signatures during indolent chronic lymphocytic leukaemia evolution. Nat. Commun. 6, 8866. [DOI] [PMC free article] [PubMed] [Google Scholar]
- Kawamura D, Takemoto Y, Nishimoto A, Ueno K, Hosoyama T, Shirasawa B, Tanaka T, Kugimiya N, Harada E, and Hamano K (2017). Enhancement of cytotoxic effects of gemcitabine by Dclk1 inhibition through suppression of Chk1 phosphorylation in human pancreatic cancer cells. Oncol. Rep. 38, 3238–3244. [DOI] [PubMed] [Google Scholar]
- Kim H, and Park H (2007). Sparse non-negative matrix factorizations via alternating non-negativity-constrained least squares for microarray data analysis. Bioinformatics 23, 1495–1502. [DOI] [PubMed] [Google Scholar]
- Kim J, Mouw KW, Polak P, Braunstein LZ, Kamburov A, Kwiatkowski DJ, Rosenberg JE, Van Allen EM, D’Andrea A, and Getz G (2016). Somatic ERCC2 mutations are associated with a distinct genomic signature in urothelial tumors. Nat. Genet. 48, 600–606. [DOI] [PMC free article] [PubMed] [Google Scholar]
- Kim S, Scheffler K, Halpern AL, Bekritsky MA, Noh E, Källberg M, Chen X, Kim Y, Beyter D, Krusche P, and Saunders CT (2018). Strelka2: fast and accurate calling of germline and somatic variants. Nat. Methods 15, 591–594. [DOI] [PubMed] [Google Scholar]
- Krug K, Mertins P, Zhang B, Hornbeck P, Raju R, Ahmad R, Szucs M, Mundt F, Forestier D, Jane-Valbuena J, et al. (2019). A Curated Resource for Phosphosite-specific Signature Analysis. Mol. Cell. Proteomics 18, 576–593. [DOI] [PMC free article] [PubMed] [Google Scholar]
- Lamb J, Crawford ED, Peck D, Modell JW, Blat IC, Wrobel MJ, Lerner J, Brunet J-P, Subramanian A, Ross KN, et al. (2006). The Connectivity Map: using gene-expression signatures to connect small molecules, genes, and disease. Science 313, 1929–1935. [DOI] [PubMed] [Google Scholar]
- Lawrence MS, Stojanov P, Mermel CH, Robinson JT, Garraway LA, Golub TR, Meyerson M, Gabriel SB, Lander ES, and Getz G (2014). Discovery and saturation analysis of cancer genes across 21 tumour types. Nature 505, 495–501. [DOI] [PMC free article] [PubMed] [Google Scholar]
- Lee DD, and Seung HS (1999). Learning the parts of objects by non-negative matrix factorization. Nature 401, 788–791. [DOI] [PubMed] [Google Scholar]
- Lee DD, and Seung HS (2001). Algorithms for Non-negative Matrix Factorization. In Advances in Neural Information Processing Systems 13, Leen TK, Dietterich TG, and Tresp V, eds. (MIT Press; ), pp. 556–562. [Google Scholar]
- Lee JO, Russo AA, and Pavletich NP (1998). Structure of the retinoblastoma tumour-suppressor pocket domain bound to a peptide from HPV E7. Nature 391, 859–865. [DOI] [PubMed] [Google Scholar]
- Lehmann BD, Bauer JA, Chen X, Sanders ME, Chakravarthy AB, Shyr Y, and Pietenpol JA (2011). Identification of human triple-negative breast cancer subtypes and preclinical models for selection of targeted therapies. J. Clin. Invest. 121, 2750–2767. [DOI] [PMC free article] [PubMed] [Google Scholar]
- Lehmann BD, Bauer JA, Schafer JM, Pendleton CS, Tang L, Johnson KC, Chen X, Balko JM, Gómez H, Arteaga CL, et al. (2014). PIK3CA mutations in androgen receptor-positive triple negative breast cancer confer sensitivity to the combination of PI3K and androgen receptor inhibitors. Breast Cancer Res. 16, 406. [DOI] [PMC free article] [PubMed] [Google Scholar]
- Lehmann BD, Jovanović B, Chen X, Estrada MV, Johnson KN, Shyr Y, Moses HL, Sanders ME, and Pietenpol JA (2016). Refinement of Triple-Negative Breast Cancer Molecular Subtypes: Implications for Neoadjuvant Chemotherapy Selection. PLoS ONE 11, e0157368. [DOI] [PMC free article] [PubMed] [Google Scholar]
- Liao Y, Wang J, Jaehnig EJ, and Shi Z (2019). WebGestalt 2019: gene set analysis toolkit with revamped UIs and APIs. Nucleic Acids Res. 47, W199–W205. [DOI] [PMC free article] [PubMed] [Google Scholar]
- Liberzon A, Birger C, Thorvaldsdóttir H, Ghandi M, Mesirov JP, and Tamayo P (2015). The Molecular Signatures Database (MSigDB) hallmark gene set collection. Cell Syst. 1, 417–425. [DOI] [PMC free article] [PubMed] [Google Scholar]
- Lin C-C, Mabe NW, Lin Y-T, Yang W-H, Tang X, Hong L, Sun T, Force J, Marks JR, Yao T-P, et al. (2020). RIPK3 upregulation confers robust proliferation and collateral cystine-dependence on breast cancer recurrence. Cell Death Differ. 27, 2234–2247. [DOI] [PMC free article] [PubMed] [Google Scholar]
- Liu Y-H, Tsang JYS, Ni Y-B, Hlaing T, Chan S-K, Chan K-F, Ko C-W, Mujtaba SS, and Tse GM (2016). Doublecortin-like kinase 1 expression associates with breast cancer with neuroendocrine differentiation. Oncotarget 7, 1464–1476. [DOI] [PMC free article] [PubMed] [Google Scholar]
- Liu C-Y, Lau K-Y, Hsu C-C, Chen J-L, Lee C-H, Huang T-T, Chen Y-T, Huang C-T, Lin P-H, and Tseng L-M (2017). Combination of palbociclib with enzalutamide shows in vitro activity in RB proficient and androgen receptor positive triple negative breast cancer cells. PLoS ONE 12, e0189007. [DOI] [PMC free article] [PubMed] [Google Scholar]
- Luengo A, Gui DY, and Vander Heiden MG (2017). Targeting Metabolism for Cancer Therapy. Cell Chem. Biol. 24, 1161–1180. [DOI] [PMC free article] [PubMed] [Google Scholar]
- Malta TM, Sokolov A, Gentles AJ, Burzykowski T, Poisson L, Weinstein JN, Kamińska B, Huelsken J, Omberg L, Gevaert O, et al. ; Cancer Genome Atlas Research Network (2018). Machine Learning Identifies Stemness Features Associated with Oncogenic Dedifferentiation. Cell 173, 338–354.e15. [DOI] [PMC free article] [PubMed] [Google Scholar]
- Masuda M, and Yamada T (2017). The emergence of TNIK as a therapeutic target for colorectal cancer. Expert Opin. Ther. Targets 21, 353–355. [DOI] [PubMed] [Google Scholar]
- Matsuoka S, Ballif BA, Smogorzewska A, McDonald ER 3rd, Hurov KE, Luo J, Bakalarski CE, Zhao Z, Solimini N, Lerenthal Y, et al. (2007). ATM and ATR substrate analysis reveals extensive protein networks responsive to DNA damage. Science 316, 1160–1166. [DOI] [PubMed] [Google Scholar]
- Mayakonda A, Lin D-C, Assenov Y, Plass C, and Koeffler HP (2018). Maftools: efficient and comprehensive analysis of somatic variants in cancer. Genome Res. 28, 1747–1756. [DOI] [PMC free article] [PubMed] [Google Scholar]
- McKenna A, Hanna M, Banks E, Sivachenko A, Cibulskis K, Kernytsky A, Garimella K, Altshuler D, Gabriel S, Daly M, and DePristo MA (2010). The Genome Analysis Toolkit: a MapReduce framework for analyzing next-generation DNA sequencing data. Genome Res. 20, 1297–1303. [DOI] [PMC free article] [PubMed] [Google Scholar]
- McLaren W, Gil L, Hunt SE, Riat HS, Ritchie GRS, Thormann A, Flicek P, and Cunningham F (2016). The Ensembl Variant Effect Predictor. Genome Biol. 17, 122. [DOI] [PMC free article] [PubMed] [Google Scholar]
- Mermel CH, Schumacher SE, Hill B, Meyerson ML, Beroukhim R, and Getz G (2011). GISTIC2.0 facilitates sensitive and confident localization of the targets of focal somatic copy-number alteration in human cancers. Genome Biol. 12, R41. [DOI] [PMC free article] [PubMed] [Google Scholar]
- Mertins P, Yang F, Liu T, Mani DR, Petyuk VA, Gillette MA, Clauser KR, Qiao JW, Gritsenko MA, Moore RJ, et al. (2014). Ischemia in tumors induces early and sustained phosphorylation changes in stress kinase pathways but does not affect global protein levels. Mol. Cell. Proteomics 13, 1690–1704. [DOI] [PMC free article] [PubMed] [Google Scholar]
- Mertins P, Mani DR, Ruggles KV, Gillette MA, Clauser KR, Wang P, Wang X, Qiao JW, Cao S, Petralia F, et al. ; NCI CPTAC (2016). Proteogenomics connects somatic mutations to signalling in breast cancer. Nature 534, 55–62. [DOI] [PMC free article] [PubMed] [Google Scholar]
- Mertins P, Tang LC, Krug K, Clark DJ, Gritsenko MA, Chen L, Clauser KR, Clauss TR, Shah P, Gillette MA, et al. (2018). Reproducible workflow for multiplexed deep-scale proteome and phosphoproteome analysis of tumor tissues by liquid chromatography-mass spectrometry. Nat. Protoc. 13, 1632–1661. [DOI] [PMC free article] [PubMed] [Google Scholar]
- Miotto B, and Struhl K (2010). HBO1 histone acetylase activity is essential for DNA replication licensing and inhibited by Geminin. Mol. Cell 37, 57–66. [DOI] [PMC free article] [PubMed] [Google Scholar]
- Mishima Y, Miyagi S, Saraya A, Negishi M, Endoh M, Endo TA, Toyoda T, Shinga J, Katsumoto T, Chiba T, et al. (2011). The Hbo1-Brd1/Brpf2 complex is responsible for global acetylation of H3K14 and required for fetal liver erythropoiesis. Blood 118, 2443–2453. [DOI] [PubMed] [Google Scholar]
- Mounir M, Lucchetta M, Silva TC, Olsen C, Bontempi G, Chen X, Noushmehr H, Colaprico A, and Papaleo E (2019). New functionalities in the TCGAbiolinks package for the study and integration of cancer data from GDC and GTEx. PLoS Comput. Biol. 15, e1006701. [DOI] [PMC free article] [PubMed] [Google Scholar]
- Mullarky E, Xu J, Robin AD, Huggins DJ, Jennings A, Noguchi N, Olland A, Lakshminarasimhan D, Miller M, Tomita D, et al. (2019). Inhibition of 3-phosphoglycerate dehydrogenase (PHGDH) by indole amides abrogates de novo serine synthesis in cancer cells. Bioorg. Med. Chem. Lett. 29, 2503–2510. [DOI] [PMC free article] [PubMed] [Google Scholar]
- Murphy JP, Giacomantonio MA, Paulo JA, Everley RA, Kennedy BE, Pathak GP, Clements DR, Kim Y, Dai C, Sharif T, et al. (2018). The NAD+ Salvage Pathway Supports PHGDH-Driven Serine Biosynthesis. Cell Rep. 24, 2381–2391.e5. [DOI] [PMC free article] [PubMed] [Google Scholar]
- Newman AM, Liu CL, Green MR, Gentles AJ, Feng W, Xu Y, Hoang CD, Diehn M, and Alizadeh AA (2015). Robust enumeration of cell subsets from tissue expression profiles. Nat. Methods 12, 453–457. [DOI] [PMC free article] [PubMed] [Google Scholar]
- Nik-Zainal S, Davies H, Staaf J, Ramakrishna M, Glodzik D, Zou X, Martincorena I, Alexandrov LB, Martin S, Wedge DC, et al. (2016). Landscape of somatic mutations in 560 breast cancer whole-genome sequences. Nature 534, 47–54. [DOI] [PMC free article] [PubMed] [Google Scholar]
- Nusinow DP, Szpyt J, Ghandi M, Rose CM, McDonald ER 3rd, Kalocsay M, Jané-Valbuena J, Gelfand E, Schweppe DK, Jedrychowski M, et al. (2020). Quantitative Proteomics of the Cancer Cell Line Encyclopedia. Cell 180, 387–402.e16. [DOI] [PMC free article] [PubMed] [Google Scholar]
- O’Leary B, Finn RS, and Turner NC (2016). Treating cancer with selective CDK4/6 inhibitors. Nat. Rev. Clin. Oncol. 13, 417–430. [DOI] [PubMed] [Google Scholar]
- Parker JS, Mullins M, Cheang MCU, Leung S, Voduc D, Vickery T, Davies S, Fauron C, He X, Hu Z, et al. (2009). Supervised risk predictor of breast cancer based on intrinsic subtypes. J. Clin. Oncol. 27, 1160–1167. [DOI] [PMC free article] [PubMed] [Google Scholar]
- Parkes EE, Walker SM, Taggart LE, McCabe N, Knight LA, Wilkinson R, McCloskey KD, Buckley NE, Savage KI, Salto-Tellez M, et al. (2016). Activation of STING-Dependent Innate Immune Signaling By S-Phase-Specific DNA Damage in Breast Cancer. J. Natl. Cancer Inst. 109, 109. [DOI] [PMC free article] [PubMed] [Google Scholar]
- Patel JM, Goss A, Garber JE, Torous V, Richardson ET, Haviland MJ, Hacker MR, Freeman GJ, Nalven T, Alexander B, et al. (2020). Retinoblastoma protein expression and its predictors in triple-negative breast cancer. NPJ Breast Cancer 6, 19. [DOI] [PMC free article] [PubMed] [Google Scholar]
- Pavlova NN, and Thompson CB (2016). The Emerging Hallmarks of Cancer Metabolism. Cell Metab. 23, 27–47. [DOI] [PMC free article] [PubMed] [Google Scholar]
- Pernas S, Tolaney SM, Winer EP, and Goel S (2018). CDK4/6 inhibition in breast cancer: current practice and future directions. Ther. Adv. Med. Oncol. 10, 1758835918786451. [DOI] [PMC free article] [PubMed] [Google Scholar]
- Phan LM, Yeung S-CJ, and Lee M-H (2014). Cancer metabolic reprogramming: importance, main features, and potentials for precise targeted anticancer therapies. Cancer Biol. Med. 11, 1–19. [DOI] [PMC free article] [PubMed] [Google Scholar]
- Poplin R, Ruano-Rubio V, DePristo MA, Fennell TJ, Carneiro MO, Van der Auwera GA, Kling DE, Gauthier LD, Levy-Moonshine A, Roazen D, et al. (2017). Scaling accurate genetic variant discovery to tens of thousands of samples. bioRxiv. 10.1101/201178. [DOI] [Google Scholar]
- Possemato R, Marks KM, Shaul YD, Pacold ME, Kim D, Birsoy K, Sethumadhavan S, Woo H-K, Jang HG, Jha AK, et al. (2011). Functional genomics reveal that the serine synthesis pathway is essential in breast cancer. Nature 476, 346–350. [DOI] [PMC free article] [PubMed] [Google Scholar]
- Ramos AH, Lichtenstein L, Gupta M, Lawrence MS, Pugh TJ, Saksena G, Meyerson M, and Getz G (2015). Oncotator: cancer variant annotation tool. Hum. Mutat. 36, E2423–E2429. [DOI] [PMC free article] [PubMed] [Google Scholar]
- Reimand J, Arak T, Adler P, Kolberg L, Reisberg S, Peterson H, and Vilo J (2016). g:Profiler-a web server for functional interpretation of gene lists (2016 update). Nucleic. Acids Res. 44, W83–W89. [DOI] [PMC free article] [PubMed] [Google Scholar]
- Ritchie ME, Phipson B, Wu D, Hu Y, Law CW, Shi W, and Smyth GK (2015). limma powers differential expression analyses for RNA-sequencing and microarray studies. Nucleic Acids Res. 43, e47. [DOI] [PMC free article] [PubMed] [Google Scholar]
- Roberts SA, and Gordenin DA (2014). Hypermutation in human cancer genomes: footprints and mechanisms. Nat. Rev. Cancer 14, 786–800. [DOI] [PMC free article] [PubMed] [Google Scholar]
- Rosenthal R, McGranahan N, Herrero J, Taylor BS, and Swanton C (2016). DeconstructSigs: delineating mutational processes in single tumors distinguishes DNA repair deficiencies and patterns of carcinoma evolution. Genome Biol. 17, 31. [DOI] [PMC free article] [PubMed] [Google Scholar]
- Ross JS, Symmans WF, Pusztai L, and Hortobagyi GN (2007). Standardizing slide-based assays in breast cancer: hormone receptors, HER2, and sentinel lymph nodes. Clin. Cancer Res. 13, 2831–2835. [DOI] [PubMed] [Google Scholar]
- Ruggles KV, Tang Z, Wang X, Grover H, Askenazi M, Teubl J, Cao S, McLellan MD, Clauser KR, Tabb DL, et al. (2015). An analysis of the sensitivity of proteogenomic mapping of somatic mutations and novel splicing events in cancer. Mol. Cell. Proteomics 15, 1060–1071. [DOI] [PMC free article] [PubMed] [Google Scholar]
- Ruggles KV, Krug K, Wang X, Clauser KR, Wang J, Payne SH, Fenyö D, Zhang B, and Mani DR (2017). Methods, tools and current perspectives in proteogenomics. Mol. Cell. Proteomics 16, 959–981. [DOI] [PMC free article] [PubMed] [Google Scholar]
- Salomonis N, Dexheimer PJ, Omberg L, Schroll R, Bush S, Huo J, Schriml L, Ho Sui S, Keddache M, Mayhew C, et al. (2016). Integrated Genomic Analysis of Diverse Induced Pluripotent Stem Cells from the Progenitor Cell Biology Consortium. Stem Cell Reports 7, 110–125. [DOI] [PMC free article] [PubMed] [Google Scholar]
- Satpathy S, Jaehnig EJ, Krug K, Kim B-J, Saltzman AB, Chan DW, Holloway KR, Anurag M, Huang C, Singh P, et al. (2020). Microscaled proteogenomic methods for precision oncology. Nat. Commun. 11, 532. [DOI] [PMC free article] [PubMed] [Google Scholar]
- Schmidlin T, Debets DO, van Gelder CAGH, Stecker KE, Rontogianni S, van den Eshof BL, Kemper K, Lips EH, van den Biggelaar M, Peeper DS, et al. (2019). High-Throughput Assessment of Kinome-wide Activation States. Cell Syst. 9, 366–374.e5. [DOI] [PMC free article] [PubMed] [Google Scholar]
- Shadforth IP, Dunkley TPJ, Lilley KS, and Bessant C (2005). i-Tracker: for quantitative proteomics using iTRAQ. BMC Genomics 6, 145. [DOI] [PMC free article] [PubMed] [Google Scholar]
- Shin S-Y, and Nguyen LK (2016). Unveiling Hidden Dynamics of Hippo Signalling: A Systems Analysis. Genes (Basel) 7, 44. [DOI] [PMC free article] [PubMed] [Google Scholar]
- Shindo Y, Hazama S, Tsunedomi R, Suzuki N, and Nagano H (2019). Novel Biomarkers for Personalized Cancer Immunotherapy. Cancers (Basel) 11, 1223. [DOI] [PMC free article] [PubMed] [Google Scholar]
- Smid M, Rodríguez-González FG, Sieuwerts AM, Salgado R, PragerVan der Smissen WJC, Vlugt-Daane MV, van Galen A, Nik-Zainal S, Staaf J, Brinkman AB, et al. (2016). Breast cancer genome and transcriptome integration implicates specific mutational signatures with immune cell infiltration. Nat. Commun. 7, 12910. [DOI] [PMC free article] [PubMed] [Google Scholar]
- Smith JA, Francis SH, and Corbin JD (1993). Autophosphorylation: a salient feature of protein kinases. Mol. Cell. Biochem. 127–128, 51–70. [DOI] [PubMed] [Google Scholar]
- Sokolov A, Paull EO, and Stuart JM (2016). ONE-CLASS DETECTION OF CELL STATES IN TUMOR SUBTYPES. Pac. Symp. Biocomput. 21, 405–416. [PMC free article] [PubMed] [Google Scholar]
- Subramanian A, Tamayo P, Mootha VK, Mukherjee S, Ebert BL, Gillette MA, Paulovich A, Pomeroy SL, Golub TR, Lander ES, and Mesirov JP (2005). Gene set enrichment analysis: a knowledge-based approach for interpreting genome-wide expression profiles. Proc. Natl. Acad. Sci. USA 102, 15545–15550. [DOI] [PMC free article] [PubMed] [Google Scholar]
- Subramanian A, Narayan R, Corsello SM, Peck DD, Natoli TE, Lu X, Gould J, Davis JF, Tubelli AA, Asiedu JK, et al. (2017). A Next Generation Connectivity Map: L1000 Platform and the First 1,000,000 Profiles. Cell 171, 1437–1452.e17. [DOI] [PMC free article] [PubMed] [Google Scholar]
- Suehiro Y, Takemoto Y, Nishimoto A, Ueno K, Shirasawa B, Tanaka T, Kugimiya N, Suga A, Harada E, and Hamano K (2018). Dclk1 Inhibition Cancels 5-FU-induced Cell-cycle Arrest and Decreases Cell Survival in Colorectal Cancer. Anticancer Res. 38, 6225–6230. [DOI] [PubMed] [Google Scholar]
- Tan VYF, and Févotte C (2013). Automatic relevance determination in nonnegative matrix factorization with the β-divergence. IEEE Trans. Pattern Anal. Mach. Intell. 35, 1592–1605. [DOI] [PubMed] [Google Scholar]
- Tate JG, Bamford S, Jubb HC, Sondka Z, Beare DM, Bindal N, Boutselakis H, Cole CG, Creatore C, Dawson E, et al. (2019). COSMIC: the Catalogue Of Somatic Mutations In Cancer. Nucleic Acids Res. 47 (D1), D941–D947. [DOI] [PMC free article] [PubMed] [Google Scholar]
- Taylor-Weiner A, Stewart C, Giordano T, Miller M, Rosenberg M, Macbeth A, Lennon N, Rheinbay E, Landau D-A, Wu CJ, and Getz G (2018). DeTiN: overcoming tumor-in-normal contamination. Nat. Methods 15, 531–534. [DOI] [PMC free article] [PubMed] [Google Scholar]
- Telli ML, Gradishar WJ, and Ward JH (2019). NCCN Guidelines Updates: Breast Cancer. J. Natl. Compr. Canc. Netw. 17, 552–555. [DOI] [PubMed] [Google Scholar]
- Thorsson V, Gibbs DL, Brown SD, Wolf D, Bortone DS, Ou Yang T-H, Porta-Pardo E, Gao GF, Plaisier CL, Eddy JA, et al. ; Cancer Genome Atlas Research Network (2019). The Immune Landscape of Cancer. Immunity 51, 411–412. [DOI] [PubMed] [Google Scholar]
- Trapnell C, Williams BA, Pertea G, Mortazavi A, Kwan G, van Baren MJ, Salzberg SL, Wold BJ, and Pachter L (2010). Transcript assembly and quantification by RNA-Seq reveals unannotated transcripts and isoform switching during cell differentiation. Nat. Biotechnol. 28, 511–515. [DOI] [PMC free article] [PubMed] [Google Scholar]
- Tyanova S, Albrechtsen R, Kronqvist P, Cox J, Mann M, and Geiger T (2016). Proteomic maps of breast cancer subtypes. Nat. Commun. 7, 10259. [DOI] [PMC free article] [PubMed] [Google Scholar]
- Udeshi ND, Mani DC, Satpathy S, Fereshetian S, Gasser JA, Svinkina T, Olive ME, Ebert BL, Mertins P, and Carr SA (2020). Rapid and deep-scale ubiquitylation profiling for biology and translational research. Nat. Commun. 11, 359. [DOI] [PMC free article] [PubMed] [Google Scholar]
- Vander Heiden MG, and DeBerardinis RJ (2017). Understanding the Intersections between Metabolism and Cancer Biology. Cell 168, 657–669. [DOI] [PMC free article] [PubMed] [Google Scholar]
- Varn FS, Andrews EH, Mullins DW, and Cheng C (2016). Integrative analysis of breast cancer reveals prognostic haematopoietic activity and patient-specific immune response profiles. Nat. Commun. 7, 10248. [DOI] [PMC free article] [PubMed] [Google Scholar]
- Vasaikar SV, Straub P, Wang J, and Zhang B (2018). LinkedOmics: analyzing multi-omics data within and across 32 cancer types. Nucleic Acids Res. 46 (D1), D956–D963. [DOI] [PMC free article] [PubMed] [Google Scholar]
- Vasaikar S, Huang C, Wang X, Petyuk VA, Savage SR, Wen B, Dou Y, Zhang Y, Shi Z, Arshad OA, et al. ; Clinical Proteomic Tumor Analysis Consortium (2019). Proteogenomic Analysis of Human Colon Cancer Reveals New Therapeutic Opportunities. Cell 177, 1035–1049.e19. [DOI] [PMC free article] [PubMed] [Google Scholar]
- Verdin E, and Ott M (2015). 50 years of protein acetylation: from gene regulation to epigenetics, metabolism and beyond. Nat. Rev. Mol. Cell Biol. 16, 258–264. [DOI] [PubMed] [Google Scholar]
- Wang Z-X, and Wu J-W (2002). Autophosphorylation kinetics of protein kinases. Biochem. J. 368, 947–952. [DOI] [PMC free article] [PubMed] [Google Scholar]
- Weinert BT, Moustafa T, Iesmantavicius V, Zechner R, and Choudhary C (2015). Analysis of acetylation stoichiometry suggests that SIRT3 repairs non-enzymatic acetylation lesions. EMBO J. 34, 2620–2632. [DOI] [PMC free article] [PubMed] [Google Scholar]
- Weinert BT, Narita T, Satpathy S, Srinivasan B, Hansen BK, Schölz C, Hamilton WB, Zucconi BE, Wang WW, Liu WR, et al. (2018). Time-Resolved Analysis Reveals Rapid Dynamics and Broad Scope of the CBP/p300 Acetylome. Cell 174, 231–244.e12. [DOI] [PMC free article] [PubMed] [Google Scholar]
- Weinstabl H, Treu M, Rinnenthal J, Zahn SK, Ettmayer P, Bader G, Dahmann G, Kessler D, Rumpel K, Mischerikow N, et al. (2019). Intracellular Trapping of the Selective Phosphoglycerate Dehydrogenase (PHGDH) Inhibitor BI-4924 Disrupts Serine Biosynthesis. J. Med. Chem. 62, 7976–7997. [DOI] [PubMed] [Google Scholar]
- Weygant N, Qu D, Berry WL, May R, Chandrakesan P, Owen DB, Sureban SM, Ali N, Janknecht R, and Houchen CW (2014). Small molecule kinase inhibitor LRRK2-IN-1 demonstrates potent activity against colorectal and pancreatic cancer through inhibition of doublecortin-like kinase 1. Mol. Cancer 13, 103. [DOI] [PMC free article] [PubMed] [Google Scholar]
- Whitfield ML, Sherlock G, Saldanha AJ, Murray JI, Ball CA, Alexander KE, Matese JC, Perou CM, Hurt MM, Brown PO, and Botstein D (2002). Identification of genes periodically expressed in the human cell cycle and their expression in tumors. Mol. Biol. Cell 13, 1977–2000. [DOI] [PMC free article] [PubMed] [Google Scholar]
- Xiong Y, Wang M, Zhao J, Han Y, and Jia L (2016). Sirtuin 3: A Janus face in cancer (Review). Int. J. Oncol. 49, 2227–2235. [DOI] [PubMed] [Google Scholar]
- Yamamoto T, Kanaya N, Somlo G, and Chen S (2019). Synergistic anticancer activity of CDK4/6 inhibitor palbociclib and dual mTOR kinase inhibitor MLN0128 in pRb-expressing ER-negative breast cancer. Breast Cancer Res. Treat. 174, 615–625. [DOI] [PMC free article] [PubMed] [Google Scholar]
- Yang W, Soares J, Greninger P, Edelman EJ, Lightfoot H, Forbes S, Bindal N, Beare D, Smith JA, Thompson IR, et al. (2013). Genomics of Drug Sensitivity in Cancer (GDSC): a resource for therapeutic biomarker discovery in cancer cells. Nucleic Acids Res. 41, D955–D961. [DOI] [PMC free article] [PubMed] [Google Scholar]
- Yoshihara K, Shahmoradgoli M, Martínez E, Vegesna R, Kim H, Torres-Garcia W, Treviño V, Shen H, Laird PW, Levine DA, et al. (2013). Inferring tumour purity and stromal and immune cell admixture from expression data. Nat. Commun. 4, 2612. [DOI] [PMC free article] [PubMed] [Google Scholar]
- Zhang B, Wang J, Wang X, Zhu J, Liu Q, Shi Z, Chambers MC, Zimmerman LJ, Shaddox KF, Kim S, et al. ; NCI CPTAC (2014). Proteogenomic characterization of human colon and rectal cancer. Nature 513, 382–387. [DOI] [PMC free article] [PubMed] [Google Scholar]
- Zhang B, Whiteaker JR, Hoofnagle AN, Baird GS, Rodland KD, and Paulovich AG (2019). Clinical potential of mass spectrometry-based proteogenomics. Nat. Rev. Clin. Oncol. 16, 256–268. [DOI] [PMC free article] [PubMed] [Google Scholar]
Associated Data
This section collects any data citations, data availability statements, or supplementary materials included in this article.
Supplementary Materials
Data Availability Statement
Proteomics raw and characterized datasets are publicly available though the CPTAC data portal https://cptac-data-portal.georgetown.edu/study-summary/S060 and at the Proteomic Data Commons (https://pdc.cancer.gov/pdc/). The accession number for the proteomic data at the CPTAC data portal is S060. The accession number for the proteomic data characterized by the Proteomic Data Commons is PDC: PDC000120. The proteomics raw data consists of 17 plexes. Plexes 1–13 and 16–17 are tumor-only plexes and 14–15 are normal adjacent tissue (NAT)-only plexes. Results reported in this study are solely based on tumor-only plexes.
Raw genomic data (WES, RNA-seq, miRNA-seq,) associated with this study (harmonized with the GRCh38 reference genome) has been released at the Genomic Data Commons (https://gdc.cancer.gov) and is accessible via the database of Genotypes and Phenotypes (dbGaP). The accession number for the raw genomics data (WES, RNA-seq, miRNA-seq,) reported in this paper is dbGaP: phs000892.
Sample annotation, processed and normalized data files are provided in Tables S1 and S2. In addition, all processed data matrices will be available at LinkedOmics (Vasaikar et al., 2018) (http://www.linkedomics.orglogin.php) upon publication, where computational tools are available for further exploration of this dataset.
A website for interactive visualization of the multi-omics dataset is available at: http://prot-shiny-vm.broadinstitute.org:3838/CPTAC-BRCA2020. The heatmap depicts somatic copy number aberrations, mRNA, protein, phosphosite and acetylsite abundances across 122 tumors. Copy number alterations are relative to matched normal blood samples and are on log2(CNA)-1 scale. For other data types the heatmap depicts abundances relative to the common reference (proteomics) or the median abundance across all tumors (RNA-seq).
The entire workflow described under ‘Multi-omics clustering’ has been implemented as a module for Broad’s cloud platform Terra (https://app.terra.bio/). The docker containers encapsulating the source code and required R-packages for NMF clustering and ssGSEA have been submitted to Dockerhub (broadcptac/pgdac_mo_nmf:9, broadcptac/pgdac_ssgsea:5). The source code for ssGSEA and PTM-SEA is available on GitHub: https://github.com/broadinstitute/ssGSEA2.0.