Abstract
Carbon concentrating mechanisms (CCMs) are common among microalgae, but their regulation and even existence in some of the most promising biofuel production strains is poorly understood. This is partly because screening for new strains does not commonly include assessment of CCM function or regulation despite its fundamental role in primary carbon metabolism. In addition, the inducible nature of many microalgal CCMs means that environmental conditions should be considered when assessing CCM function and its potential impact on biofuels. In this study, we address the effect of environmental conditions by combining novel, high frequency, on-line 13CO2 gas exchange screen with microscope-based lipid characterization to assess CCM function in Nannochloropsis salina and its interaction with lipid production. Regulation of CCM function was explored by changing the concentration of CO2 provided to continuous cultures in airlift bioreactors where cell density was kept constant across conditions by controlling the rate of media supply. Our isotopic gas exchange results were consistent with N. salina having an inducible “pump-leak” style CCM similar to that of Nannochloropsis gaditana. Though cells grew faster at high CO2 and had higher rates of net CO2 uptake, we did not observe significant differences in lipid content between conditions. Since the rate of CO2 supply was much higher for the high CO2 conditions, we calculated that growing cells bubbled with low CO2 is about 40 % more efficient for carbon capture than bubbling with high CO2. We attribute this higher efficiency to the activity of a CCM under low CO2 conditions.
Keywords: Nannochloropsis, CO2 concentrating mechanism, 13CO2, Tunable diode laser, Lipid, Leakiness to CO2
Introduction
The use of microalgae to photosynthetically capture dissolved inorganic carbon (DIC, primarily CO2 and HCO3−) in order to synthesize a range of products for industrial applications, including fuels, is a major area of research globally (Pragya et al. 2013). After the availability of water, the supplies of nitrogen, phosphorous, and DIC are issues of great importance for the sustainable development of microalgal biofuels (National Research Council 2012). Recent estimates suggest that 3.7–9.2 kg DIC is needed per L of algal oil produced (Pate et al. 2011) and that variation within this range could easily tip the balance between being energetically or economically favorable to being unfavorable (Williams and Laurens 2010; Pate et al. 2011). If the biological responses of an alga are adequately quantified, then empirical testing (Becker 1994; Huertas et al. 2000; Vance and Spalding 2005; Yue and Chen 2005; Ota et al. 2009; Da Rosa et al. 2011) or modeling based on the biophysical properties of a cultivation system (James and Boriah 2010; James et al. 2013) can be used to accurately predict the optimal DIC addition rate and method needed to design favorable production systems.
However, algae are an extremely diverse and artificial grouping of organisms (Graham et al. 2009) with many unusual physiological adaptations. For example, most microalgae have biophysical mechanisms (i.e., pumps and diffusion barriers rather than C4 metabolism) for elevating DIC within their cells to levels much higher than their surrounding environment (Badger et al. 1980, 1998, 2002; Badger 2003; Raven et al. 2005, 2008; Spalding 2008; Raven 2010; Reinfelder 2011). These support efficient carbon capture by the Calvin Benson Basham cycle and are generally referred to as carbon concentrating mechanisms (CCMs). Many of these microalgae genetically control their CCM activity in response to environmental conditions including DIC, nitrogen, and phosphorous (Badger et al. 1980; Palmqvist et al. 1994; Fukuzawa et al. 2001; Beardall and Giordano 2002; Raven 2003; Beardall et al. 2005; Vance and Spalding 2005; Yamano et al. 2008). The primary environmental variable that has been studied and used to induce or suppress CCM activity is the amount of DIC in the culture media, where elevated DIC suppresses CCM activity (Badger et al. 1980; Palmqvist et al. 1994; Fukuzawa et al. 2001; Beardall and Giordano 2002; Badger 2003; Vance and Spalding 2005; Yamano et al. 2008; Brueggeman et al. 2012).
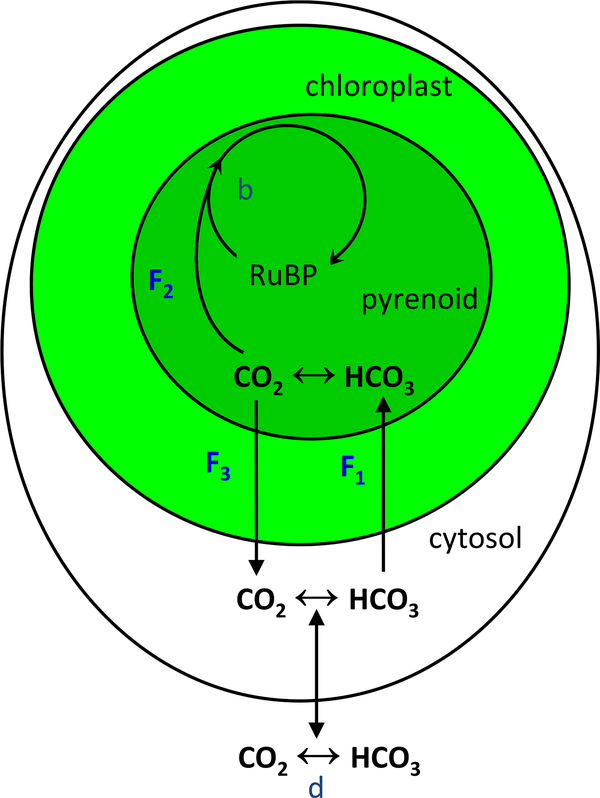
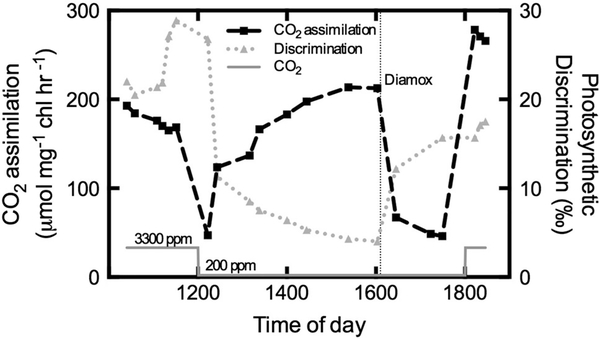
The presence, effectiveness, and inducibility of CCMs is known to be highly variable among the relatively small number of species that have been tested. Definitively characterizing CCM activity is laborious, but one useful method to screen for CCM function in vivo and in situ is the measurement of online 13CO2 gas exchange from bubbled cultures. This approach, developed by Sharkey and Berry (1985), provides an instantaneous measurement of how readily inorganic carbon diffuses out of cells while in their cultured environment, the magnitude of this “leakiness” is an important characteristic of CCM function. This online 13C approach is based on the large isotopic effects caused by the preferential use of 12CO2 over 13CO2 by the enzyme ribulose-1,5-bisphosphate carboxylase/oxygenase (Rubisco), referred to as photosynthetic discrimination (Δ), and the equilibrium fractionation from the hydration of CO2. Assuming that the fractionation from transport across membranes is small, the observed Δ depends on the rate of CO2 diffusing out of the cell relative to the rate of DIC entering the cell (Fig. 1), which is analogous to the way Δ is modeled for C4 plants (Farquhar 1983). High relative rates of CO2 loss from the cell increase the ability of Rubisco to discriminate against the heavier isotopologue, generating a high observed Δ value, suggesting a leaky or even inactive CCM. Sharkey and Berry (1985) demonstrated the effectiveness of this approach by growing Chlamydomonas reinhardtii in an air bubbled vessel supplied with either 3300 or 200 ppm CO2. They found that Δ was high when cells were grown at high CO2 and then decreased within hours after switching to low CO2 (Fig. 2). They were also able to disrupt the CCM with the carbonic anhydrase inhibitor, Diamox, which increased Δ in both low and high CO2 (Fig. 2). Like other ways of assessing CCM function, their approach using isotope ratio mass spectrometry is labor intensive and time consuming. However, recent advances in stable isotope gas exchange make the collection and analysis of these data fast and simple (Flexas et al. 2006; Barbour et al. 2007).
Fig. 1.
Simple CCM leakiness model described as three primary fluxes (F1 to F3) and their isotopic fractionations (b, d). DIC derived from CO2 or HCO3− supplied to the culture enters the cell, chloroplast and ultimately diffuses into the pyrenoid (F1). The dissolution and hydration processes cause a fractionation (d) at equilibrium that enriches the 13C content of HCO3− with respect to the CO2 in air by −7.9 ‰ (negative discrimination) at 25 °C (Mook et al. 1974). Inside the pyrenoid, carbonic anhydrase maintains equilibrium between CO2 and HCO3− while Rubisco assimilates CO2 (F2). Rubisco discrimination (b) depletes the 13C content of the assimilated CO2 by up to 29 ‰ (McNevin et al. 2007). Depletion by Rubisco is only observable if some of the CO2 diffuses away and ultimately leaks out of the cell (F3). The ratio F3/F1 is a leakiness factor by the equation Δ = d + b(F3/F1). Redrawn and modified from Sharkey and Berry (1985)
Fig. 2.
Changes in net carbon assimilation and Δ of C. reinhardtii grown at high CO2 (3,300 ppm) and during acclimation to aeration with low CO2 (200 ppm) from 12:00 to 18:00 h followed by a return to high CO2. At about 16:00 h, the carbonic anhydrase inhibitor Diamox was added in order to disrupt CCM function without impairing Rubisco. Redrawn and modified from Sharkey and Berry (1985)
Among promising species for biofuel production, very little is known about CCM activity even though the activation of a CCM affects the efficiency of both DIC and light utilization (Sültemeyer et al. 1993; Li and Canvin 1998; Kaplan and Reinhold 1999). Substantial effort has been devoted to characterizing the efficiency of light use (Blankenship et al. 2011; Ort and Melis 2011) along with the supply of DIC and other nutrients in order to understand the feasibility of biofuel production systems (Williams and Laurens 2010; Pate et al. 2011). However, the impact of activating a CCM on biofuel production (lower light use efficiency but potentially higher DIC use efficiency) has not been fully explored. Several species of Nannochloropsis are among algae identified as having promising traits for large-scale biofuel production (Sukenik et al. 2009). In this work, we examine the effect of CO2 supply on both CCM function and lipid production by growing in cultures bubbled with high or low concentrations of CO2 for about a week under a each concentration prior to switching cultures rapidly between conditions and following short-term changes over 2 days. Prior to our work here, it was unknown if N. salina 1776 has a CCM, though Nannochloropsis gaditana and Nannochloropsis occulata along with unidentified species of Nannochloropsis have been shown to express a CCM (Munoz and Merrett 1989; Merrett et al. 1996; Sukenik et al. 1997; Huertas et al. 2002a, 2002b). Experiments conducted with Chlamydomonas reinhardtii have shown that providing CO2 around 5000 ppm down-regulates CCM expression whereas providing CO2 at or below 500 ppm up-regulates CCM expression (Vance and Spalding 2005). Therefore, by switching cultures between CO2 supplied in air at ~4,900 ppm (high CO2) and ~440 ppm (low CO2) and monitoring a time-course of their acclimation to each condition, we should be able to determine if there is a functioning CCM as well as determine the relationship between CCM function and lipid production.
Methods
Algal growth and sampling
Chlamydomonas reinhardtii was grown in custom-built 500 mL polycarbonate airlift photosynthetic bioreactors (PBR) using minimal media (Sueoka 1960). Nannochloropsis salina strain 1776 was grown in the same style PBRs as C. reinhardtii but using F/2 media adjusted to pH 7.6. Both algae were cultured for about a week at a time using continuous addition of media to keep cells in log phase growth while they were bubbled with air containing 150–7,560 ppm CO2 (one concentration at a time). N. salina was grown in an additional experiment to examine the acclimation of cells to a switch in the CO2 concentration. For this experiment, media was continuously added via a peristaltic pump at a flow rate of approximately 300 mL day−1 for cultures grown at high CO2 and 150 mL day−1 for cultures grown at low CO2 in order to maintain similar cell densities in mid-log phase growth during the experiment. Cultures were continuously bubbled at a flow rate of approximately 100 mL min−1 with either 4,869 ppm (high) or 441 ppm (low) CO2 in air and provided all mixing for the cultures. Due to the consumption of CO2 by the cells, we used the average between the CO2 concentration of the air entering and exiting the cultures as the value they experienced (Vance and Spalding 2005), which averaged 4,460 ± 257 ppm when cells were at high CO2 and 329 ± 14 ppm at low CO2. Fluorescent lights were kept on continuously and provided approximately 145 μmol photons m−2 s−1. Culture temperature was 25 °C. pH was monitored daily while cultures were grown for seed stock and then at each time point during the experiment.
Initially, two seed cultures were grown for 3–5 days in two photobioreactors, one at each CO2 level. Three days prior to the experiment, 150 mL was taken from each seed reactor and split equally to start three identical photobioreactors for each condition. Cultures started at low CO2 were switched to high CO2 in order to suppress CCM function and cultures at high CO2 were switched to low CO2 to induce CCM function. Six cultures (3 for each treatment) were sampled at four time points: 0, 4, 24, and 48 h after switching the concentration of CO2 supplied to the culture to monitor the rate of adjustment to each condition. All sampling began about 60 min prior to each time point so that sample collection was complete by the designated time. At each time point, ~25 mL of culture was removed through a valved port at the base of the photobioreactor, and the pH was measured. 5 mL of sample was placed into a glass tube for measurements of variable chlorophyll fluorescence, 1 mL was pelleted and frozen in liquid nitrogen for chlorophyll extraction, 1 mL was used to determine the rate of photosynthesis via net oxygen exchange, and 5 mL was used for flow cytometry and hyperspectral imaging. Air entering and exiting the culture was also collected in 5 L Tedlar gas sampling bags (Sigma-Aldrich Co., USA) for later determination of photosynthesis via net CO2 exchange and photosynthetic discrimination described below.
Flow cytometry
100 μL aliquots were removed for cell counting and analysis on a flow cytometer (BD Accuri C6, BD Biosciences, USA). Three dilutions ranging from 1:20 to 1:100 (sample:culture media) were analyzed using the Accuri flow—“slow fluidics” setting until 20,000 events above background were collected.
Chlorophyll extraction
Frozen pellets from 1 mL of culture were resuspended in cold methanol via vortexing. This freeze–thaw step was essential for complete extraction (data not shown). Cell debris was pelleted via centrifugation, and the supernatant was assayed spectrophotometrically for chlorophyll a content (Porra et al. 1989).
Variable chlorophyll fluorescence
Pulse-amplitude modulated variable chlorophyll fluorescence (Mini-PAM, WALZ Inc., Germany) was measured at each time point to assess the efficiency of linear electron transport originating from PSII (Genty et al. 1989). Samples were measured in the light to measure the effective quantum yield (Fv’/Fm’) and after 20 min of dark adaptation to measure the optimal quantum yield (Fv/Fm).
Net oxygen exchange
An oxygen electrode (Hansatech Inc., UK) was maintained at culture temperature (25 °C), illuminated 145 μmol photons m−2 s−1 with a fluorescent bulb, and calibrated daily with water sparged with air (20.9 % O2) or nitrogen. Rates of net photosynthetic oxygen production were determined from the slope of the increasing O2 concentration immediately after transferring a 1-mL aliquot from the photobioreactor to the electrode cuvette. Rates were expressed on both a per cell and per mg chlorophyll a basis.
Net CO2 exchange and photosynthetic discrimination
For week-long growth experiments at single CO2 concentrations, gasses entering and exiting the airlift bioreactors were directly subsampled and analyzed for 12CO2 and 13CO2 concentrations using a tunable diode laser (TDL) absorbance spectrometer (TGA-100, Campbell Scientific, US). For the CO2 acclimation study, gasses entering and exiting each photobioreactor were collected in 5-L Tedlar bags at each time point. Each bag was connected to a TDL inlet and sampled at a rate of 100 mL min−1 until a steady signal was achieved (usually1–2 min). The TDL uses a Nafion counter-flow system to dry all samples to a constant water content and two CO2 standards were sampled every 10 min for calibration. The isotopic composition and concentration of CO2 in the bag samples were calculated using an R package (Erhardt, E.B. and D.T. Hanson 2013. tdllicor: TDL/Licor processing. R package version 0.1–22.). In this package, the periodic measurements of the calibration gasses (high and low) were interpolated using a cubic smoothing spline to account for slow drifts throughout the measurement period; the sample concentrations were calibrated using a gain and offset determined from the mean interpolated tank values (McCue et al. 2013). Since the difference in total CO2 concentration between air entering and exiting the cultures was large, we created and applied a small correction for TDL non-linearity in isotopic composition based on measurements of a standard CO2 tank mixed with CO2-free air across a range of CO2 concentrations (data not shown). Net photosynthetic CO2 assimilation was then determined from the difference in total CO2 concentration between air entering and exiting the photobioreactor after correcting for flow rate. Rates were determine on both a per cell and a per chlorophyll a basis. Photosynthetic discrimination (Δ) was determined from the change in the isotopic composition (δ13C) of air entering and exiting the photobioreactor relative to the rate of net photosynthetic CO2 assimilation (Sharkey and Berry 1985; Evans et al. 1986; Barbour et al. 2007). Both Δ and d13C are expressed in units of per mil (‰) representing the ratio of 13C to 12C relative to an international standard.
Hyperspectral confocal fluorescence microscopy and multivariate analysis
We used an imaging-based analysis of lipid content on live, unstained cells to avoid the need to harvest large amounts of culture and the potential for artifacts from staining. In addition, the imaging allows a visual inspection of cell condition (i.e., chloroplast morphology) and population variability. Relative lipid content per cell and relative content normalized to chlorophyll content were determined using hyperspectral confocal fluorescence microscopy (HCFM) and multivariate curve resolution (MCR) techniques previously developed by our group (Sinclair et al. 2006; Collins et al. 2011, 2012; Jones et al. 2012; Davis et al. 2013). We followed the approach of Davis et al. 2013 to analyze live cells each time the cultures were sampled. In brief, hyperspectral images of unlabeled algal cells were obtained using a hyperspectral microscope (Sinclair et al. 2006) with a BG-38 filter in the emission path to lower the chlorophyll signal relative to the weaker carotenoid signal. Images were preprocessed for MCR (Jones et al. 2012) and spatially binned 4x to enhance processing speed. A seven component MCR model was developed to describe the image data. Four components from the model were used for subsequent analysis. These signals were assigned to a lipid body-associated carotenoid, chlorophyll a, a chloroplast associated carotenoid, and an additional carotenoid not associated with the chloroplast or lipid bodies. The other components in the MCR model (not shown) were typical for image data of this type and arise from an instrument offset, a correlated noise component, and both a shift and a broadening on the chlorophyll a peak which could be indicative of chlorophyll a in different microenvironments. A classical least squares (CLS) prediction was performed on the full spatial resolution images using the MCR-generated spectral components to arrive at independent concentration maps that represent the relative abundance of each of the component. Quantification of relative abundance of each component on a per cell basis was accomplished using a custom cell segmentation algorithm (Collins et al. 2011). In addition to their independent analyses, the lipid associated carotenoid component was also quantified as a ratio relative to the chlorophyll a component on a per cell basis.
Statistical analyses
All statistical analyses were performed using Prism 6 for Mac OS X (GraphPad Software Inc., US). All error bars shown are standard errors of the mean and n-values are reported for each. Unless otherwise specified in the text, all analyses between two conditions were conducted as unpaired single-tailed t tests where standard deviations were not assumed to equal using Welch’s correction and p values are reported.
Results
Photosynthetic discrimination
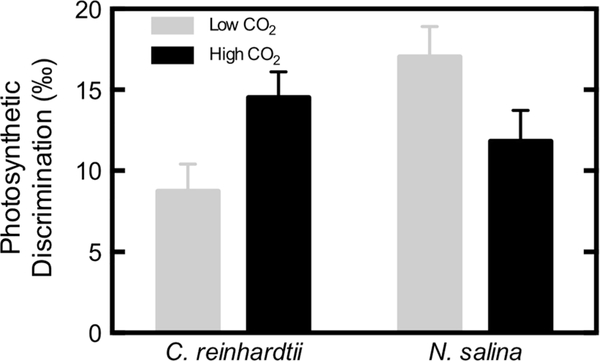
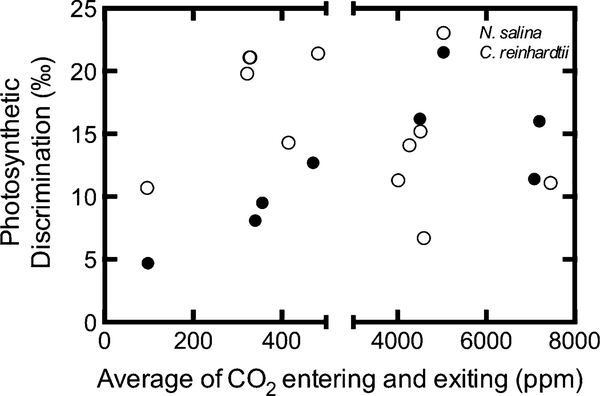
When pooled by low CO2 treatments anticipated to stimulate CCM activity (<500 ppm) and high CO2 treatments anticipated to suppress CCM activity (>4,000 ppm) across all experiments, photosynthetic discrimination (Δ) was affected differently by the CO2 treatment for each species (Fig. 3). C. reinhardtii Δ at low CO2 8.8 ± 1.6 ‰ was significantly lower than at high CO2 14.5 ± 1.6 ‰ (p = 0.026). N. salina Δ at low CO2 17.0 ± 1.9 ‰ was significantly higher than at high CO2 11.8 ± 1.9 ‰ (p = 0.043). At low CO2, N. salina Δ was significantly higher than C. reinhardtii Δ (p = 0.024), but at high CO2 they were not significantly different (p = 0.270). When plotted for each culture individually, it appears that Δ increases with CO2 when below 400 ppm for both C. reinhardtii and N. salina with N. salina Δ being nearly twice that of C. reinhardtii for most CO2 concentrations (Fig. 4). However, above 4,000 ppm Δ is essentially constant and similar for both species (Fig. 4).
Fig. 3.
Average Δ for cultures bubbled with low or high CO2 during growth. Error bars represent the SE of the mean, n = 4 for low CO2 C. reinhardtii, n = 3 for high CO2 C. reinhardtii, n = 7 for low CO2 N. salina and n = 4 for high CO2 N. salina
Fig. 4.
Effect of CO2 concentration on observed Δ in C. reinhardtii and N. salina. Variation in cell density and photosynthetic rate caused the total CO2 concentration exiting the bioreactor to vary widely between treatments supplied with the same CO2 concentration. Therefore, we followed the convention of Vance and Spalding (2005) and used the average of the CO2 concentrations entering and exiting the photobioreactor as a measure of the CO2 concentration experienced by the cells. Each point represents the Δ measured from a single culture
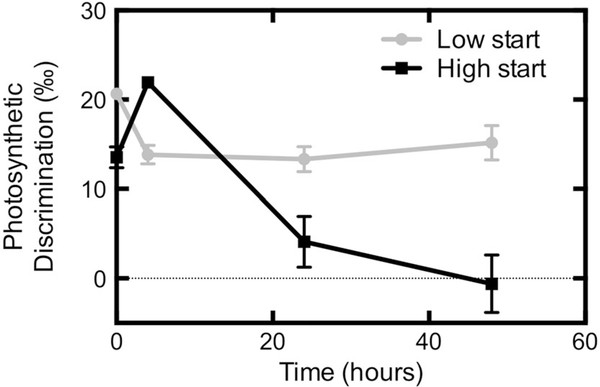
When testing the short-term acclimation of N. salina Δ to high and low CO2, we found a dynamic response. The initial Δ of low CO2 grown cells at time zero was 20.7 ± 0.4 ‰, significantly higher than Δ of high CO2 grown cells 13.5 ± 1.2 ‰ (p = 0.008, Fig. 5). Within 4 h after switching the CO2 concentration supplied to each culture, the values for Δ flipped (low CO2 13.8 ± 1.3 ‰ and high CO2 21.9 ± 0.5 ‰, p = 0.003) to match the new conditions. This mirrors the patterns of longer grown cultures (Figs. 3, 4). In addition, cell-free media equilibrated isotopically (i.e., no difference in isotopic composition between CO2 entering and exiting the reactor) to new CO2 conditions within 3 h of changing the concentration (data not shown). Discrimination for cultures that started at low CO2 and moved to high then remained fairly constant (15.2 ± 3.3 ‰ after 48 h). However, Δ for the culture that started at high CO2 and switched to low CO2 continually dropped between 4 and 48 h, ending at −0.6 ± 5.6 ‰.
Fig. 5.
Short-term acclimation of Δ to CO2 in N. salina. Cells were initially grown in for 6–8 days at either high or low CO2. Cells cultured in high CO2 had higher flow rates of media supplied relative to those in low CO2 to account for their higher growth rate such that cell density would remain constant across the CO2 switch. Immediately after measurement at T = 0, the CO2 concentration and media flow rates were switched in parallel. Error bars represent the SE of the mean, n = 3
Cell density and growth rates
Cell density of N. salina 1776 cultures was consistent for each reactor across the CO2 switch during the 48-h experiment as determined by the maintenance of a relatively constant cell density for both high CO2 and low CO2 starting treatments, p = 0.41 and p = 0.76, respectively, from a repeated measures ANOVA (Fig. 6). However, since the flow rate of media through the cultures was about twice as high under high CO2 than low CO2, the growth rate under high CO2 conditions must have also been about twice that of low CO2 conditions. The apparent differences in cell density between conditions at time 0 h were not significant (p = 0.10) but variability among cultures was primarily due to different densities of the seed cultures grown at each CO2. Small errors in the estimation of the media flow rate needed to keep both sets of cultures at the same density may have also contributed.
Fig. 6.
Cell density during the short-term acclimation experiment with N. salina. Flow rates of liquid media were switched simultaneously with changing the concentration of CO2 supplied such that cultures receiving high CO2 always had about twice the flow rate (and twice the growth rate) as cultures receiving low CO2 in order to maintain constant cell densities. Starting cell densities for the high CO2 cultures were a little higher than for the low CO2 culture, but densities did not change after the CO2 switched. Error bars represent the SE of the mean, n = 3
Photosynthetic response
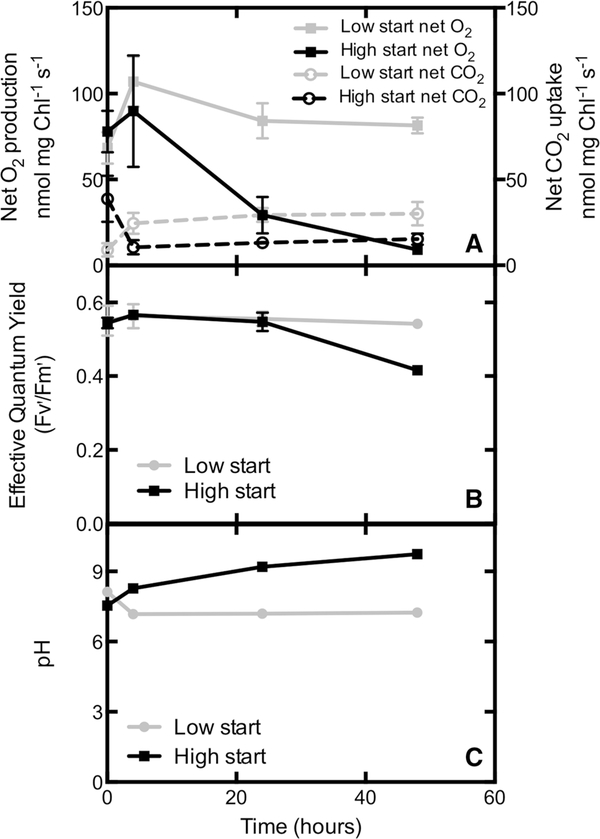
Measures of photosynthetic function also showed different responses to changes in CO2 supply. Net photosynthetic O2 production (Fig. 7a) initially increased for the treatment where cells started low and moved to high CO2, (p = 0.016, paired t test) but not for the opposite treatment. Cultures that moved into high CO2 (low start) then dropped back to the initial rates and leveled out. However, cultures moving from high to low CO2 (high start) declined after 4 h. Net photosynthetic CO2 uptake significantly increased between 0 and 4 h in cultures switched from low to high CO2 (similar to net O2 production, p = 0.017 paired t test), but then leveled out at the higher rates (Fig. 7a). In contrast, net photosynthetic CO2 uptake marginally decreased between 0 and 4 h in cultures switched from high to low CO2 (similar to net O2 production, p = 0.056), and then leveled out at the lower rates rather than declining like net O2 production. The effective photosystem II (PSII) yield in the light was fairly constant though declines for the high start cultures occurred between 24 and 48 h (Fig. 7b). The optimal quantum efficiency measured as Fv/Fm in dark adapted samples decreased consistently with time after 4 h in cultures switched from high to low CO2 (data not shown). Changes in PSII yield and O2 production correlated inversely with pH (Fig. 7c). The initial pH for both conditions was similar, 8.1 ± 0.1 for low CO2 and 7.5 ± 0.1 for high CO2. The pH dropped to 7.2 ± 0.1 within 4 h in cultures that were switched from low to high CO2 and remained constant for the duration of the experiment. However, the pH of cultures that were switched from high to low CO2 continually increased throughout the experiment, reaching 9.7 ± 0.04 when the experiment was terminated after 48 h.
Fig. 7.
Time course of photosynthesis and pH in N. salina. a Net photosynthetic O2 production and net CO2 uptake. b Effective quantum yield measured via variable chlorophyll fluorescence in the light. c pH shown here to highlight that the decrease in discrimination after 4 h of exposure to low CO2 was correlated with an increasing pH in cultures that were stable at high CO2 prior to switching. Error bars represent the SE of the mean, n = 3
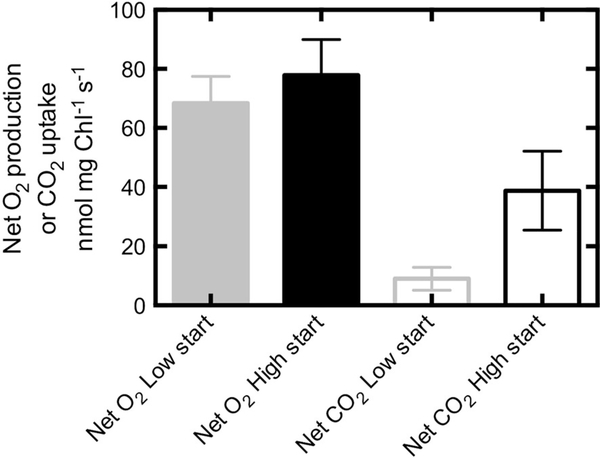
Net photosynthetic O2 production was not significantly different between the high and low CO2 starting conditions when expressed on a per chlorophyll basis (p = 0.28, Fig. 8) and on a per cell basis (data not shown). However, the net CO2 exchange was four times lower (p = 0.05) for cells grown at low CO2 than those grown at high CO2 (Fig. 8).
Fig. 8.
Initial net photosynthetic O2 production and net CO2 uptake for N. salina grown at high (4,460 ppm) and low (329 ppm) CO2. The growth CO2 concentrations are the averages of the concentration entering and exiting the reactor over the duration of the experiment. Error bars represent the SE of the mean, n = 3
Lipid production response
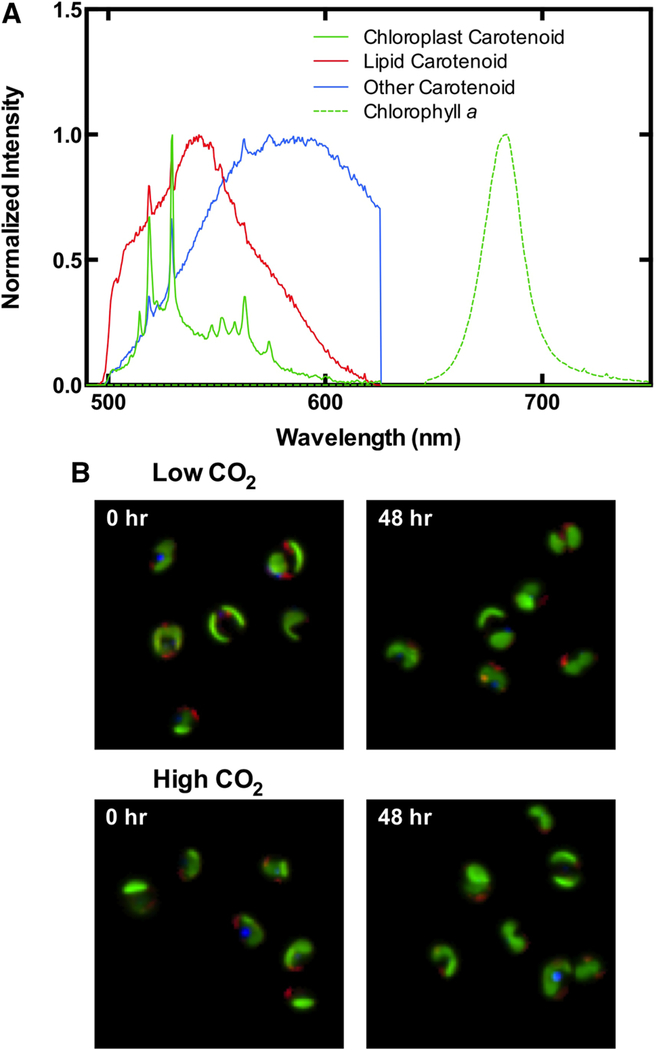
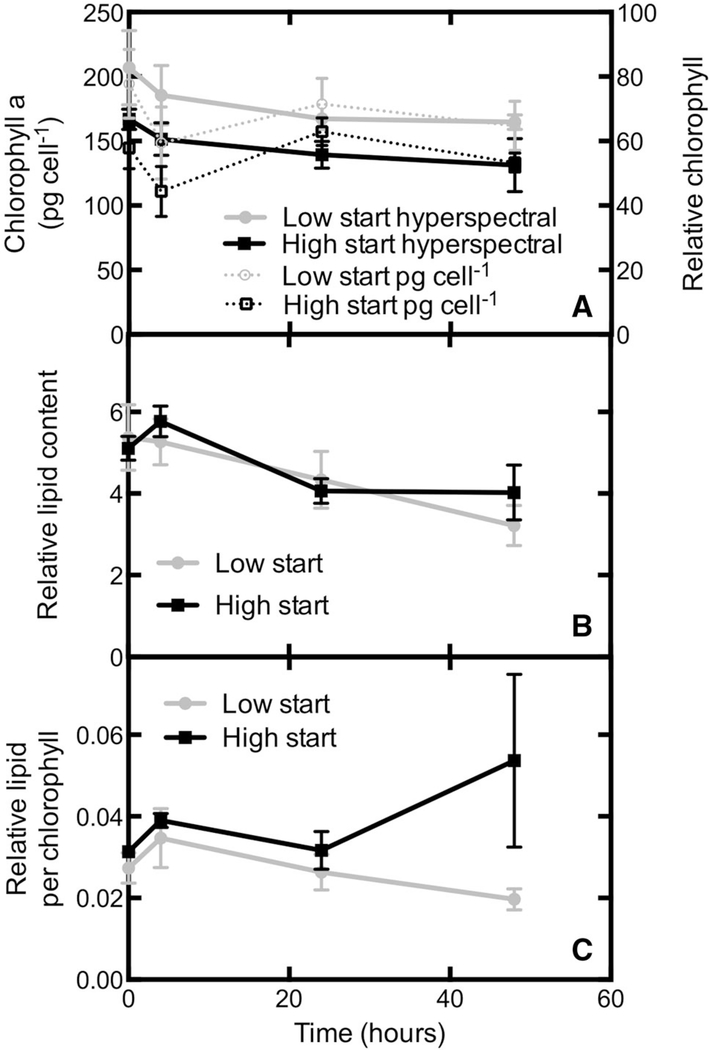
HCFM is advantageous in its ability to quantify lipid and chlorophyll within a cell without the use of exogenous staining (Davis et al. 2013). Our MCR analyses identified a lipid body-associated carotenoid and chlorophyll a, along with a chloroplast associated carotenoid signal overlapping spatially with chlorophyll a, and a non-plastid, non-lipid carotenoid (Fig. 9). Changes in the chlorophyll a signal per cell were consistent with changes in the bulk culture chlorophyll a content determined from methanol extractions (Fig. 10a). The relative lipid signature per cell consistently dropped with time in both conditions (Fig. 10b). However, when lipid content was expressed per chlorophyll a, the pattern changed slightly. In this case, both treatments appeared to increase between 0 and 4 h (Fig. 10c) though the increase only reaches significance at the 5 % level in the high to low CO2 transition treatment. In both cases, lipid content returns to starting levels with 24 h. It should be noted that the lipid changes were modest making them difficult to detect without the analytical and statistical power provided by the MCR analyses.
Fig. 9.
Multivariate curve resolution derived model of hyperspectral imaging data of N. salina. This analysis identified four major components from unstained cultures and could separate out lipid droplets and chloroplast (a), Representative images of cells at times 0 and 48 (b) hours are falsely colored to visualize the spatial extent of each component. Colors in b correspond to the coloring of components in a
Fig. 10.
Lipid analyses as determined from hyperspectral image analysis of N. salina. a Comparison of the bulk extracted chlorophyll assay with the relative chlorophyll content determent from hyperspectral imaging. b Relative lipid content as determined from hyperspectral imaging analyses. c Ratio of lipid content to chlorophyll content per cell determined from hyperspectral imaging and multivariate curve resolution analyses. Error bars represent the SE of the mean, n = 3
Discussion
In order to examine the interactions between CO2 availability, photosynthetic carbon metabolism, and lipid production, we used a continuous culturing approach to maintain similar cell densities (by varying the rate of media addition) while supplying CO2 at two concentrations in a constant airflow that also mixed the cultures. This was necessary to avoid complications of varying light penetration into the culture and the poorly understood effects of cell culture density on cellular metabolism (DeLong and Hanson 2009a, b).
In order to characterize photosynthetic carbon metabolism, we started by measuring the preferential use of 12CO2 over 13CO2 during photosynthesis by C. reinhardtii and N. salina as a method for detecting CCM function that is indirect but recognized as very good (Raven and Beardall 2003). There is still some uncertainty in the simple model put forth by Sharkey and Berry (1985) that uses online photosynthetic discrimination (Δ) as a measure of CCM leakiness (Fig. 1). Their use of a carbonic anhydrase inhibitor showed that variation in Δ can be influenced heavily by that component of a CCM (Fig. 2). However, the effect of an impaired DIC transporter on Δ remains to be demonstrated. Our method is a novel update to the Sharkey and Berry (1985) approach, in that it can make Δ measurements in real-time (10 Hz), avoiding the need to capture, dehydrate, and then isotopically analyze CO2 isotopic composition at static points. The data presented here include both online sampling of airstreams and a slight modification where samples were collected in bags prior to analysis when the isotope analyzer and cultures were located in different laboratories. The only effect of the bag collection was to limit our sampling to fewer time points.
While we confirmed the Δ response of C. reinhardtii shown by Sharkey and Berry (1985), where cells had lower Δ (low leakiness) at low CO2, we found the opposite pattern for Δ by N. salina (Fig. 3). Normally, a CCM reduces leakiness of a cell and decreases Δ. However, Nannochloropsis gaditana, N. occulata and other eustigmatophytes have an “HCO3−-pump/CO2-leak” style CCM (Huertas et al. 2002a, 2002b). This style CCM is activated when ambient inorganic carbon is low and it is thought to pump large amounts of HCO3− into the cell from the surrounding media, but then also leaks much of it back out in the form of CO2 before it can be captured by Rubisco. If a higher proportion leaks out with the pumping it would increase the flux ratio of F3/F1 (Fig. 1), thereby increasing leakiness. In fact, the activity of this CCM can be so great that an apparent net CO2 loss at the culture level has been reported, i.e., F3/F1[1 (Sukenik et al. 1997; Huertas et al. 2002b). In contrast to the general expectation that extra photosynthetic electron transport provides the extra energy needed pumping DIC across membranes (Sültemeyer et al. 1993; Li and Canvin 1998; Kaplan and Reinhold 1999), the ATP for this nearly futile pump is at least partially supplied through mitochondrial respiration in N. gaditana (Huertas et al. 2002a).
Interestingly, our data also show that Δ by N. salina is higher than C. reinhardtii when DIC supplied through CO2 aeration is low but not when DIC is high (Fig. 4). This suggests that when both organisms down-regulate their CCMs under high DIC, they have a similar amount of leakiness. Perhaps more intriguing is that leakiness consistently declines as CO2 supply drops from 400 to 100 ppm, though the trend is much more convincing for C. reinhardtii than for N. salina (Fig. 4). Vance and Spalding (2005) have shown that very low CO2 induces a higher affinity for DIC in C. reinhardtii and that is consistent with our data. We are unaware of any similar supplemental CCM activity at very low CO2 being reported for N. salina, though N. gaditana has been shown to grow at very low CO2 (Huertas et al. 2000). Furthermore, even the lowest amount of leakiness we measured for N. salina was still twice the leakiness of C. reinhardtii under the same conditions (Fig. 4). If N. salina is like other species of Nannochloropsis, this high leakiness could be related to the reliance on HCO3− pumps (Munoz and Merrett 1989; Merrett et al. 1996; Sukenik et al. 1997) while C. reinhardtii can pump both HCO3− and CO2 (Spalding 2008) which could recover some of the losses before they escape the culture.
Based on the changes in Δ during our short-term experiment, the acclimation of N. salina to a new DIC occurs within a few hours (Fig. 5). However, Δ in the cultures that started in high CO2 growth conditions began to decrease after 4 h of exposure to low CO2. Cell density did not decline significantly during the experiment (Fig. 6), however, photosynthetic O2 production did while pH increased for the cells starting in high CO2 and moving to low CO2 (Fig. 7). Presumably, given a few more days these cultures would have recovered to the low CO2 starting conditions since the prior analyses at low CO2 were performed on cultures that had been growing for about a week. The slower growth and increase in culture pH has also seen by Huertas et al. (2000) for N. gaditana when bubbled with very low CO2 (1 ppm CO2 and no DIC added). Since N. gaditana uses HCO3− rather than CO2 (Munoz and Merrett 1989; Merrett et al. 1996; Sukenik et al. 1997), Huertas et al. (2000) hypothesized that the cells were actively increasing the media alkalinity as a way to favor the accumulation of HCO3−. Since then, Rubisco from an unspecified species of Nannochloropsis has been shown to have a high affinity for CO2, possibly aiding its growth at very low CO2 via simple diffusion (Tchernov et al. 2008). These enzyme kinetic analyses also show a slow catalytic rate and a very low specificity for CO2 over O2 (Tchernov et al. 2008). So, growth would be slow at low CO2 and Rubisco oxygenase activity would be very high, both of which are consistent with our data.
Even though photosynthesis in N. salina expressed in terms of O2 production did not vary with respect to the supply of CO2 at the start of the experiment, simultaneous measures of CO2 exchange show that the net CO2 uptake was four-fold lower in low CO2 growth conditions (Figs. 7, 8) despite growth rate only being about half that in high CO2. The lower CO2 uptake is consistent with the concept of the “HCO3−-pump/CO2-leak” style CCM (Huertas et al. 2002a, 2002b) activating at low CO2 since the increased efflux of CO2 would reduce net CO2 uptake more than net CO2 assimilation. However, the increase in growth (maintaining cell density despite doubling of media flow rate, Fig. 6) at high CO2 contrasts with the results of Huertas et al. 2000 using N. gaditana; they determined that bubbling with elevated CO2 did not improve growth. Furthermore, net O2 production is much higher than net CO2 uptake irrespective of the DIC levels in the media. When O2 and CO2 are the only terminal electron acceptors for whole-chain electron transport, net O2 production will equal net CO2 uptake (Badger 1985). If net O2 production exceeds net CO2 uptake, then more electrons are being generated through whole-chain transport than can be accounted for by O2 and CO2 uptake. Our data suggests that there is much greater linear electron transport occurring than is needed for CO2 assimilation and this is potentially a source of energy for the CCM. However, net O2 production is not different between the low and high CO2, so either the excess electron transport is used for something other than a CCM, like nitrate assimilation (Huppe and Turpin 1994), or there is a constitutive basal CCM activity being supported and only a bicarbonate pump is turned on at low CO2. This would be analogous to the induction of a putative bicarbonate transporter at very low CO2 observed in C. reinhardtii (Vance and Spalding 2005). The additional ATP presumably needed for running the pump could then be provided by either cyclic electron transport around PSI or by respiratory electron transport in the mitochondria like N. gaditana (Huertas et al. 2002a).
These large changes in carbon metabolism did not cause any significant changes in the relative lipid content per cell or on the ratio between lipid content and chlorophyll content in our cell imaging analyses (Fig. 10). We do not believe this is a methodological anomaly as lipid droplets were readily visible in all samples using hyperspectral confocal fluorescence microscopy (Fig. 9) and the method has been validated independently (Davis et al. 2013). In addition, the hyperspectral chlorophyll analyses were consistent with traditional methods for extracting chlorophyll from bulk samples and measuring content spectrophotometrically (Fig. 10). Our results are not inconsistent with a study on N. occulata where cultures were bubbled with air or a range of very high CO2 concentrations (2–15 %) and assayed for productivity (Chiu et al. 2009). The major findings were that 2 % CO2 produced much more biomass than air or the other CO2 concentrations, and our data also show an increase in growth between our conditions of ~0.04 % and 0.45 % CO2. However, it is not clear from their data or ours if the maximum biomass production rate would differ between 0.45 and 2 % CO2. However, Chiu et al. (2009) also found that lipid production was highest in both air and 2 % CO2, possibly much higher in air but highly dependent on the growth phase (they did not include air in their semi-continuous culture experiment where CO2 was manipulated). Our experiment controlled for growth phase by maintaining similar cell densities, however, more lipid production would have been likely if we had denser cultures near or in stationary phase. In addition, our light intensities were about half that of Chiu et al. 2009, though well within a range where dynamic lipid production has been measured in N. salina (Van Wagenen et al. 2012).
Having larger changes in net CO2 assimilation and CO2 supply than in growth rate and lipid content suggests that the two conditions differ in the efficiency of carbon capture. Given our experimental design, we can calculate an instantaneous efficiency of carbon capture since we know the rate of CO2 supplied to cells in both low CO2 (~440 ppm supplied at 100 mL min−1 = 18.9 nmol s−1) and high CO2 (~4,900 ppm supplied at 100 mL min−1 = 232 nmol s−1) conditions, and since we measured the net CO2 exchange (differences in the rate of media addition were not included since they are so small for instantaneous rate calculations, ~2 μL s−1 of a 0.5 L culture). The low CO2 assimilation rate was ~9 nmol mg chl−1 s−1, so cells growing in low CO2 had in instantaneous capture efficiency of ~0.48 mg chl−1 (9/18.9) whereas under high CO2 it was ~0.17 mg chl−1. Therefore, growth under low CO2 is over 2.8 times as efficient in terms of instantaneous CO2 utilization. However, the rate of media addition for the high CO2 cultures was about twice the low CO2 cultures so the associated increase in the total number photosynthetic cells over time would reduce difference in efficiency of total carbon capture to about 1.4 fold.
Conclusions
Interactions between CO2 supply and CCM function were evident and the effect on lipid production was minimal in our experiment. Our online stable isotope gas exchange screen provides the first data that low CO2 induces a leaky CCM in N. salina that would be similar to the CCMs characterized in other species of Nannochloropsis. Since CCMs in other Nannochloropsis species utilize HCO3− and not CO2, it is likely that our data show the isotopic signature of a HCO3− pump. In addition, the per cell lipid content is very similar whether cells are grown with high or low CO2. Under our conditions it appears that bubbling with 440 ppm would be 40 % more efficient in terms of carbon capture than bubbling with 4,900 ppm. The higher efficiency at low CO2 is achieved because the algae have a biophysical CCM that elevates the CO2 inside the chloroplast above the surrounding environment, thereby replacing the need for higher CO2 to be supplied to the cells in a cultivation system.
Acknowledgments
The authors are grateful to Dr. Michael B. Sinclair for the use and maintenance of the hyperspectral confocal fluorescence microscope and Dr. Bryan D. Carson for the use of the flow cytometer. Majority support for this research was from the Laboratory Directed Research and Development Program at Sandia National Laboratories (JAT, AMC, HDTJ, JR and DTH). Sandia National Laboratories is a multi-program laboratory managed and operated by Sandia Corporation, a wholly owned subsidiary of Lockheed Martin Corporation, for the U.S. Department of Energy’s National Nuclear Security Administration under contract DE-AC04-94AL85000. This work was also partially supported by the National Science Foundation Award # IOS 0719118 (SLN, DTH) and the EPSCoR Program under Award # IIA-1301346 (New Mexico). Any opinions, findings, and conclusions or recommendations expressed in this material are those of the author(s) and do not necessarily reflect the views of the National Science Foundation. This manuscript has been authored by Sandia Corporation under Contract No. DE-AC04-94AL85000 with the U.S. Department of Energy. The United States Government retains and the publisher, by accepting the article for publication, acknowledges that the United States Government retains a non-exclusive, paid-up, irrevocable, world-wide license to publish or reproduce the published form of this manuscript, or allow others to do so, for United States Government purposes.
Contributor Information
David T. Hanson, Department of Biology, University of New Mexico, Albuquerque, NM, USA
Aaron M. Collins, Department of Bioenergy and Defense Technologies, Sandia National Laboratories, Albuquerque, NM, USA
Howland D. T. Jones, Department of Bioenergy and Defense Technologies, Sandia National Laboratories, Albuquerque, NM, USA
John Roesgen, Department of Biology, University of New Mexico, Albuquerque, NM, USA.
Samuel Lopez-Nieves, Department of Biology, University of New Mexico, Albuquerque, NM, USA.
Jerilyn A. Timlin, Department of Bioenergy and Defense Technologies, Sandia National Laboratories, Albuquerque, NM, USA
References
- Badger MR (1985) Photosynthetic oxygen exchange. Annu Rev Plant Physiol 36:27–53 [Google Scholar]
- Badger MR (2003) CO2 concentrating mechanisms in cyanobacteria: molecular components, their diversity and evolution. J Exp Bot 54:609–622 [DOI] [PubMed] [Google Scholar]
- Badger MR, Kaplan A, Berry JA (1980) The internal inorganic C pool of Chlamydomonas reinhardtii: evidence for a CO2 concentrating mechanism. Plant Physiol 66:407–413 [DOI] [PMC free article] [PubMed] [Google Scholar]
- Badger MR, Andrews TJ, Whitney SM, Ludwig M, Yellowlees DC, Leggat W, Price GD (1998) The diversity and coevolution of Rubisco, plastids, pyrenoids, and chloroplast-based CO2-concentrating mechanisms in algae. Can J Bot 76:1052–1071 [Google Scholar]
- Badger MR, Hanson DT, Price GD (2002) Evolution and diversity of CO2 concentrating mechanisms in cyanobacteria. Funct Plant Biol 29:161–173 [DOI] [PubMed] [Google Scholar]
- Barbour MM, McDowell NG, Tcherkez G, Bickford CP, Hanson DT (2007) A new measurement technique reveals rapid post-illumination changes in the carbon isotope composition of leaf-respired CO2. Plant Cell Environ 30:469–482 [DOI] [PubMed] [Google Scholar]
- Beardall J, Giordano M (2002) Ecological implications of microalgal and cyanobacterial CO2 concentrating mechanisms, and their regulation. Funct Plant Biol 29:335–347 [DOI] [PubMed] [Google Scholar]
- Beardall J, Roberts S, Raven J (2005) Regulation of inorganic carbon acquisition by phosphorus limitation in the green alga Chlorella emersonii. Can J Bot 83:859–864 [Google Scholar]
- Becker EW (1994) Microalgae: biotechnology and microbiology. Cambridge University Press, Cambridge [Google Scholar]
- Blankenship RE, Tiede DM, Barber J, Brudvig GW, Fleming G, Ghirardi M, Gunner MR, Junge W, Kramer DM, Melis A, Moore TA, Moser CC, Nocera DG, Nozik AJ, Ort DR, Parson WW, Prince RC, Sayre RT (2011) Comparing photosynthetic and photovoltaic efficiencies and recognizing the potential for improvement. Science 332:805–809 [DOI] [PubMed] [Google Scholar]
- Brueggeman AJ, Gangadharaiah DS, Cserhati MF, Casero D, Weeks DP, Ladunga I (2012) Activation of the carbon concentrating mechanism by CO2 deprivation coincides with massive transcriptional restructuring in Chlamydomonas reinhardtii. Plant Cell 24:1860–1875 [DOI] [PMC free article] [PubMed] [Google Scholar]
- Chiu S-Y, Kao C-Y, Tsai M-T, Ong S-C, Chen C-H, Lin C-S (2009) Lipid accumulation and CO2 utilization of Nannochloropsis oculata in response to CO2 aeration. Bioresour Technol 100:833–838 [DOI] [PubMed] [Google Scholar]
- Collins AM, Jones HDT, Han D, Hu Q, Beechem TE, Timlin JA (2011) Carotenoid distribution in living cells of Haematococcus pluvialis (Chlorophyceae). PLoS ONE 6:e24302. [DOI] [PMC free article] [PubMed] [Google Scholar]
- Collins AM, Liberton M, Jones HDT, Garcia OF, Pakrasi HB, Timlin JA (2012) Photosynthetic pigment localization and thylakoid membrane morphology are altered in Synechocystis 6803 phycobilisome mutants. Plant Physiol 158:1600–1609 [DOI] [PMC free article] [PubMed] [Google Scholar]
- Da Rosa APC, Carvalho LF, Goldbeck L, Costa JAV (2011) Carbon dioxide fixation by microalgae cultivated in open bioreactors. Energy Convers Manag 52:3071–3073 [Google Scholar]
- Davis R, Jones H, Collins A, Ricken J, Sinclair M, Timlin J, Singh S (2013) Label-free measurement of aalgal triacylglyceride production using fluorescence hyperspectral imaging. Algal Res doi: 10.1016/j.algal.2013.11.010 [DOI] [Google Scholar]
- DeLong JP, Hanson DT (2009a) Metabolic rate links density to demography in Tetrahymena pyriformis. ISME J 3:1396–1401 [DOI] [PubMed] [Google Scholar]
- DeLong JP, Hanson DT (2009b) Density-dependent individual and population-level metabolic rates in a suite of single-celled eukaryotes. Open Biol J 2:32–37 [Google Scholar]
- Evans JR, Sharkey TD, Berry JA, Farquhar GD (1986) Carbon isotope discrimination measured concurrently with gas exchange to investigate CO2 diffusion in leaves of higher plants. Aust J Plant Physiol 13:281–292 [Google Scholar]
- Farquhar GD (1983) On the nature of carbon isotope discrimination in C4 species. Aust J Plant Physiol 10:205–226 [Google Scholar]
- Flexas J, Ribas-Carbó M, Hanson DT, Bota J, Otto B, Cifre J, McDowell N, Medrano H, Kaldenhoff R (2006) Tobacco aquaporin NtAQP1 is involved in mesophyll conductance to CO2 in vivo. Plant J 48:427–439 [DOI] [PubMed] [Google Scholar]
- Fukuzawa H, Miura K, Ishizaki K, Kucho K, Saito T, Kohinata T (2001) Ccm1, a regulatory gene controlling the induction of a carbon-concentrating mechanism in Chlamydomonas reinhardtii by sensing CO2 availability. Proc Natl Acad Sci USA 98:5347–5352 [DOI] [PMC free article] [PubMed] [Google Scholar]
- Genty B, Briantais JM, Baker NR (1989) The relationship between the quantum yield of photosynthetic electron transport and quenching of chlorophyll fluorescence. Biochim Biophys Acta 900:87–92 [Google Scholar]
- Graham LE, Graham JM, Wilcox LW (2009) Algae. Benjamin Cummings/Pearson, San Francisco [Google Scholar]
- Huertas E, Montero O, Lubia LM (2000) Effects of dissolved inorganic carbon availability on growth, nutrient uptake and chlorophyll fluorescence of two species of marine microalgae. Aquac Eng 22:181–197 [Google Scholar]
- Huertas IE, Colman B, Espie GS (2002a) Mitochondrial-driven bicarbonate transport supports photosynthesis in a marine microalga. Plant Physiol 130:284–291 [DOI] [PMC free article] [PubMed] [Google Scholar]
- Huertas IE, Colman B, Espie GS (2002b) Inorganic carbon acquisition and its energization in eustigmatophyte algae. Funct Plant Biol 29:271–277 [DOI] [PubMed] [Google Scholar]
- Huppe HC, Turpin DH (1994) Integration of carbon and nitrogen metabolism in plant and algal cells. Annu Rev Plant Physiol Plant Mol Biol 45:577–607 [Google Scholar]
- James SC, Boriah V (2010) Modeling algae growth in an openchannel raceway. J Comput Biol 17:895–906 [DOI] [PubMed] [Google Scholar]
- James SC, Janardhanam V, Hanson DT (2013) Simulating pH effects in an algal-growth hydrodynamics model. J Phycol 49:608–615 [DOI] [PubMed] [Google Scholar]
- Jones HDT, Haaland DM, Sinclair MB, Melgaard DK, Collins AM, Timlin JA (2012) Preprocessing strategies to improve MCR analyses of hyperspectral images. Chemom Intell Lab Syst 117:149–158 [Google Scholar]
- Kaplan A, Reinhold L (1999) CO2 concentrating mechanisms in photosynthetic microorganisms. Annu Rev Plant Physiol Plant Mol Biol 50:539–570 [DOI] [PubMed] [Google Scholar]
- Li Q, Canvin D (1998) Energy sources for and CO2 transport in air-grown cells of synechococcus UTEX 625. Plant Physiol 116:1125–1132 [DOI] [PMC free article] [PubMed] [Google Scholar]
- McCue MD, Amaya JA, Yang AS, Erhardt EB, Wolf BO, Hanson DT (2013) Targeted 13C enrichment of lipid and protein pools in the body reveals circadian changes in oxidative fuel mixture during prolonged fasting: a case study using Japanese quail. Comp. Biochem. Physiol. B 166(4):546–554 [DOI] [PubMed] [Google Scholar]
- McNevin DB, Badger MR, Whitney SM, von Caemmerer S, Tcherkez GGB, Farquhar GD (2007) Differences in carbon isotope discrimination of three variants of D-ribulose-1,5-bisphosphate carboxylase/oxygenase reflect differences in their catalytic mechanisms. J Biol Chem 282:36068–36076 [DOI] [PubMed] [Google Scholar]
- Merrett MJ, Nimer NA, Dong LF (1996) The utilization of bicarbonate ions by the marine microaiga Nannochloropsis oculata (Droop) Hibberd. Plant Cell Environ 19:478–484 [Google Scholar]
- Mook WG, Bommerson JC, Staverman WH (1974) Carbon isotope fractionation between dissolved bicarbonate and gaseous carbon dioxide. Earth Planet Sci Lett 22:169–176 [Google Scholar]
- Munoz J, Merrett MJ (1989) Inorganic-carbon transport in some marine eukaryotic microalgae. Planta 178:450–455 [DOI] [PubMed] [Google Scholar]
- National Research Council (2012) Sustainable development of algal biofuels in the United States. The National Academies Press, Washington [Google Scholar]
- Ort DR, Melis A (2011) Optimizing antenna size to maximize photosynthetic efficiency. Plant Physiol 155:79–85 [DOI] [PMC free article] [PubMed] [Google Scholar]
- Ota M, Kato Y, Watanabe H, Watanabe M, Sato Y, Smith RL, Inomata H (2009) Effect of inorganic carbon on photoautotrophic growth of microalga Chlorococcum littorale. Biotechnol Prog. 25(2):492–498 [DOI] [PubMed] [Google Scholar]
- Palmqvist K, Yu J, Badger MR (1994) Carbonic anhydrase activity and inorganic carbon fluxes in low- and high-Ci cells of Chlamydomonas reinhardtii and Scenedesmus obliquus. Physologia Plant 90:537–547 [Google Scholar]
- Pate R, Klise G, Wu B (2011) Resource demand implications for US algae biofuels production scale-up. Appl Energy 88:3377–3388 [Google Scholar]
- Porra RJ, Thompson WA, Kriedemann PE (1989) Determination of accurate extinction coefficients and simultaneous equations for assaying chlorophylls a and b extracted with four different solvents: verification of the concentration of chlorophyll standards by atomic absorption spectroscopy. Biochim Biophys Acta 975:384–394 [Google Scholar]
- Pragya N, Pandey KK, Sahoo PK (2013) A review on harvesting, oil extraction and biofuels production technologies from microalgae. Renew Sustain Energy Rev 24:159–171 [Google Scholar]
- Raven JA (2003) Inorganic carbon concentrating mechanisms in relation to the biology of algae. Photosynth Res 77:155–171 [DOI] [PubMed] [Google Scholar]
- Raven JA (2010) Inorganic carbon acquisition by eukaryotic algae: four current questions. Photosynth Res 106:123–134 [DOI] [PubMed] [Google Scholar]
- Raven JA, Beardall J (2003) Carbon acquisition mechanism of algae: carbon dioxide diffusion and carbon dioxide concentrating mechanisms. In: Larkum AWD, Douglas SE, Raven JA (eds) Photosynth algae. Springer, Dordrecht, pp 225–244 [Google Scholar]
- Raven JA, Ball LA, Beardall J, Giordano M, Maberly SC (2005) Algae lacking carbon-concentrating mechanisms. Can J Bot 83:879–890 [Google Scholar]
- Raven JA, Cockell CA, de La Rocha C (2008) The evolution of inorganic carbon concentrating mechanisms in photosynthesis. Proc R Soc Biol Sci Ser B 363:2641–2650 [DOI] [PMC free article] [PubMed] [Google Scholar]
- Reinfelder JR (2011) Carbon concentrating mechanisms in eukaryotic marine phytoplankton. Ann Rev Mar Sci 3:291–315 [DOI] [PubMed] [Google Scholar]
- Sharkey TD, Berry JA (1985) Carbon isotope fractionation of algae as influenced by an inducible CO2 concentrating mechanism. In: Berry JA, Lucas WJ (eds) Org. carbon uptake by Aquat. Photosynth. Org American Society of Plant Physiologists, Rockville, pp 389–401 [Google Scholar]
- Sinclair MB, Haaland DM, Timlin JA, Jones HDT (2006) Hyperspectral confocal microscope. Appl Opt 45:6283–6291 [DOI] [PubMed] [Google Scholar]
- Spalding MH (2008) Microalgal carbon-dioxide-concentrating mechanisms: Chlamydomonas inorganic carbon transporters. J Exp Bot 59:1463–1473 [DOI] [PubMed] [Google Scholar]
- Sueoka N (1960) Mitotic replication of deoxyribonucleic acid in Chlamydomonas reinhardtii. Proc Natl Acad Sci USA 46:565–569 [DOI] [PMC free article] [PubMed] [Google Scholar]
- Sukenik A, Tchernov D, Kaplan A, Huertas E, Lubian LM, Livne A (1997) Uptake, efflux, and photosynthetic utilization of inorganic carbon by the marine Eustigmatophyte Nannochloropsis sp. J Phycol 33:969–974 [Google Scholar]
- Sukenik A, Beardall J, Kromkamp J, Kopecký J, Masojídek J, van Bergeijk S, Gabai S, Shaham E, Yamshon A (2009) Photosynthetic performance of outdoor Nannochloropsis mass cultures under a wide range of environmental conditions. Aquat Microb Ecol 56:297–308 [Google Scholar]
- Sültemeyer D, Biehler K, Fock H (1993) Evidence for the contribution of pseudocyclic photophosphorylation to the energy requirement of the mechanism for concentrating inorganic carbon in Chlamydomonas. Planta 189:235–242 [Google Scholar]
- Tchernov D, Livne A, Kaplan A, Sukenik A (2008) The kinetic properties of ribulose-1,5-bisphosphate carboxylase/oxygenase may explain the high apparent photosynthetic affinity of Nannochloropsis sp. to ambient inorganic carbon. Isr J Plant Sci 56:37–44 [Google Scholar]
- Van Wagenen J, Miller TW, Hobbs S, Hook P, Crowe B, Huesemann M (2012) Effects of light and temperature on fatty acid production in Nannochloropsis salina. Energies 5:731–740 [Google Scholar]
- Vance P, Spalding MH (2005) Growth, photosynthesis, and gene expression in Chlamydomonas over a range of CO2 concentrations and CO2/O2 ratios : CO2 regulates multiple acclimation states. Can J Bot 809:796–809 [Google Scholar]
- Williams PJLB Laurens LML (2010) Microalgae as biodiesel & biomass feedstocks: Review & analysis of the biochemistry, energetics & economics. Energy Environ Sci 3:554–590 [Google Scholar]
- Yamano T, Miura K, Fukuzawa H (2008) Expression analysis of genes associated with the induction of the carbon-concentrating mechanism in Chlamydomonas reinhardtii. Plant Physiol 147:340–354 [DOI] [PMC free article] [PubMed] [Google Scholar]
- Yue L, Chen W (2005) Isolation and determination of cultural characteristics of a new highly CO2 tolerant fresh water microalgae. Energy Convers Manag 46:1868–1876 [Google Scholar]


