Abstract
Purpose
To develop and validate a system that could perform automated diagnosis of common and rare neurologic diseases involving deep gray matter on clinical brain MRI studies.
Materials and Methods
In this retrospective study, multimodal brain MRI scans from 212 patients (mean age, 55 years ± 17 [standard deviation]; 113 women) with 35 neurologic diseases and normal brain MRI scans obtained between January 2008 and January 2018 were included (110 patients in the training set, 102 patients in the test set). MRI scans from 178 patients (mean age, 48 years ± 17; 106 women) were used to supplement training of the neural networks. Three-dimensional convolutional neural networks and atlas-based image processing were used for extraction of 11 imaging features. Expert-derived Bayesian networks incorporating domain knowledge were used for differential diagnosis generation. The performance of the artificial intelligence (AI) system was assessed by comparing diagnostic accuracy with that of radiologists of varying levels of specialization by using the generalized estimating equation with robust variance estimator for the top three differential diagnoses (T3DDx) and the correct top diagnosis (TDx), as well as with receiver operating characteristic analyses.
Results
In the held-out test set, the imaging pipeline detected 11 key features on brain MRI scans with 89% accuracy (sensitivity, 81%; specificity, 95%) relative to academic neuroradiologists. The Bayesian network, integrating imaging features with clinical information, had an accuracy of 85% for T3DDx and 64% for TDx, which was better than that of radiology residents (n = 4; 56% for T3DDx, 36% for TDx; P < .001 for both) and general radiologists (n = 2; 53% for T3DDx, 31% for TDx; P < .001 for both). The accuracy of the Bayesian network was better than that of neuroradiology fellows (n = 2) for T3DDx (72%; P = .003) but not for TDx (59%; P = .19) and was not different from that of academic neuroradiologists (n = 2; 84% T3DDx, 65% TDx; P > .09 for both).
Conclusion
A hybrid AI system was developed that simultaneously provides a quantitative assessment of disease burden, explainable intermediate imaging features, and a probabilistic differential diagnosis that performed at the level of academic neuroradiologists. This type of approach has the potential to improve clinical decision making for common and rare diseases.
Supplemental material is available for this article.
© RSNA, 2020
Summary
A hybrid artificial intelligence system incorporating deep learning, atlas-based image processing, and Bayesian inference performed automated diagnosis of 35 common and rare neurologic diseases involving deep gray matter as well as normal brain MRI scans, and the performance of the system was compared with radiologists of different training levels in a held-out test sample.
Key Points
■ A custom advanced image processing pipeline incorporating deep learning and atlas-based imaging methods was able to detect 11 key features on brain MRI scans (total, n = 212; test set, n = 102) with 89% accuracy (sensitivity, 81%; specificity, 95%) relative to academic neuroradiologists.
■ An expert-derived Bayesian system incorporated the 11 imaging features with four clinical features to generate a probabilistic differential diagnosis of 35 common and rare neuroradiologic diagnoses involving deep gray matter as well as normal findings.
■ Within the test set, the integrated artificial intelligence (AI) system generated the correct diagnosis within the top three differential diagnoses (T3DDx) in 85% of cases and the correct diagnosis as the top diagnosis (TDx) in 64% of the cases; the performance of the system was not different from that of academic neuroradiologists (84% for T3DDx, 65% for TDx; P > .09 for both), but was better than that of radiology residents (56% for T3DDx, 36% for TDx; P < .001 for both), general radiologists (53% for T3DDx, 31% for TDx; P < .001 for both), and neuroradiology fellows for T3DDx (72%, P = .003) but not for TDx (59%, P = .19).
■ Imaging features accounted for 43.1% of the T3DDx accuracy of the AI system, whereas clinical features accounted for 20.6%.
Introduction
Delays in neurologic diagnosis can lead to poor outcomes (1–3). Imaging studies of patients with neurologic symptoms are crucial to accurate diagnoses (4,5), and subspecialty interpretations are known to improve accuracy of neuroradiology diagnoses (6). However, subspecialists often are unavailable outside of large academic centers. Computational methods for quantitative image analysis and other forms of artificial intelligence (AI) have considerable potential for augmenting radiologists’ ability to make earlier diagnoses, particularly given minimal overlap between computer errors and human cognitive biases (5,7–9). However, substantial challenges have limited progress in translating AI tools into daily clinical practice. These challenges include a vast spectrum of common and rare pathologic conditions encountered in clinical practice (10), integration of relevant clinical information, highly heterogeneous clinical imaging data, scanner variability, and long processing time for traditional image processing methods.
To begin to address these challenges, we sought to develop a hybrid approach that mirrors the fundamental perceptual and cognitive steps involved in generating image-based differential diagnoses (5). The first part of our system combines advanced atlas-based neuroimaging methods with convolutional neural networks (CNNs) to detect, localize, and quantitatively characterize signal and spatial abnormalities within the brain. CNNs are a class of deep learning algorithms that are well-suited for image-based problems and show substantial promise in addressing issues related to heterogeneous clinical data and long processing times (11,12). These image-derived intermediate features become inputs to the second part of our system, an expert-derived Bayesian network, which probabilistically models conditional independence (13–16). The Bayesian network allows for experts’ explicit knowledge of an array of possible diseases to be incorporated into the system to perform the cognitive task of generating a differential diagnosis given a set of imaging and clinical variables, without requiring training examples for each disease.
Given the vast spectrum of diagnostic possibilities that could be present on brain MRI scans, as a proof of concept we chose to focus on 35 diagnostic entities that may involve deep gray matter structures, including the caudate nucleus, putamen, globus pallidus, and thalamus. These entities reflect a wide variety of infectious-inflammatory, neoplastic, toxic-metabolic, and vascular etiologies, including common and rare pathologies. Accurate neurologic diagnosis requires integration of multiple imaging and clinical variables (17). We aimed to validate this AI system by comparing its performance to radiologists with different levels of specialization in a held-out test sample, hypothesizing that such a hybrid system could perform as well as academic neuroradiologists for diseases involving deep gray matter.
Materials and Methods
Study Design and Patient Data
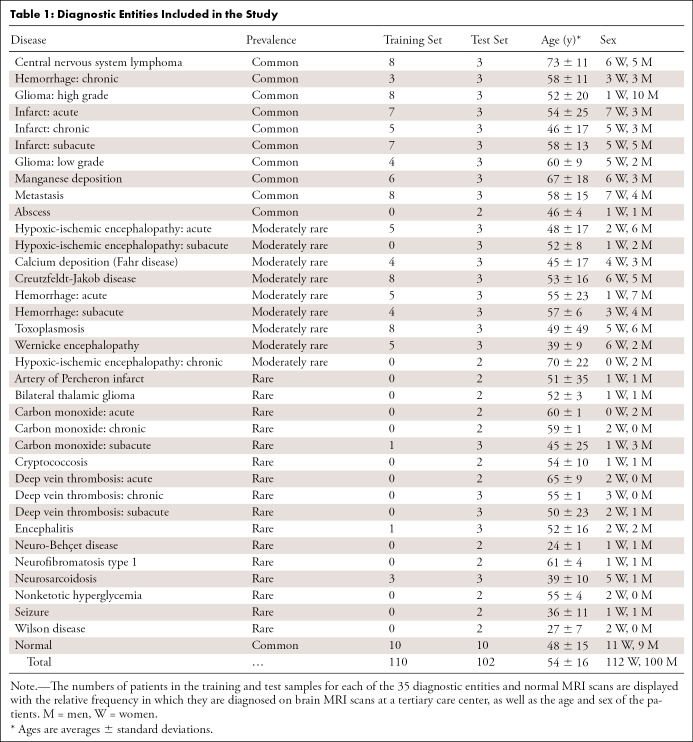
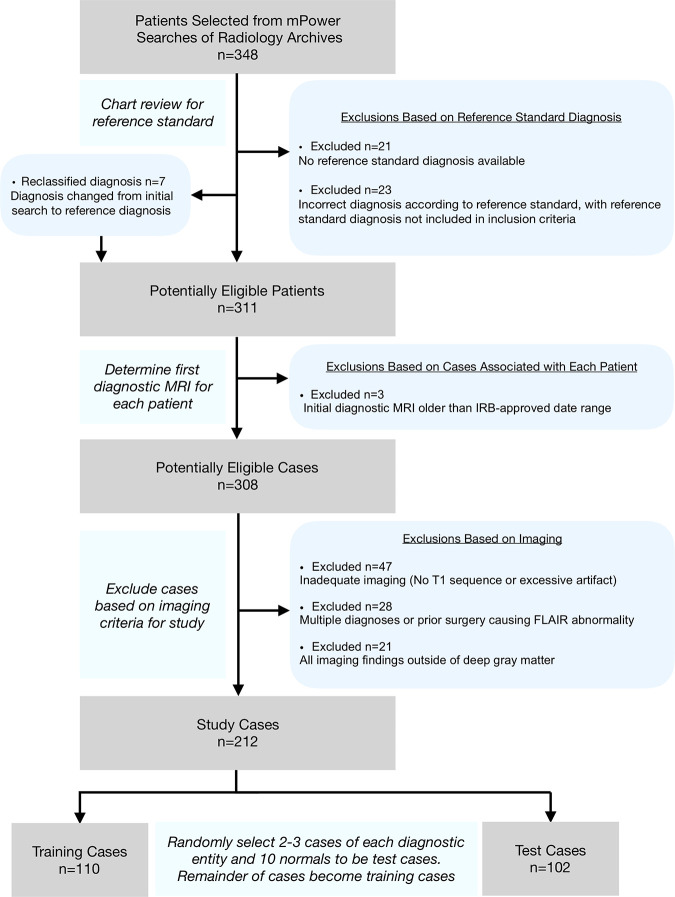
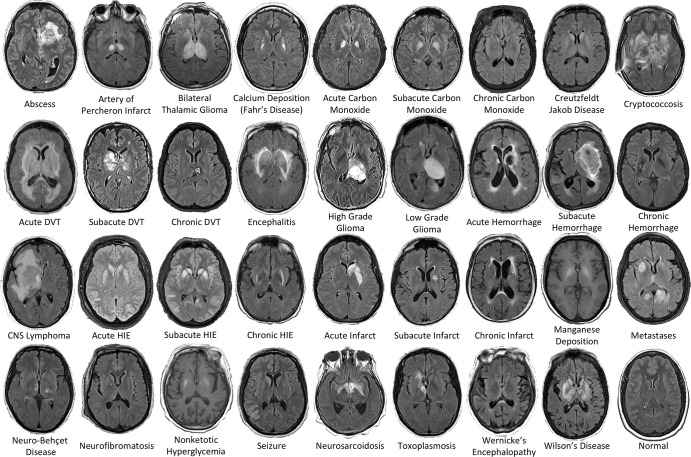
As part of a retrospective, institutional review board–approved, Health Insurance Portability and Accountability Act–compliant study, multimodal brain MRI scans from 212 patients (mean age, 55 years ± 17 [standard deviation]; 113 women) were included after assessment of inclusion and exclusion criteria with a waiver for written consent (Table 1, Fig 1, Appendix E1 [supplement]). The patients included represented 35 different diagnostic entities involving deep gray matter as well as normal brain MRI findings (Table 1, Fig 2). Data from an additional 178 patients with lesions of various causes (mean age, 48 years ± 17; 106 women) from a related study of different diseases (18) were used to supplement training of the CNNs. In addition, a portion of the MRI data overlapped with those in the study by Duong et al (19), which details the development of the three-dimensional CNN. Images were acquired between January 2008 and January 2018 from the picture archiving and communication system (Sectra, Linköping, Sweden) at our tertiary care center. Four clinical characteristics were extracted from each patient’s chart: age, sex, symptom chronicity, and immune status (Appendix E8 [supplement]).
Table 1:
Diagnostic Entities Included in the Study
Figure 1:
Flowchart for case selection. After selecting 348 patients with the diseases included in the study from mPower (Nuance Communications, Burlington, Mass) searches, chart reviews were performed to confirm the diagnoses. The first diagnostic MRI scan was chosen, and then the final cases were selected by excluding cases with inadequate imaging (eg, missing sequences or excessive motion), multiple diagnoses, or imaging findings outside deep gray matter. The final sample (n = 212) was then randomized into training cases (n = 110) and test cases (n = 102) by randomly selecting two to three cases of each diagnostic entity and 10 normal cases to the test cases. The remainder of the cases became training cases. FLAIR = fluid-attenuated inversion recovery, IRB = institutional review board.
Figure 2:
Examples of the 36 diagnostic entities included the study. All MRI scans are axial T2-weighted fluid-attenuated inversion recovery images except for manganese deposition and nonketotic hyperglycemia scans, which are T1-weighted images. CNS = central nervous system, DVT = deep vein thrombosis, HIE = hypoxic-ischemic encephalopathy.
The 212 deep gray matter patient cases were separated into training (n = 110) and test (n = 102) sets by randomly selecting two or three cases from each disease entity for inclusion in the test sample; the remaining cases served as the training sample, even if this procedure resulted in zero examples of that disease in the training sample (training cases varied from zero to eight across diagnoses) (Table 1). The diseases were classified as “common,” “moderately rare,” or “rare” with regard to the relative frequency at which they were diagnosed on brain MRI scans at a tertiary care center, based on the consensus of two academic neuroradiologists (I.M.N. and S.M., with 7 and 12 years of post-fellowship academic neuroradiology experience, respectively) (Appendix E1 [supplement]).
Imaging Data
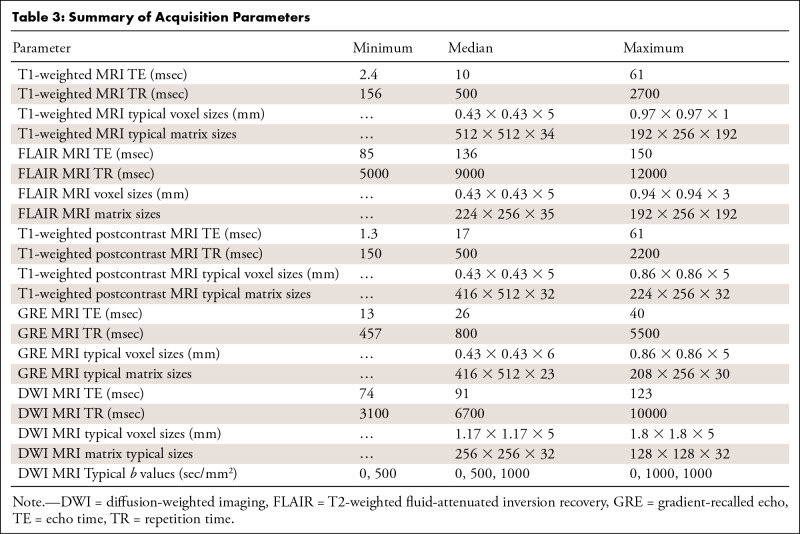
Six core clinical MRI modalities were included in the image analysis pipeline when available: T1-weighted, T2-weighted fluid-attenuated inversion recovery (FLAIR), gradient-recalled echo (a T2*-weighted sequence), diffusion-weighted (high b value of approximately 1000 sec/mm2), apparent diffusion coefficient, and T1-weighted postcontrast imaging (Appendix E2 [supplement]). The 212 MRI studies used in total were obtained from 16 unique scanner models and four manufacturers; 97% of the data were acquired from either Siemens (Erlangen, Germany) or GE Healthcare (Milwaukee, Wis) scanners (Tables 2, 3; Appendix E2 [supplement]).
Table 2:
Clinical MRI Scanners Used
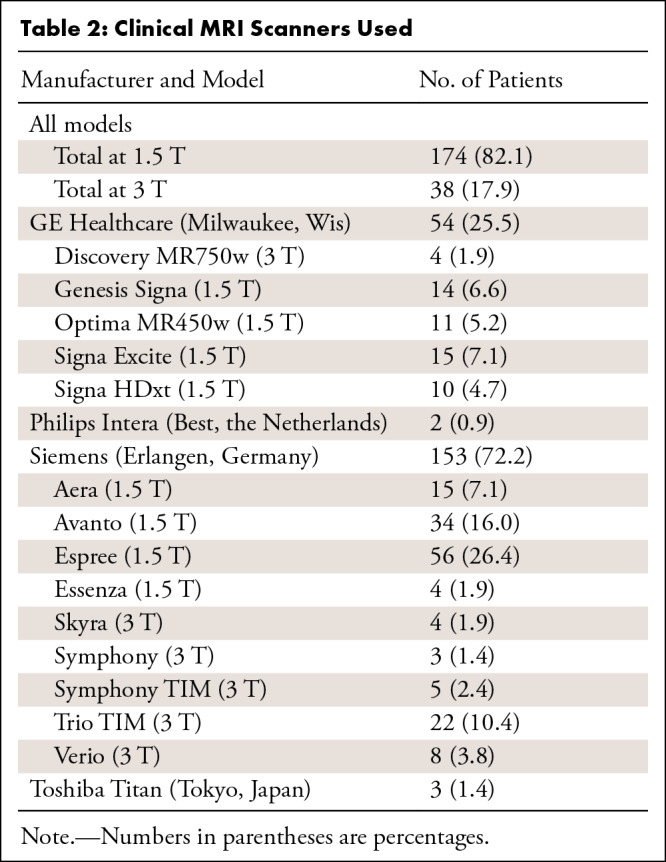
Table 3:
Summary of Acquisition Parameters
Atlas-based Image Segmentation Pipeline
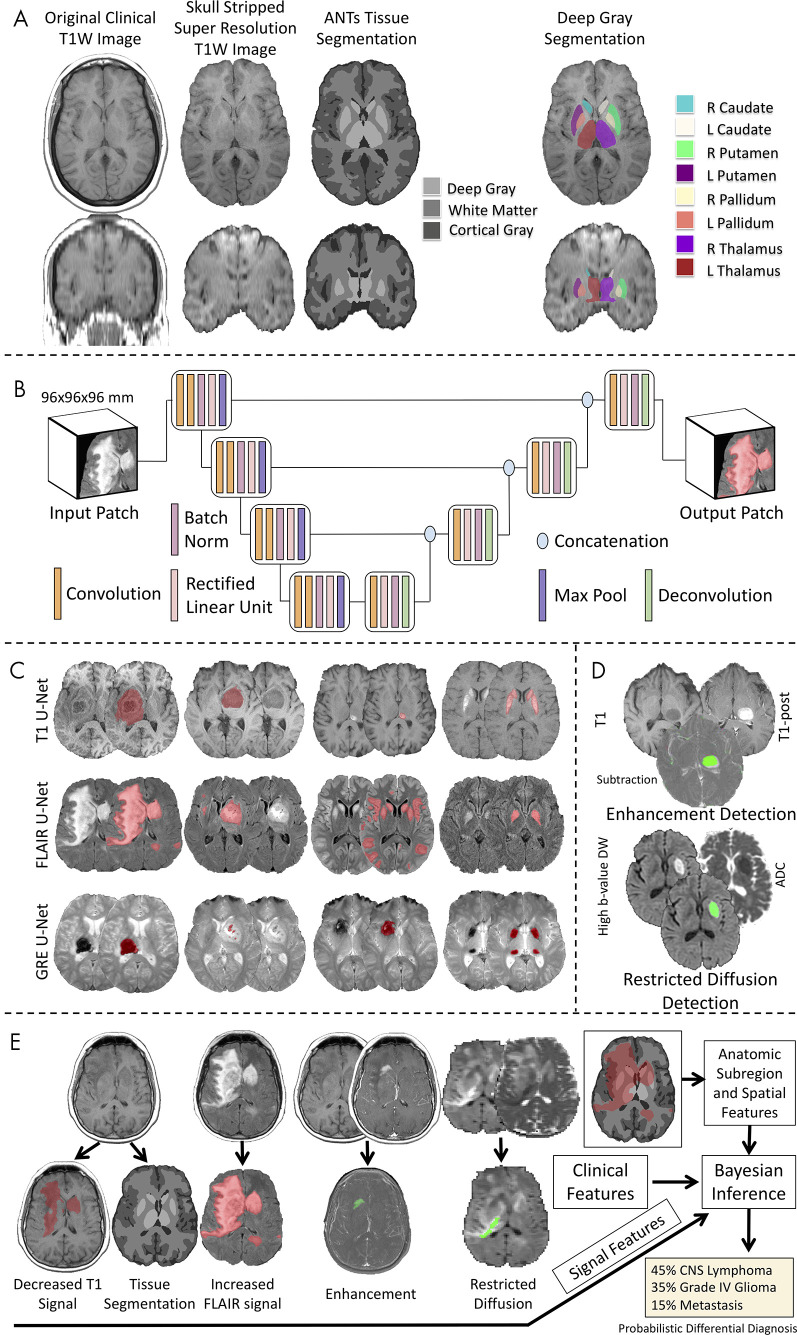
We developed an image processing pipeline that performed segmentation of brain tissues and deep gray matter structures (right and left caudate, putamen, globus pallidus, thalamus) on T1-weighted images. After preprocessing, the Advanced Normalization Tools pipeline (version 2.1; https://github.com/ANTsX/ANTs) (20,21) was applied to T1-weighted images for brain extraction, registration to a standard common template, and segmentation of cerebrospinal fluid, white matter, and cortical and deep gray matter as well as parcellation into eight deep gray matter structures (Fig 3, A; Appendix E3 [supplement]).
Figure 3:
Workflow of the image processing pipeline. A, Atlas-based neuroimaging processing pipeline for tissue segmentation and deep gray matter parcellation. T1-weighted (T1W) axial (upper row) and coronal (lower row) MRI scans were up-sampled and skull-stripped (second column) before tissue segmentation with the Advanced Normalization Tools (ANTs) pipeline (third column) and parcellation of deep gray matter structures (fourth column). B, Diagrammatic overview of the custom three-dimensional U-Net architecture for abnormal signal detection. C, Examples of U-Net–based segmentations for T1-weighted (T1, first row), T2-weighted fluid-attenuated inversion recovery (FLAIR, second row), and gradient-recalled echo (GRE, third row) MRI scans of test case. D, Example of T1-weighted (T1), T1-weighted postcontrast (T1-post), and a subtraction of the T1-weighted image from the T1-weighted postcontrast image with detected areas of abnormal enhancement (green) and high b value diffusion-weighted (DW) and apparent diffusion coefficient (ADC) images with detected areas of restricted diffusion (green). E, Example of correctly diagnosed central nervous system (CNS) lymphoma processed through the full pipeline with signal, anatomic subregion, and spatial features (derived from abnormal signal segmentations overlaid on tissue segmentation maps) combined with clinical features into a Bayesian inference system to derive a probabilistic differential diagnosis.
Abnormal Signal Intensity Detection
For the detection of abnormal signal intensity on FLAIR, gradient-recalled echo, and T1-weighted images, we developed custom three-dimensional U-Net CNNs (22–24) for each sequence that were trained on radiologists’ (J.D.R. and A.M.R., both neuroradiology fellows) voxel-wise hand segmentations of abnormal signal intensity of training cases (Fig 3, B and C), as described in Duong et al (19) and in Appendixes E4 and E6 (supplement). For the detection of abnormal enhancement and restricted diffusion, we developed custom image processing pipelines, whereby voxel-wise information from multiple images was incorporated to detect abnormal enhancement (T1-weighted images, T1-weighted postcontrast images, and a subtraction of the T1-weighted image from the T1-weighted postcontrast image) and restricted diffusion (diffusion-weighted images and apparent diffusion coefficient maps) (Fig 3, D; Appendix E5 [supplement]). The performance of these automated methods for detecting the presence of abnormal signal in the test cases was evaluated by comparing them with the reference standard consensus of three radiologists (I.M.N., S.M., and J.D.R.; Appendix E10 [supplement]). The prevalence of each of these features for each disease is displayed in Table E1 (supplement).
Bayesian Network Analysis
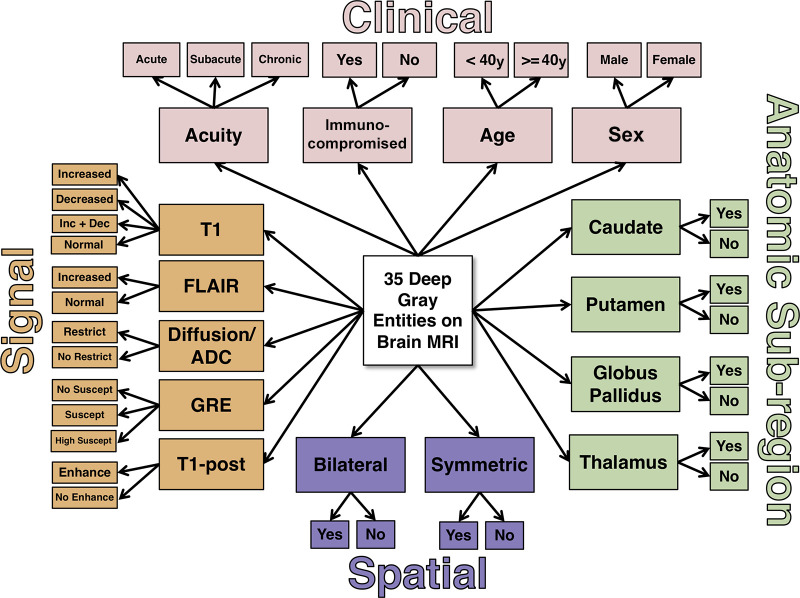
The 11 imaging features—five extracted signal intensity features (T1, FLAIR, enhancement, restricted diffusion, and susceptibility [from gradient-recalled echo]), four anatomic subregions (whether abnormal signal intensity was present within the segmented four deep gray regions after thresholding) (Appendixes E6, E7 [supplement]), and two spatial pattern features (bilateral and symmetric) derived from the lesion masks (Appendix E7 [supplement])—were combined with four clinical features (age, sex, symptom chronicity, and immune status) (Appendix E8 [supplement]) and passed into an expert-derived naive Bayes inference model encompassing the 36 possible diagnostic entities (35 deep gray matter diseases and normal) (Fig 4). The probabilities in the Bayesian network were determined by consensus of four radiologists (I.M.N., S.M., J.D.R., and E.J.B., a neuroradiology fellow) and the literature where available (Appendix E9 [supplement], with probabilities shown in Table E2 [supplement]). For each test case, the Bayesian network generated a probability for each of the diagnostic entities in a ranked differential diagnosis.
Figure 4:
Naive expert-trained deep gray Bayesian network overview. Key image signal, spatial pattern, and anatomic subregion features are probabilistically combined with four clinical features to calculate a probability of each diagnostic state. ADC = apparent diffusion coefficient, Dec = decreased, Enhance = enhancement, FLAIR = fluid-attenuated inversion recovery, GRE = gradient-recalled echo, Inc = increased, Restrict = restricted diffusion, Suscept = susceptibility, T1 = T1-weighted, T1-post = T1-weighted postcontrast.
Clinical Validation
To clinically validate the performance of the AI system, four radiology residents (two 2nd-year radiology residents and two board-eligible 4th-year radiology residents), two neuroradiology fellows (each with 9 months of fellowship training), two general radiologists (A.K., J.M.E.) (both of whom routinely read brain MRI scans, one with fellowship training in neuroradiology, with 20 and 21 years of posttraining experience, respectively), and two academic neuroradiology attending physicians (I.M.N., S.M.) reviewed the 102 test cases anonymized on our picture archiving and communication system with the same clinical information and provided their ranked top three differential diagnoses (T3DDx) from the 36 possible diagnostic entities (Appendix E11 [supplement]).
Statistical Analyses for Comparison of Performance
Comparison between the performance of the AI system and different groups of radiologists for T3DDx and top diagnosis (TDx) across all diseases and within disease prevalence categories was performed using a generalized estimating equation with robust variance estimator by pooling observations across radiologist groups, expressed as odds ratios (ORs) of accuracy (eg, an OR of 0.50 would suggest that a particular radiologist group was half as likely as the AI algorithm to provide the correct diagnosis). Receiver operating characteristic curves were constructed to serve as summary measures of performance across TDx, top two differential diagnoses, and T3DDx by using the position of the differential diagnosis to create an ordinal scale of confidence intervals (CIs), with area under the receiver operating characteristic curve (AUC) and 95% CIs calculated by bootstrapping and significance compared using the DeLong test (25) (Appendix E12 [supplement]). The χ2 test was used for comparing the fraction of cases answered correctly according to disease prevalence within each radiologist group. Statistical analyses were performed using MATLAB (version r2019a; Mathworks, Natick, Mass), with the exception of the generalized estimating equation, which was implemented with Stata (version 13.1; Stata, College Station, Tex). A statistically significant difference was defined as P < .05, and all reported P values represent nondirectional, two-tailed tests.
Analysis of Confusion Matrices
Confusion matrices were generated for each group of radiologists by combining all the reads of that group into a matrix of predicted TDx versus true TDx. Correlations between the top diagnoses of the AI system, individual neuroradiology fellows, and individual academic neuroradiologists were performed using two-dimensional t tests of correlations. The statistical comparison between these correlations was performed with the Fisher r-to-z transformation.
Importance of Different Features to Bayesian Network Performance
To evaluate the relative importance of the different imaging and clinical features for generating a correct TDx or T3DDx, individual features and groups of features were removed before analysis of the test cases with the Bayesian network.
Results
Patient Demographics
The training and testing set split resulted in 110 training cases and 102 test cases (Table 1) across 35 different diagnoses (Fig 2). There were no significant differences between the training and test sets with regard to age (P = .09, two-tailed t test) or sex (P = .65, χ2 test). The number of training cases varied from zero to eight across diagnostic entities.
Performance for Detecting Abnormal Signal Intensity, Anatomic Subregion, and Spatial Pattern Features
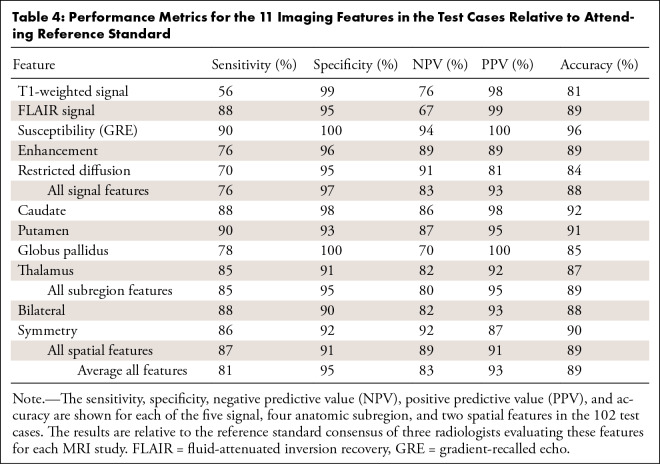
The performance metrics for the 11 imaging features in the test cases relative to attending reference standard (Appendix E10 [supplement]) are shown in Table 4. The U-Nets were 81%, 89%, and 96% accurate for detecting the presence of abnormal signal intensity on T1-weighted, FLAIR, and gradient-recalled echo images, respectively. Detection of abnormal enhancement and restricted diffusion were 89% and 84% accurate, respectively. Accuracies for detecting abnormal signal intensity within the different deep gray subregions varied between 85% and 92%, and accuracies for the bilateral and symmetric spatial features were 88% and 90%, respectively. The average specificities (range, 90%–100%) were higher than their sensitivities (range, 56%–90%) (Table 4).
Table 4:
Performance Metrics for the 11 Imaging Features in the Test Cases Relative to Attending Reference Standard
Diagnostic Performance of Integrated AI System and Radiologists
Given that there were 36 diagnostic possibilities, random chance performance for selecting the correct diagnosis within the T3DDx was 8.3% (three of 36) and for selecting the correct diagnosis within the TDx was 2.8% (one of 36). The AI system determined the correct diagnosis within the T3DDx in 85% (87 of 102) of test cases (Fig 5, A) and the correct TDx in 64% (65 of 102) of test cases (Fig 5, B). The AI system was found to perform better than radiology residents (n = 4; 408 observations) for T3DDx (56% [227 of 408]; OR, 0.21; 95% CI: 0.12, 0.36; P < .001) and TDx (36% [145 of 408]; OR, 0.30; 95% CI: 0.20, 0.45; P < .001). The AI system was also better than general radiologists (n = 2; 204 observations) for both T3DDx (53% [108 of 204]; OR, 0.17; 95% CI: 0.09, 0.31; P < .001) and TDx (31% [64 of 204]; OR, 0.25; 95% CI: 0.16, 0.41; P < .001). Neuroradiology fellows (n = 2; 204 observations) performed worse than the AI system for T3DDx (72% [147 of 204]; OR, 0.38; 95% CI: 0.20, 0.71; P = .003), but were not significantly different from the AI system for TDx (59% [121 of 204]; OR, 0.74; 95% CI: 0.46, 1.16; P = .19). The AI system was not different from academic neuroradiologists (n = 2; 204 observations) for T3DDx (84% [172 of 204]; OR, 0.73; 95% CI: 0.38, 1.41; P = .35) or TDx (65% [133 of 204]; OR, 1.02; 95% CI: 0.65, 1.61; P = .09). The performance of each of the radiologist groups for each of the 36 diagnostic entities is displayed in Table E3 (supplement).
Figure 5:
Comparison of radiologist performance to that of an artificial intelligence (AI) system. A, B, Jitter plots for the accuracy of the AI system for including, A, the correct top three differential diagnoses (T3DDx) and, B, correct top diagnosis (TDx) relative to the different groups of radiologists (radiology residents, general radiologists [General Rad], neuroradiology fellows [Neurorad fellows], and academic neuroradiologists [Academic Neurorads]). C, Nonparametric receiver operating characteristic (ROC) curves for the AI system (blue) compared with groups of radiologists based on their TDx, top two differential diagnoses, and T3DDx for each patient. D, E, Jitter plots for the accuracy of the AI system and radiologists for the, D, T3DDx and, E, exact correct TDx as a function of disease prevalence: common (black circle), moderately rare (gray square) and rare (white triangle). Solid lines denote the mean, and error bars represent standard error of measurement.
Evaluation of the receiver operating characteristic across the TDx, top two differential diagnoses, and T3DDx (Fig 5, C) revealed an AUC of 0.90 (95% CI: 0.86, 0.94) for the AI system, which was not different from that of academic neuroradiologists (AUC, 0.90; 95% CI: 0.87, 0.93; P = .86), but was better than that of radiology residents (AUC, 0.74; 95% CI: 0.71, 0.76; P < .001), general radiology attending physicians (AUC, 0.72; 95% CI: 0.69, 0.76; P < .001), and neuroradiology fellows (AUC, 0.83; 95% CI: 0.79, 0.86; P = .04).
Performance Relative to Disease Prevalence
Next, we sought to assess how performance varied as a function of disease prevalence (Fig 5, D and E). For T3DDx, all radiologists performed better on common disease compared with rare diseases (Fig 5, D): The percentage correct was 77% (114 of 148) versus 32% (51 of 160), respectively, for radiology residents (45% absolute difference, P < .001, χ2 = 62), 65% (48 of 74) versus 36% (29 of 80) for general radiologists (29% absolute difference, P < .001, χ2 = 12), 86% (64 of 74) versus 61% (49 of 80) for neuroradiology fellows (25% absolute difference, P < .001, χ2 = 13), and 97% (72 of 74) versus 71% (57 of 80) for academic neuroradiologists (26% absolute difference, P < .001, χ2 = 19). For the AI system, there was no difference between common and rare diseases for T3DDx (percentage correct: 92% [34 of 37] vs 78% [31 of 40], 14% absolute difference, P = .08, χ2 = 3).
When comparing the AI system with radiologist groups for T3DDx, the system was found to perform better than residents and general radiologists in the diagnosis of rare diseases (residents: OR, 0.28, 95% CI: 0.13, 0.57, P < .001; general radiologists: OR, 0.28, 95% CI: 0.13, 0.57, P < .001), as well as in the diagnosis of common diseases (residents: OR, 0.09, 95% CI: 0.13, 0.68, P = .02; general radiologists: OR, 0.04, 95% CI: 0.005, 0.33, P = .003).
Similarity of Performance between AI System and Radiologists
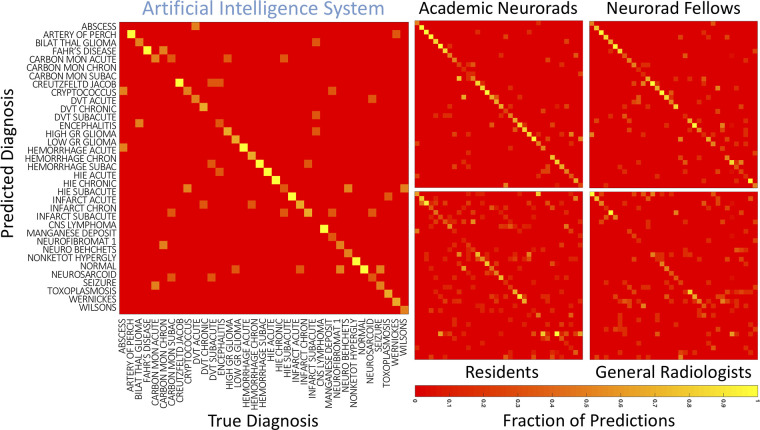
Confusion matrices were generated for the AI system and for each radiologist by comparing true and predicted diagnoses for the TDx (Fig 6). To evaluate the similarity between the AI system and different specialization levels of radiologists, we compared the correlations between the confusion matrices of individual academic neuroradiologists, neuroradiology fellows, and the AI system. The average of pairwise two-dimensional correlations among academic neuroradiologists and neuroradiology fellows (average r = 0.67) was not different than the correlation between the two academic neuroradiologists (r = 0.71, P = .17) or between the two neuroradiology fellows (r = 0.67, P = .99). However, the correlation between the two academic neuroradiologists’ confusion matrices was higher than the average correlation between the AI system and the academic neuroradiologists (average r = 0.61, P < .001). Similarly, the correlation between the two neuroradiology fellows’ confusion matrices was higher than the average correlation between the AI system and the neuroradiology fellows (average r = 0.57, P = .003). These results demonstrate that the neuroradiology fellows and academic neuroradiologists were more similar to each other in the diagnoses that they predicted correctly and incorrectly as compared with the AI system.
Figure 6:
Confusion matrices for the artificial intelligence system and radiologists. Confusion matrices for different radiologist specialization levels were generated for the top diagnosis, averaged across individuals within each group. True disease labels are shown along the x-axis and predicted diagnoses on the y-axis. The color of each cell represents the fraction of cases within a column where the top predicted diagnosis matched the true diagnosis. Artery of Perch = artery of Percheron, Bilat thal glioma = bilateral thalamic glioma, Carbon Mon Acute = carbon monoxide: acute, Carbon Mon Chronic = carbon monoxide: chronic, Carbon Mon Subacute = carbon monoxide: subacute, CNS = central nervous system, Creutzfeld Jacob = Creutzfeldt-Jakob disease, DVT = deep vein thrombosis, Hemorrhage Chron = hemorrhage: chronic, Hemorrhage Subac = hemorrhage: subacute, High GR = high grade, HIE = hypoxic-ischemic encephalopathy, Infarct Chron = infarct: chronic, Low GR = low grade, Neuro Behcets = neuro Behçet disease, Neurofibromat 1 = neurofibroma type 1, Neurorad fellows = neuroradiology fellows, Neurosarcoid = neurosarcoidosis, Nonketot hypergly = nonketotic hyperglycemia, Wernickes = Wernicke encephalopathy, Wilsons = Wilson disease.
Importance of Different Features to Bayesian Network Performance
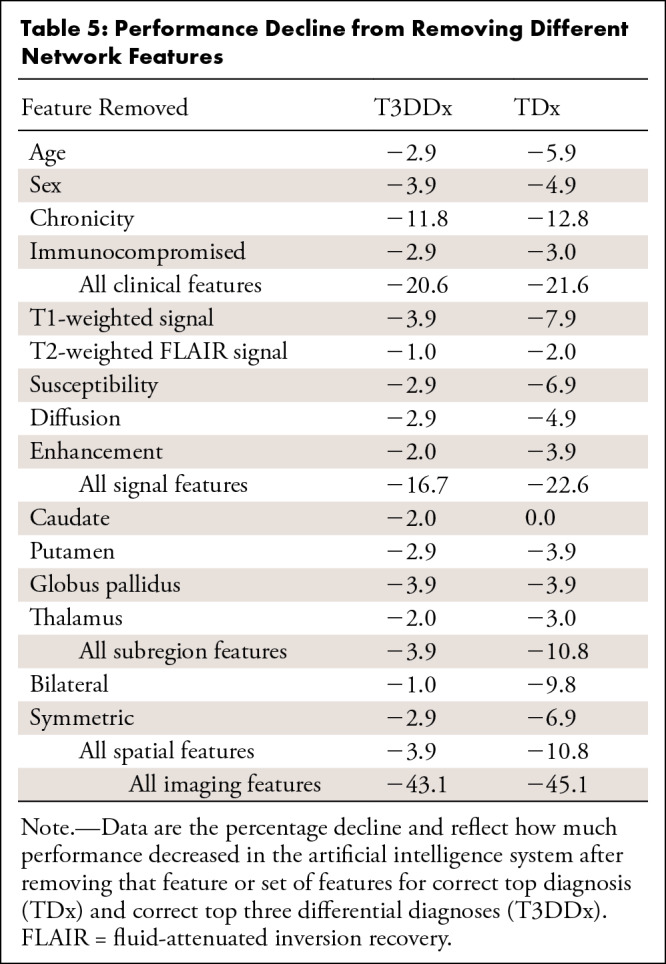
Removing all clinical features resulted in a 21.6% decrease in performance for TDx and a 20.6% decrease for T3DDx (Table 5). Chronicity was the most important clinical feature and most important single feature overall, which resulted in a 12.8% decrease in performance for TDx and an 11.8% decrease for T3DDx when removed. Removing all signal features resulted in a 22.6% decrease in performance for TDx and a 16.7% decrease for T3DDx, with T1-weighted being the most important signal feature, with a 7.9% and 3.9% decrease in performance when removed for TDx and T3DDx, respectively. Performance decreased by 10.8% when either all anatomic subregions or all spatial features were removed for TDx, but it decreased by only 3.9% when these were removed for T3DDx. Removing all imaging features (signal, anatomic subregion, and spatial) resulted in a 43.1% decrease in performance for T3DDx and a 45.1% decrease for TDx.
Table 5:
Performance Decline from Removing Different Network Features
We also calculated the performance of the Bayesian network using attending reference standard features, which resulted in a 94% accuracy for T3DDx (96 of 102 test cases) and 75% accuracy for TDx (76 of 102 test cases).
Discussion
We developed an AI diagnostic system that models the perceptual and cognitive tasks of radiologists by combining data-driven and knowledge-driven analytic methods. The system was able to differentiate among 36 diagnostic entities involving deep gray matter and normal findings on clinical brain MRI studies with an AUC of 0.90 (85% accuracy for T3DDx and 64% accuracy for TDx). The diagnostic system performed significantly better than general radiologists and radiology residents and was similar to that of subspecialty academic neuroradiologists. The system achieved human expert level performance in a highly heterogeneous imaging dataset, representing a broad spectrum of common and rare diseases of neoplastic, infectious, metabolic, and inflammatory etiologies.
The first component of the system extracted 11 key features through a customized atlas-based neuroimaging pipeline for anatomic parcellation and CNNs for abnormal signal segmentation. We adapted a three-dimensional U-Net architecture, given the ability of this architecture to perform similar types of segmentation tasks on heterogeneous biomedical imaging data with as little as a few hundred training exemplars (19). The second critical step of our approach was to use Bayesian networks to encode expert knowledge of a large array of diseases and perform the cognitive task of integrating relevant imaging features and pertinent clinical information to derive a probabilistic differential diagnosis. Although end-to-end deep learning approaches could one day perhaps perform the same task of distinguishing hundreds of different entities, data-driven approaches such as deep learning require thousands of examples for each entity being classified, making such a task improbable for rare diseases that lack even moderately large sample sizes. Thus, most prior applications of AI in medical imaging have focused on a handful of common diagnostic entities, such as five types of liver lesions (26) or five types of intracranial hemorrhage (27). In contrast, by incorporating experts’ domain knowledge about these different diseases, this hybrid system can achieve expert-level performance on novel data despite having few, or even zero, training examples of specific rare diseases. This is possible given that training is directly performed on intermediate imaging features that change in restricted ways across all diseases. This variability is captured in the training set even without inclusion of rare diseases. The Bayesian network merges these imaging features to the final differential diagnosis based on expert knowledge of rare diseases contained in the probabilities of the network. In addition, this feature engineering approach allows for an iterative process of adding relevant features and interrogating the importance of each feature, including relevant clinical features. Interestingly, we found that inputting attending reference standard features into the Bayesian network led to even better performance (94% accuracy for T3DDx and 75% accuracy for TDx), highlighting that improvements to the image processing pipeline could boost performance. Finally, the feature states of the Bayesian network provide directly interpretable or “explainable” intermediate features, which mitigates concerns about the “black box” nature of AI methods that go directly from images to diagnoses.
There are a number of limitations of the automated diagnostic system presented herein, which can currently be considered a proof of concept for expert-level performance, tested retrospectively on a preselected subset of diseases encountered on brain MRI studies. For such a system to be useful in the general neuroradiology workflow, it would need to be expanded to cover the majority of all possible diseases. We also plan to expand the system to cover imaging manifestations of the spectrum of diseases across the entire brain. Alternatively, the current system could be used after it was determined that there were abnormalities in deep gray matter. To further improve such a system, it may also be necessary to add additional predefined intermediate features, including number and size of lesions as well as subtle texture features present in the data but not easily discernible by the human visual system. In this study, common diseases were represented similarly to rare diseases to evaluate performance across a range of diagnostic entities. Incorporating prior probabilities based on local disease prevalence might be necessary for a system to be deployed prospectively with high accuracy. Collecting larger training samples and further updating the Bayesian probabilities using a data-driven approach also has the potential to improve performance. Another limitation of the current system is the inability to distinguish multiple simultaneous diagnostic entities, as we excluded cases with multiple different disease processes. It should also be noted that some of the same neuroradiologists who developed the Bayesian network vetted the final diagnoses for the test cases, which could have biased the performance of the AI system toward that of the academic neuroradiologists. Ideally, the findings should be replicated in an additional independent dataset by independent academic neuroradiologists. Finally, although the study represented patients from a single health care system, the wide variety of scanners and acquisition parameters in our study suggests that this approach may be insensitive to such variation. Augmenting the model with multi-institutional data and scanner types may further improve the diagnostic performance.
There are multiple clinical applications for this line of research. As the volume and complexity of medical imaging continues to increase (28), there is a need for tools that can improve both diagnostic accuracy and workflow efficiency. The addition of quantitative methods and computer algorithms may decrease the incidence of perceptual and cognitive errors due to uniquely human biases (5). Our data support the concept that cognitive biases can result in different types of errors generated by humans compared with the AI system. This suggests that results from the AI system may be synergistic with radiologists’ expertise, augmenting radiologists’ overall performance. Hence, it will be important to test whether radiologists’ accuracy can, in fact, be improved by using such a system. In particular, we found that the AI system performed particularly well for rare diseases, suggesting that this type of system could also provide clinical decision support to consider alternate rare diagnoses. Clinical decision support may enable earlier diagnosis and treatment for rare entities, which can be missed in general practices where neuroradiology or neurology subspecialists are not available, and such support may be particularly useful in developing countries where there is a large shortage of subspecialty radiologists (29). Future improvements to this diagnostic system should enhance the accuracy, precision, and overall utility of a system that can be used for clinical decision support in the evaluation of an individual patient’s brain MRI.
APPENDIX
Acknowledgments
Acknowledgments
We thank the following individuals who helped generate some of the preliminary manual segmentations: Rachit Saluja, David A. Weiss, and Vanessa Franca Rudie. We gratefully acknowledge the support of NVIDIA, who donated the Titan Xp GPUs used for this research as part of the NVIDIA GPU grant program (J.D.R., A.M.R.).
J.D.R. and A.M.R. contributed equally to this work.
A.M.R. was supported by a Radiological Society of North America (RSNA) Resident Research grant (RR1778). A.M.R. (UCSF) and J.D.R. (Hospital of the University of Pennsylvania) were supported by institutional T-32 training grants (T32EB001631-14 [A.M.R.] and T32-EB004311-10 [A.M.R. and J.D.R.]).
Disclosures of Conflicts of Interest: J.D.R. disclosed no relevant relationships. A.M.R. disclosed no relevant relationships. L.X. Activities related to the present article: disclosed no relevant relationships. Activities not related to the present article: is a paid consultant for Galileo. Other relationships: disclosed no relevant relationships. J.W. disclosed no relevant relationships. M.T.D. disclosed no relevant relationships. E.J.B. disclosed no relevant relationships. A.K. disclosed no relevant relationships. J.M.E. disclosed no relevant relationships. T.C. Activities related to the present article: disclosed no relevant relationships. Activities not related to the present article: receives royalties from the Osler Institute; received travel expenses and honorarium for participation in a day-long program from RadPartners AI Summit. Other relationships: disclosed no relevant relationships. R.N.B. Activities related to the present article: disclosed no relevant relationships. Activities not related to the present article: is on the board at Galileo CDS; has stock/stock options in Galileo CDS. Other relationships: has patents issued to the University of Pennsylvania; has a patent licensed from the University of Pennsylvania to Galileo CDS. I.M.N. disclosed no relevant relationships. S.M. Activities related to the present article: disclosed no relevant relationships. Activities not related to the present article: is a paid consultant for Northwest Biotherapeutics; institution has grants/grants pending from NovoCure, Galileo, Guerbet, and ACC. Other relationships: disclosed no relevant relationships. J.C.G. disclosed no relevant relationships.
Abbreviations:
- AI
- artificial intelligence
- AUC
- area under the receiver operating characteristic curve
- CI
- confidence interval
- CNN
- convolutional neural network
- FLAIR
- fluid-attenuated inversion recovery
- OR
- odds ratio
- TDx
- top diagnosis
- T3DDx
- top three differential diagnoses
References
- 1.Solomon AJ, Bourdette DN, Cross AH, et al. The contemporary spectrum of multiple sclerosis misdiagnosis: A multicenter study. Neurology 2016;87(13):1393–1399. [DOI] [PMC free article] [PubMed] [Google Scholar]
- 2.Tarnutzer AA, Lee SH, Robinson KA, Wang Z, Edlow JA, Newman-Toker DE. ED misdiagnosis of cerebrovascular events in the era of modern neuroimaging: A meta-analysis. Neurology 2017;88(15):1468–1477. [DOI] [PMC free article] [PubMed] [Google Scholar]
- 3.Chowdhury FA, Nashef L, Elwes RD. Misdiagnosis in epilepsy: a review and recognition of diagnostic uncertainty. Eur J Neurol 2008;15(10):1034–1042. [DOI] [PubMed] [Google Scholar]
- 4.Gunderman RB. Biases in radiologic reasoning. AJR Am J Roentgenol 2009;192(3):561–564. [DOI] [PubMed] [Google Scholar]
- 5.Bruno MA, Walker EA, Abujudeh HH. Understanding and Confronting Our Mistakes: The Epidemiology of Error in Radiology and Strategies for Error Reduction. RadioGraphics 2015;35(6):1668–1676. [DOI] [PubMed] [Google Scholar]
- 6.Briggs GM, Flynn PA, Worthington M, Rennie I, McKinstry CS. The role of specialist neuroradiology second opinion reporting: is there added value? Clin Radiol 2008;63(7):791–795. [DOI] [PubMed] [Google Scholar]
- 7.Busby LP, Courtier JL, Glastonbury CM. Bias in Radiology: The How and Why of Misses and Misinterpretations. RadioGraphics 2018;38(1):236–247. [DOI] [PMC free article] [PubMed] [Google Scholar]
- 8.Parasuraman R, Sheridan TB, Wickens CD. A model for types and levels of human interaction with automation. IEEE Trans Syst Man Cybern A Syst Hum 2000;30(3):286–297. [DOI] [PubMed] [Google Scholar]
- 9.Tversky A, Kahneman D. Availability: A heuristic for judging frequency and probability. Cogn Psychol 1973;5(2):207–232. [Google Scholar]
- 10.Park SH, Han K. Methodologic Guide for Evaluating Clinical Performance and Effect of Artificial Intelligence Technology for Medical Diagnosis and Prediction. Radiology 2018;286(3):800–809. [DOI] [PubMed] [Google Scholar]
- 11.LeCun Y, Bengio Y, Hinton G. Deep learning. Nature 2015;521(7553):436–444. [DOI] [PubMed] [Google Scholar]
- 12.Chartrand G, Cheng PM, Vorontsov E, et al. Deep Learning: A Primer for Radiologists. RadioGraphics 2017;37(7):2113–2131. [DOI] [PubMed] [Google Scholar]
- 13.Pearl J. Probabilistic Reasoning in Intelligent Systems. San Mateo, Calif: Morgan Kaufmann, 1988. [Google Scholar]
- 14.Bielza C, Larrañaga P. Bayesian networks in neuroscience: a survey. Front Comput Neurosci 2014;8:131. [DOI] [PMC free article] [PubMed] [Google Scholar]
- 15.Kahn CE Jr, Laur JJ, Carrera GF. A Bayesian network for diagnosis of primary bone tumors. J Digit Imaging 2001;14(2 Suppl 1):56–57. [DOI] [PMC free article] [PubMed] [Google Scholar]
- 16.Do BH, Langlotz C, Beaulieu CF. Bone Tumor Diagnosis Using a Naïve Bayesian Model of Demographic and Radiographic Features. J Digit Imaging 2017;30(5):640–647. [DOI] [PMC free article] [PubMed] [Google Scholar]
- 17.Hegde AN, Mohan S, Lath N, Lim CC. Differential diagnosis for bilateral abnormalities of the basal ganglia and thalamus. RadioGraphics 2011;31(1):5–30. [DOI] [PubMed] [Google Scholar]
- 18.Rauschecker AM, Rudie JD, Xie L, et al. Artificial Intelligence System Approaching Neuroradiologist-level Differential Diagnosis Accuracy at Brain MRI. Radiology 2020;295(3):626–637. [DOI] [PMC free article] [PubMed] [Google Scholar]
- 19.Duong MT, Rudie JD, Wang J, et al. Convolutional Neural Network for Automated FLAIR Lesion Segmentation on Clinical Brain MR Imaging. AJNR Am J Neuroradiol 2019;40(8):1282–1290. [DOI] [PMC free article] [PubMed] [Google Scholar]
- 20.Das SR, Avants BB, Grossman M, Gee JC. Registration based cortical thickness measurement. Neuroimage 2009;45(3):867–879. [DOI] [PMC free article] [PubMed] [Google Scholar]
- 21.Avants BB, Tustison NJ, Song G, Cook PA, Klein A, Gee JC. A reproducible evaluation of ANTs similarity metric performance in brain image registration. Neuroimage 2011;54(3):2033–2044. [DOI] [PMC free article] [PubMed] [Google Scholar]
- 22.Ronneberger O, Fischer P, Brox T. U-Net: Convolutional Networks for Biomedical Image Segmentation. In: Navab N, Hornegger J, Wells W, Frangi A, eds. Medical Image Computing and Computer-Assisted Intervention – MICCAI 2015. MICCAI 2015. Lecture Notes in Computer Science, vol 9351. Cham, Switzerland: Springer, 2015; 234–241. [Google Scholar]
- 23.Çiçek Ö, Abdulkadir A, Lienkamp SS, Brox T, Ronneberger O. 3D U-Net: Learning Dense Volumetric Segmentation from Sparse Annotation. In: Ourselin S, Joskowicz L, Sabuncu M, Unal G, Wells W, eds. Medical Image Computing and Computer-Assisted Intervention – MICCAI 2016. MICCAI 2016. Lecture Notes in Computer Science, vol 9901. Cham, Switzerland: Springer, 2016; 424–432. [Google Scholar]
- 24.Milletari F, Navab N, Ahmadi SA. V-net: Fully convolutional neural networks for volumetric medical image segmentation. In: 2016 Fourth International Conference on 3D Vision (3DV), Stanford, CA, October 25–28, 2016. Piscataway, NJ: IEEE, 2016; 565–571. [Google Scholar]
- 25.DeLong ER, DeLong DM, Clarke-Pearson DL. Comparing the areas under two or more correlated receiver operating characteristic curves: a nonparametric approach. Biometrics 1988;44(3):837–845. [PubMed] [Google Scholar]
- 26.Yasaka K, Akai H, Abe O, Kiryu S. Deep Learning with Convolutional Neural Network for Differentiation of Liver Masses at Dynamic Contrast-enhanced CT: A Preliminary Study. Radiology 2018;286(3):887–896. [DOI] [PubMed] [Google Scholar]
- 27.Lee H, Yune S, Mansouri M, et al. An Explainable Deep-Learning Algorithm for the Detection of Acute Intracranial Haemorrhage From Small Datasets. Nat Biomed Eng 2019;3(3):173–182. [DOI] [PubMed] [Google Scholar]
- 28.McDonald RJ, Schwartz KM, Eckel LJ, et al. The effects of changes in utilization and technological advancements of cross-sectional imaging on radiologist workload. Acad Radiol 2015;22(9):1191–1198. [DOI] [PubMed] [Google Scholar]
- 29.European Society of Radiology (ESR). Summary of the proceedings of the International Summit 2015: General and subspecialty radiology. Insights Imaging 2016;7(1):1–5. [DOI] [PMC free article] [PubMed] [Google Scholar]
Associated Data
This section collects any data citations, data availability statements, or supplementary materials included in this article.


![Comparison of radiologist performance to that of an artificial intelligence (AI) system. A, B, Jitter plots for the accuracy of the AI system for including, A, the correct top three differential diagnoses (T3DDx) and, B, correct top diagnosis (TDx) relative to the different groups of radiologists (radiology residents, general radiologists [General Rad], neuroradiology fellows [Neurorad fellows], and academic neuroradiologists [Academic Neurorads]). C, Nonparametric receiver operating characteristic (ROC) curves for the AI system (blue) compared with groups of radiologists based on their TDx, top two differential diagnoses, and T3DDx for each patient. D, E, Jitter plots for the accuracy of the AI system and radiologists for the, D, T3DDx and, E, exact correct TDx as a function of disease prevalence: common (black circle), moderately rare (gray square) and rare (white triangle). Solid lines denote the mean, and error bars represent standard error of measurement.](https://cdn.ncbi.nlm.nih.gov/pmc/blobs/ef05/8082339/d22d882b8567/ryai.2020190146.fig5.jpg)
