

Abstract
Background
Optimal intake levels of fruit and vegetables for maintaining long-term health is uncertain.
Methods
We followed 66,719 women from the Nurses’ Health Study (1984-2014) and 42,016 men from the Health Professionals Follow-up Study (1986-2014) who were free from cardiovascular disease (CVD), cancer and diabetes at baseline. Diet was assessed using a validated semi-quantitative food frequency questionnaire at baseline and updated every 2 to 4 years. We also conducted a dose-response meta-analysis, including results from our 2 cohorts and 24 other prospective cohort studies.
Results
We documented 33,898 deaths during the follow-up. After adjustment for known and suspected confounding variables and risk factors, we observed nonlinear inverse associations of fruit and vegetable intake with total mortality and cause-specific mortality due to cancer, CVD and respiratory disease (all P nonlinear <0.001). Intake of approximately 5 servings per day of fruit and vegetables, or 2 servings of fruit and 3 servings of vegetables, was associated with the lowest mortality, and above that level, higher intake was not associated with additional risk reduction. Compared to the reference level (2 servings/day), daily intake of 5 servings of fruit and vegetables was associated with hazard ratios [95% confidence interval (CI)] of 0.87 (0.85-0.90) for total mortality, 0.88 (0.83-0.94) for CVD mortality, 0.90 (0.86-0.95) for cancer mortality, and 0.65 (0.59-0.72) for respiratory disease mortality. The dose-response meta-analysis that included 145,015 deaths accrued in 1,892,885 participants yielded similar results (summary risk ratio of mortality for 5 servings/day=0.87, 95% CI, 0.85-0.88; P nonlinear <0.001). Higher intakes of most subgroups of fruits and vegetables were associated with lower mortality except for starchy vegetables such as peas and corn. Intakes of fruit juices and potatoes were not associated with total and cause-specific mortality.
Conclusions
Higher intakes of fruit and vegetable were associated with lower mortality; the risk reduction plateaued at approximately 5 servings of fruit and vegetables per day. These findings support current dietary recommendations to increase intake of fruits and vegetables, but not fruit juices and potatoes.
Keywords: Fruit, Vegetable, Mortality, Cardiovascular disease, Cancer, Diet
Introduction
Suboptimal intake of fruit and vegetable ranked among the top dietary contributors to the burden of disease and premature death in the US1 and worldwide.2 Despite recommendations in dietary guidelines to increase fruit and vegetable intake,3-5 the current average intake among US adults, one serving of fruit and 1.5 servings of vegetables per day, remains far from optimal.6
During recent decades, recommendations for fruit and vegetable intake have been evolving in the US. In the early 1990s, the ‘5-a-day’ campaign was launched to increase daily intake of fruit and vegetables to five servings or more in the US.7 In 2007, the ‘5-a-day’ message was dropped in favor of the ‘Fruit and Veggies - More Matters’ campaign in the US. The Healthy US-Style Eating Pattern recommended by the 2015-2020 Dietary Guidelines for Americans contains 2½ servings of vegetables and 2 servings of fruit per day.3 The recommended fruit and vegetable intakes also vary around the world. The World Health Organization,8 the World Cancer Research Fund9 and the National Health Service of England10 recommend five servings of fruit and vegetables per day, while the recommendations are six servings per day in Denmark and 8.5 servings per day in Australia.11, 12 These recommendations were largely based on studies that quantify the dose-response relationship between fruit and vegetable intake and disease risk. To comprehensively evaluate the net effects of fruit and vegetable intake on long-term health, information on mortality can be useful. However, evidence on the dose-response relationship between fruit and vegetable intake and mortality is limited and inconsistent. Recently, two meta-analyses investigated the dose-response relationship between fruit and vegetable intake and mortality, but reached different conclusions regarding the intake levels that were associated with the maximum benefits.13, 14 Wang el al. suggested no further reduction in mortality among those who consumed more than five servings of fruit and vegetables per day,14 whereas Aune et al. found that most of the reduction in mortality was achieved by five servings per day, but an additional small reduction was suggested up to daily intake of 10 servings.13
Current dietary recommendations generally treat all types of fruits and vegetables the same although they are heterogeneous in nutritional properties.15-17 For example, the Dietary Guidelines for Americans recommend increasing intakes of dark-green, red and orange, and starchy vegetables equivalently.3 In addition, various dietary recommendations include fruit juices and potatoes in the fruit and/or vegetable groups despite their relatively higher glycemic load and different nutrient content compared to other fruit and vegetables. Thus, it is important to investigate the potentially distinct health effects of various subgroups of fruit and vegetables, as well as fruit juices and potatoes.
We therefore examined the associations of fruit and vegetable intake with total and cause-specific mortality in two large ongoing prospective cohort studies with many repeated measurements of diet during up to 30 years of follow-up, the Nurses’ Health Study (NHS) and Health Professionals’ Follow-up Study (HPFS). We also conducted a dose-response meta-analysis that includes published data on fruit and vegetable intake and total mortality combined with results from the NHS and HPFS. We hypothesized that higher intakes of fruits and vegetables are associated with lower mortality in a non-linear dose-response manner.
Methods
Data Sharing
The data from the NHS and the HPFS are available through a request for external collaboration and upon approvals of a letter of intent and a research proposal. Details on how to request an external collaboration with the NHS and the HPFS can be found at https://www.nurseshealthstudy.org/researchers and https://sites.sph.harvard.edu/hpfs/for-collaborators/.
Study population
The NHS is a prospective cohort study that consisted of 121,700 registered female nurses aged 30 to 55 years in 1976. The HPFS is a prospective cohort study that recruited 51,529 male health professionals aged 40 to 75 years in 1986. For this analysis, the baseline was defined as 1984 for the NHS and 1986 for the HPFS, when comprehensive dietary questionnaires were first administered. At baseline and during the follow-up of both cohorts, questionnaires have been mailed to participants biennially to inquire about lifestyle risk factors, other exposures of interest, and newly diagnosed diseases. The end of follow-up was defined as 2014 for both cohorts. The cumulative follow-up of the two cohorts exceeds 90% of potential person-time. The study protocol was approved by the institutional review boards of the Brigham and Women’s Hospital and Harvard T.H. Chan School of Public Health, and those of participating registries as required. Return of completed self-administered questionnaires was accepted by the institutional review boards as implied informed consent.
We excluded participants with a history of diabetes, cardiovascular disease (CVD) or cancer, missing information on fruit and vegetable intake, or implausible total energy intake (<800 or >4200 kcal/d for men and <600 or >3500 kcal/d for women) at baseline. After exclusions, the analytical population consisted of 66,719 women and 42,016 men.
Dietary assessment
Dietary information was collected at baseline and updated every 2 to 4 years with validated semi-quantitative food frequency questionnaires (SFFQs).18 Participants reported their usual intake (never to ≥6 times per day) of a standard portion size (e.g., 0.5 cup of strawberries, 1 banana and 0.5 cup of cooked spinach) of fruit and vegetables over the preceding year on each SFFQ. Frequencies and portions of each individual fruit and vegetable item were converted to average daily intake for each participant. The reproducibility and validity of these SFFQs in measuring food intake have been documented in detail.18 The SFFQ performed reasonably well in ranking intakes of individual fruit and vegetable 19, 20. For example, the average Pearson correlation coefficients corrected for within-person weekly variation comparing SFFQ-measured intakes to those measured by multiple 7-day food records was 0.74 for fruits and 0.46 for vegetables in our previous validation study in the HPFS 20. Nutrient values were calculated based on the Harvard University Food Composition Database, which is updated every 4 years 21. We calculated average daily nutrient and total energy intakes by multiplying the frequency of intake of each item by its nutrient content and summing across all foods. For this analysis, we used dietary information collected a total of eight times in the NHS and seven times in the HPFS. To assess the overall quality of diet, we applied a modified version of the Alternate Healthy Eating Index22 (excluding components for fruit, vegetables and alcohol) that scored eight components of a healthy dietary pattern including whole grains, sugar-sweetened beverages and fruit juice, nuts and legumes, red/processed meat, trans fat, long-chain n-3 polyunsaturated fatty acids, polyunsaturated fatty acids and sodium.
Ascertainment of death
We performed systematic searches of state vital records and the National Death Index, supplemented by reports from family members or postal authorities. More than 98% of the deaths in each cohort were identified.23 The classification of the cause of death was mostly based on review of medical records. A physician reviewed medical records and death certificates to classify the cause of death according to the eighth and ninth revisions of the International Classification of Diseases.
Statistical analysis
To best represent long-term intake and dampen within-person variation in the NHS and HPFS cohorts, we calculated cumulative average intakes of fruit and vegetables up to the start of each two-year follow-up interval. The main exposures of interest included intakes of fruit and vegetables combined, total fruits, and total vegetables. In this study, tofu and soybeans, French fried potatoes, whole or mashed potatoes, juices and foods with small serving sizes (red chili sauce, garlic, and mushrooms) were not included in the fruit and vegetables. Because the diagnosis of intermediate outcomes, including hypertension, hypercholesterolemia, diabetes, CVD, and cancer, in a follow-up cycle resulted in a subsequent change in fruit and vegetable intake, we stopped updating diet before the diagnosis of an intermediate outcome. Secondarily, we analyzed subgroups of fruit and vegetables, including green leafy vegetables, non-starchy vegetables, starchy vegetables, cruciferous vegetables, citrus fruit, and vitamin C rich and β carotene rich fruit and vegetables. We also examined the associations of intakes of fruit juices and potatoes with mortality in secondary analyses. We categorized intakes of fruit and vegetables and their subgroups, fruit juices and potatoes into quintiles, quartiles or tertiles based on their population distributions.
Person-years of follow-up were calculated from baseline to the earliest of time of death, loss to follow-up or the end of follow-up. Cox proportional hazards models were applied to estimate hazard ratios (HRs) and their 95% CIs of mortality comparing participants in each category to the lowest category of intake with simultaneous adjustment for age, race/ethnicity, physical activity level, smoking status, alcohol intake, multivitamin use, aspirin use, family histories of myocardial infarction, diabetes and cancer, total energy intake, menopausal status and hormone use in women, baseline body-mass index (BMI), baseline histories of hypertension and hypercholesterolemia, and the modified Alternate Healthy Eating Index. To quantify a linear trend across categories of intake, we assigned the median within each category and modeled this variable continuously; the Wald test was used for statistical significance. We examined the possibly non-linear relation between fruit and vegetable intake and mortality non-parametrically with restricted cubic splines with 3 knots 24 and used 2 servings of fruit and vegetables/day, 0.5 servings of fruit/day and 1.5 servings of vegetables /day as reference levels for calculating relative risk. We tested nonlinearity in the dose-response relationship between fruit and vegetable intake and mortality by comparing the model with only the linear term to the model with the linear and the cubic spline terms and using the likelihood ratio test. Although a significant P-value for nonlinearity indicated that a nonlinear dose-response relationship fitted the data better than a linear relationship, we also presented P-values for linearity for the purpose of comparison with previous publications. We examined whether the association between fruit and vegetable intake and mortality varied by subgroups defined by smoking status, baseline age, baseline BMI, and baseline histories of hypercholesterolemia and hypertension. The interaction between these stratification variables and intake level was evaluated using the likelihood ratio test for the cross-product terms of dichotomous stratification variables and indicator variables for quintiles of fruit and vegetable intake. We performed sensitivity analyses to test the robustness of our findings. First, we conducted lagged analyses by excluding the first 4 years of follow-up data and adding a 4-year lag period between assessment of dietary intake and each follow-up period to address concern that chronic disease occurrence in the years that preceded death may influence dietary behavior. Second, we continued updating diet and repeated the dose-response analysis instead of stopping updating diet before the diagnosis of an intermediate outcome. Third, we examined the dose-response relationship of fruit and vegetable intake assessed at baseline with total mortality. Lastly, we repeated the doses-response analysis in a study population without excluding participants with histories of CVD, cancer and diabetes at baseline and further adjusted for the baseline histories of the three diseases in the model. An inverse-variance-weighted fixed-effect meta-analysis was used to combine the results across the two cohorts. We performed the data analyses using SAS software version 9.4 (SAS Institute, North Carolina) at a two-tailed α value of 0.05.
Dose-response meta-analysis
We performed systematic searches in Medline and Embase (through September 2018) using both truncated free texts and Mesh terms relevant to "Fruit", "Vegetables", "Death", and "Mortality " (Table I in the Supplement). In addition, we manually searched the bibliographies of key retrieved articles and relevant reviews. The included studies met the following criteria: 1) prospective design, 2) fruit and /or vegetable intake as exposure, 3) total mortality as the outcome, 4) detailed information on dietary assessment method, 5) at least three categories of fruit and/or vegetable intake, 6) relative risks (RRs) and the corresponding confidence intervals (CIs) available, and 7) description of covariables in the statistical models available. The data extraction was done by two authors (DDW and YL) independently. The following information was extracted: author, year of publication year, cohort name, country /region, length of follow-up period, sample size, baseline age, number of deaths, dietary assessment method, fruit and vegetable intake categories/levels, RRs (95% CIs) and covariables in the fully adjusted model. To assess the risk of bias of the included studies, we used the Newcastle-Ottawa scale25, 26. We assigned the reported median to each intake category. If median values of each category were not reported, we assigned the midpoint of the lower and upper bounds. If the highest /lowest category of intake was open-ended, we used the width of the adjacent interval to calculate an upper or lower cut-off of the category. We converted fruit and vegetable intake in grams into servings using 80 g as a standard serving size. To examine the association between fruit and vegetable intake and total mortality, we applied a two-stage random-effects dose-response meta-analysis developed by Greenland and Longnecker27 with the use of restricted cubic splines to flexibly model potentially nonlinear associations.28 The first stage of the meta-analysis estimated the dose-response association between fruit and vegetable intake and the log RRs in each included study. The study-specific estimates were then combined in the second stage of this meta-analysis. The reference intake levels used in this dose-response meta-analysis were the same as those used in the restricted cubic spline models in NHS and HPFS. We applied the method described in Greenland and Longnecker27 to convert RRs associated with categories of fruit and vegetable intake into RRs associated with a 1-serving increment in fruit and vegetable intake as inputs for the following small sample bias analysis and meta regression. Given that the conversion was based on an assumption of linear dose-response relationship, RRs generated by the conversions tended to approach the null if the actual dose-response relationship was nonlinear. We assessed bias due to small studies by using Begg’s test and Egger’s test, and visual appreciation of a funnel plot. When significant bias due to small studies was present, we examined the dose-response relationship between fruit and vegetable intake and total mortality after excluding studies with less than 500 deaths. We quantified the proportion of the total variation due to between-study heterogeneity using I2 and the Cochran’s Q test. When heterogeneity was considered to be present, we conducted meta-regressions to explore potential sources of heterogeneity among characteristics of included studies including study quality (Newcastle-Ottawa scale), dietary assessment tools [food frequency questionnaires (FFQs) vs. other dietary assessment tools], range of intake level and statistical adjustment for confounding factors, follow-up time, and number of dietary assessments (baseline only compared with repeated measures). We conducted this meta-analysis following the Preferred Reporting Items for Systematic Reviews and Meta-analyses guidelines29 (Table II in the Supplement) and using R software version 3.6.1 (R Foundation for Statistical Computing).
Results
Characteristics of study population
During 30 years of follow-up in the NHS (1,822,058 person-years), we documented 18,793 deaths; during 28 years of follow-up in the HPFS (1,033,007 person-years), we documented 15,105 deaths. Participants with a higher intake of fruit and vegetables were older and more likely to use multivitamin, and had higher total energy intake, dietary quality, physical activity level and prevalence of hypercholesterolemia, but were less likely to be current smoker and had lower alcohol intake (Table 1). In women, fruit and vegetable intake was positively associated with prevalence of current menopausal hormone use and family histories of myocardial infarction, diabetes, and cancer. The average intakes of fruit and vegetables were generally stable over time in the two cohorts (Figure I in the Supplement).
Table 1.
Age-adjusted characteristics of men and women across levels of fruit and vegetable intakes *.
| Quintiles of fruit and vegetable intake | |||||
|---|---|---|---|---|---|
| Q1 | Q2 | Q3 | Q4 | Q5 | |
| Nurses' Health Study | |||||
| Person-years | 364165 | 364492 | 364462 | 364562 | 364377 |
| Intake level, servings/day | 2.0±0.5 | 3.3±0.3 | 4.2±0.3 | 5.3±0.4 | 7.9±1.9 |
| Baseline age, year | 48.5±7.0 | 49.2±7.1 | 49.8±7.1 | 50.3±7.1 | 51.1±7.0 |
| Baseline BMI, kg/m2 | 25.0±4.9 | 24.8±4.5 | 24.8±4.5 | 24.8±4.4 | 24.7±4.4 |
| Alcohol, g/day | 5.8±11.1 | 5.8±10.4 | 5.9±10.1 | 5.8±9.7 | 5.6±9.3 |
| Modified Alternate Healthy Eating Index † | 33.2±8.0 | 33.7±8.1 | 34.5±8.2 | 35.3±8.4 | 36.9±8.6 |
| Moderate/vigorous physical activity, h/wk | 2.3±1.9 | 2.5±2.0 | 2.8±2.0 | 3.0±2.1 | 3.5±2.4 |
| Current smoking, % | 17.9 | 13.2 | 11.3 | 9.3 | 8.1 |
| Premenopausal, % | 11.8 | 12.2 | 12.0 | 11.8 | 11.6 |
| Current menopausal hormone use, % | 25.2 | 26.4 | 27.5 | 28.1 | 28.3 |
| Multivitamin use, % | 51.7 | 55.0 | 56.2 | 57.7 | 58.8 |
| Aspirin use, % | 50.1 | 51.7 | 52.3 | 52.1 | 51.7 |
| Family history, % | |||||
| Myocardial infarction | 9.6 | 9.6 | 9.5 | 9.3 | 9.6 |
| Diabetes | 28.6 | 28.7 | 28.7 | 28.7 | 29.4 |
| Cancer | 13.6 | 14.0 | 14.4 | 14.7 | 15.4 |
| Baseline history, % | |||||
| Hypercholesterolemia | 8.9 | 7.8 | 7.0 | 7.1 | 7.7 |
| Hypertension | 24.2 | 20.4 | 18.1 | 17.6 | 18.1 |
| Health Professionals Follow-Up Study | |||||
| Person-years | 206434 | 206624 | 206764 | 206971 | 206214 |
| Intake level, servings/day | 1.9±0.5 | 3.2±0.3 | 4.2±0.3 | 5.4±0.4 | 8.4±2.4 |
| Baseline age, year | 50.1±8.7 | 51.0±8.9 | 51.7±9.1 | 52.4±9.2 | 53.4±9.4 |
| Baseline BMI, kg/m2 | 25.6±3.3 | 25.5±3.2 | 25.4±3.2 | 25.3±3.1 | 25.4±3.5 |
| Alcohol, g/day | 12.1±16.7 | 12±15.7 | 11.5±15.1 | 11.1±14.2 | 10.4±13.8 |
| Modified Alternate Healthy Eating Index | 32.1±7.7 | 33.8±7.6 | 34.7±7.6 | 36.1±7.7 | 37.7±7.5 |
| Moderate/vigorous physical activity, h/wk | 2.2±3.2 | 2.7±3.6 | 3.1±4.0 | 3.6±4.3 | 4.4±4.9 |
| Current smoking, % | 10.3 | 7.3 | 5.8 | 4.4 | 3.9 |
| Multivitamin use, % | 47.7 | 49.4 | 51.3 | 52.4 | 53.1 |
| Aspirin use, % | 53.1 | 54.4 | 54.4 | 53.7 | 51.2 |
| Family history, % | |||||
| Myocardial infarction | 31.0 | 31.3 | 31.3 | 31.6 | 33.3 |
| Diabetes | 18.9 | 20.5 | 20.7 | 20.4 | 20.5 |
| Cancer | 34.2 | 33.9 | 35.7 | 34.9 | 34.9 |
| Baseline history, % | |||||
| Hypercholesterolemia | 9.7 | 9.7 | 9.6 | 9.9 | 11.6 |
| Hypertension | 18.9 | 18.3 | 17.0 | 16.4 | 18.2 |
Values are means ± standard deviations for continuous variables and percentages for categorical variables. All variables except age were age-standardized.
The modified Alternate Healthy Eating Index included eight component scores for whole grains, nuts and legumes, long-chain n-3 polyunsaturated fats, total polyunsaturated fats, sugar-sweetened beverage and juices, red/processed meat, trans fat and sodium.
Fruit and vegetable intake and total mortality in NHS and HPFS
Table 2 shows a nonlinear inverse association between intake of fruit and vegetables and total mortality (P nonlinear <0.001). Compared to the lowest quintile of fruit and vegetable intake, HRs (95% CI) of total mortality were 0.95 (0.92-0.99) for the second quintile, 0.89 (0.86-0.92) for the third quintile, 0.88 (0.85-0.91) for the fourth quintile, and 0.89 (0.86-0.93) for the fifth quintile in the fully adjusted model. Intake of approximately 5 servings of fruits and vegetables daily was associated with the lowest total mortality and above that level, higher intakes were not associated with further risk reductions (Figure 1). The restricted cubic spline analysis yielded a HR of 0.87 (95% CI, 0.85-0.90) associated with comparing 5 servings/day of fruit and vegetable intake to the reference intake level (2 servings/day). The intakes of total fruits and total vegetables were each inversely associated with total mortality in a significantly nonlinear manner (both P nonlinear <0.001, Table 2 and Figure 1). The HRs of total mortality did not decrease further above approximately 2 servings of fruit and 3 servings of vegetables per day; the HRs (95% CI) were 0.88 (0.86-0.91) for 2 servings of fruit per day and 0.94 (0.92-0.97) for 3 servings of vegetables per day (reference intake levels: 0.5 servings of fruit/day and 1.5 servings of vegetables /day, Figure 1).The association between fruit and vegetable intake and total mortality was generally consistent across different subgroups defined by age, smoking, BMI, hypertension and hypercholesterolemia (all P interaction >0.05, Table III in the Supplement). The nonlinear dose-response relationships between intakes of fruit and vegetables remained largely unchanged in the four sensitivity analyses (Figure II in the Supplement).
Table 2.
Associations between fruit and vegetable intakes and total mortality in the Nurses’ Health Study and the Health Professionals Follow-Up Study.
| Quintiles of intake | P trend | ||||||
|---|---|---|---|---|---|---|---|
| Q1 | Q2 | Q3 | Q4 | Q5 | Linear* | Non-linear† | |
| All fruits and vegetables | |||||||
| NHS | |||||||
| Median (IQR), servings/day | 2.1 (1.7-2.5) | 3.3 (3.0-3.5) | 4.2 (4.0-4.5) | 5.3 (5.0-5.7) | 7.3 (6.6-8.5) | ||
| Deaths / person-years | 3853/364165 | 3702/364492 | 3702/364462 | 3634/364562 | 3902/364377 | ||
| Incidence rate, per 104 person-years | 106 | 102 | 102 | 100 | 107 | ||
| Age-adjusted model | Ref. | 0.86 (0.82, 0.90) | 0.78 (0.74, 0.81) | 0.72 (0.69, 0.75) | 0.72 (0.69, 0.75) | <.001 | <.001 |
| Multivariable-adjusted model | Ref. | 0.96 (0.91, 1.00) | 0.90 (0.86, 0.94) | 0.87 (0.83, 0.92) | 0.89 (0.84, 0.93) | <.001 | <.001 |
| HPFS | |||||||
| Median (IQR), servings/day | 2.0 (1.6-2.4) | 3.2 (2.9-3.4) | 4.2 (3.9-4.4) | 5.4 (5.0-5.8) | 7.6 (6.8-9.1) | ||
| Deaths / person-years | 2800/206434 | 2910/206624 | 2915/206764 | 3088/206971 | 3392/206214 | ||
| Incidence rate, per 104 person-years | 136 | 141 | 141 | 149 | 164 | ||
| Age-adjusted model | Ref. | 0.91 (0.86, 0.96) | 0.81 (0.77, 0.86) | 0.80 (0.76, 0.84) | 0.80 (0.76, 0.84) | <.001 | <.001 |
| Multivariable-adjusted model | Ref. | 0.95 (0.90, 1.00) | 0.88 (0.83, 0.92) | 0.89 (0.84, 0.94) | 0.90 (0.85, 0.95) | <.001 | <.001 |
| Pooled | |||||||
| Age-adjusted model | Ref. | 0.88 (0.85, 0.91) | 0.79 (0.77, 0.82) | 0.75 (0.73, 0.78) | 0.75 (0.73, 0.78) | <.001 | <.001 |
| Multivariable-adjusted model | Ref. | 0.95 (0.92, 0.99) | 0.89 (0.86, 0.92) | 0.88 (0.85, 0.91) | 0.89 (0.86, 0.93) | <.001 | <.001 |
| Fruits | |||||||
| NHS | |||||||
| Median (IQR), servings/day | 0.4 (0.3-0.6) | 0.9 (0.8-1.0) | 1.3 (1.2-1.4) | 1.8 (1.6-2.0) | 2.7 (2.4-3.3) | ||
| Deaths / person-years | 3918/365137 | 3454/363630 | 3576/364225 | 3694/366632 | 4151/362434 | ||
| Incidence rate, per 104 person-years | 107 | 95 | 98 | 101 | 115 | ||
| Age-adjusted model | Ref. | 0.77 (0.74, 0.81) | 0.72 (0.69, 0.75) | 0.67 (0.64, 0.70) | 0.68 (0.65, 0.71) | <.001 | <.001 |
| Multivariable-adjusted model | Ref. | 0.89 (0.85, 0.93) | 0.88 (0.84, 0.92) | 0.86 (0.82, 0.90) | 0.90 (0.86, 0.95) | 0.004 | <.001 |
| HPFS | |||||||
| Median (IQR), servings/day | 0.4 (0.2-0.5) | 0.9 (0.7-1.0) | 1.3 (1.2-1.5) | 1.9 (1.7-2.1) | 3.1 (2.6-3.8) | ||
| Deaths / person-years | 2580/199654 | 2851/213708 | 2918/206857 | 3180/207037 | 3576/205751 | ||
| Incidence rate, per 104 person-years | 129 | 133 | 141 | 154 | 174 | ||
| Age-adjusted model | Ref. | 0.87 (0.82, 0.92) | 0.79 (0.75, 0.83) | 0.76 (0.72, 0.80) | 0.74 (0.70, 0.78) | <.001 | <.001 |
| Multivariable-adjusted model | Ref. | 0.94 (0.89, 1.00) | 0.90 (0.86, 0.96) | 0.90 (0.85, 0.95) | 0.88 (0.83, 0.94) | <.001 | <.001 |
| Pooled | |||||||
| Age-adjusted model | Ref. | 0.81 (0.79, 0.84) | 0.75 (0.72, 0.78) | 0.71 (0.68, 0.73) | 0.70 (0.68, 0.73) | <.001 | <.001 |
| Multivariable-adjusted model | Ref. | 0.91 (0.88, 0.95) | 0.89 (0.86, 0.92) | 0.88 (0.84, 0.91) | 0.90 (0.86, 0.93) | <.001 | <.001 |
| Vegetables | |||||||
| NHS | |||||||
| Median (IQR), servings/day | 1.4 (1.1-1.6) | 2.2 (2.0-2.3) | 2.8 (2.7-3.0) | 3.6 (3.4-3.8) | 5.0 (4.5-5.8) | ||
| Deaths / person-years | 3933/364056 | 3838/364319 | 3645/364560 | 3617/364618 | 3760/364504 | ||
| Incidence rate, per 104 person-years | 108 | 105 | 100 | 99 | 103 | ||
| Age-adjusted model | Ref. | 0.92 (0.88, 0.96) | 0.82 (0.79, 0.86) | 0.78 (0.75, 0.82) | 0.78 (0.75, 0.82) | <.001 | <.001 |
| Multivariable-adjusted model | Ref. | 1.02 (0.97, 1.06) | 0.96 (0.92, 1.01) | 0.94 (0.90, 0.99) | 0.95 (0.90, 1.00) | 0.004 | <.001 |
| HPFS | |||||||
| Median (IQR), servings/day | 1.3 (1.0-1.5) | 2.1 (1.9-2.2) | 2.7 (2.5-2.9) | 3.5 (3.3-3.8) | 5.1 (4.5-6.0) | ||
| Deaths / person-years | 3034/206139 | 2939/206729 | 2930/206908 | 3056/206820 | 3146/206411 | ||
| Incidence rate, per 104 person-years | 147 | 142 | 142 | 148 | 152 | ||
| Age-adjusted model | Ref. | 0.92 (0.88, 0.97) | 0.86 (0.82, 0.91) | 0.87 (0.83, 0.92) | 0.85 (0.81, 0.89) | 0.002 | <.001 |
| Multivariable-adjusted model | Ref. | 0.96 (0.91, 1.01) | 0.93 (0.88, 0.98) | 0.96 (0.91, 1.02) | 0.95 (0.90, 1.00) | 0.17 | 0.01 |
| Pooled | |||||||
| Age-adjusted model | Ref. | 0.92 (0.89, 0.95) | 0.84 (0.81, 0.87) | 0.82 (0.80, 0.85) | 0.81 (0.78, 0.84) | <.001 | <.001 |
| Multivariable-adjusted model | Ref. | 0.99 (0.96, 1.03) | 0.95 (0.92, 0.98) | 0.95 (0.92, 0.99) | 0.95 (0.91, 0.98) | 0.002 | <.001 |
Abbreviations: NHS, Nurses’ Health Study; HPFS, Health Professional Follow-up Study; IQR, inter-quartile range
Multivariable model adjusted for age (in month), Caucasian (yes vs. no), moderate-vigorous physical activity (0, 0.1-0.9, 1.0-3.4, 3.5-5.9, ≥6 hours per week), smoking status (never, past, current 1-14 cigarettes/d, current 15-24 cigarettes/d, current ≥25 cigarettes/d), alcohol intake (women: 0, 0.1-4.9, 5.0-14.9, ≥15 g/d; men: 0, 0.1-4.9, 5.0-29.9, ≥30 g/d), multivitamin use (yes vs. no), current aspirin use (yes vs. no), family history of myocardial infarction (yes vs. no), family history of diabetes (yes vs. no), family history of cancer (yes vs. no), total energy intake (quintiles), menopausal status and hormone use in women (premenopausal, postmenopausal never users, postmenopausal past users, postmenopausal current users), baseline body-mass index (<23, 23-24.9, 25-29.9, 30-34.9, ≥35 kg/m2), baseline history of hypertension (yes vs. no), baseline history of hypercholesterolemia (yes vs. no), the modified Alternate Healthy Eating Index (quintiles). The models for intake of vegetables or fruits also mutually adjusted for each other.
Results for NHS and HPFS from the multivariate model were combined using the fixed-effect model.
Test for linear trend calculated by assigning the median intake in each quintile and modeling this as a continuous variable in regression models.
Test for nonlinear relationship was evaluated with a likelihood ratio test comparing the model with fruit and vegetable intake as a linear term and cubic restricted spline variables to the model with covariates only. Nonlinear tests are presented when significant deviation from linearity was detected (P <0.05), based on the likelihood ratio test, comparing the model with only the linear term with the model with the linear and the cubic spline terms. A significant P-value for nonlinearity indicated that a nonlinear dose-response relationship fitted the data better than a linear relationship. The restricted cubic spline Cox proportional hazards regressions were performed in the NHS and the HPFS separately, and in a dataset that pooled data from both the NHS and the HPFS.
Figure 1.
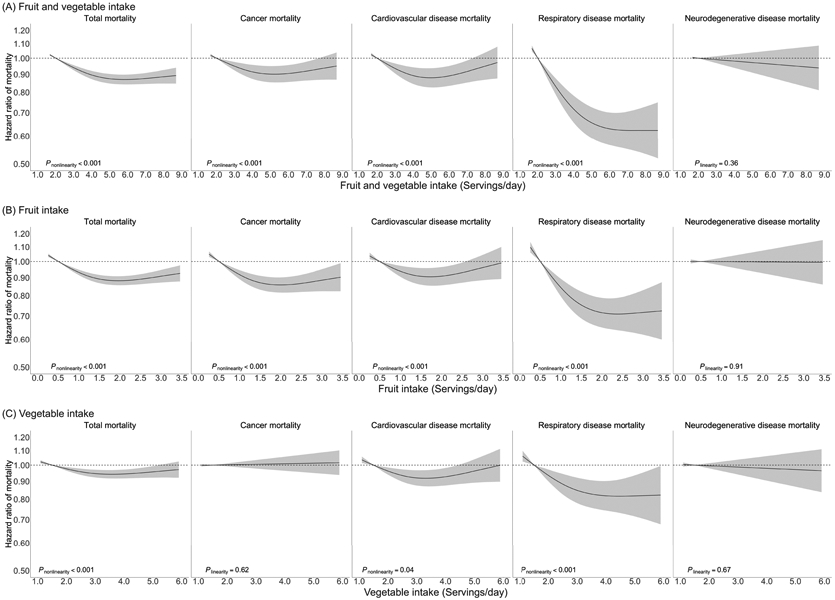
Dose-response association between fruit and vegetable intake and mortality in the Nurses’ Health Study and the Health Professionals Follow-Up Study. (A) Dose-response associations of combined fruit and vegetable intake with total and cause-specific mortality. (B) Dose-response associations of fruit intake with total and cause-specific mortality. (C) Dose-response associations of vegetable intake with total and cause-specific mortality.
Dose-response associations of fruit and vegetable intake with total and cause-specific mortality were estimated by restricted cubic spline Cox proportional-hazards model in a dataset that pooled data from both the Nurses’ Health Study and the Health Professionals Follow-Up Study.
Multivariable model adjusted for age (in month), Caucasian (yes vs. no), moderate-vigorous physical activity (0, 0.1-0.9, 1.0-3.4, 3.5-5.9, ≥6 hours per week), smoking status (never, past, current 1-14 cigarettes/d, current 15-24 cigarettes/d, current ≥25 cigarettes/d), alcohol intake (women: 0, 0.1-4.9, 5.0-14.9, ≥15 g/d; men: 0, 0.1-4.9, 5.0-29.9, ≥30 g/d), multivitamin use (yes vs. no), current aspirin use (yes vs. no), family history of myocardial infarction (yes vs. no), family history of diabetes (yes vs. no), family history of cancer (yes vs. no), total energy intake (quintiles), menopausal status and hormone use in women (premenopausal, postmenopausal never users, postmenopausal past users, postmenopausal current users), baseline body-mass index (<23, 23-24.9, 25-29.9, 30-34.9, ≥35 kg/m2), history of hypertension (yes vs. no), history of hypercholesterolemia (yes vs. no), the modified Alternate Healthy Eating Index (quintiles). All models, except that for total fruit and vegetable intake, also mutually adjusted for fruit intake and vegetable intake (in quintiles).
Dose-response meta-analysis on fruit and vegetable intake and total mortality
The dose-response meta-analysis included 25 publications from 24 prospective cohort studies30-53 and the results from the NHS and the HPFS (Figure III in the Supplement). The results from the Shanghai Women’s Health Study were in two publications45, 53. During follow-ups ranging from 4.6 to 30 years, 145,015 deaths accrued in 1,892,885 participants from 29 countries / territories in North and South America, Europe, Asia, Africa and Australia (Table IV in the Supplement and Figures IV-VI in the Supplement). Based on the Newcastle-Ottawa scale, 17 studies obtained a score of at least seven and were considered at low risk of bias (Table V in the Supplement). Similar to the findings in the NHS and HPFS, the lowest risk of total mortality was observed for a daily intake of approximately 5 servings of fruit and vegetables, 2 servings of fruit and 3 servings of vegetables, and above those levels, higher intake was associated with minimal additional risk reduction (all P nonlinear <0.001, Figure 2). The summary RRs (95% CI) were 0.87 (0.85-0.88) for 5 servings of fruit and vegetables per day, 0.88 (0.87-0.90) for 2 servings of fruit per day, and 0.93 (0.92-0.94) for 3 servings of vegetables per day (reference levels: 2 servings/day of fruit and vegetables, 0.5 servings/day of fruit, and 1.5 servings/day of vegetables). We found considerable between-study heterogeneity (Figure IV-VI in the Supplement), as well as evidence of bias due to small studies with smaller studies yielding more extreme estimates (Figures VII-IX in the Supplement). Differences in dietary assessment tools (FFQs vs. other tools), range of intake level and statistical adjustment for confounding factors were major sources of heterogeneity (Table VI in the Supplement). Studies that captured relatively wider range of long-term fruit and vegetable intake as measured by FFQs and sufficiently addressed the issue of confounding were more likely to identify non-linear dose-response relationships between fruit and vegetable intake and mortality. We found no evidence of significant bias due to small studies for the associations of fruit intake and vegetable intake with total mortality (Figures X-XI in the Supplement) and attenuated bias due to small studies for the association between fruit and vegetable intake and total mortality (Figure XII in the Supplement) after excluding studies with less than 500 deaths, while the observed nonlinear dose-response associations were largely unchanged after the exclusions (Figure XIII in the Supplement).
Figure 2.
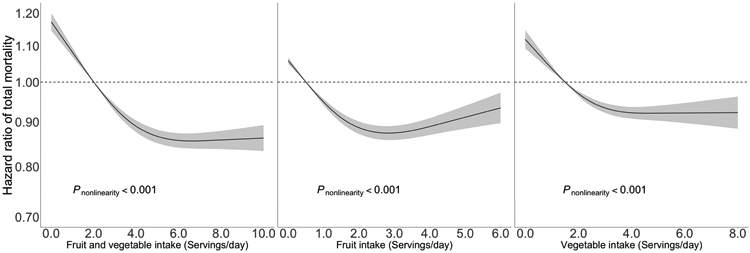
Association between fruit and vegetable intake and total mortality in the dose-response meta-analysis based on 24 published studies, the Nurses’ Health Study and the Health Professionals’ Follow-Up Study. Dose-response relationship between fruit and vegetable intake and total mortality was estimated by the two-stage dose-response meta-analysis with the use of restricted cubic splines.
Fruit and vegetable intake and cause-specific mortality in NHS and HPFS
Similar to that with total mortality, the dose-response relationships of fruit and vegetable intake with cancer, CVD, and respiratory disease mortality were significantly nonlinear (Figure 1, all P nonlinear <0.001) and showed a threshold of approximately 5 servings per day. Compared to the reference intake level (2 servings/day), 5 servings of fruit and vegetable per day was associated with HRs (95% CI) of 0.88 (0.83-0.94) for CVD mortality, 0.90 (0.86-0.95) for cancer mortality, and 0.65 (0.59-0.72) for respiratory disease mortality. Participants who consumed about 2 servings of fruit and 3 servings of vegetables daily showed the lowest risks of cancer, CVD and respiratory disease mortality.
Intakes of most fruit and vegetable subgroups, including green leafy vegetables, non-starchy vegetables, cruciferous vegetables, citrus fruit, vitamin C rich and β carotene rich fruit and vegetables, were inversely associated with total mortality (Table VII in the Supplement), whereas a higher intake of starchy vegetables was not associated with a lower risk of mortality. Intakes of fruit juices and potatoes were not associated with total and cause-specific mortality.
Discussion
In the two prospective cohorts with many repeated measurements of diet and up to 30 years of follow-up, we observed that a higher intake of fruit and vegetables was associated a lower risk of total mortality and cause-specific mortality in a nonlinear manner. Our analysis in the NHS and the HPFS and in a meta-analysis of 26 prospective cohort studies documented that intake of approximately 5 servings of fruits and vegetables daily was associated with the lowest mortality, and higher intake was not associated with additional risk reductions in mortality. The thresholds of risk reduction in mortality were 2 servings daily for fruit intake and 3 servings daily for vegetable intake. Higher intakes of most subgroups of fruit and vegetable were inversely associated with mortality, whereas intakes of starchy vegetables, fruit juices and potatoes were not associated with mortality.
Our finding on fruit and vegetable intake and total mortality was consistent with a meta-analysis of 16 prospective cohort studies and a large investigation in 451,151 participants from 10 European countries, in which the largest risk reduction in total mortality was found for a daily intake of approximately 5 servings of fruit and vegetables.14, 41 These nonlinear relationships with a threshold effect are biologically plausible because that the bioactive components of fruit and vegetables, such as carotenoids, vitamin C and polyphenols, have limits in absorption, transport, metabolism, or storage, and their effects may be mediated by enzyme activities that can be saturated.54 In another recent meta-analysis, Aune et al. reported that a risk reduction was mostly achieved by five servings per day with additional but slight benefits up to 10 servings of daily intake of fruit and vegetables.13 It should be noted that our updated meta-analysis incorporated more studies, including several recent large investigations35, 43 and our two large cohorts, than the previous ones,13, 14 rendering us a greater power to delineate a dose-response relationship.
Our study provided additional data supporting nonlinear associations with cause-specific mortality due to major chronic diseases, including cancer, CVD and respiratory disease, and maximal benefit with intakes of approximately 5 servings of fruit and vegetables per day also held for the cause-specific mortality. Consistent with previous studies on CVD mortality14 and incidence of stroke55 and coronary heart disease,56 we found an inverse association between fruit and vegetable intake and CVD mortality. Fruit and vegetables are major sources of potassium. Increased intake of potassium intake, in particular a high potassium / sodium ratio, has been linked to low blood pressure57. In addition, other nutrients and bioactive compounds in fruit and vegetables, such as magnesium, fiber and polyphenols, may act synergistically or additively to delay the progression of atherosclerotic lesions, as well as reduce platelet aggregation, modulate lipid profiles and lower blood pressure.58 Protective effects of fruit and vegetable intake against total cancer risk were uncertain, particularly for hormone dependent cancers such as breast and prostate cancer.59 The updated report from the World Cancer Research Fund /American Institute for Cancer Research stated that evidence that high intakes of fruit and vegetables decrease the risk for cancers at different sites were only either ‘probable’ or ‘limited suggestive’.9 Our data supported that high intake of fruit, but not vegetables, may confer a protective effect against cancer mortality. A possible explanation for this discrepancy is that the induction period for some cancers may be longer than the follow-up period in the previous studies because the development of cancer is a multistage process that takes place over several decades, while the follow-up in our cohorts might have reached the sufficiently long duration to detect the protective effects. In addition, recent evidence suggests that higher intakes of fruits and vegetables may specifically reduce subgroups of breast cancer that are more aggressive and likely to be lethal,60 which may be missed in studies of cancer incidence.
Previous data on fruit and vegetable intake and mortality due to respiratory disease are sparse. A recent report from the European Prospective Investigation into Cancer and Nutrition found an inverse association between fruit and vegetable intake and respiratory disease mortality in men only,61 while our data suggested a strong inverse association for respiratory disease mortality in both men and women. Several lines of evidence suggested that higher fruit and vegetable intake may improve lung function and prevent respiratory obstructive disease through anti-oxidative and anti-inflammatory pathways.62, 63 In addition, our previous study found that a healthy dietary pattern high in fruit and vegetables was associated a lower risk of chronic obstructive pulmonary disease.64 Of note, these findings are novel and therefore require confirmation in further studies. While some evidence suggests a role of fruit and vegetable intake in delaying cognitive function decline and preventing dementia,65, 66 we did not find an association between fruit and vegetable intake and neurodegenerative disease mortality.
Our findings suggest that subgroups of fruits and vegetables may have heterogeneous health impacts. Higher intake of starchy vegetables may not confer the same health benefits as other fruits and vegetables. These findings are consistent with previous studies on multiple disease outcomes, including coronary heart disease and type 2 diabetes, as well as body weight and hypertension.15, 17, 67, 68 The observed null association for intakes of starchy vegetables may be due to their higher glycemic load which has been related to elevated risks of major chronic diseases.69 In addition, starchy vegetables such as peas and corn are often processed by canning in the US, which may lead to a pronounced loss of antioxidant activity.70 Higher intakes of fruit juices and potatoes were not associated with decreased mortality. We previously linked higher intakes of potatoes and fruit juices to body weight gain and increase risk of type 2 diabetes.17, 71 Beyond their high glycemic load values and reduced nutrient content during production, juices, as fluids, may lead to more rapid and pronounced increases in postprandial blood glucose and insulin than whole fruits and vegetables without significantly enhancing appetite.72 It should be noted that certain types of juice, such citrus juice, may have higher levels of antioxidant activity and ability of lowering atherogenic lipids than other juices.73 Similarly, potatoes have high glycemic load values due to their predominantly starch content.74 Our findings do not support the current Dietary Guidelines for Americans and federal nutrition assistance programs’ positions on treating all types of fruit and vegetables the same and including juices and potatoes into the fruit and vegetable groups, without considering their potentially differential nutritional properties and health effects.3
Our results have several limitations. First, the magnitude of the observed associations could be underestimated due to reverse causation, because people with chronic disease and poor health might change their diets toward a diet generally perceived to be healthier. However, we excluded participants with known major chronic diseases at baseline and stopped updating diet at the beginning of the interval in which participants had the intermediate disease outcome. In addition, our findings remain largely unchanged when we excluded the first 4 years of follow-up or added a 4-year lag period between dietary assessment and each follow-up period. Secondly, although our SFFQs collected detailed information on fruit and vegetable intakes, measurement errors are inevitable in estimates of food and nutrient intakes. It is possible that participants within the range of higher intake levels tended to over-report their fruit and vegetable intake, which may limit our ability to clearly distinguish the intakes of vs. higher than five servings per day. Therefore, we cannot entirely rule out the possibility of some modest benefits above five servings of fruit and vegetable intake per day, although the results for intake higher than five servings per day may be less robust. However, our adjustment for energy intake and use of prospectively collected, cumulatively averaged intake using many repeated dietary assessments reduced the impact of measurement errors.18 Thirdly, even though we adjusted for many potential confounders, residual confounding could not be ruled out. Fourthly, because our study was observational in nature, causality cannot be established. However, confounding is likely to be better controlled in the NHS and HPFS than in most studies because of the relatively homogenous socioeconomic status of the study populations due to their similar education levels and occupations and the use of repeatedly measured confounding factors. In addition, our results were largely consistent with those from existing observational studies and randomized clinical trials on diet high in fruit and vegetables and major chronic diseases including CVD, diabetes and cancer75-78. Lastly, as a limitation shared by all meta-analyses on published data79, the measurement of exposure, including the definitions of fruit and vegetables and their serving sizes and the dietary assessment tools, varied across the studies in our dose-response meta-analysis. However, complementary to the meta-analysis, our original data analysis in the NHS and the HPFS that defined fruit and vegetables using the same criteria and measured intake levels using the same tools yielded concordant results. The strengths of the current study included a large sample size, high follow-up, and repeated assessments of dietary and lifestyle variables during a long follow-up for up to three decades.
In summary, we found an inverse association between fruit and vegetable intake and mortality in two large prospective cohorts with detailed and repeated dietary measurements and long follow-up. The lowest risk of mortality was observed for approximately five servings/day of fruit and vegetable intake, but above that level, the risk did not decrease further. An updated meta-analysis of 26 prospective cohort studies including the Nurses’ Health Study and Health Professionals’ Follow-up Study yielded similar results. These findings support current dietary recommendations to increase intakes of fruits and vegetables, and that the succinct ‘5-a-day’ message is consistent with available evidence.
Supplementary Material
Clinical Perspective.
What Is New?
A higher intake of fruit and vegetables was associated lower total and cause-specific mortality in a nonlinear manner in both an original data analysis in two prospective cohorts of US men and women and a meta-analysis of 26 prospective cohort studies.
The lowest risk of mortality was observed for approximately 5 servings per day of fruit and vegetable intake, but above that level, the risk did not decrease further.
The thresholds of risk reduction in mortality were 2 servings daily for fruit intake and 3 servings daily for vegetable intake.
What Are the Clinical Implications?
These findings support current dietary recommendations to increase intakes of fruits and vegetables, and that the succinct ‘5-a-day’ message is consistent with available evidence.
Acknowledgement
We are indebted to the participants in the Nurses’ Health Study and the Health Professionals Follow-up Study for their continuing outstanding level of cooperation; to the state cancer registries for their kind help: AL, AZ, AR, CA, CO, CT, DE, FL, GA, ID, IL, IN, IA, KY, LA, ME, MD, MA, MI, NE, NH, NJ, NY, NC, ND, OH, OK, OR, PA, RI, SC, TN, TX, VA, WA, WY; to the staff of the Nurses’ Health Study and the Health Professionals Follow-up Study for their valuable contributions. The authors assume full responsibility for analyses and interpretation of these data.
Funding Sources
This study was supported by research grants UM1 CA186107, P01 CA87969, R01 HL034594, R01 HL088521, U01 CA167552, R01 HL35464, R01 HL60712 and P30 DK46200 from the National Institutes of Health (NIH). Dr. Dong D. Wang’s research is supported by a Pathway to Independence Award (R00DK119412) from the National Institute of Diabetes and Digestive and Kidney Diseases (NIDDK) and a Boston Nutrition and Obesity Center Pilot and Feasibility grant supported by the NIDDK under award number P30DK046200. The funding source had no role in the design and conduct of the study; collection, management, analysis, and interpretation of the data; preparation, review, or approval of the manuscript; and the decision to submit the manuscript for publication.
Non-standard Abbreviations and Acronyms:
- NHS
Nurses’ Health Study
- HPFS
Health Professionals’ Follow-up Study
- CVD
cardiovascular disease
- SFFQ
semi-quantitative food frequency questionnaire
- HR
hazard ratio
- CI
confidence interval
- BMI
body mass index
- RR
relative risk
- FFQ
food frequency questionnaire
Footnotes
Conflict of Interest Disclosures
Yanping Li has received research support from the California Walnut Commission and SwissRe Management Ltd. The remaining authors disclose no conflicts.
References
- 1.Micha R, Peñalvo JL, Cudhea F, Imamura F, Rehm CD and Mozaffarian D. Association Between Dietary Factors and Mortality From Heart Disease, Stroke, and Type 2 Diabetes in the United States. JAMA. 2017;317:912–924. [DOI] [PMC free article] [PubMed] [Google Scholar]
- 2.Gakidou E, Afshin A, Abajobir AA, Abate KH, Abbafati C, Abbas KM, Abd-Allah F, Abdulle AM, Abera SF, Aboyans V, et al. Global, regional, and national comparative risk assessment of 84 behavioural, environmental and occupational, and metabolic risks or clusters of risks, 1990-2013;2016: a systematic analysis for the Global Burden of Disease Study 2016. Lancet. 2017;390:1345–1422. [DOI] [PMC free article] [PubMed] [Google Scholar]
- 3.U.S. Department of Health and Human Services and U.S. Department of Agriculture. 2015 – 2020 Dietary Guidelines for Americans. 8th ed. December 2015. Available at https://health.gov/our-work/food-and-nutrition/2015-2020-dietary-guidelines/. [Date accessed: December 26, 2020]. [Google Scholar]
- 4.Eckel RH, Jakicic JM, Ard JD, De Jesus JM, Miller NH, Hubbard VS, Lee I-M, Lichtenstein AH, Loria CM and Millen BE. 2013 AHA/ACC guideline on lifestyle management to reduce cardiovascular risk: a report of the American College of Cardiology/American Heart Association Task Force on Practice Guidelines. J Am Coll Cardiol. 2014;63:2960–2984. [DOI] [PubMed] [Google Scholar]
- 5.Joint World Health Organization / Food and Agriculture Organization of the United Nations Expert Consultation on Diet, Nutrition and the Prevention of Chronic Diseases. Diet, nutrition and the prevention of chronic diseases: Report of the joint WHO/FAO expert consultation. February 2002. Available at https://www.who.int/dietphysicalactivity/publications/trs916/download/en/. [Date accessed: December 26, 2020].
- 6.Conrad Z, Chui K, Jahns L, Peters CJ and Griffin TS. Characterizing trends in fruit and vegetable intake in the USA by self-report and by supply-and-disappearance data: 2001–2014. Public health nutrition. 2017;20:3045–3050. [DOI] [PMC free article] [PubMed] [Google Scholar]
- 7.Heimendinger J, Van Duyn MA, Chapelsky D, Foerster S and Stables G. The national 5 A Day for Better Health Program: a large-scale nutrition intervention. Journal of Public Health Management and Practice. 1996;2:27–35. [PubMed] [Google Scholar]
- 8.World Health Organization. Increasing fruit and vegetable consumption to reduce the risk of noncommunicable diseases. February 2019. Available at https://www.who.int/elena/titles/fruit_vegetables_ncds/en/. [Date accessed: December 26, 2020].
- 9.World Cancer Research Fund/American Institute for Cancer Research. Diet, Nutrition, Physical Activity and Cancer: a Global Perspective. May 2018. Available at https://www.wcrf.org/dietandcancer/resources-and-toolkit. [Date accessed: December 26, 2020].
- 10.The National Health Service. Why 5 A Day. October 2018. Available at https://www.nhs.uk/live-well/eat-well/why-5-a-day/. [Date accessed: December 26, 2020]
- 11.Department of Health, Government of Western Australia. Go for 2&5 Fruit and Vegetable Campaign. June 2018. Available at https://healthywa.wa.gov.au/Articles/F_I/Go-for-2-and-5. [Date accessed: December 26, 2020].
- 12.Haraldsdottir J Dietary guidelines and patterns of intake in Denmark. Br J Nutr. 1999;81 Suppl 2:S43–48. [DOI] [PubMed] [Google Scholar]
- 13.Aune D, Giovannucci E, Boffetta P, Fadnes LT, Keum N, Norat T, Greenwood DC, Riboli E, Vatten LJ and Tonstad S. Fruit and vegetable intake and the risk of cardiovascular disease, total cancer and all-cause mortality–a systematic review and dose-response meta-analysis of prospective studies. Int J Epidemiol. 2017;46:1029–1056. [DOI] [PMC free article] [PubMed] [Google Scholar]
- 14.Wang X, Ouyang Y, Liu J, Zhu M, Zhao G, Bao W and Hu FB. Fruit and vegetable consumption and mortality from all causes, cardiovascular disease, and cancer: systematic review and dose-response meta-analysis of prospective cohort studies. BMJ. 2014;349:g4490. [DOI] [PMC free article] [PubMed] [Google Scholar]
- 15.Muraki I, Imamura F, Manson JE, Hu FB, Willett WC, van Dam RM and Sun Q. Fruit consumption and risk of type 2 diabetes: results from three prospective longitudinal cohort studies. BMJ. 2013;347:f5001. [DOI] [PMC free article] [PubMed] [Google Scholar]
- 16.Cooper AJ, Forouhi NG, Ye Z, Buijsse B, Arriola L, Balkau B, Barricarte A, Beulens JW, Boeing H and Büchner FL. Fruit and vegetable intake and type 2 diabetes: EPIC-InterAct prospective study and meta-analysis. Eur J Clin Nutr. 2012;66:1082–1092. [DOI] [PMC free article] [PubMed] [Google Scholar]
- 17.Bertoia ML, Mukamal KJ, Cahill LE, Hou T, Ludwig DS, Mozaffarian D, Willett WC, Hu FB and Rimm EB. Changes in intake of fruits and vegetables and weight change in United States men and women followed for up to 24 years: analysis from three prospective cohort studies. PLoS Med. 2015;12:e1001878. [DOI] [PMC free article] [PubMed] [Google Scholar]
- 18.Willett W. Chapter 5: Food Frequency Methods and Chapter 6: Reproducibility and Validity of Food-Frequency Questionnaires in Nutritional Epidemiology. 3rd Edition. Oxford, England: Oxford University Press; 2013. [Google Scholar]
- 19.Salvini S, Hunter DJ, Sampson L, Stampfer MJ, Colditz GA, Rosner B and Willett WC. Food-based validation of a dietary questionnaire: the effects of week-to-week variation in food consumption. Int J Epidemiol. 1989;18:858–867. [DOI] [PubMed] [Google Scholar]
- 20.Feskanich D, Rimm EB, Giovannucci EL, Colditz GA, Stampfer MJ, Litin LB and Willett WC. Reproducibility and validity of food intake measurements from a semiquantitative food frequency questionnaire. J Am Diet Assoc. 1993;93:790–796. [DOI] [PubMed] [Google Scholar]
- 21.Nutrition Department at the Harvard T.H. Chan School of Public Health. Harvard University Food Composition Table. July 2020. Available at https://regepi.bwh.harvard.edu/health/nutrition/. [Date accessed: December 26, 2020]. [Google Scholar]
- 22.Chiuve SE, Fung TT, Rimm EB, Hu FB, McCullough ML, Wang M, Stampfer MJ and Willett WC. Alternative Dietary Indices Both Strongly Predict Risk of Chronic Disease–. J Nutr. 2012;142:1009–1018. [DOI] [PMC free article] [PubMed] [Google Scholar]
- 23.Rich-Edwards JW, Corsano KA and Stampfer MJ. Test of the National Death Index and Equifax Nationwide Death Search. Am J Epidemiol. 1994;140:1016–1019. [DOI] [PubMed] [Google Scholar]
- 24.Durrleman S and Simon R. Flexible regression models with cubic splines. Stat Med. 1989;8:551–561. [DOI] [PubMed] [Google Scholar]
- 25.Higgins JP, Thomas J, Chandler J, Cumpston M, Li T, Page MJ and Welch VA. Chapter 13: Assessing risk of bias due to missing results in a synthesis: 13.5.2.3 Tools for assessing methodological quality or risk of bias in non-randomized studies Cochrane handbook for systematic reviews of interventions: John Wiley & Sons; 2019. [Google Scholar]
- 26.Wells GA, Shea B, O’Connell D, Peterson J, Welch V, Losos M and Tugwell P. The Newcastle-Ottawa Scale (NOS) for assessing the quality of nonrandomised studies in meta-analyses. 2000. Available at http://www.ohri.ca/programs/clinical_epidemiology/oxford.asp. [Date accessed: December 26, 2020]. [Google Scholar]
- 27.Greenland S and Longnecker MP. Methods for trend estimation from summarized dose-response data, with applications to meta-analysis. Am J Epidemiol. 1992;135:1301–1309. [DOI] [PubMed] [Google Scholar]
- 28.Crippa A and Orsini N. Multivariate dose-response meta-analysis: the dosresmeta r package. J Stat Softw. 2016;72:15. [Google Scholar]
- 29.Moher D, Liberati A, Tetzlaff J, Altman DG and Group P. Preferred reporting items for systematic reviews and meta-analyses: the PRISMA statement. PLoS Med. 2009;6:e1000097. [DOI] [PMC free article] [PubMed] [Google Scholar]
- 30.Bazzano LA, He J, Ogden LG, Loria CM, Vupputuri S, Myers L and Whelton PK. Fruit and vegetable intake and risk of cardiovascular disease in US adults: the first National Health and Nutrition Examination Survey Epidemiologic Follow-up Study. Am J Clin Nutr. 2002;76:93–99. [DOI] [PubMed] [Google Scholar]
- 31.Bellavia A, Larsson SC, Bottai M, Wolk A and Orsini N. Fruit and vegetable consumption and all-cause mortality: a dose-response analysis. Am J Clin Nutr. 2013;98:454–459. [DOI] [PubMed] [Google Scholar]
- 32.Boggs DA, Ban Y, Palmer JR and Rosenberg L. Higher Diet Quality Is Inversely Associated with Mortality in African-American Women1–4. J Nutr. 2014;145:547–554. [DOI] [PMC free article] [PubMed] [Google Scholar]
- 33.Bongard V, Arveiler D, Dallongeville J, Ruidavets JB, Wagner A, Simon C, Marecaux N and Ferrieres J. Food groups associated with a reduced risk of 15-year all-cause death. Eur J Clin Nutr. 2016;70:715–722. [DOI] [PubMed] [Google Scholar]
- 34.Buil-Cosiales P, Zazpe I, Toledo E, Corella D, Salas-Salvado J, Diez-Espino J, Ros E, Fernandez-Creuet Navajas J, Santos-Lozano JM, Aros F, et al. Fiber intake and all-cause mortality in the Prevencion con Dieta Mediterranea (PREDIMED) study. Am J Clin Nutr. 2014;100:1498–1507. [DOI] [PubMed] [Google Scholar]
- 35.Du H, Li L, Bennett D, Yang L, Guo Y, Key TJ, Bian Z, Chen Y, Walters RG, Millwood IY, et al. Fresh fruit consumption and all-cause and cause-specific mortality: findings from the China Kadoorie Biobank. Int J Epidemiol. 2017;46:1444–1455. [DOI] [PMC free article] [PubMed] [Google Scholar]
- 36.Fraser GE, Sumbureru D, Pribiš P, Neil RL and Frankson MAC. Association among health habits, risk factors, and all-cause mortality in a black California population. Epidemiology. 1997;8:168–174. [DOI] [PubMed] [Google Scholar]
- 37.Genkinger JM, Platz EA, Hoffman SC, Comstock GW and Helzlsouer KJ. Fruit, vegetable, and antioxidant intake and all-cause, cancer, and cardiovascular disease mortality in a community-dwelling population in Washington County, Maryland. Am J Epidemiol. 2004;160:1223–1233. [DOI] [PubMed] [Google Scholar]
- 38.Hjartåker A, Knudsen MD, Tretli S and Weiderpass E. Consumption of berries, fruits and vegetables and mortality among 10,000 Norwegian men followed for four decades. Eur J Nutr. 2015;54:599–608. [DOI] [PubMed] [Google Scholar]
- 39.Kobylecki CJ, Afzal S, Davey Smith G and Nordestgaard BG. Genetically high plasma vitamin C, intake of fruit and vegetables, and risk of ischemic heart disease and all-cause mortality: a Mendelian randomization study. Am J Clin Nutr. 2015;101:1135–1143. [DOI] [PubMed] [Google Scholar]
- 40.Kvaavik E, Batty GD, Ursin G, Huxley R and Gale CR. Influence of individual and combined health behaviors on total and cause-specific mortality in men and women: The United Kingdom Health and Lifestyle Survey. Arch Intern Med. 2010;170:711–718. [DOI] [PubMed] [Google Scholar]
- 41.Leenders M, Sluijs I, Ros MM, Boshuizen HC, Siersema PD, Ferrari P, Weikert C, Tjonneland A, Olsen A, Boutron-Ruault MC, et al. Fruit and Vegetable Consumption and Mortality: European Prospective Investigation Into Cancer and Nutrition. Am J Epidemiol. 2013;178:590–602. [DOI] [PubMed] [Google Scholar]
- 42.Mann JI, Appleby PN, Key TJ and Thorogood M. Dietary determinants of ischaemic heart disease in health conscious individuals. Heart. 1997;78:450–455. [DOI] [PMC free article] [PubMed] [Google Scholar]
- 43.Miller V, Mente A, Dehghan M, Rangarajan S, Zhang X, Swaminathan S, Dagenais G, Gupta R, Mohan V, Lear S, et al. Fruit, vegetable, and legume intake, and cardiovascular disease and deaths in 18 countries (PURE): a prospective cohort study. Lancet. 2017;390:2037–2049. [DOI] [PubMed] [Google Scholar]
- 44.Nagura J, Iso H, Watanabe Y, Maruyama K, Date C, Toyoshima H, Yamamoto A, Kikuchi S, Koizumi A, Kondo T, et al. Fruit, vegetable and bean intake and mortality from cardiovascular disease among Japanese men and women: the JACC Study. Br J Nutr. 2009;102:285–292. [DOI] [PubMed] [Google Scholar]
- 45.Nechuta SJ, Shu XO, Li HL, Yang G, Xiang YB, Cai H, Chow WH, Ji B, Zhang X, Wen W, et al. Combined impact of lifestyle-related factors on total and cause-specific mortality among chinese women: Prospective cohort study. PLoS Medicine. 2010;7:e1000339. [DOI] [PMC free article] [PubMed] [Google Scholar]
- 46.Nguyen B, Bauman A, Gale J, Banks E, Kritharides L and Ding D. Fruit and vegetable consumption and all-cause mortality: evidence from a large Australian cohort study. Int J Behav Nutr Phys Act. 2016;13:9. [DOI] [PMC free article] [PubMed] [Google Scholar]
- 47.Oyebode O, Gordon-Dseagu V, Walker A and Mindell JS. Fruit and vegetable consumption and all-cause, cancer and CVD mortality: analysis of Health Survey for England data. J Epidemiol Community Health. 2014;68:856–862. [DOI] [PMC free article] [PubMed] [Google Scholar]
- 48.Rissanen TH, Voutilainen S, Virtanen JK, Venho B, Vanharanta M, Mursu J and Salonen JT. Low intake of fruits, berries and vegetables is associated with excess mortality in men: the Kuopio Ischaemic Heart Disease Risk Factor (KIHD) Study. J Nutr. 2003;133:199–204. [DOI] [PubMed] [Google Scholar]
- 49.Sahyoun NR, Jacques PF and Russell RM. Carotenoids, vitamins C and E, and mortality in an elderly population. Am J Epidemiol. 1996;144:501–511. [DOI] [PubMed] [Google Scholar]
- 50.Steffen LM, Jacobs DR Jr., Stevens J, Shahar E, Carithers T and Folsom AR. Associations of whole-grain, refined-grain, and fruit and vegetable consumption with risks of all-cause mortality and incident coronary artery disease and ischemic stroke: the Atherosclerosis Risk in Communities (ARIC) Study. Am J Clin Nutr. 2003;78:383–390. [DOI] [PubMed] [Google Scholar]
- 51.Stefler D, Pikhart H, Kubinova R, Pajak A, Stepaniak U, Malyutina S, Simonova G, Peasey A, Marmot MG and Bobak M. Fruit and vegetable consumption and mortality in Eastern Europe: Longitudinal results from the Health, Alcohol and Psychosocial Factors in Eastern Europe study. Eur J Prev Cardiol. 2016;23:493–501. [DOI] [PMC free article] [PubMed] [Google Scholar]
- 52.Whiteman D, Muir J, Jones L, Murphy M and Key T. Dietary questions as determinants of mortality: The OXCHECK experience. Public Health Nutr. 1999;2:477–487. [DOI] [PubMed] [Google Scholar]
- 53.Zhang X, Shu XO, Xiang YB, Yang G, Li H, Gao J, Cai H, Gao YT and Zheng W. Cruciferous vegetable consumption is associated with a reduced risk of total and cardiovascular disease mortality. Am J Clin Nutr. 2011;94:240–246. [DOI] [PMC free article] [PubMed] [Google Scholar]
- 54.Willett WC. Chapter 13: Issues in Analysis and Presentation of Dietary Data in Nutritional Epidemiology. 3rd ed. Oxford, England: Oxford University Press; 2013. [Google Scholar]
- 55.He FJ, Nowson CA and MacGregor GA. Fruit and vegetable consumption and stroke: meta-analysis of cohort studies. Lancet. 2006;367:320–326. [DOI] [PubMed] [Google Scholar]
- 56.Dauchet L, Amouyel P, Hercberg S and Dallongeville J. Fruit and vegetable consumption and risk of coronary heart disease: a meta-analysis of cohort studies. J Nutr. 2006;136:2588–2593. [DOI] [PubMed] [Google Scholar]
- 57.Appel LJ and Group ASoHW. ASH position paper: dietary approaches to lower blood pressure. J Am Soc Hypertens. 2009;3:321–331. [DOI] [PubMed] [Google Scholar]
- 58.Liu RH. Health-promoting components of fruits and vegetables in the diet. Adv Nutr. 2013;4:384S–392S. [DOI] [PMC free article] [PubMed] [Google Scholar]
- 59.Key TJ. Fruit and vegetables and cancer risk. Br J Cancer. 2011;104:6–11. [DOI] [PMC free article] [PubMed] [Google Scholar]
- 60.Farvid MS, Chen WY, Rosner BA, Tamimi RM, Willett WC and Eliassen AH. Fruit and vegetable consumption and breast cancer incidence: Repeated measures over 30 years of follow-up. Int J Cancer. 2019;144:1496–1510. [DOI] [PMC free article] [PubMed] [Google Scholar]
- 61.Leenders M, Boshuizen HC, Ferrari P, Siersema PD, Overvad K, Tjønneland A, Olsen A, Boutron-Ruault M-C, Dossus L and Dartois L. Fruit and vegetable intake and cause-specific mortality in the EPIC study. Eur J Epidemiol. 2014;29:639–652. [DOI] [PubMed] [Google Scholar]
- 62.Romieu I and Trenga C. Diet and obstructive lung diseases. Epidemiol Rev. 2001;23:268–287. [DOI] [PubMed] [Google Scholar]
- 63.Bentley AR, Kritchevsky SB, Harris TB, Holvoet P, Jensen RL, Newman AB, Lee JS, Yende S, Bauer D and Cassano PA. Dietary antioxidants and forced expiratory volume in 1 s decline: the Health, Aging and Body Composition study. Eur Respir J. 2012;39:979–984. [DOI] [PMC free article] [PubMed] [Google Scholar]
- 64.Varraso R, Chiuve SE, Fung TT, Barr RG, Hu FB, Willett WC and Camargo CA. Alternate Healthy Eating Index 2010 and risk of chronic obstructive pulmonary disease among US women and men: prospective study. BMJ. 2015;350:h286. [DOI] [PMC free article] [PubMed] [Google Scholar]
- 65.Kang JH, Ascherio A and Grodstein F. Fruit and vegetable consumption and cognitive decline in aging women. Ann Neurol. 2005;57:713–720. [DOI] [PubMed] [Google Scholar]
- 66.Polidori MC, Praticó D, Mangialasche F, Mariani E, Aust O, Anlasik T, Mang N, Pientka L, Stahl W and Sies H. High fruit and vegetable intake is positively correlated with antioxidant status and cognitive performance in healthy subjects. J Alzheimers Dis. 2009;17:921–927. [DOI] [PubMed] [Google Scholar]
- 67.Bhupathiraju SN, Wedick NM, Pan A, Manson JE, Rexrode KM, Willett WC, Rimm EB and Hu FB. Quantity and variety in fruit and vegetable intake and risk of coronary heart disease. Am J Clin Nutr. 2013;98:1514–1523.. [DOI] [PMC free article] [PubMed] [Google Scholar]
- 68.Borgi L, Muraki I, Satija A, Willett WC, Rimm EB and Forman JP. Fruit and Vegetable Consumption and the Incidence of Hypertension in Three Prospective Cohort Studies. Hypertension. 2016;67:288–293. [DOI] [PMC free article] [PubMed] [Google Scholar]
- 69.Barclay AW, Petocz P, McMillan-Price J, Flood VM, Prvan T, Mitchell P and Brand-Miller JC. Glycemic index, glycemic load, and chronic disease risk—a meta-analysis of observational studies. The Am J Clin Nutr. 2008;87:627–637. [DOI] [PubMed] [Google Scholar]
- 70.Murcia MA, Jiménez AM and Martínez-Tomé M. Vegetables antioxidant losses during industrial processing and refrigerated storage. Food Res Int. 2009;42:1046–1052. [Google Scholar]
- 71.Muraki I, Rimm EB, Willett WC, Manson JE, Hu FB and Sun Q. Potato Consumption and Risk of Type 2 Diabetes: Results from Three Prospective Cohort Studies. Diabetes care. 2015:dc150547. [DOI] [PMC free article] [PubMed] [Google Scholar]
- 72.Flood-Obbagy JE and Rolls BJ. The effect of fruit in different forms on energy intake and satiety at a meal. Appetite. 2009;52:416–422. [DOI] [PMC free article] [PubMed] [Google Scholar]
- 73.Hyson DA. A review and critical analysis of the scientific literature related to 100% fruit juice and human health. Adv Nutr. 2015;6:37–51. [DOI] [PMC free article] [PubMed] [Google Scholar]
- 74.Atkinson FS, Foster-Powell K and Brand-Miller JC. International tables of glycemic index and glycemic load values: 2008. Diabetes care. 2008;31:2281–2283. [DOI] [PMC free article] [PubMed] [Google Scholar]
- 75.Salas-Salvado J, Bullo M, Estruch R, Ros E, Covas MI, Ibarrola-Jurado N, Corella D, Aros F, Gomez-Gracia E, Ruiz-Gutierrez V, et al. Prevention of diabetes with Mediterranean diets: a subgroup analysis of a randomized trial. Ann Intern Med. 2014;160:1–10. [DOI] [PubMed] [Google Scholar]
- 76.Estruch R, Ros E, Salas-Salvado J, Covas MI, Corella D, Aros F, Gomez-Gracia E, Ruiz-Gutierrez V, Fiol M, Lapetra J, et al. Primary Prevention of Cardiovascular Disease with a Mediterranean Diet Supplemented with Extra-Virgin Olive Oil or Nuts. N Engl J Med. 2018;379:1388–1389. [DOI] [PubMed] [Google Scholar]
- 77.Toledo E, Salas-Salvado J, Donat-Vargas C, Buil-Cosiales P, Estruch R, Ros E, Corella D, Fito M, Hu FB, Aros F, et al. Mediterranean Diet and Invasive Breast Cancer Risk Among Women at High Cardiovascular Risk in the PREDIMED Trial: A Randomized Clinical Trial. JAMA Intern Med. 2015;175:1752–1760. [DOI] [PubMed] [Google Scholar]
- 78.de Lorgeril M, Salen P, Martin JL, Monjaud I, Delaye J and Mamelle N. Mediterranean diet, traditional risk factors, and the rate of cardiovascular complications after myocardial infarction: final report of the Lyon Diet Heart Study. Circulation. 1999;99:779–785. [DOI] [PubMed] [Google Scholar]
- 79.Higgins J, Thompson S, Deeks J and Altman D. Statistical heterogeneity in systematic reviews of clinical trials: a critical appraisal of guidelines and practice. J Health Serv Res Policy. 2002;7:51–61. [DOI] [PubMed] [Google Scholar]
Associated Data
This section collects any data citations, data availability statements, or supplementary materials included in this article.