SUMMARY PARAGRAPH
Systemic insulin sensitivity shows diurnal rhythm with a peak at wakening1,2. The molecular mechanism underlying such a temporal pattern is unclear. Here we demonstrate that nuclear receptors Rev-erbα/β in the GABAergic neurons in the suprachiasmatic nucleus (SCNGABA) control the diurnal rhythm of insulin-mediated suppression of hepatic glucose production in mice, without affecting diurnal eating or locomotor behaviors under the regular light-dark cycles. Rev-erb regulates the rhythmic expression of genes involved in neurotransmission in the SCN and modulates the oscillatory firing activity of SCNGABA neurons. Chemogenetic stimulation of SCNGABA neurons at wakening causes glucose intolerance, while restoration of the temporal pattern of either SCNGABA neuron firing or Rev-erb expression rescues the time-dependent glucose metabolic phenotype due to Rev-erb depletion. The elevated blood glucose level after awakening is a defining feature of the extended dawn phenomenon (DP) in diabetes patients3,4. Type 2 diabetes (T2D) patients with the extended DP display a differential temporal pattern of Rev-erb gene expression compared to T2D patients without DP. These findings provide mechanistic insights into how the central circadian clock regulates the diurnal rhythm of hepatic insulin sensitivity, which has implications in the extended DP in T2D.
Rev-erb in rhythmic insulin sensitivity
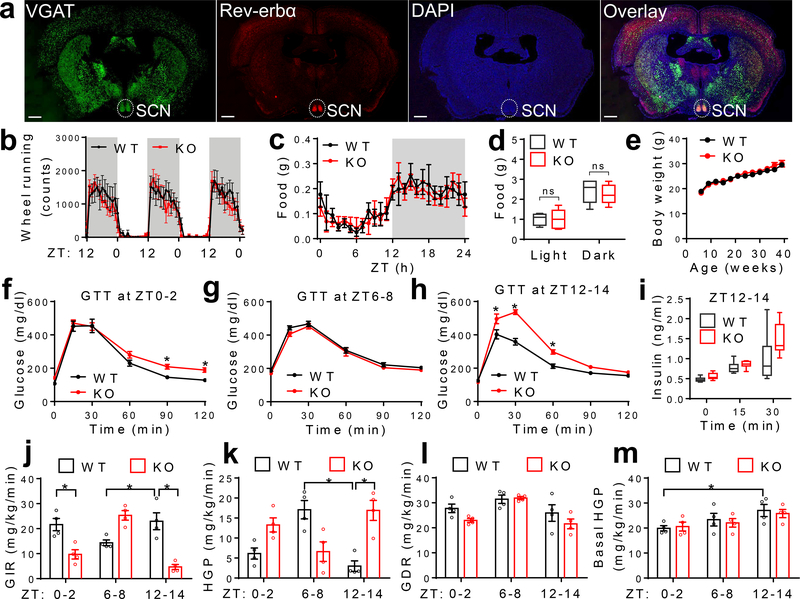
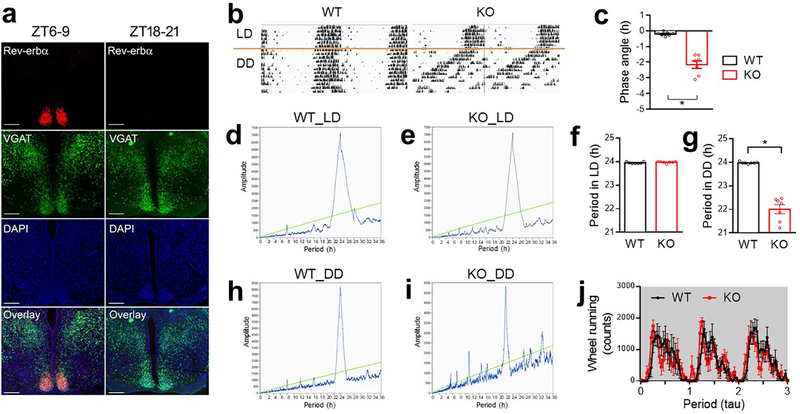
Rev-erbα/β is a druggable key component of the circadian clock machinery. Rev-erbα is the primary form, and is highly enriched in the SCN that is mainly composed of GABAergic neurons5 (Fig 1a). Rev-erbα/β expression displays robust diurnal rhythm in the SCN, with the peak expression at ZT6–96 (Extended Data Fig 1a). To assess the function of Rev-erbα/β in GABA neurons, we created mice with GABA neuron-specific knockout of Rev-erbα/β (KO) by crossbreeding Rev-erbαloxP/Rev-erbβloxP double-floxed mice7,8 with VGAT-Cre mice. Floxed mice without VGAT-Cre, or VGAT-Cre mice by itself, served as the wild-type (WT) control. KO mice were born at Mendelian ratio and did not show developmental defects. They displayed normal diurnal rhythm of wheel-running activities in the regular 12h light/ 12h dark (LD) condition (Fig 1b, Extended Data Fig 1b–f). Under constant darkness (DD), KO mice showed a shorter period but maintained overall rhythmicity (Extended Data Fig 1g–j). KO mice also showed normal diurnal patterns of food intake (Fig 1c–d and Supplementary Table 1), total daily food intake (Extended Data Fig 2a), and body weight (Fig 1e) on chow diet in the regular LD condition.
Figure 1. Rev-erb in GABAergic neurons regulates rhythmic hepatic insulin sensitivity.
(a) RNAscope analysis of Rev-erbα gene expression at ZT6–9 at 3 months old. Scale bar, 500 μm. (b) Wheel-running activity in LD at 5 months old, n = 7 mice. (c-d) Food intake in LD at 4 months old, n = 5 mice. (e) Body weight, n = 10 mice. (f-h) Glucose tolerance tests (GTT) at 4 months old, n = 8 mice. (i) Serum insulin levels at 5 months old, n = 8 mice. (j-m) Insulin clamp analyses at 5 months old, n = 4 mice. Data are mean ± S.E.M. Box-plots center lines, limits, and whiskers represent the median, quartile, and minimum/maximum values, respectively. * p < 0.05 by two-way ANOVA or two-sided t-test. Statistical details were in Supplementary Table 1.
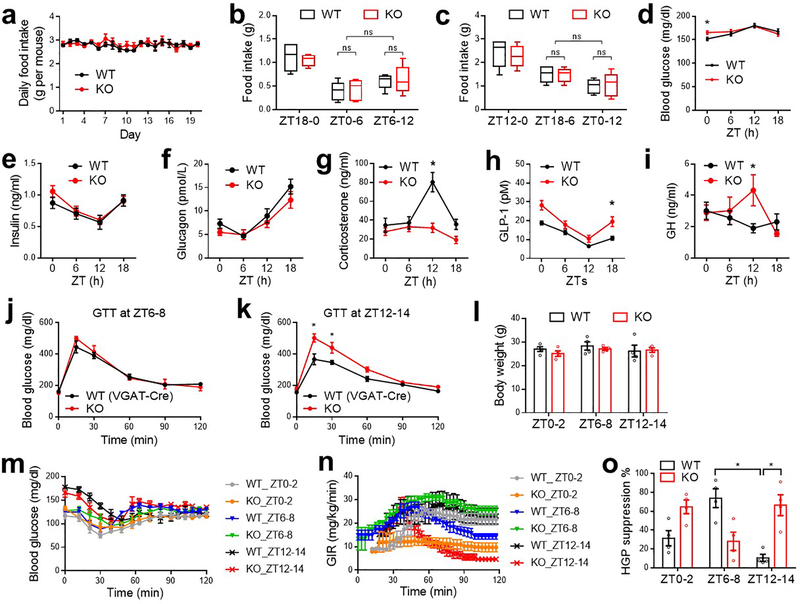
KO mice showed Zeitgeber time (ZT)-dependent abnormalities in glucose metabolism, with slight impairment of glucose tolerance at ZT0–2 (Fig 1f), normal glucose tolerance at ZT6–8 (Fig 1g), and robust impairment at ZT12–14 (Fig 1h). The differential glucose intolerance phenotype of KO mice between ZT6–8 and ZT12–14 was not confounded by differential fasting severities (Extended Data Fig 2b–c) and was not associated with different basal glucose levels (Extended Data Fig 2d). KO mice did not show altered rhythmicity of blood insulin or glucagon (Extended Data Fig 2e–f), but showed altered corticosterone, glucagon-like peptide 1, and growth hormone levels at certain ZTs compared to WT mice (Extended Data Fig 2g–i). The ZT-dependent glucose tolerance phenotype in KO mice was not confounded by the VGAT-Cre mouse line (Extended Data Fig 2j–k). KO mice showed normal elevation of blood insulin levels after a bolus glucose challenge at ZT12–14 (Fig 1i), suggesting impaired insulin sensitivity.
Insulin clamp revealed a remarkable reduction of glucose infusion rate (GIR) in KO mice at ZT12–14, to a lesser degree at ZT0–2, but not at ZT6–8 as compared to WT mice (Fig 1j and Extended Data Fig 2l–o), demonstrating ZT-dependent insulin resistance in KO mice. The low GIR in KO mice at ZT12–14 was mainly driven by a high hepatic glucose production rate (HGP) (Fig 1k), not by a low glucose disposal rate (GDR) (Fig 1l). In comparison, the low GIR in KO mice at ZT0–2 was contributed by both high HGP and low GDR, which likely accounts for the different shapes of blood glucose excursions during GTT at ZT0–2 vs. ZT12–14 in KO mice. Remarkably, WT mice showed diurnal rhythms in systemic insulin sensitivity (Fig 1j), hepatic sensitivity to insulin-mediated suppression of glucose production (Fig 1k), and basal hepatic glucose production (Fig 1m). All three rhythms peaked at wakening (ZT12–14). The insulin sensitivity rhythm, not the basal glucose production rhythm, was disrupted in KO mice. These data demonstrate an essential role of neural Rev-erb in regulating the hepatic insulin sensitivity rhythm independent of eating behaviors or basal glucose production.
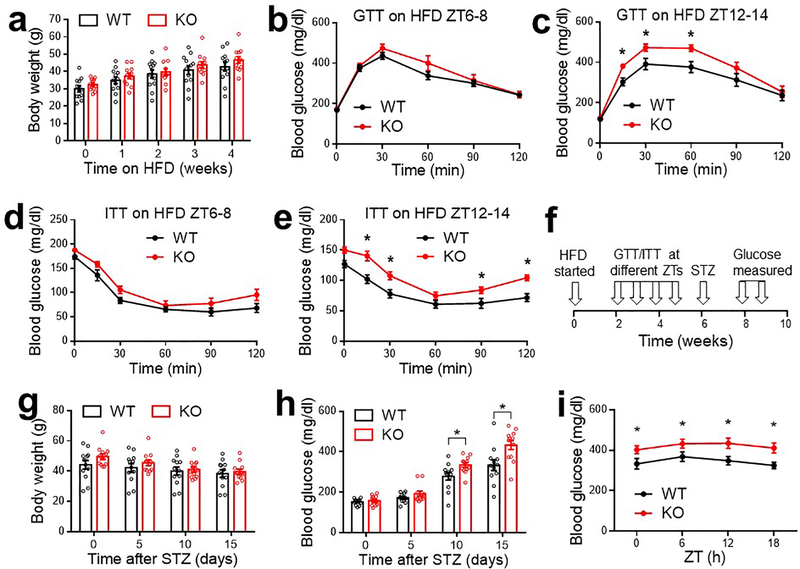
In line with the glucose phenotype on normal chow, KO mice showed exacerbated glucose intolerance and dampened responses to insulin at ZT12–14 on a high-fat diet (HFD) (Extended Data Fig 3a–e). KO mice also showed a more remarkable elevation of blood glucose levels than WT mice in a diabetes model with the combination of HFD and streptozotocin (Extended Data Fig 3f–i).
Rev-erb regulates SCNGABA neurons firing
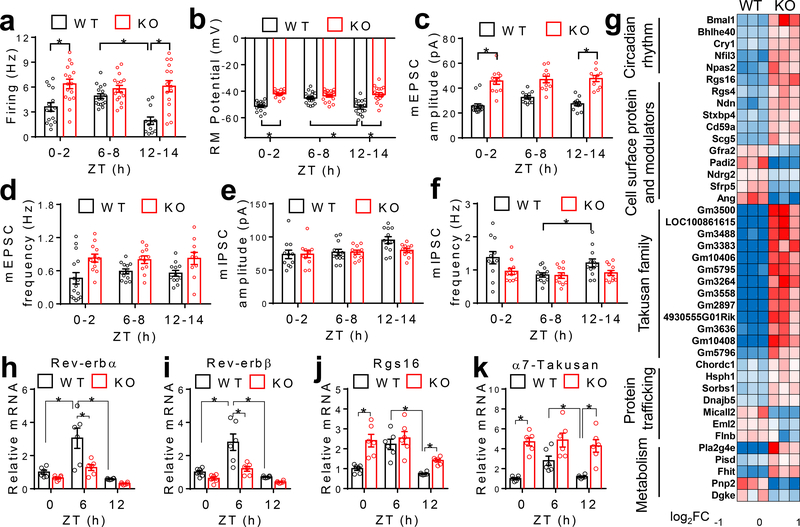
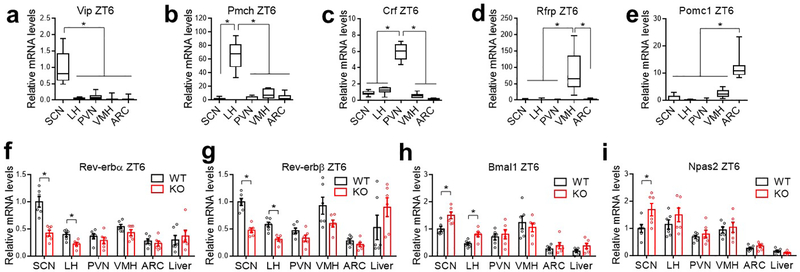
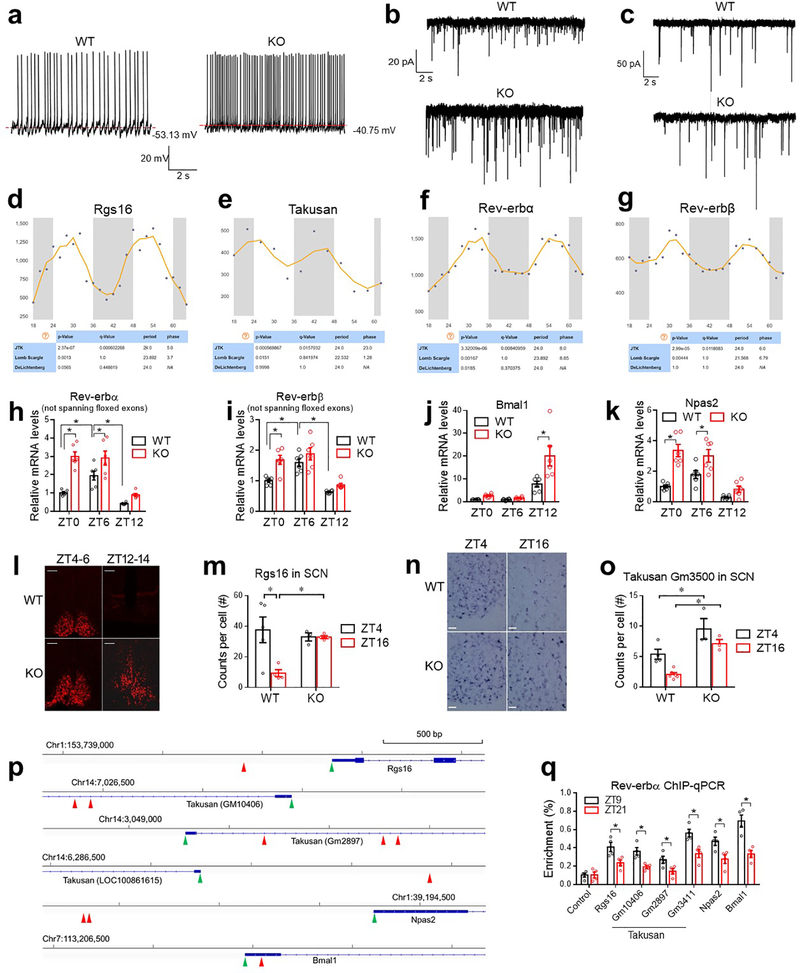
RT-qPCR analyses at ZT6, a time point corresponding to the peak Rev-erb expression, revealed that the most prominent KO/WT differences occurred in the SCN compared to the liver or other brain regions (Extended Data Fig 4 a–i). Whole-cell patch-clamp recordings showed that SCNGABA neurons in KO mice had a higher firing activity at ZT12–14, a slight increase at ZT0–2, but no difference at ZT6–8, compared to WT mice (Fig 2a–b and Extended Data Fig 5a). The temporal pattern of KO/WT differences in the SCNGABA firing activity aligns well with the glucose phenotype (Fig 1). The high firing activity at ZT12–14 in KO vs. WT mice was mainly associated with a higher amplitude of miniature excitatory postsynaptic currents (mEPSC), with less changes in mEPSC frequency (Fig 2c–d and Extended Data Fig 5b) or inhibitory postsynaptic currents (mIPSC) between KO and WT mice (Fig 2e–f and Extended Data Fig 5c). These data suggest a postsynaptic excitatory neurotransmission alteration as a potential mechanism for the KO/WT difference, although other mechanisms cannot be excluded.
Figure 2. Rev-erb regulates the diurnal rhythm of the SCNGABA neural activity.
(a-b) Spontaneous firing frequency and resting membrane (RM) potential of SCNGABA neurons at 4 months old, n = 12–17 neurons. (c-d) mEPSCs of SCNGABA neurons at 4 months old, n = 10–15 neurons. (e-f) mIPSCs of SCNGABA neurons at 4 months old, n = 11–12 neurons. (g) Differentially expressed genes (DEGs) in KO vs. WT mice identified by RNA-seq of the SCN at ZT12–14 at 4 months old. (h-k) RT-qPCR analysis of the SCN at 4 months old, n = 6 mice. Primers for Rev-erbα/β span the floxed exons. Data are mean ± S.E.M. * p < 0.05 by two-way ANOVA or two-sided t-test. Statistical details were in Supplementary Table 1.
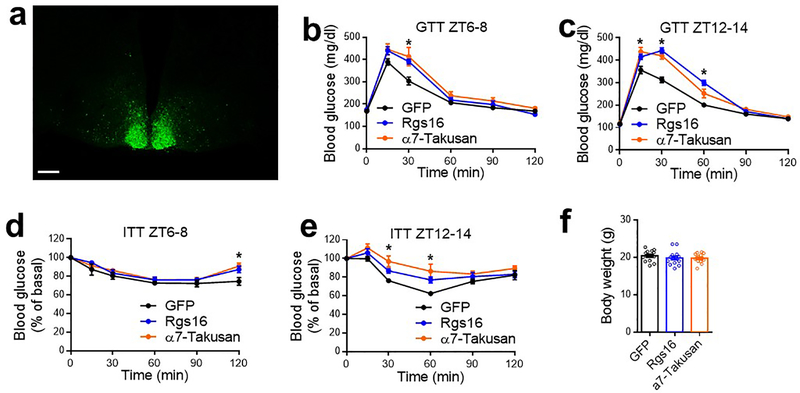
RNA-seq identified differentially expressed genes (DEGs) (KO vs. WT) in the SCN at ZT12–14 (Fig 2g). DEGs were enriched in cell surface proteins related to neurotransmission (Fig 2g). For example, Regulator of G-protein signaling 16 (Rgs16) is required for circadian production of cAMP in the SCN9. Remarkably, 13 out of the top 30 upregulated genes belong to the Takusan family. This poorly annotated gene family is known to increase the mEPSC amplitude10. Rgs16 and multiple Takusan family members were known to have oscillatory expression patterns6,11 with the peak at ZT0–6 (Extended Data Fig 5d–e), immediately preceding the peak Rev-erb expression at ZT6–9 (Extended Data Fig 5f–g). RT-qPCR confirmed the disrupted rhythmicity of Rgs16 and α7-Takusan (Gm10406) in KO vs. WT mice (Fig 2h–k, Extended Data Fig 5h–k, and Supplementary Table 2). Rev-erb can suppress its own transcription12, leading to an artificially upregulated gene expression in the KO mice (Extended Data Fig 5h–i). In situ hybridization (ISH) confirmed that the rhythmicity of Rgs16 and Takusan gene Gm3500 in the SCN was disrupted in KO mice (Extended Data Fig 5l–o). Chromatin immuno-precipitation (ChIP) revealed that Rev-erbα bind near these genes in a temporal pattern consistent with the Rev-erbα level in the hypothalamus (Extended Data Fig 5p–q). These data suggest that the rise of Rev-erb late in the day accounts for the repression of Rgs16 and Takusan expression in the early night, although they do not exclude indirect regulatory mechanisms. Overexpression of Rgs16 or α7-Takusan in SCNGABA neurons reduced glucose tolerance and impaired glucose responses to insulin at ZT12–14, but to a less degree at ZT6–8 (Extended Data Fig 6a–f). The expression level and the temporal pattern of the exogenous Rgs16 or Takusan genes need to be further fine-tuned to fully address whether they are the de facto cause of the glucose phenotype. These results nonetheless support a role of Rgs16 or Takusan in glucose metabolism.
SCN firing regulates glucose metabolism
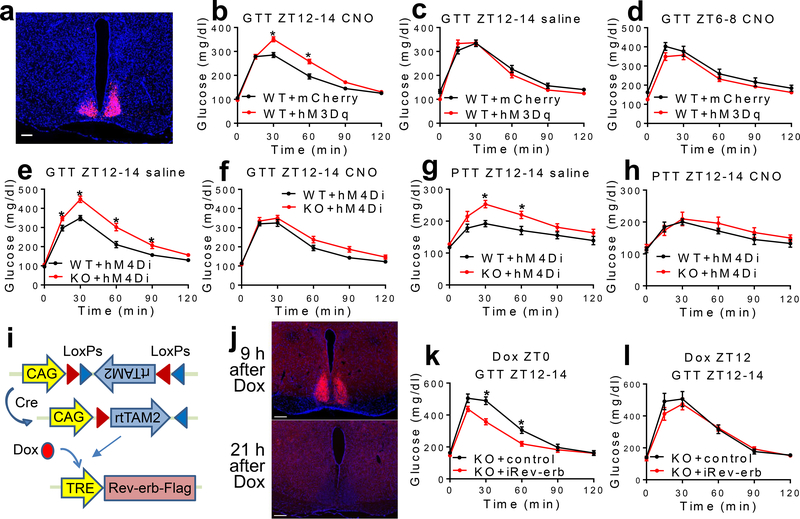
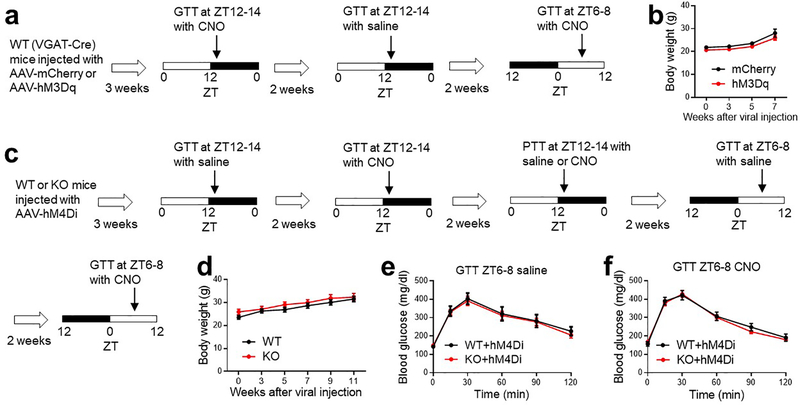
We next address how the SCNGABA neuron firing activity per se regulates glucose metabolism. Chemogenetic activation of SCNGABA neurons in hM3Dq-injected mice after clozapine-N-oxide (CNO) injection caused glucose intolerance at ZT12–14 (Fig 3a–3b and Extended Data Fig 7a–b). The effect was not observed at ZT12–14 in the absence of CNO (Fig 3c), or at ZT6–8 in the presence of CNO when the baseline firing activity was already high (Fig 3d). These results suggest that the SCNGABA neuron hyperactivity is sufficient to cause glucose intolerance in the early night.
Figure 3. The rhythmicity of the SCNGABA neural activity and Rev-erb expression regulates rhythmic glucose metabolism.
(a) Expression of hM3Dq in SCNGABA neurons after bilateral stereotaxic AAV injection. Blue, DAPI. Red, mCherry. Scale bar, 100 μm. (b-d) GTT at 3–4 months old, n = 11 mice. (e-f) GTT in mice bilaterally injected with AAV expressing hM4Di at the SCN at 3–4 months old, n = 12 WT and 14 KO mice. (g-h) Pyruvate tolerance test (PTT) at ZT12–14 in mice injected with AAV expressing hM4Di at 4 months old, n = 6 WT and 7 KO mice. (i) AAV vectors for inducible re-expression of Rev-erbα. (j) Immunostaining to Flag-tagged Rev-erbα at 9 and 21 h after doxycycline (Dox) injection. Blue, DAPI. Red, Flag. Scale bar, 200 μm. (k) GTT at ZT12–14, 12 h after Dox injection at ZT0, at 3 months old, n = 9 mice. (l) GTT at ZT12–14, 24 h after Dox injection at ZT12, at 3.5 months old, n = 9 mice. Data are mean ± S.E.M. * p < 0.05 by two-way ANOVA or two-sided t-test. Statistical details were in Supplementary Table 1.
Conversely, chemogenetic suppression of SCNGABA neurons blunted the KO/WT difference in GTT or pyruvate tolerance at ZT12–14 (Extended Data Fig 7c–d and Fig 3e–h). In contrast, KO mice did not differ from WT mice in GTT at ZT6–8 regardless of CNO (Extended Data Fig 7e–f). These results suggest that the SCNGABA hyperactivity at ZT12–14 is required for glucose intolerance and elevated hepatic glucose production in the KO mice. Therefore, the drop of the SCNGABA neuron firing activity in WT mice at wakening promotes glucose tolerance, probably anticipating the upcoming feeding behaviors.
Rev-erb rhythmicity regulates metabolism
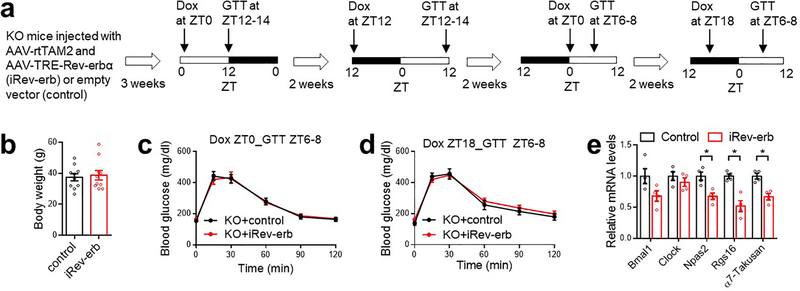
To address whether the glucose phenotype of KO mice is due to developmental disruption or clock-independent functions of Rev-erb, we performed inducible re-expression of Rev-erbα (iRev-erb) in adult mice specifically in SCNGABA neurons (Extended Data Fig 8a–b and Fig 3i). Doxycycline (Dox) injection caused a robust Rev-erbα re-expression after 9 h, followed by a significant recess after 21 h (Fig 3j). By timing the Dox injection, we can control the oscillatory pattern of exogenous Rev-erb to be either in-phase or anti-phase with the endogenous Rev-erb. The in-phase re-expression improved glucose tolerance in KO mice at ZT12–14 (Fig 3k) but had no significant effect at ZT6–8 (Extended Data Fig 8c). Dox injection at 24 h before ZT12–14 GTT (Fig 3l) or at 12 h before ZT6–8 GTT (Extended Data Fig 8d) had no effect on glucose tolerance. Re-expression of Rev-erbα also suppressed Rgs16 and α7-Takusan in the SCN at ZT12–14 (Extended Data Fig 8e). Collectively, the results demonstrate that the oscillatory temporal pattern of Rev-erb expression per se in SCNGABA neurons is critical for systemic glucose metabolism.
Circadian clock and extended DP
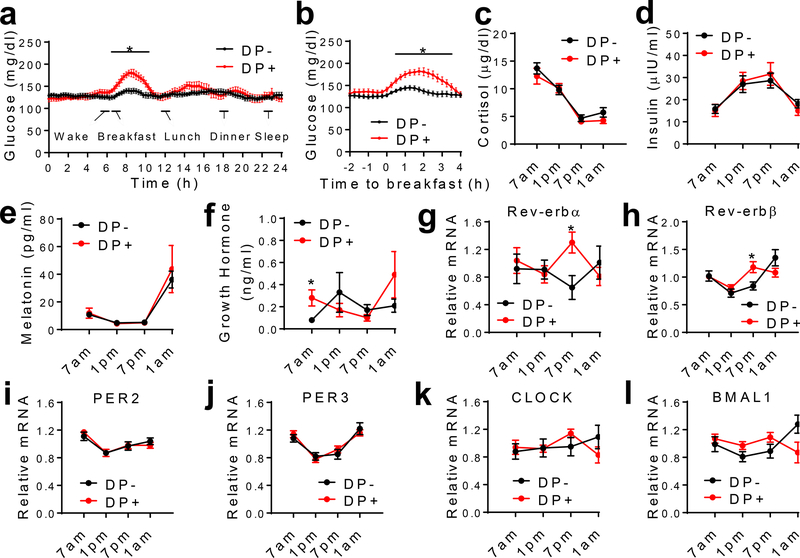
The glucose intolerance at wakening resembles the dawn phenomenon (DP) that affects about half of diabetes patients13. DP was mostly studied in type 1 diabetes (T1D) and was attributed to waning nocturnal exogenous insulin levels in T1D13,14. The altered insulin sensitivity in our mouse model suggests that the circadian disruption might be particularly related to DP in T2D. Persistent post-breakfast hyperglycemia is known as ‘extended DP’, the most prominent feature of DP3,4. The glucose intolerance in the absence of fasting hyperglycemia in the KO mice suggests that the circadian disruption may contribute to the extended DP. To address whether the extended DP in T2D is associated with the disrupted circadian clock, we used continuous glucose monitoring (CGM) (Extended Data Fig 9) to study hospitalized T2D patients whose blood glucose levels were already under control through a fixed medication regimen. Patients with Somogyi phenomenon or irregular pre-hospitalization sleep/meal patterns were excluded (Supplementary Table 3). DP was defined by the absolute increment from the nocturnal glucose nadir to the pre- or post-breakfast values (Fig 4a–b and Methods). There were no differences in age, BMI, medication usage, or meal/sleep time during hospitalization between patients with and without DP (Supplementary Table 4, 5, and 6). The circulating cortisol, insulin, and melatonin did not differ either (Fig 4c–e). Growth hormone (GH) showed a significant increase in the early morning in patients with DP (Fig 4f). There was no difference in sleep duration, breathing, blood oxygen, or heart rate, except that patients with DP waked up less during sleep and had less severe central apnea (Supplementary Table 5). The temporal pattern of circadian clock gene expression in the blood or other peripheral tissues correlates well with biomarkers of the central clock and responds rapidly to entraining signals in human15,16. Therefore, we inferred the molecular clock functionality from blood mononuclear cells (PBMCs) through RT-qPCR. Rev-erbα and Rev-erbβ showed a significant difference between patients with and without DP (Fig 4g–h). BMAL1 also showed a trend of change, while PER2 and PER3 did not show changes (Fig 4i–l). These data suggest that disruption of the molecular clock is associated with the extended DP in T2D.
Figure 4. Dawn phenomenon (DP) is associated with the altered Rev-erb expression.
(a-b) Continuous glucose monitoring (CGM) data of T2D patients, n = 16 without DP (DP-), n = 11 with DP (DP+). (c-f) Oscillation of plasma hormone levels, n = 16 without DP, n = 11 with DP. (g-l) RT-qPCR analysis of gene expression in blood monocytes collected at the indicated time. Data were normalized to the average value of all time-points for each patient. n = 12 without DP, n = 10 with DP. Data are mean ± S.E.M. * p < 0.05 by two-way repeated-measure ANOVA with Holm-Sidak’s test. Statistical details were in Supplementary Table 1.
Discussion
Our work suggests that the rise of Rev-erb in the SCNGABA neurons in the late sleep cycle suppresses the expression contributes to reduced SCNGABA firing at wakening, which increases insulin sensitivity through enhancing insulin-mediated suppression of hepatic glucose production. This model is supported by that (1) Rev-erb depletion in GABA neurons causes glucose intolerance, particularly at wakening; (2) Rev-erb depletion disrupts the diurnal rhythm of SCNGABA neuron firing and insulin sensitivity, with altered hepatic glucose production but not blood glucose disposal; (3) chemogenetic manipulation of SCNGABA neuron firing can mimic or rescue glucose intolerance due to Rev-erb depletion; and (4) inducible re-expression of Rev-erb in KO mice, only at the correct phase, rescues glucose intolerance at wakening. Such a diurnal regulation of insulin sensitivity is independent of consummatory or locomotor behaviors. In line with our findings, systemic insulin sensitivity, particularly insulin-mediated suppression of hepatic glucose production, was shown to peak at wakening1,2. Surgical lesion of the SCN or pharmacological silencing of the SCN neural activity can either improve glucose tolerance17 or impair insulin-mediated suppression of hepatic glucose production18,19. The specificity and duration of these manipulations, as well as the timing of the assay, may contribute to the discrepancy. How sub-SCN neuron populations contribute to the glucose phenotype warrants further investigation.
There seem to be two opposing actions at play in normal chronophysiology. On the one hand, basal glucose production peaks at around wakening20–22, to prevent hypoglycemia during sleep and to provide fuels for ensuing neurocognitive and locomotor activities after wakening. On the other hand, hepatic sensitivity to insulin-mediated suppression of glucose production also peaks at wakening1,2, in anticipation of the upcoming consummatory behaviors to assimilate dietary nutrients efficiently for replenishing the energy reservoir that dwindles during sleep. The combination of the two mechanisms, in alliance with oscillatory insulin levels, keeps blood glucose levels stable throughout the day in healthy subjects. A prominent increase in hepatic glucose production in the morning is associated with T2D23,24. Here we show that the SCN circadian clock regulates the rhythm of hepatic insulin sensitivity. The association of Rev-erb expression alteration with the extended DP suggest that the clock-mediated anticipatory regulation of hepatic insulin sensitivity may account for the undisciplined rise of hepatic glucose production at wakening and T2D pathogenesis with extended DP.
Our patch clamp data suggest that the firing rhythmicity of SCNGABA neurons is dependent on Rev-erb. Rev-erb-regulated genes, such as Rgs16 and Takusan members, have diurnal expression rhythm and can modulate synaptic activity9,10, which may regulate the mEPSCs amplitude. GABA can have excitatory roles in the SCN25–27 and may contribute to the higher spontaneous firing frequency in the presence of higher mEPSC amplitudes in KO mice, given the intra-SCN connections between SCNGABA neurons.
The extended DP is unlikely due to waning effects of medications because (1) blood glucose levels were controlled with a fixed medication regimen throughout the study; (2) oral antidiabetic drugs do not affect DP effectively4; and (3) the extended DP was not associated with changes in insulin levels. It is intriguing that Rev-erb was upregulated in human PBMCs in the afternoon, instead of downregulated in the morning. One potential contributing factor is that the disrupted Rev-erb function could upregulate its own gene transcription due to the negative feedback12. The opposite phases between nocturnal mice and diurnal humans in clock outputs could be another contributing factor. It is unclear what caused the disrupted Rev-erb rhythmicity in patients with extended DP. In summary, our findings unveiled a Rev-erb-mediated, SCNGABA-dependent pathway for the diurnal rhythm of hepatic insulin sensitivity in mice, with implications in extended DP in human T2D.
METHODS
Mouse.
Mice carrying floxed alleles at Rev-erbα and Rev-erbβ loci (Rev-erbαloxP/loxP and Rev-erbβloxP/loxP) were obtained from PHENOMIN - ICS (Institut Clinique de la Souris, Illkirch-Graffenstaden; http://www.phenomin.fr/), as reported previously as described before7,8. VGAT-Cre mice28 and Rosa26-tdTomato29 mice were obtained from JAX. All mice were C57BL/6 genetic background. Female mice showed a more robust and reproducible phenotype during the initial characterization of the metabolic phenotype. Therefore, we used female mice for all experiments. The age of the mice was shown in Figure Legends. Littermate Rev-erbαloxP/loxP / Rev-erbβloxP/loxP mice were used as the wild-type (WT) control for most studies unless otherwise indicated. VGAT-Cre mice or tdTomato/VGAT-Cre mice were used as WT control for electrophysiology, chemogenetics, Rev-erb re-expression rescue, and Rgs16/Takusan overexpression studies, as indicated in Figure Legends. All VGAT-Cre mice used are heterozygous for the Cre allele. Normal chow diet is composed of 23 kcal% protein, 14.8 kcal% fat, and 62.1 kcal% carbohydrates (cat # 3002906–203, PicoLab). High-fat diet (HFD) is composed of 20 kcal% protein, 60 kcal% fat, and 20 kcal% carbohydrates with a total of 5.21 kcal/g energy density (cat # D12492, Research Diet). 4 mice were housed in each cage at room temperature (70 Fahrenheit) and 40% humidity in a 12 h light/12 h dark (LD, 7am light-on, 7pm light-off) condition with free access to water and food for all experiments except for the wheel-running experiment under constant darkness (DD). Some mice were housed in reverse light-dark schedule (7am light-off, 7pm light-on) for more than 2 weeks for convenience to experimenters to analyze the phenotype in the dark cycle. In this case, the experiments were performed under dim red light to minimize the effects of the light on the central circadian clock. Wheel-running was conducted in the circadian cabinets (Actimetrics) for 10 days on LD followed by DD for another 10 days. The actogram, chi-square periodogram, phase angle, and period length were generated and analyzed by the ClockLab software (Actimetrics). The phase angle of entrainment reflects the difference between the onset of activity and the onset of the dark period. It was determined by performing a linear regression of activity onset for the first 8 days in constant darkness and extrapolating this line to the last day of the LD cycle30. Mice were group-housed except temporary single-housing during the wheel-running experiment or the post-surgery recovery period. Mice of the same age and genotypes were randomized into different surgery groups or treatment groups. Streptozotocin (STZ) was solubilized in freshly made 0.1 mmol/L sodium citrate buffer (pH 4.5) at 4mg/ml and i.p. injected at 40 mg/kg for 5 consecutive days. All the animal procedures were reviewed and approved by the Institutional Animal Care and Use Committee (IACUC) of Baylor College of Medicine.
Metabolic testing and insulin clamp.
For the glucose tolerance test (GTT) or pyruvate tolerance test (PTT), mice were handled daily for a week before the test to allow them to get used to the handling to minimize stress. On the day of the test, mice fasted for 6 h for GTT or 8 h for PTT. Baseline blood glucose levels were taken using a glucometer (OneTouch Ultra2) from tail bleeding, followed immediately by i.p. injection of glucose (1.5 or 2.5 g/kg body weight) or pyruvate (2 g/kg body weight). Blood glucose levels at 15, 30, 60, 90, and 120 min after injection were monitored using the glucometer. Tests at ZT12–14 were performed under dim red light. Serum insulin, glucagon, corticosterone, GLP-1, and growth hormone levels were measured using the Ultra Sensitive Mouse Insulin ELISA kit (Cat # 90080, Crystal Chem), Glucagon ELISA kit (Cat#10–1281-01, Mercodia), Corticosterone ELISA kit (Cat # ADI-900–097, Enzo Life Sciences), Mouse GLP-1 ELISA kit (Cat # 81508, Crystal Chem), and Growth Hormone ELISA kit (Cat # EZRMGH-45K, Sigma), respectively. For insulin clamp, mice were catheterized at a single jugular vein and were allowed to recover for a week. Human insulin was infused at 2.5 mU/kg/min into unrestrained mice, and blood glucose levels were maintained between 120–140 mg/dl by infusing 20% glucose at various rates. 3H-glucose was used to trace hepatic glucose production. The clamp assay last about two hours from the start of the insulin infusion to the end. Tests at ZT12–14 were performed under dim red light.
Virus, stereotaxic injection, and chemogenetics.
We integrated the flip-excision (FLEX) system31 with the Tet-ON system32 to achieve inducible re-expression of Rev-erbα specifically in SCNGABA neurons. AAV-TRE-Flag-Rev-erbα and AAV-FLEX-rtTAM2 plasmids were constructed based on the pAAV-FLEX-GFP plasmid (Addgene 28304, from Edward Boyden), pMA3211 (Addgene 46879)33, and FUW-M2rtTA (Addgene 20342)34. Adult KO mice were co-injected with AAV-FLEX-rtTAM2 and AAV-TRE-Flag-Rev-erbα for inducible Rev-erb re-expression (iRev-erb) at the SCN bilaterally. As the control, KO mice were co-injected with the rtTAM2 vector and an empty vector. For overexpressing Rgs16 and α7-Takusan, the ORF clones for Rgs16 (NM_002928.4) and α7-Takusan (Gm10406) were purchased from GenScript and cloned into the pAAV-FLEX plasmid to generate AAV-FLEX-Rgs16–2A-GFP or AAV-FLEX-α7 Takusan-2A-GFP. The AAV vector expressing GFP alone served as the control vector. The recombinant AAV virus was pseudotyped with an AAV9 serotype and injected at the SCN bilaterally in adult mice. For chemogenetic studies, we used the DREADD (Designer Receptor Exclusively Activated by Designer Drugs) with engineered G-protein coupled receptors (GPCRs) to activate or silence specific neurons in response to clozapine-N-oxide (CNO)35. For chemogenetic activation, we injected AAV-hSyn-FLEX-hM3Dq-mCherry36 into the SCN of adult VGAT-Cre (WT) mice with AAV-hSyn-FLEX-mCherry as the control. We performed GTT at 120 min after intraperitoneal injection of CNO. For chemogenetic suppression, we injected AAV-hSyn-FLEX-hM4Di37 at the SCN of adult KO mice. VGAT-Cre (WT) mice injected with the same hM4Di vector served as the control. AAV5-FLEX-hM4Di-mCherry and AAV5-FLEX-mCherry was obtained from Dr. Bryan Roth37 through the Vector Core at the University of Northern Carolina at Chapel Hill. AAV5-FLEX-hM3Dq-mCherry was obtained from Addgene (44361-AAV-5)36. All virus was tittered at around 1013 GC/ml. For stereotaxic injection, adult mice were anesthetized with ketamine and xylazine (100 mg/kg: 10 mg/kg), and the head was fixed on the surgery platform by a stereotaxic system (Stoelting Co). A blur hole was drilled on each side of the skull (posterior 0.00 mm and lateral 0.14 mm to the bregma; depth: 6.00 mm for the SCN), and 200 nl of each virus/side/mouse was injected. Mice were allowed to recover from surgery for at least two weeks before tests. The accurate injection was validated in each mouse by post-mortem histological examination. Mis-injected mice were excluded from the final data analysis. Mice that did not recover to their pre-surgery body weight were also excluded. For Dox-induced Rev-erbα re-expression, Dox was i.p. injected at 30 mg/kg. For chemogenetic manipulation, mice were i.p. injected with 1 mg/kg CNO at 2 h before the injection of glucose or pyruvate during GTT or PTT analyses.
Histology.
Mice were anesthetized for transcardiac perfusion with cold PBS and 4% paraformaldehyde. Overnight post-fixed brains were immersed in 30% sucrose, and embedded in the O.C.T. compound, and frozen in precooled isopentane. Coronal brain sections (~12 μm) were prepared on the Leica CM1850 cryostat slicer. The coronal sections corresponding to Bregma: −0.34 mm to −0.70 mm were collected. Rev-erbα and Rgs16 were assayed using RNAscope following the standard protocol from ACD with minor modifications. Briefly, brain sections were rinsed with PBS to remove OCT. The brain sections were incubated at 60 °C for 30min. Then the brain sections were post-fixed in 4% PFA at 4 °C for 15 min. After the post-fixation, the brain sections were dried in EtOH. The brain sections were then incubated with hydrogen peroxide at room temperature for 10 min. The sections were rinsed for 2 min three times in distilled water, and then the brain sections were retrieved in RNAscope® 1X Target Retrieval Reagent at 100 °C for 5 min. The slides were then rinsed in distilled water for 2 min three times and re-dried in 100% alcohol for storage. The pretreated brain sections were incubated with Protease III for 30 min at 40 °C. The protease III was removed, and the brain sections were rinsed in distilled water for 2 min three times. The brain sections were hybridized with the mixed probes of Rev-erbα (ACD, 529151-C2, Nr1d1), Rgs16 (ACD, 539201), and VGAT (ACD, 319191-C3, Slc32a1) for 2hr at 40 °C. After that, the brain sections were rinsed for 2 min three times in Wash Buffer to remove the excessive probes. The RNAscope Multiplex FL v2 Amp1 were added on the brain sections and incubated at 40 °C to amplify the signal for one probe. The brain sections were rinsed with Wash Buffer after 30 min. Following the incubation of Amp1, the other two probes were amplified by Amp2 and Amp3 under the same condition. The probe signals were detected using the RNAscope® Multiplex Fluorescent Detection Reagents V2 (ACD 323110). The in-situ hybridization analysis of alpha-Takusan was performed with a probe for Takusan Gm3500 (Supplementary Table 2). For detecting the re-expression of Flag-Rev-erbα in the SCN, the brain sections were incubated with rat anti-Flag antibodies (Novus, nbp1–06712ss, dilution 1:50) at 4 °C overnight. The sections were then washed 3 times in PBS at room temperature and furtherly incubated with goat anti-rat antibodies tagged with a fluorescence dye (Abcam, A-21247, dilution 1:1000) for 1 hour at room temperature. These sections were then washed 3 times in PBS at room temperature, counterstained with Hoechst, and sealed with the coverslip. The immunofluorescence of brain sections is viewed and captured with the Zeiss Axio imager M2m microscope and processed by ImageJ software. For quantifying the expression of Rgs16 and Takusan Gm3500, the counts of the signal dot in each cell within the SCN were measured by ImageJ software. At least forty neurons were counted for each mouse, and the averaged number from those cells represented the expression intensity for each mouse. The results were calculated as counts (#) per cell. A student’s two-tail t-test was used to analyze the quantification data.
Electrophysiology.
Whole-cell patch-clamp recordings were performed on tdTomato-labeled GABAergic neurons from the SCN of tdTomato/VGAT-Cre (WT) or Rev-erbαloxP/loxP/Rev-erbβloxP/loxP/tdTomato/VGAT-Cre (KO) mice. Mice of 8–12 weeks old were deeply anesthetized with isoflurane and transcardially perfused with a modified ice-cold sucrose-based cutting solution (pH 7.3) containing 10 mM NaCl, 25 mM NaHCO3, 195 mM Sucrose, 5 mM Glucose, 2.5 mM KCl, 1.25 mM NaH2PO4, 2 mM Na-Pyruvate, 0.5 mM CaCl2, and 7 mM MgCl2, bubbled continuously with 95% O2 and 5% CO238. The mice were then decapitated, and the entire brain was removed and immediately submerged in the cutting solution. Slices (250 μm) were cut with a Microm HM 650V vibratome (Thermo Scientific). Three brain slices were obtained for each animal, and recordings were made at levels throughout this brain region. The slices were recovered for 1 h at 34°C and then maintained at room temperature in artificial cerebrospinal fluid (aCSF, pH 7.3) containing 126 mM NaCl, 2.5 mM KCl, 2.4 mM CaCl2, 1.2 mM NaH2PO4, 1.2 mM MgCl2, 11.1 mM glucose, and 21.4 mM NaHCO3 saturated with 95% O2 and 5% CO2 before recording. Slices were transferred to a recording chamber and allowed to equilibrate for at least 10 min before recording. The slices were perfused at 34°C in oxygenated aCSF at a flow rate of 1.8–2 ml/min. tdTomato-labeled neurons were visualized using epifluorescence and IR-DIC imaging on an upright microscope (Eclipse FN-1, Nikon) equipped with a moveable stage (MP-285, Sutter Instrument). Patch pipettes with resistances of 3–5 MΩ were filled with intracellular solution (pH 7.3) containing 128 mM K-Gluconate, 10 mM KCl, 10 mM HEPES, 0.1 mM EGTA, 2 mM MgCl2, 0.05 mM (Na)2GTP, and 0.05 mM (Mg)ATP. Recordings were made using a MultiClamp 700B amplifier (Axon Instruments), sampled using Digidata 1440A and analyzed offline with pClamp 10.3 software (Axon Instruments). Series resistance was monitored during the recording, and the values were generally <10 MΩ and were not compensated. The liquid junction potential was +12.5 mV, and was corrected after the experiment. Data were excluded if the series resistance increased dramatically during the experiment or without overshoot for the action potential. Currents were amplified, filtered at 1 kHz, and digitized at 20 kHz. The current clamp was engaged to test neural firing frequency and resting membrane potential (RM). The values for RM and firing frequency were averaged within 2-min bin. For the miniature excitatory postsynaptic current (mEPSC) recordings, the internal recording solution contained 125 mM CsCH3SO3, 10 mM CsCl, 5 mM NaCl, 2 mM MgCl2, 1 mM EGTA, 10 mM HEPES, 5 mM (Mg)ATP, and 0.3 mM (Na)2GTP (pH 7.3 with NaOH)39. The mEPSCs were recorded in whole-cell voltage-clamp mode by holding the membrane potential at Vh = −60 mV in the presence of 1μM TTX, 50 μM bicuculline. The miniature inhibitory postsynaptic current (mIPSC) recordings were recorded in whole-cell voltage-clamp mode by holding the membrane potential at Vh = −70 mV. The CsCl-based pipette solution contains 140mM CsCl, 10mM HEPES, 5mM MgCl2, 1mM BAPTA, 5mM (Mg)ATP, and 0.3mM (Na)2GTP (pH 7.30 adjusted with NaOH; 295 mOsm kg−1). The mIPSCs were recorded in the presence of 1μM TTX, 30 μM D-AP5, and 30 μM CNQX40. The mIPSC frequency showed a difference between ZT6 and ZT12 in WT mice, which is in line with the sIPSC results in a previous study41. Frequency and peak amplitude were measured using the Mini Analysis program (Synaptosoft Inc.). Multiple single neurons were recorded from 3–4 mice in each group and were pooled for statistical analysis.
Isolation of sub-hypothalamic brain regions, RT-qPCR, ChIP-qPCR, and RNAseq.
For isolation of sub-hypothalamic brain regions from tdTomato/VGAT-Cre (WT) or Rev-erbαloxP/loxP/Rev-erbβloxP/loxP/tdTomato/VGAT-Cre mice, mice were anesthetized with CO2 and decapitated. Brains were immediately embedded in OCT and snap-frozen in −80°C. Coronal brain sections of 100 μm were prepared on the Leica CM1850 cryostat slicer. Coronal slices containing the SCN and other sub-hypothalamic regions were collected. The SCN was recognized by tdTomato fluorescence under Leica DMi8 inverted microscope and isolated using a 26G needle on a 1ml syringe. Isolated sub-hypothalamic brain regions were immediately put into a 1.5ml microcentrifuge tube containing 1 ml TRI reagent (Molecular Research Center, Inc), and the tissue was sheared through needles with 30 strokes. RNA extraction and RT-qPCR analyses were processed using the RNeasy Mini Kit (QIAGEN), High-Capacity cDNA Reverse Transcription Kit (Applied Biosystems), PowerUp™ SYBR™ Green Master Mix (Thermo Fisher), and QuantStudio 6 instrument (Thermo Fisher). Standard curves were generated by series dilution of pooled RNA samples. The relative value for each gene was normalized to the 18S RNA of the same sample. Primer pairs flanking or not flanking the floxed regions were used for Rev-erbα and Rev-erbβ. Given the sequence homology among Takusan members, the primer pair for α7-Takusan is not necessarily specific to α7-Takusan. Therefore, fold-changes can be underestimated. For one ChIP reaction, whole hypothalami from 5 mice were isolated and pulverized together in liquid nitrogen, followed by crosslinking in formaldehyde and sonication in lysis buffer containing 1% SDS. The sample was then diluted to 0.1% SDS and subjected to immunoprecipitation with Rev-erbα antibody (Abcam # ab56754, 4 ug per ChIP reaction). ChIP results were presented as the enrichment % after normalizing to the total input. Negative control primers target a gene desert region on mouse chromosome 17 (catalog # 71012, Active Motif). Primer sequences for RT-qPCR and ChIP-qPCR were summarized in Supplementary Table 2. For RNA-seq, an equal amount of SCN RNA from two mice was pooled for one sample. RNA-seq was performed using total RNA extracted from the SCN (n = 3 samples for each genotype) with a total of 50M reads, PE100, for each sample on the BGISEQ-500 platform. Raw sequence reads from each biological replicate of total RNA were first aligned to the UCSC mm10 genome with Tophat v2.1.0 using default parameters42. Then, HTSeq was used to obtain read counts from the aligned reads43. Finally, DESeq2 (version 1.8.2) was used to normalized the read counts and perform differential gene analysis44. Significantly differentially expressed genes were identified based on 5% false discovery rate (FDR) threshold.
Patients recruitment.
This study was conducted on a total of 27 T2D patients recruited among hospitalized patients from January 2018 to October 2019. Patients diagnosed as T2D at the time of admission into the hospital according to the WHO criteria (1999) were considered for this study, while patients with other types of diabetes were excluded (Supplementary Table 3). We also excluded patients with a variety of complications, irregular diet or sleep times recently, or currently on medications that could confound data interpretation (Supplementary Table 3). The study started after 4 days since the patients were admitted into the hospital. When the study was started, the blood glucose levels were under control using a fixed medication regimen, with fasting glucose 90–180 mg/dL and postprandial glucose <288 mg/dL. Patients who met the criteria and agreed to participate in the study underwent continuous glucose monitoring (CGM) for 2–3 days. CGM data were compared with fingertip glucometer readings at multiple times throughout the day to assess CGM performance. A predefined exclusion criterion is that patients with less than 3 matched measurements in a day or correlation coefficient < 0.79 would be excluded (Supplementary Table 3). Patients with nighttime hypoglycemia were also excluded to avoid the confounding Somogyi effect (Supplementary Table 3). All procedures involved in the human participants were reviewed and approved by the Ethics Committee of the Qilu Hospital at Shandong University. Informed consent was obtained from all participants.
Clinical investigations.
The study was started after an average of 4 days since the patients were hospitalized. Patients had standard meals provided exclusively by the hospital during the study. All patients had similar breakfast time (around 7:00 AM) and sleep time (lights off at around 10:00 PM) throughout the hospitalization. Participants underwent CGM for 3 consecutive days using the iPro2 Professional CGM system (Medtronic, Northridge, CA). The sensors were inserted by healthcare professionals and fixed properly. The system automatically measured the blood glucose every 10 seconds and stored an average every 5 minutes. The mean absolute relative difference (MARD) is the average of the absolute error between all CGM values and matched reference values and is used to assess the performance of CGM systems45. The CGM readings had an average of 0.95 correlation coefficient and less than 8% mean absolute relative difference (MARD) with fingertip blood glucose readings. (Extended Data Fig 9). Sleep and activity were monitored using a watch-style wearable activity tracker (Xiaomi Mi Band 2) in the entire study using the built-in software (Supplementary Table 4). Patients recruited after October 2018 were additionally monitored in parallel for sleep and breath by the cardiopulmonary coupling-polysomnography system (CPC-PSG) on the last day of the study (Supplementary Table 5). We define the dawn phenomenon (DP) by the absolute increment from the nocturnal glucose nadir to the pre- or post-breakfast values (‘Δpre-breakfast’ > 30 mg/dL or ‘Δpost-breakfast’ > 60 mg/dL) in any day during CGM. Blood samples were collected every 6 hours (7am, 1pm, 7pm, 1am) for hormone measurements and gene expression analysis on the 2nd day during CGM. CGM data from the 2nd day during CGM were used to compile the final CGM results for direct correlation with hormone measurements and gene expression data, and to avoid bias due to insertion or removal of the sensors. The serum cortisol, growth hormone, and insulin were detected by chemiluminescence analysis (UniCel DxI 800 Access 2 Immunoassay System, Beckman Coulter, Brea, CA; ADVIA® Centaur XPT, Siemens, Germany). Melatonin was detected by high-performance liquid chromatography-tandem mass spectrometry (HPLC-MS/MS, AB SCIEX Triple Quad™ 4500MD, AB Sciex, USA). The blood monocytes were extracted from fresh blood using Ficoll Histopague-1077 (Sigma, USA), frozen in liquid nitrogen, and stored at −80 °C. RNA extraction and RT-qPCR were processed using RNeasy Mini Kit (QIAGEN, Germany), PrimeScriptTM RT reagent Kit (Takara, Japan), PowerUp™ SYBR™ Green Master Mix (Thermo Fisher, USA), and LightCycler®480II instrument (Roche, UK). The RNA quality was assessed by a NanoDrop spectrophotometer (Thermo Fisher, USA). Blood samples with poor-quality RNA were excluded from the final data analysis. Standard curves were generated by series dilution of pooled RNA samples. The relative value for each gene was normalized to the 18S RNA of the same sample as the housekeeping control. Primer sequences were summarized in Supplementary Table 2.
Statistical Analysis.
Statistical analyses were performed using SPSS (V.21.0, IBM). No statistical methods were used to pre-determine sample sizes. Instead, sample sizes were determined based on previous publications46–51. Normality was tested by the Shapiro-Wilk test (n < 10) or D’Agostino-Pearson omnibus test (n > 10). For non-normal data or data with nonequivalent variances, the comparisons between two or multiple groups were tested with the Mann-Whitney test or the Kruskal-Wallis test, respectively. All tests were two-sided. All measurements were taken from distinct biological samples (mice or human subjects). Most comparisons between two groups were analyzed using a two-sided unpaired t-test. Food intake and body weight with multiple time points were analyzed with one-way repeated-measures ANOVA with Tukey’s post hoc test. Multi-group data, such as insulin clamp, electrophysiological data, and gene expression data were analyzed with two-way ANOVA with LSD or Tukey’s post hoc test. Kinetic tests, such as GTT, ITT, PTT, or hormone levels at multiple timepoints, were analyzed with two-way repeated-measure ANOVA with Holm-Sidak’s multiple comparisons test. CGM data, hormone levels, and gene expression in human samples were analyzed by two-way repeated-measures ANOVA with Holm-Sidak’s test or by the mixed-effects model SAS PROC MIXED (SAS v9.4) with similar results. The minimal level of significance was set at p < 0.05. Animals of the same genotype were randomized into different groups of treatment or surgery procedures. Most animal experiments were performed at least twice using independent biological samples or distinct cohorts of mice, except the RNA-seq studies that were performed once. All histology studies were repeated for two times with similar results. Experimenters were blinded to the genotype or injection but were not blinded to CNO or Dox treatment. Data were excluded using the pre-established criteria. Animals were excluded before metabolic tests if they showed distress, infection, bleeding, or anorexia due to surgery. Animals were excluded from final data analyses of metabolic tests if they showed mis-injection at postmortem examination. Human RNA samples were excluded if the extracted RNA is of poor quality or quantity. Statistical details for results with significant results were summarized in Supplementary Table 1.
Extended Data
Extended Data Figure 1. Behavioral characterizations of KO mice.
(a) RNAscope analysis of Rev-erbα gene expression at ZT6–8 and ZT18–20 in WT mice at the age of 3 months old. Scale bar, 200 μm. (b) Representative wheel-running actogram in LD and DD at 5 months old. (c) Phase angle of the light entrainment in the last day of LD. n = 7 mice. (d-i) Representative chi-square periodogram and period length on LD or DD at the age of 5 months old. n = 7 mice. (j) Average wheel-running activity in DD after normalization to the intrinsic period (tau), n = 7 mice. Data are mean ± S.E.M. * p < 0.05 by two-sided t-test. Statistical details were in Supplementary Table 1.
Extended Data Figure 2. Metabolic characterizations of KO mice on a normal chow diet.
(a) Daily food intake in home cages at 3 months old, n = 4 cages across 20 days. (b-c) Food intake measured by the comprehensive laboratory animal monitoring system (CLAMS) in the 6 h or 12 h prior to GTT analyses at 4 months old, n = 5 mice. Box-plots center lines, limits, and whiskers represent the median, quartile, and minimum/maximum values, respectively. (d) Blood glucose at 4 months old, n = 14 WT mice or 10 KO mice. (e) Serum insulin levels, n = 10 mice per group. (f) Blood glucagon levels, n = 12 mice per group. (g) Blood corticosterone levels, n = 11 mice per group. (h) Blood GLP-1 levels, n = 12 WT mice or 10 KO mice. (i) Blood growth hormone (GH) levels, n = 11 WT mice or 12 KO mice. (j-k) GTT at the indicated ZTs with VGAT-Cre mice serving as the WT control at the age of 5 months old, n = 7 mice. (l) Body weight for clamp analyses at 5 months old, n = 4 mice. (m-n) blood glucose levels and GIR during clamp analyses, n = 4 mice. (o) Hyperinsulinemia-mediated suppression of HGP in the clamp analyses, n = 4 mice. Data are mean ± S.E.M. * p < 0.05 by two-way ANOVA or two-sided t-test. Statistical details were in Supplementary Table 1.
Extended Data Figure 3. Metabolic characterizations of KO mice on a high-fat diet (HFD).
(a) Body weight on HFD. HFD started at 10 months. n = 12 mice. (b) GTT at ZT6–8 after 2 weeks on HFD, n = 12 mice. (c) GTT at ZT12–14 after 3 weeks on HFD, n = 12 mice. (d) ITT at ZT6–8 after 4 weeks on HFD, n = 12 mice. (e) ITT at ZT12–14 after 5 weeks on HFD, n = 12 mice. (f) Injection of streptozotocin (STZ) at 6 weeks after HFD. (g-h) Body weight and blood glucose levels at ZT10 after STZ injection, n = 12 mice. (i) Blood glucose levels at the indicated ZTs at 2 weeks after STZ injection, n = 12 mice. Data are mean ± S.E.M. * p < 0.05 by two-way ANOVA or two-sided t-test. Statistical details were in Supplementary Table 1.
Extended Data Figure 4. Gene expression analysis at different brain regions.
(a-e) RT-qPCR analysis of the indicated brain region-specific marker genes for the brain regions isolated from both WT and KO mice at ZT6 at the age of 3 months old, n = 12 mice. Box-plots center lines, limits, and whiskers represent the median, quartile, and minimum/maximum values, respectively. (f-i) RT-qPCR analysis comparing WT and KO mice at ZT6 at the age of 3 months old, n = 6 mice. Data are mean ± S.E.M. * p < 0.05 by two-way ANOVA or two-sided t-test. Statistical details were in Supplementary Table 1.
Extended Data Figure 5. Electrophysiological and molecular characterizations of KO mice.
(a-c) Brain slice patch-clamp representative traces for spontaneous firing, mEPSC, and mIPSC at ZT12–14. (d-g) Temporal pattern of gene expression in the hypothalamus in LD from CircaDB (http://circadb.hogeneschlab.org). (h-k) RT-qPCR analysis of the SCN in WT and KO mice at 3 months old, n = 6 mice. Primers for Rev-erbα/β did not span the floxed exons. (l) RNAscope of Rgs16 at the SCN in WT and KO mice at the indicated ZTs. Scale bar, 100 μm. (m) Quantification of Rgs16 staining, n = 5 WT mice at ZT4, n = 3 KO mice at ZT4, n = 4 WT or KO mice at ZT16. (n) In situ hybridization analysis of Takusan Gm3500 staining. Scale bar, 25 μm. (o) Quantification of in situ hybridization analysis of Takusan member Gm3500, n = 4 WT mice at ZT4, n = 6 WT mice at ZT16, n = 3 KO mice at ZT4 or ZT16. (p) Genome browser views of transcription start sites (TSSs, green arrows) and nearby AGGTCA elements (red arrows) for the indicated genes on GRCm38. (q) Rev-erbα ChIP-qPCR analysis of the hypothalamus of WT mice at 3 months old at ZT9 and ZT21, the peak and trough of Rev-erbα expression, respectively. n = 4 samples. Hypothalami from 5 mice were pooled as one sample. The negative control primers target a gene desert region on chromosome 17. The primer sequences of ChIP-qPCR assays were in Supplemental Table 6. Data are mean ± S.E.M. * p < 0.05 by two-way ANOVA or two-sided t-test. Statistical details were in Supplementary Table 1.
Extended Data Figure 6. Metabolic characterizations of mice overexpressing Rgs16 or α7-Takusan at the SCNGABA neurons.
(a) Validation of the injection with GFP fluorescence signals. Scale bar, 200 μm. (b-e) Glucose tolerance tests (GTT) and insulin tolerance test (ITT) in VGAT-Cre mice injected with AAV-FLEX vectors for GFP, Rgs16, or α7-Takusan at 4 months old. n = 7 mice. (f) Body weight of VGAT-Cre mice injected with AAV vectors at 3 weeks after injection at the age of 3 months. n = 14 mice. Data are mean ± S.E.M. * p < 0.05 for Rgs16 or α7-Takusan vs. the GFP control by two-way ANOVA followed by Holm-Sidak’s test. Statistical details were in Supplementary Table 1.
Extended Data Figure 7. The rhythmicity of SCNGABA firing in glucose metabolism.
(a) Experimental design for chemogenetic activation of the SCNGABA neurons in WT mice with hM3Dq. (b) Body weight of VGAT-Cre mice injected with AAV expressing hM3Dq or control mCherry, n = 11 mice. Mice were injected at the age of 2 months old. (c) Experimental design for chemogenetic repression of the SCNGABA neurons in WT and KO mice with hM4Di. (d) Body weight of WT and KO injected with AAV expressing hM4Di, n = 12 mice for WT, n = 14 mice for KO. Mice were injected at the age of 2 months old. (e-f) GTT of WT or KO mice injected with AAV expressing hM4Di at the indicated ZT in the presence of CNO or saline, n = 12 mice for WT, n = 14 mice for KO. Data are mean ± S.E.M. * p < 0.05 by two-sided t-test.
Extended Data Figure 8. The rhythmicity of SCNGABA Rev-erb expression in glucose metabolism.
(a) Experimental design for inducible re-expression of Rev-erbα in the SCNGABA neurons of KO mice. Virus was injected at 2.5 months old. (b) Body weight at the time of harvest, n = 9 mice. (c-d) GTT at ZT6–8 at 4–4.5 months old after Dox injection at the indicated time, n = 9 mice. (e) RT-qPCR analysis of the SCN from KO mice with inducible re-expression of Rev-erbα. Dox was injected at ZT0 and the brain were harvested at ZT12–14. n = 4 mice. Data are mean ± S.E.M. * p < 0.05 by two-sided t-test. Statistical details were in Supplementary Table 1.
Extended Data Figure 9. Assessment of CGM performance.
(a) A representative comparison between fingertip glucometer reading and CGM reading for a patient at different times of the day. (b) Pearson correlation coefficient between CGM and fingertip readings. n = 16 without DP (DP-), n = 11 with DP (DP+). (c) Mean absolute relative difference (MARD), the average of the absolute error between all CGM values and matched reference values. n = 16 without DP (DP-), n = 11 with DP (DP+). Data are mean ± S.E.M.
Supplementary Material
ACKNOWLEDGMENT
We thank Dr. Mitchell Lazar at the University of Pennsylvania for the Rev-erbα/β loxP mice, Dr. Qingchun Tong and Dr. Yuanzhong Xu at the University of Texas Health Science Center for critical reading of the manuscript and technical guidance, Dr. Hailan Liu at Baylor College of Medicine (BCM) for technical consultation, Dr. Xiaojin Wang at Shanghai Jiao Tong University (SJTU) for statistics consultation, Dr. Chuanjin Yu at SJTU and Mr. Scott Sang Bum Lee at BCM for technical assistance. We thank Dr. Kazuhiro Oka at the BCM Gene Vector Core and Dr. Benjamin Arenkiel at the BCM Neuroconnectivity Core for viral vector production, and Dr. Cecilia Ljungberg at BCM RNA In Situ Hybridization Core (U54HD083092 and 1S10OD016167) for some of the histology studies. The Mouse Metabolism and Phenotyping Core at BCM was supported by R01DK114356 and UM1HG006348. The authors were supported by National Natural Science Foundation of China 81971458 and 31671222 (G.D.), American Diabetes Association (ADA1-17-PDF-138) (Y.H.), ADA1-19-PDF-012 (W.Z.), NIH P20 GM135002 (Y.H.), US Department of Agriculture (USDA) Cris51000-064-01S (Y.X.), National Key R&D Program of China 2016YFC0901204 (L.C.), 2017YFC1001300 (G.D.), 2018YFC1311801 (L.C.), and American Heart Association (AHA30970064), NIH R01DK111436, R01HL153320, R21CA215591, and R01ES027544 (Z.S.). We are also thankful for the John S. Dunn Foundation, Mrs. Clifford Elder White Graham Endowed Research Fund, the Cardiovascular Research Institute at BCM, the Dan L Duncan Comprehensive Cancer Center (P30CA125123), Texas Medical Center Digestive Diseases Center (P30DK056338), the SPORE program in lymphoma at BCM (P50 CA126752), and Gulf Coast Center for Precision Environmental Health (P30ES030285).
Footnotes
COMPETING INTEREST
The authors declare no financial or non-financial conflict of interest. No patent was involved in the study.
DATA AVAILABILITY
The data that support the findings of this study are freely available from the corresponding author upon request. RNA-seq data are available in GEO (GSE150840) with the accession code: mtsvucqaphcnnwv.
REFERENCES FOR MAIN TEXT
- 1.Shi S, Ansari TS, McGuinness OP, Wasserman DH & Johnson CH Circadian disruption leads to insulin resistance and obesity. Curr. Biol. 23, 372–381 (2013). [DOI] [PMC free article] [PubMed] [Google Scholar]
- 2.Coomans CP et al. Detrimental effects of constant light exposure and high-fat diet on circadian energy metabolism and insulin sensitivity. FASEB J. 27, 1721–1732 (2013). [DOI] [PubMed] [Google Scholar]
- 3.O’Neal TB & Luther EE Dawn Phenomenon. in StatPearls (StatPearls Publishing, 2020). [PubMed] [Google Scholar]
- 4.Monnier L, Colette C, Dejager S & Owens D Magnitude of the dawn phenomenon and its impact on the overall glucose exposure in type 2 diabetes: is this of concern? Diabetes Care 36, 4057–4062 (2013). [DOI] [PMC free article] [PubMed] [Google Scholar]
- 5.Hastings MH, Maywood ES & Brancaccio M Generation of circadian rhythms in the suprachiasmatic nucleus. Nat. Rev. Neurosci. 19, 453–469 (2018). [DOI] [PubMed] [Google Scholar]
- 6.Zhang R, Lahens NF, Ballance HI, Hughes ME & Hogenesch JB A circadian gene expression atlas in mammals: implications for biology and medicine. Proc. Natl. Acad. Sci. U.S.A. 111, 16219–16224 (2014). [DOI] [PMC free article] [PubMed] [Google Scholar]
- 7.Cho H et al. Regulation of circadian behaviour and metabolism by REV-ERB-α and REV-ERB-β. Nature 485, 123–127 (2012). [DOI] [PMC free article] [PubMed] [Google Scholar]
- 8.Zhang Y et al. GENE REGULATION. Discrete functions of nuclear receptor Rev-erbα couple metabolism to the clock. Science 348, 1488–1492 (2015). [DOI] [PMC free article] [PubMed] [Google Scholar]
- 9.Doi M et al. Circadian regulation of intracellular G-protein signalling mediates intercellular synchrony and rhythmicity in the suprachiasmatic nucleus. Nat Commun 2, 327 (2011). [DOI] [PMC free article] [PubMed] [Google Scholar]
- 10.Tu S et al. Takusan: a large gene family that regulates synaptic activity. Neuron 55, 69–85 (2007). [DOI] [PMC free article] [PubMed] [Google Scholar]
- 11.Panda S et al. Coordinated transcription of key pathways in the mouse by the circadian clock. Cell 109, 307–320 (2002). [DOI] [PubMed] [Google Scholar]
- 12.Adelmant G, Bègue A, Stéhelin D & Laudet V A functional Rev-erb alpha responsive element located in the human Rev-erb alpha promoter mediates a repressing activity. Proc. Natl. Acad. Sci. U.S.A. 93, 3553–3558 (1996). [DOI] [PMC free article] [PubMed] [Google Scholar]
- 13.Carroll MF & Schade DS The dawn phenomenon revisited: implications for diabetes therapy. Endocr Pract 11, 55–64 (2005). [DOI] [PubMed] [Google Scholar]
- 14.Porcellati F, Lucidi P, Bolli GB & Fanelli CG Thirty years of research on the dawn phenomenon: lessons to optimize blood glucose control in diabetes. Diabetes Care 36, 3860–3862 (2013). [DOI] [PMC free article] [PubMed] [Google Scholar]
- 15.Cuesta M, Boudreau P, Cermakian N & Boivin DB Rapid resetting of human peripheral clocks by phototherapy during simulated night shift work. Sci Rep 7, 16310 (2017). [DOI] [PMC free article] [PubMed] [Google Scholar]
- 16.Akashi M et al. Noninvasive method for assessing the human circadian clock using hair follicle cells. Proc. Natl. Acad. Sci. U.S.A. 107, 15643–15648 (2010). [DOI] [PMC free article] [PubMed] [Google Scholar]
- 17.la Fleur SE, Kalsbeek A, Wortel J, Fekkes ML & Buijs RM A daily rhythm in glucose tolerance: a role for the suprachiasmatic nucleus. Diabetes 50, 1237–1243 (2001). [DOI] [PubMed] [Google Scholar]
- 18.Coomans CP et al. The suprachiasmatic nucleus controls circadian energy metabolism and hepatic insulin sensitivity. Diabetes 62, 1102–1108 (2013). [DOI] [PMC free article] [PubMed] [Google Scholar]
- 19.Foppen E, Tan A. a. T., Ackermans MT, Fliers E & Kalsbeek A Suprachiasmatic Nucleus Neuropeptides and Their Control of Endogenous Glucose Production. J. Neuroendocrinol. 28, (2016). [DOI] [PubMed] [Google Scholar]
- 20.Kalsbeek A, Yi C-X, La Fleur SE & Fliers E The hypothalamic clock and its control of glucose homeostasis. Trends Endocrinol. Metab. 21, 402–410 (2010). [DOI] [PubMed] [Google Scholar]
- 21.Bolli GB et al. Demonstration of a dawn phenomenon in normal human volunteers. Diabetes 33, 1150–1153 (1984). [DOI] [PubMed] [Google Scholar]
- 22.Van Cauter E, Polonsky KS & Scheen AJ Roles of circadian rhythmicity and sleep in human glucose regulation. Endocr. Rev. 18, 716–738 (1997). [DOI] [PubMed] [Google Scholar]
- 23.Boden G, Chen X & Urbain JL Evidence for a circadian rhythm of insulin sensitivity in patients with NIDDM caused by cyclic changes in hepatic glucose production. Diabetes 45, 1044–1050 (1996). [DOI] [PubMed] [Google Scholar]
- 24.Radziuk J & Pye S Diurnal rhythm in endogenous glucose production is a major contributor to fasting hyperglycaemia in type 2 diabetes. Suprachiasmatic deficit or limit cycle behaviour? Diabetologia 49, 1619–1628 (2006). [DOI] [PubMed] [Google Scholar]
- 25.Albus H, Vansteensel MJ, Michel S, Block GD & Meijer JH A GABAergic mechanism is necessary for coupling dissociable ventral and dorsal regional oscillators within the circadian clock. Curr. Biol. 15, 886–893 (2005). [DOI] [PubMed] [Google Scholar]
- 26.Choi HJ et al. Excitatory actions of GABA in the suprachiasmatic nucleus. J Neurosci 28, 5450–5459 (2008). [DOI] [PMC free article] [PubMed] [Google Scholar]
- 27.Freeman GM, Krock RM, Aton SJ, Thaben P & Herzog ED GABA networks destabilize genetic oscillations in the circadian pacemaker. Neuron 78, 799–806 (2013). [DOI] [PMC free article] [PubMed] [Google Scholar]
- 28.Vong L et al. Leptin action on GABAergic neurons prevents obesity and reduces inhibitory tone to POMC neurons. Neuron 71, 142–154 (2011). [DOI] [PMC free article] [PubMed] [Google Scholar]
- 29.Madisen L et al. A robust and high-throughput Cre reporting and characterization system for the whole mouse brain. Nat. Neurosci. 13, 133–140 (2010). [DOI] [PMC free article] [PubMed] [Google Scholar]
- 30.Siepka SM & Takahashi JS Methods to record circadian rhythm wheel running activity in mice. Methods Enzymol 393, 230–239 (2005). [DOI] [PMC free article] [PubMed] [Google Scholar]
- 31.Atasoy D, Aponte Y, Su HH & Sternson SM A FLEX switch targets Channelrhodopsin-2 to multiple cell types for imaging and long-range circuit mapping. J. Neurosci. 28, 7025–7030 (2008). [DOI] [PMC free article] [PubMed] [Google Scholar]
- 32.Sprengel R & Hasan MT Tetracycline-controlled genetic switches. Handb Exp Pharmacol 49–72 (2007) doi: 10.1007/978-3-540-35109-2_3. [DOI] [PubMed] [Google Scholar]
- 33.Ochoa CD, Alexeyev M, Pastukh V, Balczon R & Stevens T Pseudomonas aeruginosa exotoxin Y is a promiscuous cyclase that increases endothelial tau phosphorylation and permeability. J. Biol. Chem. 287, 25407–25418 (2012). [DOI] [PMC free article] [PubMed] [Google Scholar]
- 34.Hockemeyer D et al. A drug-inducible system for direct reprogramming of human somatic cells to pluripotency. Cell Stem Cell 3, 346–353 (2008). [DOI] [PMC free article] [PubMed] [Google Scholar]
- 35.Roth BL DREADDs for Neuroscientists. Neuron 89, 683–694 (2016). [DOI] [PMC free article] [PubMed] [Google Scholar]
- 36.Krashes MJ et al. Rapid, reversible activation of AgRP neurons drives feeding behavior in mice. J. Clin. Invest. 121, 1424–1428 (2011). [DOI] [PMC free article] [PubMed] [Google Scholar]
- 37.Armbruster BN, Li X, Pausch MH, Herlitze S & Roth BL Evolving the lock to fit the key to create a family of G protein-coupled receptors potently activated by an inert ligand. Proc. Natl. Acad. Sci. U.S.A. 104, 5163–5168 (2007). [DOI] [PMC free article] [PubMed] [Google Scholar]
- 38.Ren H et al. FoxO1 target Gpr17 activates AgRP neurons to regulate food intake. Cell 149, 1314–1326 (2012). [DOI] [PMC free article] [PubMed] [Google Scholar]
- 39.Liu T et al. Fasting activation of AgRP neurons requires NMDA receptors and involves spinogenesis and increased excitatory tone. Neuron 73, 511–522 (2012). [DOI] [PMC free article] [PubMed] [Google Scholar]
- 40.Fenselau H et al. A rapidly acting glutamatergic ARC→PVH satiety circuit postsynaptically regulated by α-MSH. Nat. Neurosci. 20, 42–51 (2017). [DOI] [PMC free article] [PubMed] [Google Scholar]
- 41.Itri J, Michel S, Waschek JA & Colwell CS Circadian rhythm in inhibitory synaptic transmission in the mouse suprachiasmatic nucleus. J. Neurophysiol. 92, 311–319 (2004). [DOI] [PMC free article] [PubMed] [Google Scholar]
- 42.Kim D et al. TopHat2: accurate alignment of transcriptomes in the presence of insertions, deletions and gene fusions. Genome Biol. 14, R36 (2013). [DOI] [PMC free article] [PubMed] [Google Scholar]
- 43.Anders S, Pyl PT & Huber W HTSeq--a Python framework to work with high-throughput sequencing data. Bioinformatics 31, 166–169 (2015). [DOI] [PMC free article] [PubMed] [Google Scholar]
- 44.Anders S & Huber W Differential expression analysis for sequence count data. Genome Biol. 11, R106 (2010). [DOI] [PMC free article] [PubMed] [Google Scholar]
- 45.Danne T et al. International Consensus on Use of Continuous Glucose Monitoring. Diabetes Care 40, 1631–1640 (2017). [DOI] [PMC free article] [PubMed] [Google Scholar]
- 46.Faraco G et al. Dietary salt promotes neurovascular and cognitive dysfunction through a gut-initiated TH17 response. Nat. Neurosci. 21, 240–249 (2018). [DOI] [PMC free article] [PubMed] [Google Scholar]
- 47.Peixoto RT, Wang W, Croney DM, Kozorovitskiy Y & Sabatini BL Early hyperactivity and precocious maturation of corticostriatal circuits in Shank3B(−/−) mice. Nat. Neurosci. 19, 716–724 (2016). [DOI] [PMC free article] [PubMed] [Google Scholar]
- 48.Witton J et al. Hippocampal circuit dysfunction in the Tc1 mouse model of Down syndrome. Nat. Neurosci. 18, 1291–1298 (2015). [DOI] [PMC free article] [PubMed] [Google Scholar]
- 49.Xu P et al. Estrogen receptor-α in medial amygdala neurons regulates body weight. J. Clin. Invest. 125, 2861–2876 (2015). [DOI] [PMC free article] [PubMed] [Google Scholar]
- 50.Perusini JN et al. Optogenetic stimulation of dentate gyrus engrams restores memory in Alzheimer’s disease mice. Hippocampus 27, 1110–1122 (2017). [DOI] [PMC free article] [PubMed] [Google Scholar]
- 51.Wang W et al. Chemogenetic Activation of Prefrontal Cortex Rescues Synaptic and Behavioral Deficits in a Mouse Model of 16p11.2 Deletion Syndrome. J. Neurosci. 38, 5939–5948 (2018). [DOI] [PMC free article] [PubMed] [Google Scholar]
Associated Data
This section collects any data citations, data availability statements, or supplementary materials included in this article.


