Abstract
Synthesis of new septal peptidoglycan (sPG) is crucial for bacterial cell division. FtsW, an indispensable component of the cell division machinery in all walled bacterial species, was recently identified in vitro as a peptidoglycan glycosyltransferase (PGTase). Despite its importance, the septal PGTase activity of FtsW has not been demonstrated in vivo. How its activity is spatiotemporally regulated in vivo has also remained elusive. Here we confirmed FtsW as an essential septum-specific PGTase in vivo using an N-acetylmuramic acid analog incorporation assay. Next, using single-molecule tracking coupled with genetic manipulations, we identified two populations of processively moving FtsW molecules: a fast-moving population correlated with the treadmilling dynamics of the essential cytoskeletal FtsZ protein and a slow-moving population dependent on active sPG synthesis. We further identified that FtsN, a potential sPG synthesis activator, plays an important role in promoting the slow-moving population. Our results suggest a two-track model, in which inactive sPG synthases follow the “Z-track” to be distributed along the septum; FtsN promotes their release from the “Z-track” to become active in sPG synthesis on the slow “sPG-track”. This model provides a mechanistic framework for the spatiotemporal coordination of sPG synthesis in bacterial cell division.
The central question of bacteria cell division is how a cell builds its septum to produce two daughter cells with the correct cell shape. In E. coli, more than thirty molecular players have been identified to assemble into a complex machinery called the Divisome, which synthesizes the septal cell wall (sPG) and constricts the cell envelope1,2. However, it remains elusive how various activities of these proteins are regulated and coordinated in time and space. Previously, we and others showed that the master-regulator of the divisome, bacterial tubulin FtsZ, treadmills around the septum and drives the directional movement of an essential septal cell wall transpeptidase3,4. While FtsZ-dependent dynamics are proposed to play an important role in septum morphogenesis by directing the spatial distribution of septal peptidoglycan (sPG) synthesis complexes, the exact relationship between FtsZ’s treadmilling dynamics and septal cell wall synthesis activity is still unclear. In this work, we focused on the functional and spatiotemporal regulation of FtsW in living E. coli cells to understand the mechanism of sPG synthesis regulation during cell division.
Result:
FtsW is an essential glycosyltransferase in vivo.
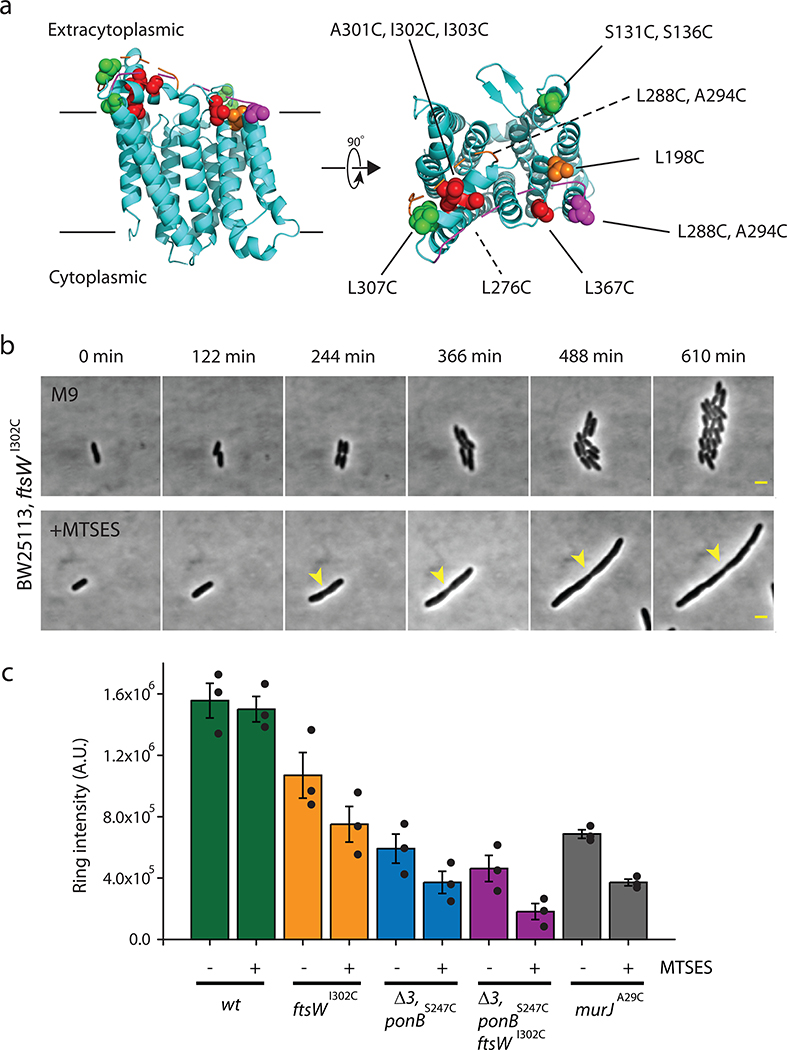
Although FtsW’s glycosyltransferase activity has been demonstrated in vitro5, its in vivo function has yet to be confirmed. We employed a cysteine-modification inactivation assay to investigate its function in E. coli cells6,7. Based on the homology structure of RodA, we generated thirteen unique ftsWC alleles that each encodes a single cysteine residue in the critical periplasmic region8,9 (Extended Data Fig. 1a and Supplementary Table 1 and 2). Amongst these, we identified FtsWI302C as a promising candidate for in vivo inactivation with the cysteine-reactive reagent MTSES (2-sulfonatoethyl methanethiosulfonate)10. Cells solely expressing FtsWI302C grew with a wild-type (WT)-like doubling time and cell morphology in the absence of MTSES but, in contrast to WT cells (Supplementary Fig. 1c–d), grew into long chains and stopped dividing when treated with MTSES (Extended Data Fig. 1b, Supplementary Fig. 1a–b, Supplementary Movie 1–2).
To probe the contribution of FtsW to sPG synthesis in vivo, we labeled nascent sPG with an alkyne-modified N-acetylmuramic acid carbohydrate derivative (alkyne-NAM) that can be incorporated into the glycan chains11. Subsequent labeling using a fluorophore-conjugated azide by “CLICK” chemistry allows for visualization and quantification of newly polymerized glycan strands12.
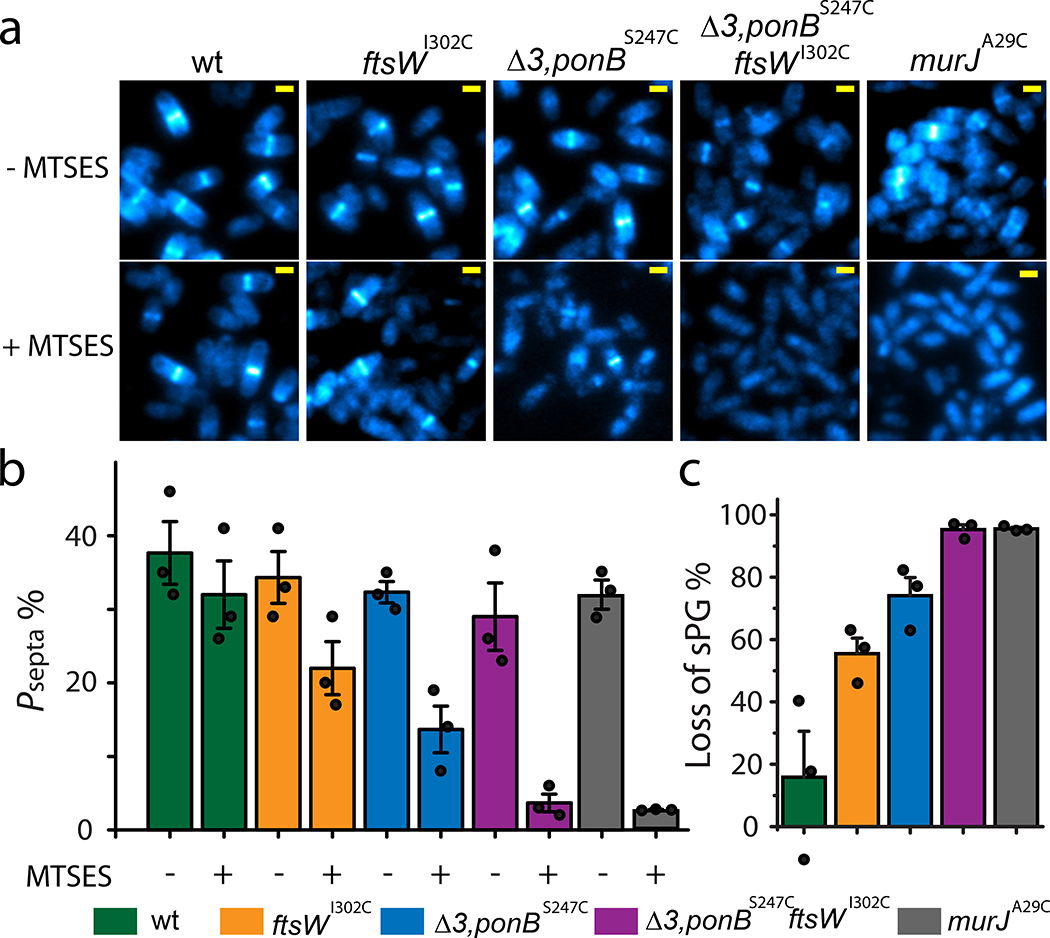
In WT cells treated with or without MTSES, we observed robust alkyne-NAM labeling (Fig. 1a, Methods) at septa. In ftsWI302C cells treated with MTSES, we observed a reduction in the percentage of cells showing septal labeling (from 34 ± 4%, n = 970 to 22 ± 4%, n = 723, the error is S.E.M. hereafter unless otherwise noted, Fig. 1a–b, Supplementary Table 3). Furthermore, in MTSES-treated ftsWI302C cells with septal labeling, the median fluorescence intensity dropped to 70 ± 4% of that of the untreated cells (Extended Data Fig. 1c, Supplementary Table 3). Thus, inhibition of FtsWI302C activity by MTSES caused a ~ 55% (100% – 22% / 34% × 70%, Fig. 1c) reduction in septal NAM labeling, consistent with a major role of FtsW in septal glycan chain polymerization. Importantly, we observed that NAM incorporation was still possible, specifically at the septum, in cells where FtsW was inactivated. These observations are consistent with previous reports showing that FtsW is not an essential lipid II flippase acting upstream of sPG synthesis13 and that other PGTases contribute to septal morphogenesis as well14. The inability of MTSES-treated ftsWI302C cells to complete cell division, even when other PGTases are still active, highlights the essential role of FtsW in successful cell wall constriction.
Figure 1. FtsW is an essential septum specific PGTase.
a. Representative images of E. coli cells of different strain backgrounds labeled with AF647-conjugated NAM in the absence or presence of MTSES from three independent experiments. The contrast of each image is adjusted for visualization of septal labeling especially for the Δ3 ponBS247C ftsWI302C and murJA29C + MTSES conditions. The absolute intensity is summarized in Supplementary Table 3. Scale bars: 1 μm. b. Mean percentage of cells with septal NAM labeling above background level in the absence or presence of MTSES. c. Mean percentage of total loss in septal NAM intensity of the five strains due to MTSES. Error bars are S.E.M. of three experimental repeats (dots). Strains used were BW25113 (wt), JXY559 (ftsWI302C), HC532 (Δ3 ponBS247C), JXY564 (Δ3 ponBS247C ftsWI302C), and JXY589 (murJA29C), all carrying plasmid pBBR1-KU.
To further investigate the relative contributions to sPG polymerization by FtsW and other relevant PGTases, we introduced ftsWI302C allele in a Δ3 ponBS247C strain background6, that lacks the genes for PBP1A, PBP1C and MtgA, and expresses a variant (S247C) of PBP1B (encoded by ponBS247C) that, like FtsWI302C, can be inactivated upon exposure to MTSES. Untreated Δ3 ponBS247C cells exhibited a near-WT percentage of labeled septa (32 ± 1%, n =1128, Fig. 1b, Supplementary Table 3). When the PGTase activity of PBP1BS247C in Δ3 ponBS247C cells was inhibited by MTSES, the percentage of labeled septa dropped to 14 ± 3 % (n = 1085) with the median intensity reduced to 65 ± 12 % of the untreated level (Fig. 1b, Supplementary Fig. 1c, Supplementary Table 3), corresponding to a total loss of septal labeling of ~ 72 % (100% – 14% / 32% × 65%, Fig. 1c). Simultaneous inactivation of both PBP1B and FtsW by MTSES in Δ3 ponBS247C ftsWI302C cells, however, led to a background level of septal NAM labeling indistinguishable from that of cells where the essential Lipid II flippase MurJ13 was inhibited (Fig. 1b–c, Supplementary Table 3). Combined with the recent evidence that purified FtsW possesses PGTase activity5, our results in live E.coli cells strongly support the notion that FtsW is an essential septal PGTase in vivo.
FtsW exhibits two different types of processive motions.
Previously, we showed that FtsZ’s treadmilling dynamics drive the processive movement of the canonical septal transpeptidase FtsI3. Because it has been shown that FtsW and FtsI form a bifunctional sPG synthase complex5,15–18, we investigated whether FtsW exhibited a movement similar to FtsI. To do so, we constructed a fully functional FtsW fusion protein with TagRFP-t (referred as FtsW-RFP for simplicity, Supplementary Fig. 1) and performed single molecule tracking (SMT) to track FtsW-RFP molecules in living E. coli cells with a 500 ms exposure time using wide-field fluorescence microscopy (Methods, Supplementary Fig. 2–3).
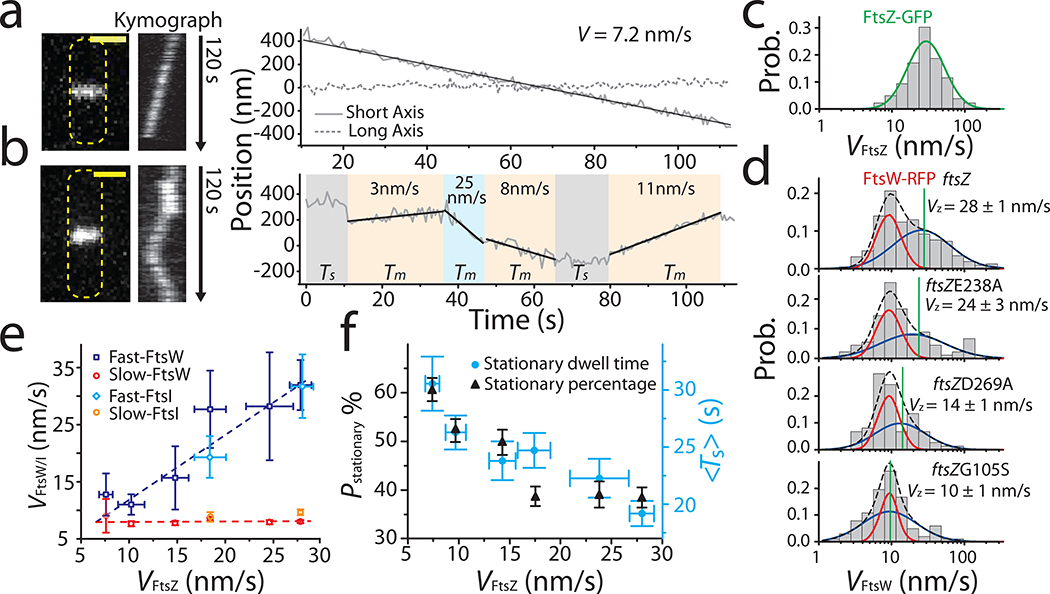
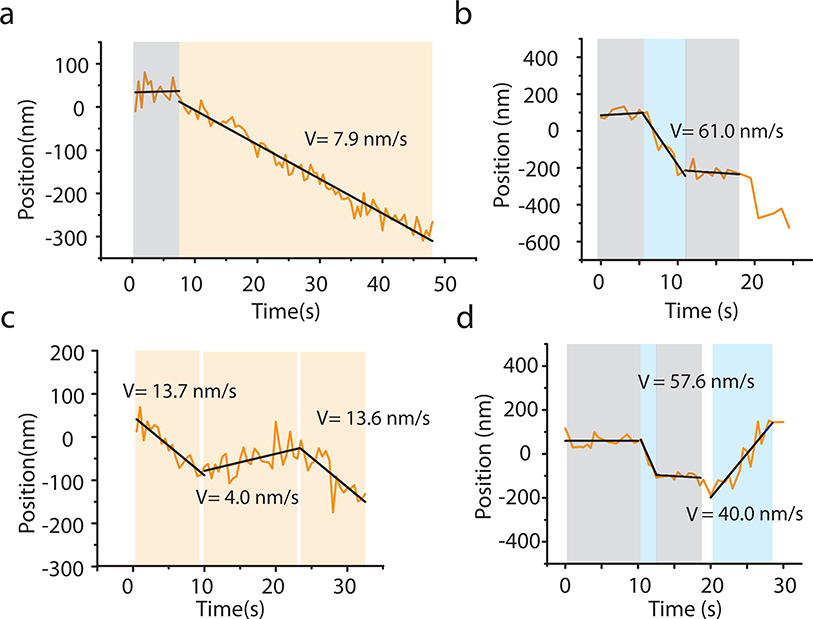
We found that many single FtsW-RFP molecules either displayed directional motions at midcell similar to FtsI3 (Fig. 2a, Supplementary Movie 3) or dynamically transitioned between segments of different speeds and directions (Fig. 2b, Extended Data Fig. 2, Supplementary Movie 4–8). Some FtsW-RFP molecules displayed confined diffusion and remained stationary at the septum (Extended Data Fig. 3a–c, Supplementary Movie S9) while others occasionally entered or left the septum (Supplementary Movie S6), indicating dynamic exchange of the enzyme between the septum and cell body. Hereafter, we only focus on the molecules at mid-cell where invagination takes place (Methods). To quantitatively identify different types of motion of FtsW molecules, we split each trajectory into multiple segments and classified each as stationary or directional-moving segments through statistical means (Fig. 2b, Supplementary Fig. 3e, Methods). Directional-moving segments were fit to a straight line to extract the speed v (Fig. 2a–b).
Figure 2. FtsW exhibits two processive moving populations that are differentially correlated with FtsZ’s treadmilling dynamics.
a, b: Representative maximum fluorescence intensity projection images (left), kymographs of fluorescence line scans at the septa (middle), and unwrapped one-dimensional (1D) positions of the corresponding FtsW-RFP molecule along the circumference (right, solid gray) and long axis (dot gray) of the cell. (a), one processively moving FtsW-RFP molecule and (b), one moving FtsW-RFP molecule that transitioned between different directions and speeds. The trajectory is segmented into different states of slow-moving (beige), fast-moving (pale blue), and stationary (gray). Tm: dwell time of moving segments, Ts: dwell time of stationary segments. Scale bars: 1 μm. c. Treadmilling speed distribution of WT FtsZ adapted from 3 overlaid with the single population fit curve (blue). d. Speed distributions of directional FtsW-RFP molecules in wt and ftsZ GTPase mutant strains overlaid with the double population fit curves (slow-moving population in red, fast-moving population in blue, and the overall fit curve in black dash lines). Average FtsZ treadmilling speed from 3 of each mutation strain (green line) is labeled as mean ± SEM. e. Decomposed mean speed of the fast population (blue: FtsW, cyan: FtsI) is correlated with FtsZ’s treadmilling speed while the speed of the slow-moving population (red: FtsW, orange: FtsI) is independent on FtsZ’s treadmilling speed. f. Percentage (dark triangles) and mean dwell time (cyan dots) of stationary FtsW molecules increased with reduced FtsZ treadmilling speed (left to right). e and f. Data are presented as mean ± SEM. The sample size of each point is listed in Supplementary Table 4 and 5.
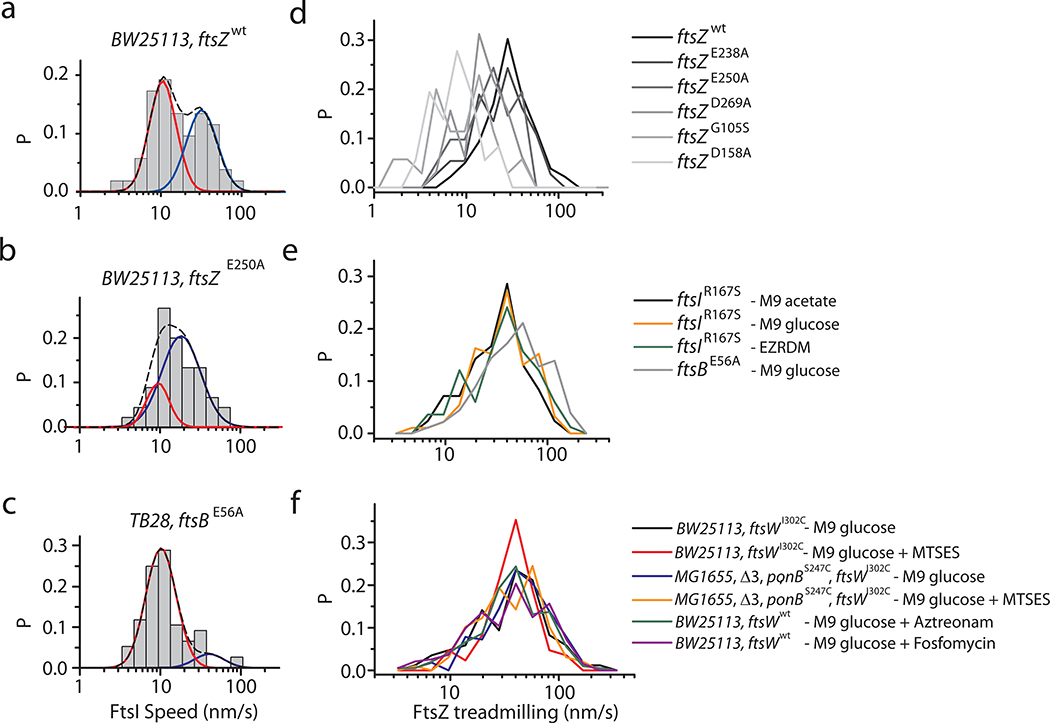
Notably, the speeds of all directional-moving FtsW-RFP molecules showed a wide distribution that was best fit by the sum of two populations (Fig. 2d, Supplementary Fig. 4, Supplementary Table 4 and 9, Methods), distinct from a single population of FtsZ’s treadmilling speed distribution (Fig. 2c). The fast-moving population (63 ± 11 %) of FtsW-RFP displayed a mean speed of 32 ± 4 nm/s, (Fig. 2d–e), close to the average speed of FtsZ treadmilling 3 (28 ± 1 nm/s, Supplementary Table 4). The slow-moving population (37 ± 11 %) had an average speed of ~ 8 nm/s (Fig. 2d, Supplementary Table 4). FtsW’s cognate transpeptidase FtsI exhibited a statistically similar, two-population speed distribution (p = 0.32, K-S test, Extended Data Fig. 4a, Supplementary Table 5).
Fast-moving FtsW molecules are coupled with FtsZ treadmilling.
To investigate how the two directional-moving populations of FtsW respond to FtsZ’s treadmilling dynamics, we performed SMT of FtsW-RFP in five strains with progressively lower FtsZ’s GTPase activity and treadmilling speed 3. Interestingly, only the speed of the fast-moving population of FtsW-RFP was highly correlated with FtsZ’s treadmilling speed, in contrast to the speed of the slow-moving population which remained relatively constant (~ 8 nm/s, Fig. 2e, Supplementary Table 4). A similar differential response of FtsI was observed in the ftsZE250A background (Fig. 2e, Extended Data Fig. 4b, Supplementary Table 5) suggesting that FtsW and FtsI likely move together as part of one sPG synthase complex. The differential responses of the two moving populations of FtsW and FtsI to FtsZ’s treadmilling dynamics suggest that the fast-moving population is correlated to FtsZ treadmilling dynamics3,19 while the slow-moving population is not. Note that in a recent study the S. pneumoniae sPG synthesis complex FtsW-PBP2x only exhibited FtsZ-independent motion20.
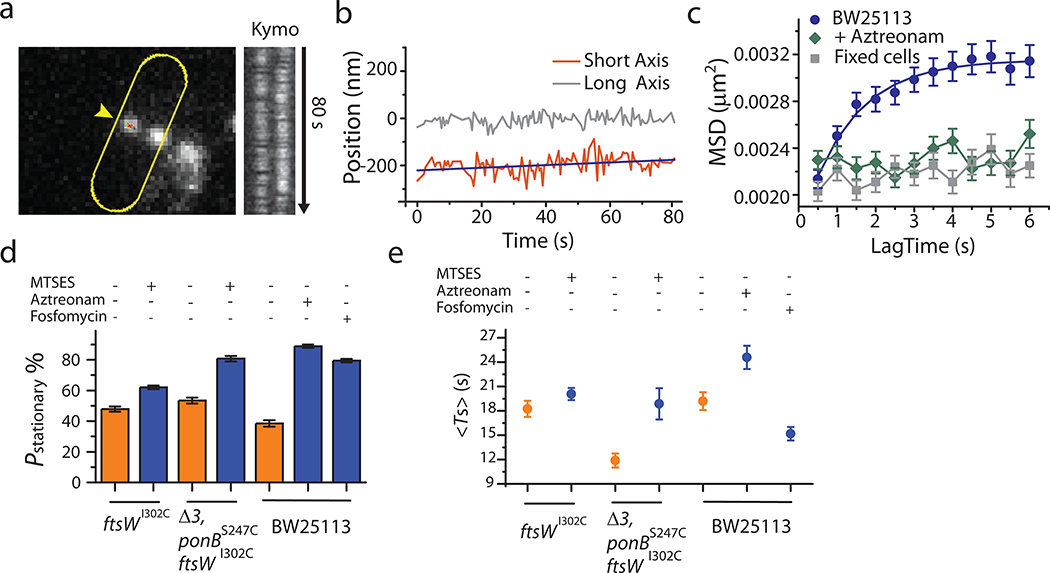
Using mean squared displacement (MSD) analysis, we found that stationary FtsW-RFP molecules in ftsZwt cells were confined in a region of 95 ± 6 nm in length (n = 179) with a small diffusion coefficient (D = 0.0007 ± 0.0002 μm2/s, Extended Data Fig. 3). Given that the confinement length is similar to the average length of FtsZ filaments (80 −160 nm)21,22, it is possible that some of these stationary FtsW molecules are bound to the middle of FtsZ filaments. Indeed, we observed that the average dwell time and percentage of the stationary population increased as the treadmilling speed of FtsZ decreased (Fig. 2f, Supplementary Table 4), in line with the increased FtsZ filament length in FtsZ GTPase mutants in a recent study23. Interestingly, the average dwell time of stationary FtsW-RFP in WT cells (19 ± 1 s, Fig. 2f, Supplementary Table 4) is two-folds longer than the lifetime of FtsZ monomers (8 ± 1 s)23, indicating that other mechanism(s) may also be at play to maintain this stationary population of FtsW-RFP, as we will further discuss below.
Slow-moving FtsW molecules are engaged with active sPG synthesis.
Our previous work showed that the overall sPG synthesis activity is not affected in E. coli FtsZ GTPase mutants3,24. Accordingly, it is likely that the FtsZ-dependent, fast-moving FtsW and FtsI molecules are inactive while the FtsZ-independent, slow-moving population is active in sPG synthesis. To examine this possibility, we investigated the speed distributions of FtsW-RFP molecules under conditions of altered sPG synthesis activity.
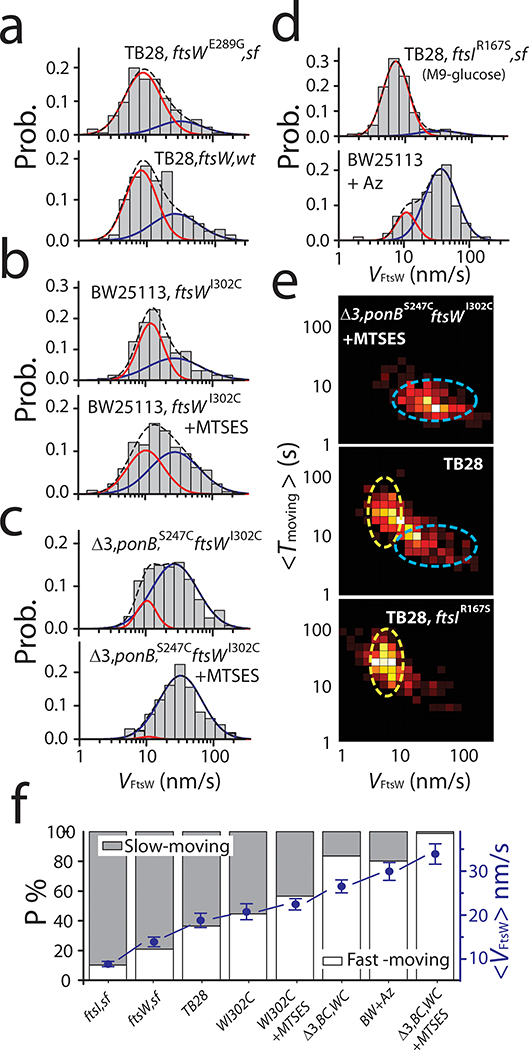
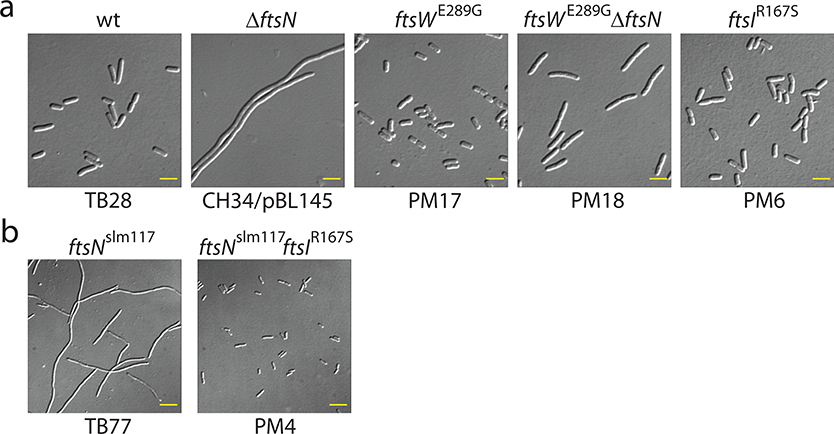
We first sought to examine conditions where the PGTase activity is enhanced or inhibited (Fig. 3a–c). We isolated a superfission (SF) allele of ftsW (ftsWE289G), which alleviates the need for FtsN, an otherwise essential positive regulator of sPG synthesis (Methods, Extended Data Fig. 5a). This mutation has also been recently identified to enhance sPG synthesis in another study25. SMT of FtsWE289G-RFP in ftsWE289G cells again revealed two populations, but the slow-moving population increased from 64 ± 8 % (TB28 cells) to 79 ± 6 % (n = 176, Fig. 3a, Supplementary Table 6), likely in response to higher sPG synthesis activity.
Figure 3: The slow-moving population of FtsW increases with enhanced sPG synthesis activity and depletes with reduced sPG synthesis activity.
a-d. Histograms of directional moving speeds of FtsW-RFP (gray bar) overlaid with two population fitting curves (slow-moving population in red, fast-moving population in blue, and overall fit curve in black dash lines). (a) The SF variant FtsWE289G-RFP in the TB28, ftsWE289G strain background (top) shows increased slow-moving population (red curve) compared to that of wildtype FtsW-RFP in the parental TB28 strain background. (b). FtsWI302C-RFP in JXY559 (ftsWI302C) in the absence (top) of MTSES shows increased slow-moving population (red curve) compared to that in the presence of MTSES where FtsW activity is inhibited (bottom). (c). FtsWI302C-RFP in JXY564 (Δ3, ponBS247C, ftsWI302C) in the presence of MTSES exhibits nearly completely abolished slow-moving population (bottom) compared to that in the already diminished slow-moving population in the absence of MTSES (top). (d) Wildtype FtsW-RFP in the FtsI superfission strain TB28, ftsIR167S background in M9-glucose medium (top) exhibits the most enhanced slow-moving population compared to that in the BW25113 (wt) strain treated with FtsI-inhibitor Aztreonam. e. 2D-heatmap of the moving speed and dwell time of directional moving FtsW (or FtsWI302C)–RFP molecules in normal growth condition (M9-glucose, middle), all PGTase inhibited condition (top), and FtsI superfission strain (bottom). The slow-moving population with long dwell time (yellow oval) and the fast-moving population with short dwell time (blue oval) are marked as a guide for the eyes. f. Percentage of the slow- (gray bar) and fast- (white bar) moving population under all the conditions in a-d. Average moving speeds under all the conditions are plotted in blue dots. Data are presented as mean ± SEM. For the sample size of each point see Supplementary Table 6.
Next, we either partially or completely inhibited septal glycan strand polymerization using MTSES on the aforementioned strains. In the BW25113 ftsWI302C background without MTSES, we again observed two directional-moving populations of FtsWI302C-RFP, one fast at 34 ± 3 nm/s (45 ± 7%) and one slow at 11 ± 1 nm/s (55 ± 7%, n = 192, Fig. 3b, Supplementary Table 6). In the presence of MTSES, the slow-moving population was reduced to 43 ± 9% (Fig. 3b, n = 339, Supplementary Table 6) as sPG synthesis was partially inhibited. The remaining slow-moving population of FtsW could be driven by sPG synthesis activity from other PGTases (PBP1A, 1B, 1C, and MtgA) in the context of the sPG synthesis complex. To verify this possibility, we tracked FtsWI302C-RFP molecules in the Δ3 ponBS247C ftsWI302C background and found that even in the absence of MTSES, the slow-moving population reduced to 17 ± 6 % (n = 276, Fig. 3c), suggesting that the overall PGTase activity decrease (Fig. 1c) indeed depletes the slow-moving population of FtsW. Further abolishing all PGTase activity by MTSES (~99% reduction of sPG synthesis, Supplementary Table 3) caused a near complete depletion of the slow-moving population to 1 ± 3%, (n = 157, Fig. 3c and f). Notably, FtsZ’s treadmilling speed distribution remained unchanged under these conditions (Extended Data Fig. 4c, Supplementary Table 6).
Besides the PGTase activity, we wondered how the TPase activity affects the slow-moving population. We tracked FtsW-RFP molecules in cells expressing a superfission variant of FtsI (FtsIR167S) that alleviates the need of FtsN but does so only partially (Extended Data Fig. 5, Table S7). In ftsIR167S cells, more than 90% of FtsW-RFP molecules (n = 255, Fig. 3d, Supplementary Table 6) moved slowly at 6.4 ± 0.2 nm/s. The average speed was drastically reduced to 8.8 ± 0.6 nm/s (Fig. 3f, Supplementary Table 6). When FtsI’s TPase activity was specifically inhibited by Aztreonam26, we observed that the slow-moving population was reduced from 37 ± 11 % to 20 ± 8 % (n = 102, Fig. 3d), whereas the fast-moving population dominated with a similar speed as FtsZ’s treadmilling (Fig. 3d, Extended Data Fig. 4c). These results not only support the hypothesis that the slow-moving population of FtsW depends on active sPG synthesis, but also indicate that the crosslinking of sPG by FtsI’s TPase activity is equally important as the polymerization of glycan strands by FtsW to drive the processive movement of the sPG synthase complex. Similar dependence has been found in the PG synthesis complex of the elongasome (RodA-PBP2) where the canonical transpeptidase activity is required for the processive movement6,27.
Additionally, we found that the two moving populations of FtsW are also separated in the time domain. We measured the dwell time that individual FtsW-RFP molecules spent at a constant speed (Methods, Fig. 2b) and found that the slow-moving molecules exhibit notably longer dwell times than the fast-moving ones (Fig. 3e). In the sPG synthesis abolished condition (Δ3 ponBS247C ftsWI302C+MTSES), the fast-moving, short-lived population (6 ± 3 s, μ ± s.d. n = 157) became dominant, while the slow-moving, long-lived population (25 ± 16 s, μ ± s.d., n = 255) dominated in the superfission ftsIR167S background (Fig. 3e, Supplementary Fig. 5). These observations further confirmed that the fast- and slow-moving populations of FtsW-RFP molecules are distinct from each other and dependent on FtsZ dynamics or sPG synthesis respectively.
The fraction and speed of slow-moving FtsW molecules are correlated with the cell wall precursor level.
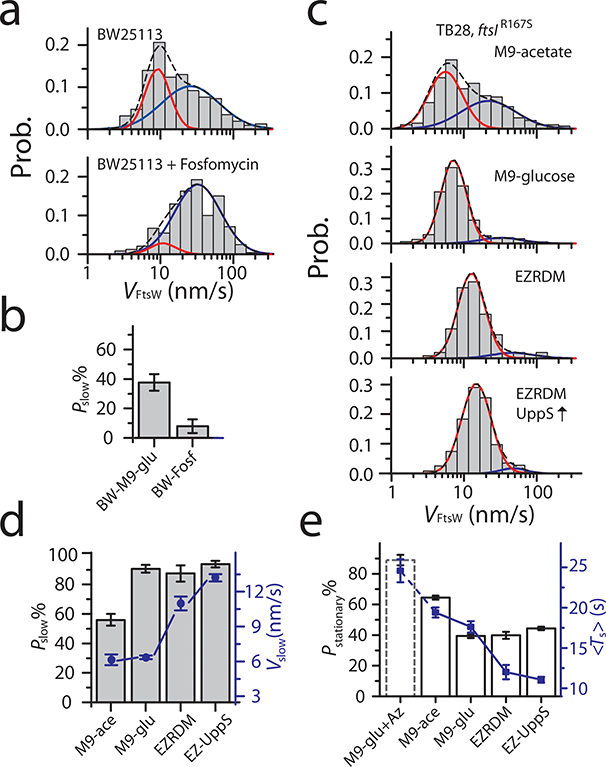
One factor controlling the sPG synthesis rate is the availability of cell wall precursors. In E. coli under balanced growth, the cellular level of precursors limits cell growth and cell wall constriction rates28,29. If the slow-moving population of FtsW were indeed driven by sPG synthesis activity, its size and speed might be modulated by the level of available precursors. To test this possibility, we first depleted precursor Lipid II in WT BW25113 cells using Fosfomycin30 and found that the slow-moving population was almost completely diminished (8 ± 9 %, n = 239, Fig. 4a–b, Supplementary Table 6).
Figure 4. Rich growth condition promotes the slow-moving population of FtsW.
a-c. Histograms of directional moving speeds of FtsW-RFP (gray bar) overlaid with slow- (red) and fast-moving (blue) population fit curves, and the overall fit curve (black dash). a. FtsW-RFP in BW25113 cells in M9-glucose medium (top, replot from Fig. 2d) and treated with Fosfomycin to deplete the lipid II precursor pool (bottom). b. The slow-moving population of FtsW-RFP decreases upon depletion of lipidII (Fosfomycin treatment). c. FtsW-RFP in FtsI SF strain ftsIR167S (PM6) grown in M9-acetate, M9-glucose, EZRDM, or in EZRDM medium and with UppS overproduction (top to bottom). d. The percentage (gray bar) and average speed (blue dot) of the slow-moving population increases in media with enhanced growth conditions. e. Percentage (white bars) of stationary FtsW-RFP molecules decreases and reaches a plateau with enhanced growth conditions whereas and average dwell time (blue squares) continues to decrease. BW25113 wt cells treated with Aztreonam treatment (dashed bar, M9-glu+Az) is shown as a comparison. The corresponding constriction rates for all the growth conditions are listed in Supplementary Table 8. b, d, and e. Data are presented as mean ± SEM where the SEM is estimated by bootstrapping (For details regarding statistics and plot definitions see the “Statistics” subheading in “Methods”).
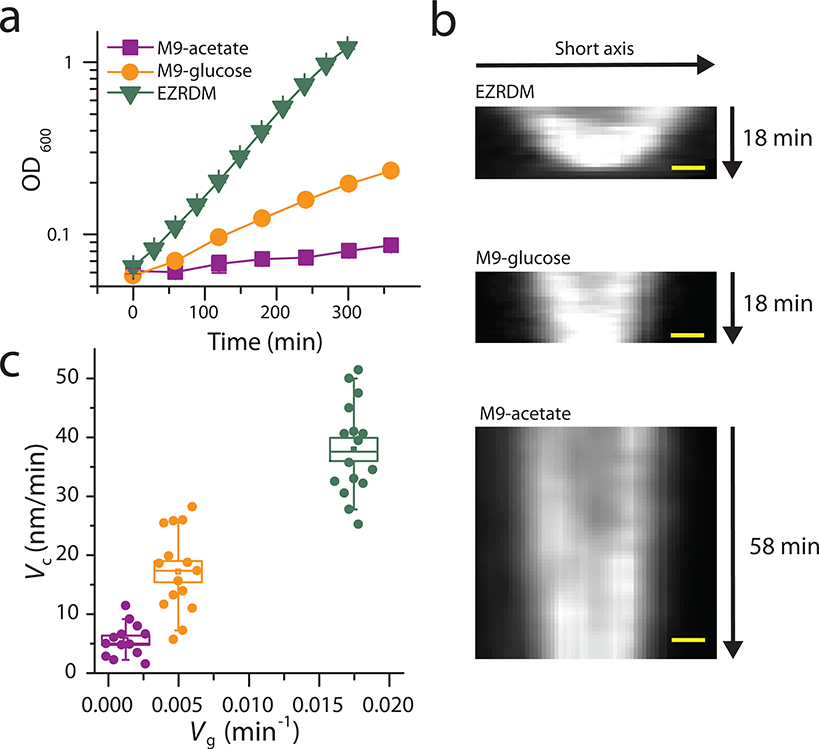
Next, we used M9 minimal medium containing acetate or glucose as the carbon source or EZ rich defined medium (EZRDM) to vary the PG precursors level. We measured the cell wall constriction rates of ftsIR167S cells in these media, which acts as an indicator for the available level of PG precursors24 (EZRDM > M9-glucose > M9-acetate, Methods, Extended Data Fig. 6, Supplementary Table 8). We then tracked FtsW-RFP molecules under these different growth conditions. As shown in Fig. 4c, the fast-moving population, originally diminished in the M9-glucose medium in ftsIR167S cells, re-appeared in M9-acetate (44.4 ± 4.8 %, n = 260, Fig. 4c). This result, together with Fosfomycin treated condition, supports our hypothesis that the percentage of slow-moving FtsW molecules is also governed by the level of cell wall precursors.
In rich growth medium (EZRDM), the percentage of slow-moving population stayed around 90% (Fig. 4d), similar to that in M9-glucose. However, the average speed of the slow-moving population accelerated to 11 ± 1 nm/s (n = 92, Fig. 4c–d), ~ 72% higher than in M9-glucose (6.4 ± 0.2 nm/s). This faster speed of FtsW-RFP is still slower than FtsZ’s treadmilling speed (37 ± 1 nm/s, Extended Data Fig. 4e, Supplementary Table 6), confirming that this population is not coupled to FtsZ’s treadmilling but likely arises from accelerated sPG synthesis with more precursors.
Finally, to further upregulate Lipid II precursor levels, we grew these cells in EZDRM and induced the expression of the undecaprenyl pyrophosphate synthetase UppS 13. Under this condition, we observed a further increase in the slow-moving speed to 13.2 ± 0.3 nm/s (n = 513, Fig. 4c–d). Taken together, these results suggest that the percentage of the slow-moving population reflects the relative amount of active FtsW molecules engaged in sPG synthesis, and its speed likely reflects the in vivo sPG polymerization rate at the individual enzyme molecule level.
Stationary FtsW molecules are either FtsZ bound or stalled on sPG synthesis sites.
In the above experiments, we also observed changes in the percentages and dwell times of the stationary population of FtsW-RFP (Fig. 4e). The percentage of stationary molecules decreased as the expected cell wall precursor levels increased and reached a plateau at ~ 40% under the M9-glucose, EZRDM and UppS-overexpression conditions (Fig. 4e). The average dwell time of stationary FtsW-RFP molecules decreased and approached the mean lifetime of FtsZ monomers at ~ 8 s23(Fig. 4e).
These results, together with those from the experiments of FtsZ GTPase mutants (Fig. 2f), suggest that at least two subpopulations of stationary FtsW molecules may exist. One likely represents molecules bound to internal subunits of FtsZ filaments, and their dwell time and abundance are determined by FtsZ’s treadmilling speed (Fig. 2f). The other subpopulation may represent FtsW molecules that are stalled at sPG synthesis sites waiting for lipid II. Indeed, the percentage and mean dwell time of this subpopulation shrank as the level of cell wall precursors increased (Fig. 4d, Extended Data Fig. 3d–e, Supplementary Table 6).
Most importantly, in cells treated with Aztreonam, we observed the largest increase of the dwell time and percentage of the stationary population to 25 ± 1 sec and 89 ± 3 % respectively (n = 347, Fig. 4e, Supplementary Table 6). Under this condition, FtsW molecules are engaged in a futile sPG synthesis cycle in which it continues to polymerize glycan strands that are blocked from being crosslinked by FtsI and are subsequently degraded31. Therefore, the lack of FtsI’s crosslinking activity may prevent directional movement while the continuous polymerization activity of FtsW prevents its dissociation from the glycan strand. Consistent with this hypothesis, the confinement size of the stationary FtsW-RFP molecules decreased and became indistinguishable from that of the fixed sample (Extended Data Fig. 7c). This type of stationary, inactive, and PG-bound state has also been reported for E. coli PBP2, the counterpart of FtsI in the cell elongation machinery27.
FtsN activates FtsW and promotes the switch from fast to slow motion.
Our results so far suggest that two processively moving populations of FtsW exist in vivo. What determines the partitioning of these two populations? Previous studies in E. coli have shown that when FtsW and FtsI are first recruited to the division site by a complex of the FtsB, FtsL and FtsQ proteins (FtsQLB), they are kept in an inactive state until the arrival of FtsN, which activates the sPG synthesis complex32,33. Thus, FtsN may play an important role in triggering the transition of FtsW from the fast-moving (FtsZ-dependent) to slow-moving (sPG synthesis-dependent) state.
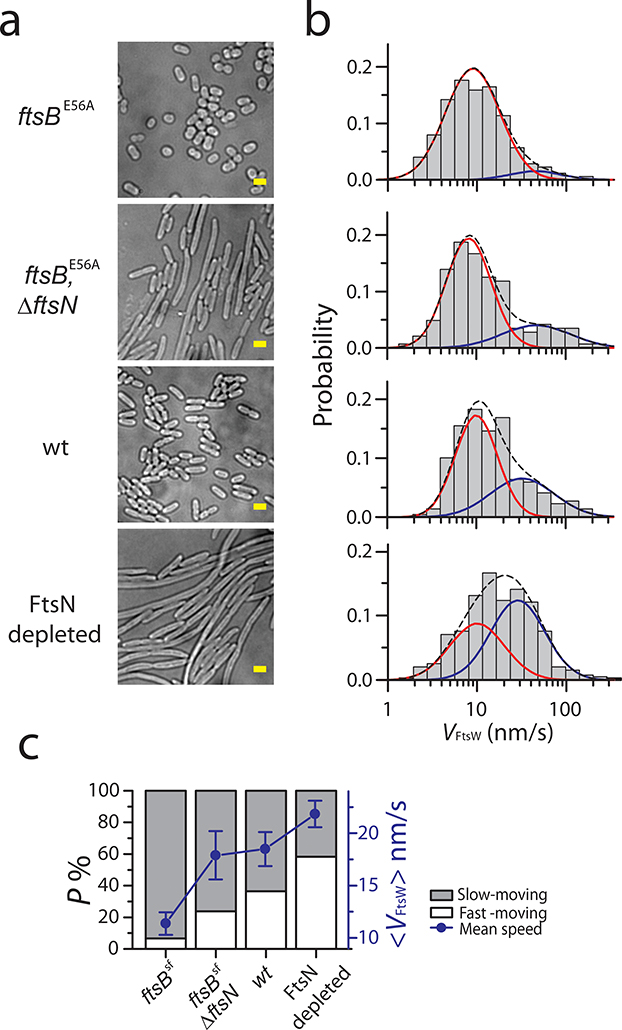
To test this hypothesis, we tracked FtsW-RFP using an FtsN-depletion strain34 where the average cellular FtsN level decreased to ~ 44% of that in WT cells (Methods, Supplementary Fig. 6) and many cells grew into long filaments with shallow constrictions (Fig. 5a). As expected, the slow-moving population of FtsW-RFP reduced from 64 ± 8% to 42±15 % (n = 398, Fig. 5b, Supplementary Table 6), consistent with the role of FtsN in promoting the slow-moving, or active, population of FtsW.
Figure 5. FtsN plays an important role in promoting the slow-moving population of FtsW.
a. Representative bright-field images of ftsBE56A (BL167), ftsBE56A ΔftsN (BL173), WT (TB28), and FtsN-depleted cells (EC1908) from three independent experiments. Scale bars: 2 μm b. Histograms of directional moving speeds of FtsW-RFP (gray bar) overlaid with slow- (red) and fast-moving (blue) population fit curves, and the overall fit curve (black dash) in cells corresponding to a on the left (in M9-glucose medium). c. Average FtsW-RFP moving speeds (blue dots) and percentage of the slow- (gray bar) and fast- (white bar) moving populations under the conditions in a-b. Data are presented as mean ± SEM. For the sample size of each point see Supplementary Table 6.
Next, to assess the effects of FtsN on FtsW dynamics under conditions were FtsN is no longer essential, we monitored single FtsW-RFP molecules in a ftsBE56A SF strain that still produces FtsN, and also in strain ftsBE56 ΔftsN that lacks FtsN. The ftsBE56A superfission allele causes cells to initiate sPG synthesis earlier in the division cycle than normal, leading to a small-cell phenotype32 (Fig. 5a). While it also allows cells to grow and divide in the complete absence of FtsN, ftsBE56AΔftsN cells divide less efficiently than wt and are modestly elongated32 (Fig. 5a, Supplementary Table 7). In ftsBE56A cells, we observed more slow-moving FtsW-RFP molecules (Fig. 5b); the fast-moving, FtsZ-dependent population was essentially abolished (Fig. 5b–c, Supplementary Table 6). In ftsBE56AΔftsN cells, the slow-moving population was reduced while the fast-moving population recovered to a level close to that in WT cells (24 ± 4 %, n = 144, Fig. 5b, Supplementary Table 6). These results indicate that even though FtsN is no longer essential in the SF ftsBE56A background, it still contributes to the transitioning of FtsW from the fast-moving, FtsZ-dependent state to the slow-moving, sPG synthesis-dependent mode.
Discussion
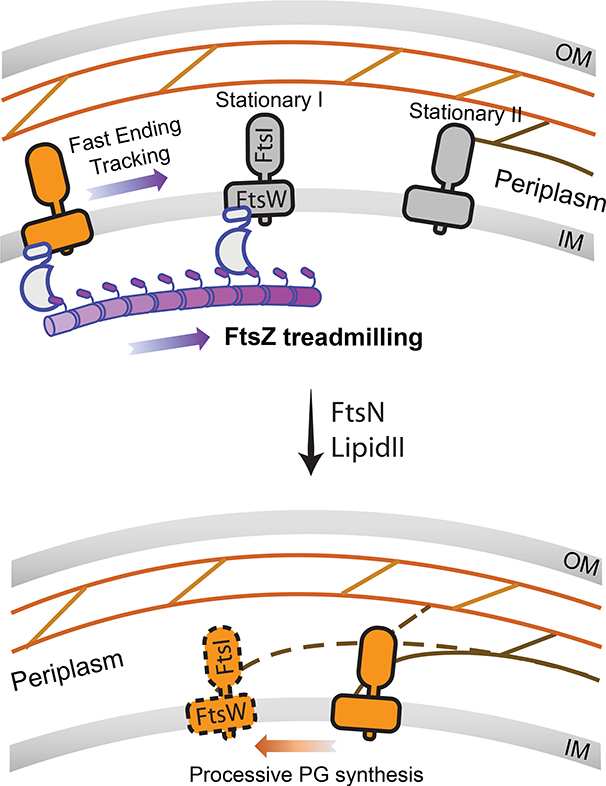
Taken together, our data support a two-track model (Fig. 6). In this model, directional-moving FtsW and FtsI, and possibly other sPG remodeling enzymes, occupy at least two “tracks” within the septum: a fast “Z-track” representing inactive molecules end-trailing treadmilling FtsZ polymers19, and a slow “sPG-track” representing active molecules synthesizing sPG. Based on the speed of slow-moving FtsW and FtsI molecules, the sPG polymerization rate in live E. coli cells is likely ~ 6 to 14 disaccharides per second (one disaccharide is ~ 1 nm35), on par with what we estimated from previous biochemical labeling experiments36 (Supplementary Discussion). Stationary FtsWI molecules are likely bound to the middle of FtsZ filaments or trapped at sPG synthesis sites waiting for available lipid II or other factors to initiate/continue sPG synthesis, or to depart the sPG-track to engage FtsZ again. Our data further suggest that FtsN promotes the release of inactive sPG synthase from treadmilling FtsZ polymers to pursue the sPG-track for active synthesis. In this scenario, FtsWI may associate with regulators of sPG synthesis activity such as FtsN and FtsQLB on either or both tracks, and switch between active and inactive states based on appropriate input by the regulatory proteins. Future studies on the dynamics of the FtsQLB and FtsN proteins should help elucidate how they control FtsWI activity and cell wall constriction in molecular details.
Figure 6. A two-track model integrating spatial information into the regulation of sPG synthase activity.
Inactive synthase FtsWI complex follows the treadmilling FtsZ filament (Z-track, top) and is transported to different locations along the septum. Active FtsWI complex engages in processive septal cell wall synthesis along the sPG track (bottom). FtsN and the available level of cell wall synthesis precursor Lipid II play important roles in promoting the release of inactive FtsWI from the Z-track to pursue sPG synthesis on the sPG-track. Stationary FtsWI complexes (grey molecules, left panel) likely include those bound to internal subunits of FtsZ filaments until the shrinking end approaches, and those bound at sPG synthesis sites waiting for factors (e.g. lipid II substrate or the activator FtsN) to start or continue sPG synthesis.
Methods
Statistics
The standard error of mean (SEM) of the percentage and dwell time in stationary states (Fig. 2f, 4e, Extended Fig. 3d–e) was estimated by bootstrapping all single molecule segments 1000 times and calculation of the standard deviation of the means. To estimate the speed (Fig. 2e and 4d) and size (Fig. 3f and Fig. 4b and d, Fig. 5c) of the slow- and fast- moving population, the speed values of all segments were bootstrapped 1000 time to construct 1000 CDF curve for non-linear regression. Each curve was fit to obtain the speed and percentage of each population. The SEM was estimated as the standard deviation of the 1000 fit parameters.
Strains, plasmids and growth media
Cells were grown in Luria-Bertani (LB) medium, EZ Rich Defined Medium (EZRDM)37, M9-glucose minimal medium (0.4% D-glucose, 1X MEM amino acids, and 1X MEM Vitamin), or M9-acetate minimal medium (3.4 g/L acetate, pH = 7.0, 1X MEM amino acids, and 1X MEM Vitamin) as specified. For single molecule tracking experiments, vitamins were omitted from the M9 medium to minimize background. Where appropriate, antibiotics were included at 25 μg/ml (carbenicillin, kanamycin), 35 μg/ml (chloramphenicol), or 50 μg/ml (ampicillin, spectinomycin), unless specified otherwise.
In most cases, new plasmids were assembled by amplifying appropriate DNA fragments followed by In-fusion cloning (TaKaRa, In-Fusion® HD Cloning Kit). The Quikchange Lightening Kit was used for site-directed mutagenesis (SDM) of plasmid DNA when needed. All primers used for Polymerase Chain Reactions (PCR) or SDM are listed in Supplementary Table 2.
The FtsW-TagRFP-T (FtsW-RFP) fusion protein contains a peptide linker of 15 amino acids (GGGGSPAPAPGGGGS) between the C-terminus of FtsW and N-terminus of TagRFP-T. To generate plasmids encoding this fusion protein, the ftsW gene was amplified from the chromosome of E. coli strain BW25113 with primers 1 and 2, the tagrfp-t gene was amplified from plasmid pJB0073 with primers 3 and 4, and the vector backbone of plasmid pXY02738 was amplified with primers 5 and 6. The three DNA fragments were then joined to generate plasmid pXY253. Next, the antibiotic resistance gene on pXY253 was swapped from cat to bla to yield the plasmid pJL018. To do so, all of pXY253 except for the cat gene was amplified with primers 9 and 10, the bla gene was amplified from plasmid pKD46 with primers 11 and 12, and the two fragments were joined. The −35 region of the lacIQ promoter (GTGCAA) on pJL018 was optimized to TTGACA (lacIQ1) by SDM with primers 7 and 8, to further suppress the basal expression of FtsW-TagRFP-T to a level that is sufficiently low for single molecule tracking39. Further SDM of resulting plasmid pXY349 with primers 13–38 yielded plasmids encoding a single cysteine variant of FtsW-RFP (Supplementary Table 1). The TagRFP-T-FtsI (RFP-FtsI) fusion protein is an N-terminal fusion without any linker. The first methionine of FtsI was removed to minimize the expression of WT FtsI. To generate plasmid pXY388, a linker sequence was first removed from plasmid pJB007 by its amplification and recircularization using primers 55 and 56 by In-fusion cloning. The antibiotic resistance gene was then swapped from cat to aph and the lacIQ was replaced by lacIQ1, as described above.
Plasmid pCH650 for UppS overexpression was obtained by replacing the 24 bp XbaI-HindIII fragment of pBAD33 with the 804 bp XbaI-HindIII fragment of pHC808.
For measuring cell constriction rates by time lapse imaging, plasmid pXY018 was modified to encode mNeonGreen-ZapA, rather than GFP-ZapA, resulting in a brighter and more stable fluorescent fusion protein. The mNeonGreen gene was amplified with primers 57 and 58 from the chromosome of strain JXY263, which contains the sandwich ftsZ-mNeonGreen fusion gene40. The vector backbone containing the zapA gene was amplified from plasmid pXY018 with primers 59 and 60. The two DNA fragments were then joined to generate plasmid pXY677.
To generate the FtsW-depletion strain JXY304/pXY287, we first constructed a readily curable plasmid expressing wildtype FtsW under arabinose induction. The Bacillus subtilis sacB gene, which confers sensitivity to sucrose in E. coli, was amplified from pGH34 (gift from Dr. Glenn Hauk) with primers 39 and 40. The plasmid pDSW406 (pBAD33-ftsW) was linearized and amplified using primers 41 and 42. In-fusion joining of the two fragments yielded plasmid pXY287. BW25113 wildtype cells were transformed with pXY287, and the chromosomal ftsW gene of BW25113/pXY287 cells was replaced with the aph (kanamycin resistance) gene using λ-red recombination41 with an aph fragment that was amplified from plasmid pKD13 using primers 43 and 44. As expected, the resulting strain (JXY304/pXY287) is not viable in the absence of L-arabinose or in the presence of 6% sucrose.
To create a chromosomal ftsW-tagrfp-t allele, a fragment encoding the 15-residue linker (see above) and TagRFP-T was inserted immediately downstream of ftsW in strain BW25113 using a coupled CRISPR-Cas9/λ-red recombineering system developed by Dr. Glenn Hauk. First, a potential sgRNA-binding DNA sequence near the 3’ end of ftsW gene (AGGTTCACGATGAGTGGTCAAGG) was selected using ChopChop (https://chopchop.cbu.uib.no/)42. Primers 45–48 were then used to construct plasmid pJM19, which encodes a sgRNA targeting the original AGGTTCACGATGAGTGGTCA sequence. Briefly, the sgRNA sequence was created using primers 47 (which includes the protospacer region) and 48, with pGH34 as template, and the fragment was inserted in pGH34 that had been amplified with primer 45 and 46. Next, a dsDNA fragment bearing linker-tagrfp-t flanked by 50 bp sequences homologous to the ftsW locus, was amplified from pXY349 with primers 51 and 52. BW25113 cells were then co-transformed with plasmids pKD46 and pGH33, and a 50 ml culture of BW25113/pKD46/pGH33 cells was grown at 30°C to log-phase (OD600 = 0.5). Arabinose was added to a final concertation of 0.2%. After another hour of growth, cells were harvested and used to prepare a 0.5 ml suspension of electrocompetent cells using a standard protocol (Short Protocols in Molecular Biology, Chapter 1). An aliquot (75 μl) was then used for electro-transformation with 100 ng pJM19 and 500 ng of the linker-tagrfp-t fragment. After recovery at 30°C for 90 mins, the entire mixture was plated on LB agar containing 60 μg/ml carbenicillin (CB), 50 μg/ml kanamycin (KAN), and 75 μg/ml chloramphenicol (CAM), and incubated at 30°C for 30 hrs. The CRISPR-Cas9 complex in these cells was designed to cut the native ftsW gene, causing most cells to die. However, cells bearing the desired ftsW-tagrfp-t gene should survive, as this recombinant allele is not recognized by the sgRNA. Survivors were screened by colony-PCR and cured of the three plasmids by growth at 37°C in the presence of 6% sucrose and absence of antibiotics. Presence of the chromosomal ftsW-tagrfp-t allele in the cured strain (JXY422) was verified by colony-PCR again. Strains with the chromosomal ftsWI302C allele (JXY559, JXY564) or murJA29C allele (JXY589) were generated using a similar method. Plasmids pXY550 and pXY588 encoding the sgRNAs targeting wild type ftsW or murJ gene were obtained by the same method as pJM19, but by using primers 49 (ftsW) and 50 (murJ) instead of 47. In this case, λ-red recombineering was performed with a mutagenic ssDNA fragment harboring the appropriate single codon mutation and flanking sequences (primer 53 and 54 for ftsWI302C and murJA29C respectively).
To track FtsW-TagRFP-T molecules in ftsZ mutant cells, JXY001 (ftsZG105S), JXY002 (ftsZE250A), JXY003 (ftsZD158A), JXY005 (ftsZE238A), and JXY006 (ftsZD269A) were transformed with plasmid pXY349.
The isolation and characterization of the ftsIR167S and ftsWE289G superfission alleles will be described in extensive detail in a future publication elsewhere. Briefly, both alleles were selected from plasmid libraries with randomly mutagenized ftsW or ftsI, based on the abilities of the library plasmids to i) confer viability to ΔftsN cells, and ii) to suppress the division defects of strain TB77 (ftsNslm117). The ftsIR167S and ftsWE289G alleles were next moved onto a repAts pSC101-derivative to allow for allelic exchange between the resulting plasmids and the chromosome by the method of Hamilton et al43. Such exchange in cells of strain TB77 then resulted in strains PM4 (ftsNslm117 ftsIR167S) and PM15 (ftsNslm117 ftsWE289G), respectively. Strain PM6 was next obtained by P1-mediated co-transduction of ftsIR167S with leu+ from PM4 to BL17, and PM8 by transduction of ftsN::aph (ΔftsN) from CH34/pCH201 to PM6. Similarly, strain PM17 was obtained by co-transduction of ftsWE289G with leu+ from PM15 to BL17, and PM18 by transduction of ftsN::aph from CH34/pCH201 to PM17.
FtsW-RFP single cysteine mutants
To test single cysteine variants of FtsW-RFP for inactivation with MTSES, we designed 13 unique single-Cys substitutions based on the RodA structure9,44. Plasmids bearing those mutated ftsW genes (in Supplementary Table 1) were introduced into strain JXY304/pXY287. Purified transformants were grown overnight at 37°C in LB medium containing 0.2% L-arabinose. Cultures were then diluted 1000 times in M9 medium with 0.4% D-glucose and 100 μM IPTG to simultaneously suppress expression of native FtsW from pXY287 and induce expression of the single cysteine FtsW-RFP variant from the newly introduced plasmid. Cultures were split in two and incubated at 37°C until they reached a cell density between 0.2–0.3 (OD600). MTSES (to 1 mM) was added to one of each duplicate culture, and growth was continued for 3–4 additional cell cycles (~ 3 hrs). Cells from 1 mL of each culture were fixed with 3.8% paraformaldehyde for 20min at RT, and then imaged by bright field microscopy. Observed cell morphologies were categorized into four classes (Extended Data Fig. 1): 1. Near normal morphology, regardless of MTSES treatment. 2. MTSES causes increased cell length, but not the formation of long, septated cell chains. 3. MTSES causes the formation of long cell chains with partially completed septa. 4. Formation of long cell chains or filaments, even in the absence of MTSES.
Western blotting
For FtsW-TagRFP-T immunoblotting, 25 mL BW25113 and JXY422 cells were harvested by centrifugation at OD600 ~ 0.3 and resuspended in 100 μL 1X BugBuster Protein Extraction Reagent (MilliporeSigma). The mixture was constantly agitated in a rotator at RT for 3 – 4 hours. 100 μL 2X SDS gel‐loading buffer was then add to the tube and mix by pipetting. The mixture was agitated in a rotator for another 3 hours at RT or incubated at 4 °C overnight. 20uL of the mixtures were applied to a 10% SDS‐PAGE gel and electroblotted onto nitrocellulose membranes. Note that because FtsW is prone to aggregation, the whole process was performed at RT or 4 °C. After blocking in TBS with 0.05% (v/v) Tween‐20 and 5% (w/v) non‐fat dry milk, membranes were incubated with RFP Polyclonal Antibody (ThermoFisher, R10367) diluted 1:2000 in TBS with 0.05% (v/v) Tween‐20 and 1% (w/v) BSA. FtsW-TagRFP-T bands were detected using goat anti‐rabbit HRP (1:50,000 dilution; Bio‐Rad #1706515) and Clarity TM Western ECL Substrate (Bio‐Rad). Band intensities were quantified using ImageJ (version 1.52p)45 Gel Analysis Tool.
For FtsN immunoblotting, 3mL MG1655 and EC1908 (with or without Arabinose) cells were harvested by centrifugation at OD600 ~ 0.3 and resuspended in 50 μL M9 medium. 50 μL 2X SDS gel‐loading buffer was then add to the tube and boiled at 95 °C for 10 min. 10 uL of the mixtures were applied to a 10% SDS‐PAGE gel and electroblotted onto nitrocellulose membranes. After blocking in TBS with 0.05% (v/v) Tween‐20 and 5% (w/v) non‐fat dry milk, membranes were incubated with anti-FtsN serum (a gift from Dr. David Weiss) diluted 1:5000 in TBS with 0.05% (v/v) Tween‐20 and 1% (w/v) BSA. FtsN bands were detected using goat anti‐rabbit HRP (1:50,000 dilution; Bio‐Rad #1706515) and imaged after treatment with Clarity TM Western ECL Substrate (Bio‐Rad). Band intensities were quantified using ImageJ (version 1.52p)45 Gel Analysis Tool.
Glycan strain labeling using NAM-KU system
Cultures of the appropriate strains harboring plasmid pBBR1-KU were grown overnight at 37 °C in LB medium, diluted 1:200 into 3 ml of M9 medium, and grown further at 25 °C to a cell density of ~0.6 (OD600). Fosfomycin (to 100 μg/ml) was added to suppress endogenous production of UDP-NAM, and incubation was continued for 30 min. At this point, IPTG (to 1 mM) was added to induce production of the plasmid-encoded AmgK and MurU enzymes and, when indicated, MTSES (to 1 mM) was added to inactivate the relevant single-cysteine variant of MurJ, PBP1B and/or FtsW. After incubation for another 30 min, cells were pelleted at 4110 rpm for 10 min at 25 °C and resuspended in 200 μL of the supernatant. Alkyl-NAM (to 2 mg/ml) was then added and, after incubation for another 30 min, cells were fixed and permeabilized using 70% ethanol as previously described3. After fixation, cells were washed three times in PBS and fluorescently labeled using the Click-iT™ Plus Alexa Fluor™ 647 Pixolyl Azide Toolkit (Invitrogen, No. C10643).
Cells were imaged on an Olympus IX-71 inverted microscope equipped with a 1.4 NA 100X phase objective, 1.6X magnification enabled, and an Andor iXon-DU897 camera using Metamorph 7.8.13.0 software. Every field of view was imaged with five Z-stacks from the bottom of the cell in 200 nm increments. The fluorophores were excited by 2 mW 647 nm excitation laser and detected with ET700/75 emission filter (Chroma) using a 100ms exposure time.
The Z-stack images were first summed up for all Z planes. The background of the image was then subtracted out using the outside region. The cell outline and a ~250 nm (3 pixels) wide mid-cell band were segmented out using the phase images, where the average fluorescence intensity in the septum (Ir) and the whole cell (Ic) were calculated. The cells with observable septal labeling were manually picked and counted as cells with sPG synthesis (Nsep) (Fig. 1b). The total sPG synthesis in those cells was quantified as: Isep = (Ir – Ic) × Ar, where the Ar is the area of the septa. The overall loss of the sPG synthesis is calculated as:
Where the Pr is the percentage of cells with septal labeling (Nsep/Ncell), and MTSES indicates the presence of MTSES treatment. The image processing in this section was done in ImageJ (version 1.52p)45.
Cell growth and constriction rate measurement
The cell growth rate in different growth media was measured by monitoring the OD600 of shaking cultures every 30 min (EZRDM), 1 hour (M9-glucose and M9-acetate), and fitting the exponential part of the growth curve.
The constriction rate was measured using time-lapse images of mNeonGreen-ZapA as a fluorescent marker of the septum. PM6/pXY677 cells were grown in different growth media (M9-glucose, M9-acetate, EZRDM) to log phase and placed on corresponding agarose gel-pads. The cells were imaged every 1 minute (M9-glucose or EZRDM) or 3 minutes (M9-acetate) for 30 frames on an Olympus IX-71 inverted microscope equipped with a 1.49 NA 100X objective and an Andor DU897 camera in epifluorescence-illumination mode using a 488-nm laser (Coherent Obis). The laser power was around 0.1W/cm2, without noticeable photo-toxicity on cell growth rate.
The fluorescent images were first aligned to correct mechanical drift using an ImageJ plugin StackReg46. The images were then smoothed by a simple moving average method (n = 3 frames) to make kymographs (Extended Data Fig. 6b) of the septum using ImageJ Kymograph plugin (written by J. Rietdorf and A. Seistz). The constriction rate was estimated from the sum of the slope of the edges on both sides in the kymograph.
Single molecule tracking of FtsW-RFP and data analysis
FtsW-RFP tracking was performed on the similar optical set up as previously described (an Olympus IX-81 inverted microscope equipped with a 1.45 NA 100X objective and an Andor DU888 camera in epifluorescence-illumination mode using a 561-nm laser (Coherent Sapphire)3 using Metamorph 7.8.13.0 software. The focal plane was placed at ~200nm from the bottom of the cell to image the molecules moving on the bottom half of the cylindrical portion of the cell body. Single FtsW-RFP molecules were tracked continuously with 500ms exposure time for 200 s using a laser intensity of 2 W/cm2. This slow frame rate helped filter out molecules randomly diffusing along the cylindrical part of the cell body. In our recent work, we found FtsI displays a diffusion coefficient similar to typical membrane proteins (~0.04 μm2/s) by SMT using a faster frame rate (30 ms exposure)19.
Before imaging, cells were grown to log phase (OD600 = 0.1 – 0.3) at 25°C without IPTG induction in M9-glucose or M9-acetate medium. In EZRDM, cells in saturated culture were reinoculated 1:100 to fresh medium with 10 μM IPTG (and 0.2% L-arabinose for UppS induction if needed) and allowed to grow at 25°C for 3 hours to reach log phase. Cells were then loaded onto a 50 μL, 3% agarose gel pad (containing the same growth medium without antibiotics). For drug-treated conditions, 0.5 μL appropriate drug solution was added on top of the gel pad right before applying cells. The moment of the latter was counted as time zero and all images were collected within three hours of drug treatment (within 1.5 hours for Aztreonam treatment). The final concentrations used were: 1 μg/ml Aztreonam, 200 μg/ml Fosfomycin, and 0.1 mM MTSES. For the fixed-cell control, log phase cells were fixed as described previously38 and placed on a gel pad containing phosphate buffered saline. To ensure the observed motion was not artifacts caused by mechanical drift of the stage, we fixed the cells grown in M9-glucose (OD = 0.1 – 0.3) with 4% PFA for 20min at room temperature and washed three times in 1X PBS. The SMT was performed at the same condition as the living cells described above.
Single FtsW molecules were first localized using 2D gaussian fitting in an ImageJ(1.52p)45 plug-in, ThunderSTORM (dev-2016–09-10-b1)47. A bandpass filter (70 – 400nm) for sigma was applied to remove the single pixel noise and out-of-focus molecules. To focus on the FtsW involved in cell division process especially sPG synthesis, we only picked up the molecules located at mid-cell or the places with observable invagination. Those localizations were then linked to trajectories using a home-built Matlab (2020a) script (https://github.com/XiaoLabJHU/SMT_Unwrapping) adopted the nearest neighbor algorithm from 48. The distance threshold was set to 300 nm/frame, which approximates a maximum D ~ 0.05 μm2/s or a maximum speed of 600 nm/s. To link blinking localizations from the same molecules, a time threshold of 5 frames was chosen according to the off-time distribution. Only trajectories near the midpoint of the cell’s long axis or near visible constriction sites (from the bright field image as our previous work24) where cell division takes place were used in the analysis to ensure the molecules are cell division and sPG related.
One bias that arises when tracking molecules on the rod-shape cell envelope is that the real displacement around the circumference is underestimated (Supplementary Fig. 3). If the cell diameter or radius is known, the real position of a molecule on the cell envelope can be back-calculated. Therefore, we grew strain BW25113/pJL005 in M9-glucose, and for each of 52 cells estimated its diameter using its bright field image. We first line-scanned the bright field image intensity across the cell division site and determined a bright field cell diameter between the cross points generated from the average background and the edge of the central part in the cell (Supplementary Fig. 3a). We then applied 3D super-resolution imaging on the Z-ring from each of the same cells, as previously described49. The Z-ring image was then fit to a circle to estimate the Z-ring diameter. On average, the bright field diameter was found to be 57 nm greater than the Z ring diameter. Considering a ~17nm distance from the inner-membrane to the Z ring38, we can estimate that the ‘real’ cell diameter is 23 nm smaller than the bright field measurement. The ‘real’ position of a molecule on the cell circumference is then calculated as shown in Supplementary Fig. 3d. Note that the position along the long axis of the cell does NOT change due to the cylindrical geometry of the cell.
Unwrapped, corrected trajectories as described above were then segmented to determine whether a FtsW-RFP molecule in a segment is stationary or moving directly. To classify directional movement and minimize bias, we first fit the segment with a line. Then we defined a metrics R, which is the ratio of the displacement and the standard deviation of fitting residuals (S) (Supplementary Fig. 3e). Segments from directionally moving molecules would produce smaller R values than the stationary ones considering similar diffusion coefficients and localization error from imaging. Therefore, we constructed the probability density function of R by simulating trajectories at a specific directional speed with the typical diffusion coefficient, confinement, and localization error obtained from our experiment. For individual segments, we can infer the probability of the molecule undergoing directional movement (Pm, see the Segment Classification Section in Supplementary Information for simulation and derivation details). In the paper, we classify a segment as directional with an empirical threshold of Pm and R. All the other segments are stationary if the S is smaller than 50 nm (confined in a ~100nm range). Since the confidence of classification is correlated with the segmentation length, we only consider segments longer than 5 frames to minimize classification error. We note that the velocity estimated from MSD curve fitting is not accurate when the dwell time of the segment is short (< 20 frames) or when there is more than one moving state in a single trajectory (Fig. 2b, Extended Data Fig. 2).
The cumulative probability density functions (CDF) of the direction moving speeds were calculated for each condition and fit by either single (for FtsZ treadmilling) or double lognormal populations for FtsW (or FtsI) tracking:
Where the v is the FtsW (or FtsI) moving speed and P1 is the percentage of the first population. For a single population model, P1 = 1. Two parameters μ and σ are the natural logarithmic mean and standard deviation.
The average speed of each population is calculated as: . To estimate the error of the speed and percentage (Supplementary Table 3–6), the CDF curves were bootstrapped 1000 times and fit with the corresponding equation (single- or double-population).
One-dimensional MSD curves of the stationary FtsW-RFP population was calculated as previously described50 and fit by Kusumi equation51 to obtain the diffusion coefficients and confinement length. All the bootstrapping and nonlinear regression were performed in Matlab 2020a and the code can be found (https://github.com/XiaoLabJHU/SMT_Unwrapping).
Extended Data
Extended Data Fig. 1. Single Cys residue substitutions in FtsW alter its function and cell morphology.
a. Homology structure of FtsW based on the structure of RodA (PDB: 6BAR)9 using Phyre 2.044. Mutated residues are labeled and color-coded according to their sensitivity to MSTES. Green: MTSES does not affect cell growth or morphology (S131C, L276C, and L307C). Orange: MTSES significantly slows down cell division and leads to elongated cells (S136C, L198C, L288C, and A294C). Red: MTSES blocks cell division completely and leads to long, chaining cells (A301C, I302C, I303C, and L367C). Magenta: Cysteine mutation causes other cell division defects such as abnormal septa and cell poles even in the absence of MTSES (L268C). b. Time-lapse images of JXY559 (ftswI302C) cells in M9 medium without (top panel) and with (bottom panel) MTSES. MTSES was added to the cell in the bottom panel 30 min prior to the first image (Supplementary Movie 1 and 2). Arrowhead marks a cell constriction that initiated early on but failed to complete. Scale bars:2 μm. c. Integrated intensity of septal NAM labeling of different strains in the absence or presence of MTSES. Error bars represent S.E.M of three independent experiments with the same imaging condition.
Extended Data Fig. 2. Representative septal FtsW-RFP trajectories are segmented and fit with line to extract directional moving speeds.
Raw trajectories of single FtsW-RFP molecules along the septal circumference are demonstrated as orange lines. Gary, light-yellow, and light-blue shades indicate segments of stationary, low-moving, and fast-moving states respectively. Corresponding speeds, obtained by linear fitting, are shown as solid line and labeled in each sub-figure. Supplementary Movies 6 to 9 correspond to trajectories a to d.
Extended Data Fig. 3. FtsW-RFP molecules in stationary state display confined diffusion.
a. Example of an FtsW-RFP molecule (arrowhead) remaining within a small region of the septum. As indicated by the kymograph, this molecule showed little observable directional movement for at least 80 seconds. b. Unwrapped and decomposed 1d-trajectory of the FtsW-RFP molecule along the long (gray) and short (orange) axis. c. 1d-MSD curves (short axis) of 204 ‘stationary’ molecules in live BW25113 WT cells growing in M9-glucose medium without (blue) or with 1μg/mL Aztreonam (dark green), and in cells grown without Aztreonam upon para-formaldehyde fixation (gray). The BW25113 curve (blue) is fit by Kusumi equation51 with D = 0.0007 ± 0.0002 μm2/s, L = 95 ± 6 nm. Note that Aztreonam treatment causes confinement of ‘stationary’ FtsW-RFP molecules to smaller areas, similar to what is observed in fixed cells. d. Percentage of FtsW-RFP molecules in stationary state in the presence (blue bars) and absence (orange bars) of drug to inhibit sPG synthesis (MTSES for FtsWI302C and PBP1BS247C, Aztreonam for FtsI, and Fosfomycin for precursor synthesis). e. Mean dwell time of FtsW-RFP molecules staying in stationary state in the presence (blue dots) and absence (orange dots) of drug to inhibit sPG synthesis. c and d. Data are presented as mean ± SEM where the SEM is estimated by bootstrapping (For details regarding statistics and box plot definitions see the “Statistics” subheading in “Methods”). e. Data are presented as mean ± SEM. For the sample size of each point see Supplementary Table 6.
Extended Data Fig. 4. Speed distributions of processive moving RFP-FtsI molecules and FtsZ treadmilling under different conditions.
Speed distribution (bars) of all RFP-FtsI molecules in ftsZ wt (a), GTPase mutant (ftsZE250A) (b), and ftsB SF mutant (ftsBE56A) (c) strains. The CDF fit curves of fast- (blue solid) and slow- (red solid) moving population are overlaid with the bar graph. The black dash curves indicate the overall fitting. FtsZ treadmilling speed distribution in different FtsZ GTPase mutant strains (d) (Data from3), in super-fission mutant strains and different growth media (e), and under different drug treatment conditions (f). The average speeds under all conditions are given in Supplementary Tables 4 and 6.
Extended Data Fig. 5. Superfission (SF) mutations in ftsW or ftsI allow for growth and division in cells with diminished or no FtsN function.
a. Differential interference contrast (DIC) cell images of strains TB28 (wt), CH34/pBL145 (ΔftsN / cIts PλR::ftsN1−90), PM17 (ftsWE289G), PM18 (ftsWE289G ΔftsN), and PM6 (ftsIR167S). Cells were grown overnight in LB medium at 370C (CH34/pBL145) or 30°C (all other sttrains), diluted to OD600 = 0.02 in LB, and grown to OD600 = 0.6–0.7 at 30°C (causing depletion of FtsN in the CH34/pBL145 cells shown). Scale bars: 4 μm. b. DIC cell images of strains TB77 (ftsNslm117), and PM4 (ftsNslm117 ftsIR167S). Overnight cultures were diluted to OD600 = 0.05 in M9-glucose medium and grown to OD600 = 0.5–0.6 at 30°C. Note that the ftsNslm117 allele corresponds to an EZTnKan-2 transposon insertion in codon 119 of ftsN, leading to a pronounced, but non-lethal, cell constriction defect. Also note that the ftsIR167S allele in strain PM4 largely overcomes this defect. Scale bars: 8 μm. Representative micrographs were from three independent experiments. For the number of cells and characterization of cell morphology, see Supplementary Table 7.
Extended Data Fig. 6. The constriction rate of FtsI SF strain (TB28, ftsIR167S) is correlated with the cell growth rate.
a. Growth curves of PM6 in M9-acetate (magenta), M9-glucose (orange), and EZRDM (olive). Data are presented as mean ± s.d. from three independent experiments. b. Representative kymographs of the septum closure progress in PM6 cells growing in the indicated media, as probed by mNeonGreen-ZapA fluorescence. Representative micrographs were from two independent experiments. Scale bars: 200nm. c. Relationship between the cell growth rate (Vg, estimated from a) and the constriction rate (Vc, estimated from kymographs as in b). The boxes indicate the ± SEM, whiskers the 10–90 percentiles, the midline indicates median, the square indicates mean. b and c. For the sample size of condition see Supplementary Table 8.
Supplementary Material
Phase contrast time-lapse movie of JXY559 (BW25113 ftsWI302C) cells growing on 3% agarose gel-pad with M9-glucose minimum medium in the presence of MTSES at room temperature. The movie was recorded every ~3.5 minutes Scale bar: 5 μm.
Phase contrast time-lapse movie of JXY559 (BW25113 ftsWI302C) cells growing on 3% agarose gel-pad with M9-glucose minimum medium at room temperature. The gel-pad was supplemented with 0.1mM MTSES. The movie was recorded every ~3.5 minutes Scale bar: 5 μm.
Epi-fluorescence time-lapse imaging of single FtsW-RFP molecules in M9-glucose, corresponding to Extended Data Fig. 3a. Scale bar: 0.5 μm.
Epi-fluorescence time-lapse imaging of single FtsW-RFP molecules in M9-glucose, corresponding to Fig. 2b. Scale bar: 0.5 μm.
Epi-fluorescence time-lapse imaging of single FtsW-RFP molecules in M9-glucose, corresponding to Fig. 2a. Scale bar: 0.5 μm.
Epi-fluorescence time-lapse imaging of single FtsW-RFP molecules in M9-glucose, corresponding to Extended Data Fig. 2b. Scale bar: 0.5 μm.
Epi-fluorescence time-lapse imaging of single FtsW-RFP molecules in M9-glucose, corresponding to Extended Data Fig. 2a. Scale bar: 0.5 μm.
Epi-fluorescence time-lapse imaging of single FtsW-RFP molecules in M9-glucose, corresponding to Extended Data Fig. 2c. Scale bar: 0.5 μm.
Epi-fluorescence time-lapse imaging of single FtsW-RFP molecules in M9-glucose, corresponding to Extended Data Fig. 2d. Scale bar: 0.5 μm.
Acknowledgements
The authors thank other lab members in the Xiao and de Boer labs for helpful discussions and technical assistance, Dr. G. Hauk for sharing plasmids and the CRISPR-Cas9/λ-red recombineering cloning method, Dr. D. S. Weiss for strain EC1908, plasmid pDSW406, anti-FtsN serum, and helpful suggestions on FtsW immunoblotting, Dr. T. Bernhardt for strain HC532 and plasmid pHC808, Dr. C. Hale for plasmid pCH650, Dr. E. Goley for help on cell growth measurement, and Dr. R. Tsien for the TagRFP-T construct. This work was supported by NIH U01CA221230 (to C.L.G), Pew Biomedical Scholar (Pew Foundation to C.L.G), NIH T32GM133395A(to K.E.D), NIH GM57059 (to P.d.B), NIH R01GM086447 and R35GM136436 (to J.X.), GM125656 (subcontract to J. X.), NSF EAGER Award MCB-1019000 (to J.X.), and a Hamilton Smith Innovative Research Award (to J.X.)
Footnotes
Competing interests
The authors declare no competing interests.
Code availability
The in-house developed image analysis scripts are available in the GitHub repository: https://github.com/XiaoLabJHU/SMT_Unwrapping
Data availability
Numerical source data that underlie the graphs shown in Figs. 1b–c, 2, 3, 4, and 5b–c, Extended Data Figs. 1c, 2, 3b–e, 4, and 6a, 6c, and Supplementary Figs. 1a, 1b, 1d, 1f, 2, 3c, 3e, 4, 5, and 6c are provided with the paper. The data, plasmids, and E. coli strains that support the findings of this study are available from the corresponding authors on reasonable request.
Reference:
- 1.Du S & Lutkenhaus J Assembly and activation of the Escherichia coli divisome. Mol Microbiol 105, 177–187 (2017). [DOI] [PMC free article] [PubMed] [Google Scholar]
- 2.McQuillen R & Xiao J Insights into the Structure, Function, and Dynamics of the Bacterial Cytokinetic FtsZ-Ring. Annual Review of Biophysics 49, 309–341 (2020). [DOI] [PMC free article] [PubMed] [Google Scholar]
- 3.Yang X et al. GTPase activity-coupled treadmilling of the bacterial tubulin FtsZ organizes septal cell wall synthesis. Science 355, 744–747 (2017). [DOI] [PMC free article] [PubMed] [Google Scholar]
- 4.Bisson-Filho AW et al. Treadmilling by FtsZ filaments drives peptidoglycan synthesis and bacterial cell division. Science 355, 739–743 (2017). [DOI] [PMC free article] [PubMed] [Google Scholar]
- 5.Taguchi A et al. FtsW is a peptidoglycan polymerase that is functional only in complex with its cognate penicillin-binding protein. Nat Microbiol 4, 587–594 (2019). [DOI] [PMC free article] [PubMed] [Google Scholar]
- 6.Cho H et al. Bacterial cell wall biogenesis is mediated by SEDS and PBP polymerase families functioning semi-autonomously. Nat Microbiol 1, 16172 (2016). [DOI] [PMC free article] [PubMed] [Google Scholar]
- 7.Butler EK, Davis RM, Bari V, Nicholson PA & Ruiz N Structure-function analysis of MurJ reveals a solvent-exposed cavity containing residues essential for peptidoglycan biogenesis in Escherichia coli. J Bacteriol 195, 4639–4649 (2013). [DOI] [PMC free article] [PubMed] [Google Scholar]
- 8.Meeske AJ et al. SEDS proteins are a widespread family of bacterial cell wall polymerases. Nature 537, 634–638 (2016). [DOI] [PMC free article] [PubMed] [Google Scholar]
- 9.Sjodt M et al. Structure of the peptidoglycan polymerase RodA resolved by evolutionary coupling analysis. Nature 556, 118–121 (2018). [DOI] [PMC free article] [PubMed] [Google Scholar]
- 10.Karlin A & Akabas MH Substituted-cysteine accessibility method. Meth Enzymol 293, 123–145 (1998). [DOI] [PubMed] [Google Scholar]
- 11.Liang H et al. Metabolic labelling of the carbohydrate core in bacterial peptidoglycan and its applications. Nat Commun 8, 15015 (2017). [DOI] [PMC free article] [PubMed] [Google Scholar]
- 12.Kolb HC, Finn MG & Sharpless KB Click Chemistry: Diverse Chemical Function from a Few Good Reactions. Angew Chem Int Ed Engl 40, 2004–2021 (2001). [DOI] [PubMed] [Google Scholar]
- 13.Sham L-T et al. Bacterial cell wall. MurJ is the flippase of lipid-linked precursors for peptidoglycan biogenesis. Science 345, 220–222 (2014). [DOI] [PMC free article] [PubMed] [Google Scholar]
- 14.Egan AJF & Vollmer W The physiology of bacterial cell division. Ann N Y Acad Sci 1277, 8–28 (2012). [DOI] [PubMed] [Google Scholar]
- 15.Leclercq S et al. Interplay between Penicillin-binding proteins and SEDS proteins promotes bacterial cell wall synthesis. Sci Rep 7, 43306 (2017). [DOI] [PMC free article] [PubMed] [Google Scholar]
- 16.Fraipont C et al. The integral membrane FtsW protein and peptidoglycan synthase PBP3 form a subcomplex in Escherichia coli. Microbiology (Reading, Engl) 157, 251–259 (2010). [DOI] [PubMed] [Google Scholar]
- 17.Ovchinnikov S et al. Large-scale determination of previously unsolved protein structures using evolutionary information. Elife 4, e09248 (2015). [DOI] [PMC free article] [PubMed] [Google Scholar]
- 18.Karimova G, Dautin N & Ladant D Interaction network among Escherichia coli membrane proteins involved in cell division as revealed by bacterial two-hybrid analysis. J Bacteriol 187, 2233–2243 (2005). [DOI] [PMC free article] [PubMed] [Google Scholar]
- 19.McCausland JW, Yang X, Lyu Z & Söderström BW Treadmilling FtsZ polymers drive the directional movement of sPG-synthesis enzymes via a Brownian ratchet mechanism. biorxivorg (2019). [DOI] [PMC free article] [PubMed] [Google Scholar]
- 20.Perez AJ et al. Movement dynamics of divisome proteins and PBP2x:FtsW in cells of Streptococcus pneumoniae. Proc Natl Acad Sci USA 116, 3211–3220 (2019). [DOI] [PMC free article] [PubMed] [Google Scholar]
- 21.Söderström B, Chan H, Shilling PJ, Skoglund U & Daley DO Spatial separation of FtsZ and FtsN during cell division. Mol Microbiol 107, 387–401 (2017). [DOI] [PubMed] [Google Scholar]
- 22.Li Z, Trimble MJ, Brun YV & Jensen GJ The structure of FtsZ filaments in vivo suggests a force-generating role in cell division. EMBO J 26, 4694–4708 (2007). [DOI] [PMC free article] [PubMed] [Google Scholar]
- 23.Squyres GR, Holmes MJ, Barger SR & Pennycook BR biorxivorg (2020). [Google Scholar]
- 24.Coltharp C, Buss J, Plumer TM & Xiao J Defining the rate-limiting processes of bacterial cytokinesis. Proc Natl Acad Sci USA 113, E1044–53 (2016). [DOI] [PMC free article] [PubMed] [Google Scholar]
- 25.Park KT, Du S & Lutkenhaus J Essential role for FtsL in activation of septal PG synthesis. biorxivorg (2020). [DOI] [PMC free article] [PubMed] [Google Scholar]
- 26.Kocaoglu O & Carlson EE Profiling of β-lactam selectivity for penicillin-binding proteins in Escherichia coli strain DC2. Antimicrob Agents Chemother 59, 2785–2790 (2015). [DOI] [PMC free article] [PubMed] [Google Scholar]
- 27.Özbaykal G, Wollrab E, Simon F & Vigouroux A The transpeptidase PBP2 governs initial localization and activity of the major cell-wall synthesis machinery in E. coli. elifesciencesorg (2020). [DOI] [PMC free article] [PubMed] [Google Scholar]
- 28.Lee TK et al. A dynamically assembled cell wall synthesis machinery buffers cell growth. Proc Natl Acad Sci USA 111, 4554–4559 (2014). [DOI] [PMC free article] [PubMed] [Google Scholar]
- 29.Rojas E, Theriot JA & Huang KC Response of Escherichia coli growth rate to osmotic shock. Proc Natl Acad Sci USA 111, 7807–7812 (2014). [DOI] [PMC free article] [PubMed] [Google Scholar]
- 30.Silver LL Fosfomycin: Mechanism and Resistance. Cold Spring Harb Perspect Med 7, a025262 (2017). [DOI] [PMC free article] [PubMed] [Google Scholar]
- 31.Cho H, Uehara T & Bernhardt TG Beta-lactam antibiotics induce a lethal malfunctioning of the bacterial cell wall synthesis machinery. Cell 159, 1300–1311 (2014). [DOI] [PMC free article] [PubMed] [Google Scholar]
- 32.Liu B, Persons L, Lee L & de Boer PAJ Roles for both FtsA and the FtsBLQ subcomplex in FtsN-stimulated cell constriction in Escherichia coli. Mol Microbiol 95, 945–970 (2015). [DOI] [PMC free article] [PubMed] [Google Scholar]
- 33.Tsang M-J & Bernhardt TG A role for the FtsQLB complex in cytokinetic ring activation revealed by an ftsL allele that accelerates division. Mol Microbiol 95, 925–944 (2015). [DOI] [PMC free article] [PubMed] [Google Scholar]
- 34.Tarry M et al. The Escherichia coli cell division protein and model Tat substrate SufI (FtsP) localizes to the septal ring and has a multicopper oxidase-like structure. J Mol Biol 386, 504–519 (2008). [DOI] [PMC free article] [PubMed] [Google Scholar]
- 35.Vollmer W & Seligman SJ Architecture of peptidoglycan: more data and more models. Trends Microbiol 18, 59–66 (2010). [DOI] [PubMed] [Google Scholar]
- 36.Burman LG & Park JT Molecular model for elongation of the murein sacculus of Escherichia coli. Proc Natl Acad Sci USA 81, 1844–1848 (1984). [DOI] [PMC free article] [PubMed] [Google Scholar]
- 37.Neidhardt FC, Bloch PL & Smith DF Culture medium for enterobacteria. J Bacteriol 119, 736–747 (1974). [DOI] [PMC free article] [PubMed] [Google Scholar]
- 38.Buss J et al. A multi-layered protein network stabilizes the Escherichia coli FtsZ-ring and modulates constriction dynamics. PLoS Genet 11, e1005128 (2015). [DOI] [PMC free article] [PubMed] [Google Scholar]
- 39.Glascock CB & Weickert MJ Using chromosomal lacIQ1 to control expression of genes on high-copy-number plasmids in Escherichia coli. Gene 223, 221–231 (1998). [DOI] [PubMed] [Google Scholar]
- 40.Moore DA, Whatley ZN, Joshi CP, Osawa M & Erickson HP Probing for Binding Regions of the FtsZ Protein Surface through Site-Directed Insertions: Discovery of Fully Functional FtsZ-Fluorescent Proteins. J Bacteriol 199, 18 (2016). [DOI] [PMC free article] [PubMed] [Google Scholar]
- 41.Baba T et al. Construction of Escherichia coli K-12 in-frame, single-gene knockout mutants: the Keio collection. Mol Syst Biol 2, 2006.0008 (2006). [DOI] [PMC free article] [PubMed] [Google Scholar]
- 42.Labun K, Montague TG, Gagnon JA, Thyme SB & Valen E CHOPCHOP v2: a web tool for the next generation of CRISPR genome engineering. Nucleic Acids Res 44, W272–6 (2016). [DOI] [PMC free article] [PubMed] [Google Scholar]
- 43.Hamilton CM, Aldea M, Washburn BK, Babitzke P & Kushner SR New method for generating deletions and gene replacements in Escherichia coli. J Bacteriol 171, 4617–4622 (1989). [DOI] [PMC free article] [PubMed] [Google Scholar]
- 44.Kelley LA, Mezulis S, Yates CM, Wass MN & Sternberg MJE The Phyre2 web portal for protein modeling, prediction and analysis. Nat Protoc 10, 845–858 (2015). [DOI] [PMC free article] [PubMed] [Google Scholar]
- 45.Schneider CA, Rasband WS & Eliceiri KW NIH Image to ImageJ: 25 years of image analysis. Nat Methods 9, 671–675 (2012). [DOI] [PMC free article] [PubMed] [Google Scholar]
- 46.Thévenaz P, Ruttimann UE & Unser M A pyramid approach to subpixel registration based on intensity. IEEE Trans Image Process 7, 27–41 (2008). [DOI] [PubMed] [Google Scholar]
- 47.Ovesný M, Křížek P, Borkovec J, Svindrych Z & Hagen GM ThunderSTORM: a comprehensive ImageJ plug-in for PALM and STORM data analysis and super-resolution imaging. Bioinformatics 30, 2389–2390 (2014). [DOI] [PMC free article] [PubMed] [Google Scholar]
- 48.Sbalzarini IF & Koumoutsakos P Feature point tracking and trajectory analysis for video imaging in cell biology. J Struct Biol 151, 182–195 (2005). [DOI] [PubMed] [Google Scholar]
- 49.Lyu Z, Coltharp C, Yang X & Xiao J Influence of FtsZ GTPase activity and concentration on nanoscale Z-ring structure in vivo revealed by three-dimensional Superresolution imaging. Biopolymers 105, 725–734 (2016). [DOI] [PMC free article] [PubMed] [Google Scholar]
- 50.Buss J et al. In vivo organization of the FtsZ-ring by ZapA and ZapB revealed by quantitative super-resolution microscopy. Mol Microbiol 89, 1099–1120 (2013). [DOI] [PMC free article] [PubMed] [Google Scholar]
- 51.Kusumi A, Sako Y & Yamamoto M Confined lateral diffusion of membrane receptors as studied by single particle tracking (nanovid microscopy). Effects of calcium-induced differentiation in cultured epithelial cells. Meth Enzymol 65, 2021–2040 (1993). [DOI] [PMC free article] [PubMed] [Google Scholar]
Associated Data
This section collects any data citations, data availability statements, or supplementary materials included in this article.
Supplementary Materials
Phase contrast time-lapse movie of JXY559 (BW25113 ftsWI302C) cells growing on 3% agarose gel-pad with M9-glucose minimum medium in the presence of MTSES at room temperature. The movie was recorded every ~3.5 minutes Scale bar: 5 μm.
Phase contrast time-lapse movie of JXY559 (BW25113 ftsWI302C) cells growing on 3% agarose gel-pad with M9-glucose minimum medium at room temperature. The gel-pad was supplemented with 0.1mM MTSES. The movie was recorded every ~3.5 minutes Scale bar: 5 μm.
Epi-fluorescence time-lapse imaging of single FtsW-RFP molecules in M9-glucose, corresponding to Extended Data Fig. 3a. Scale bar: 0.5 μm.
Epi-fluorescence time-lapse imaging of single FtsW-RFP molecules in M9-glucose, corresponding to Fig. 2b. Scale bar: 0.5 μm.
Epi-fluorescence time-lapse imaging of single FtsW-RFP molecules in M9-glucose, corresponding to Fig. 2a. Scale bar: 0.5 μm.
Epi-fluorescence time-lapse imaging of single FtsW-RFP molecules in M9-glucose, corresponding to Extended Data Fig. 2b. Scale bar: 0.5 μm.
Epi-fluorescence time-lapse imaging of single FtsW-RFP molecules in M9-glucose, corresponding to Extended Data Fig. 2a. Scale bar: 0.5 μm.
Epi-fluorescence time-lapse imaging of single FtsW-RFP molecules in M9-glucose, corresponding to Extended Data Fig. 2c. Scale bar: 0.5 μm.
Epi-fluorescence time-lapse imaging of single FtsW-RFP molecules in M9-glucose, corresponding to Extended Data Fig. 2d. Scale bar: 0.5 μm.
Data Availability Statement
Numerical source data that underlie the graphs shown in Figs. 1b–c, 2, 3, 4, and 5b–c, Extended Data Figs. 1c, 2, 3b–e, 4, and 6a, 6c, and Supplementary Figs. 1a, 1b, 1d, 1f, 2, 3c, 3e, 4, 5, and 6c are provided with the paper. The data, plasmids, and E. coli strains that support the findings of this study are available from the corresponding authors on reasonable request.


