Summary
Inflammasomes are important sentinels of innate immune defense activated in response to diverse stimuli, including pathogen-associated molecular patterns (PAMPs)1. Activation of the inflammasome provides host defense against aspergillosis2,3, a major health concern for immunocompromised patients; however, the Aspergillus fumigatus PAMPs responsible for inflammasome activation are not known. Here we discovered that A. fumigatus galactosaminogalactan (GAG) is a novel PAMP that activates the NLRP3 inflammasome. Binding of GAG to ribosomal proteins inhibited cellular translation machinery, thereby activating the NLRP3 inflammasome. The galactosamine moiety bound to ribosomal proteins and blocked cellular translation, triggering NLRP3 inflammasome activation. In mice, a GAG-deficient Aspergillus mutant Δgt4c failed to elicit protective inflammasome activation and exhibited enhanced virulence. Moreover, administration of GAG protected mice from DSS-induced colitis in an inflammasome-dependent manner. Thus, ribosomes connect sensing of this fungal PAMP to activation of an innate immune response.
Keywords: Inflammasome, NLRP3, Aspergillus fumigatus, galactosaminogalactan, GAG, fungi, innate immunity, host defense, caspase-1
Main
Specific PAMPs that activate the inflammasome in response to bacterial and viral infection are known1, but the identity of fungal PAMPs remain unclear. A. fumigatus conidia do not activate the inflammasome, whereas hyphae are competent for inflammasome activation4. We hypothesized that the component activating the inflammasome is present only in hyphal A. fumigatus. The fungal cell wall surface is composed largely of polysaccharides, and this composition changes throughout the fungal life cycle5. The polysaccharide galactosaminogalactan (GAG) is present on hyphae but totally absent on conidia, and it is considered to be a major virulence factor6,7. Polysaccharides from other microbial pathogens trigger inflammasome activation2,8,9. We therefore hypothesized that GAG might be central for A. fumigatus-induced inflammasome activation.
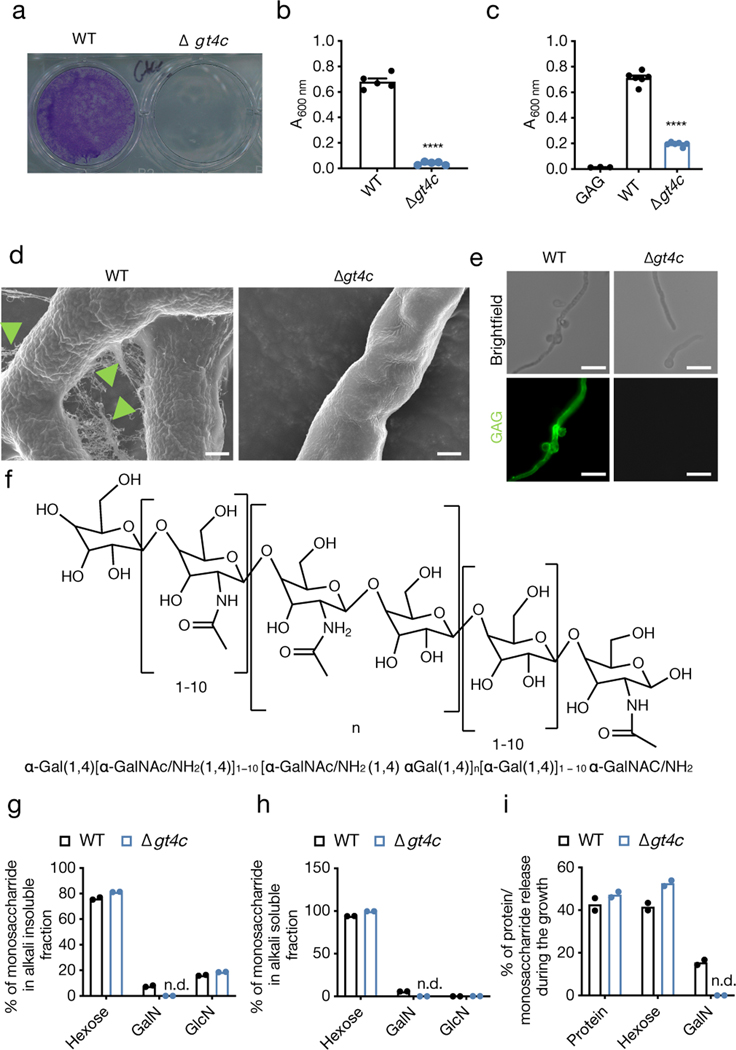
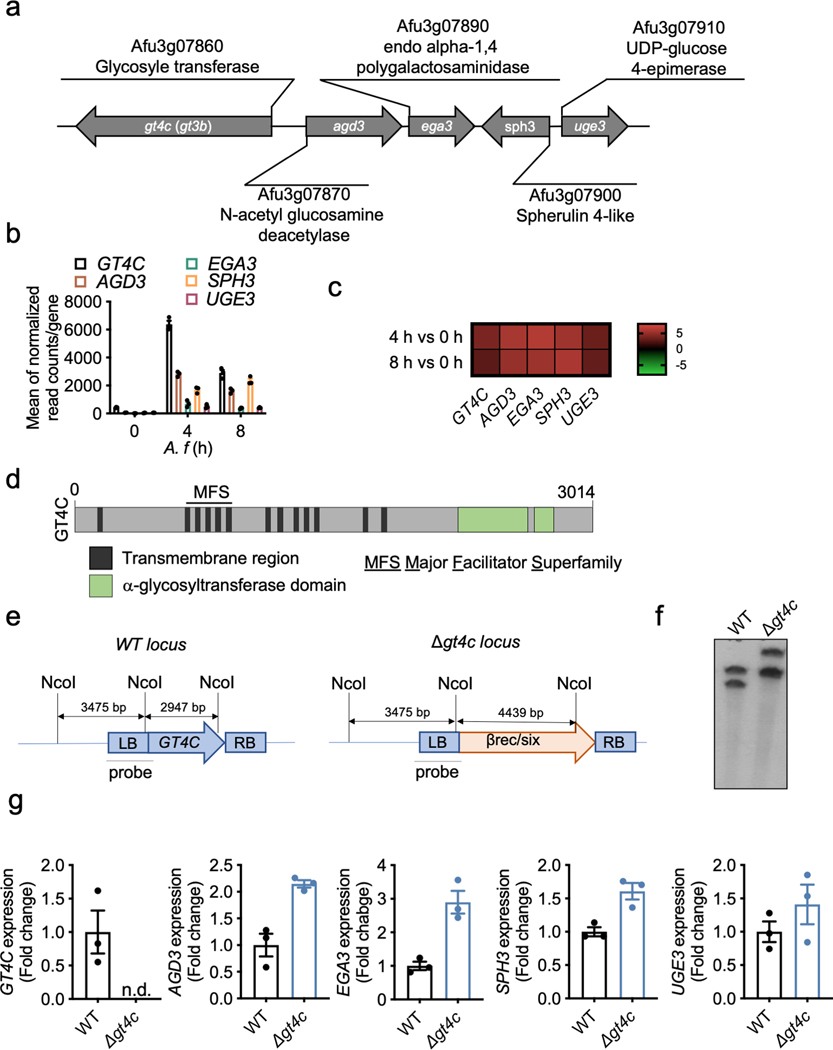
To test this, we generated a strain of A. fumigatus that does not produce GAG. Despite extensive studies on GAG synthesis in A. fumigatus, the GAG synthase has not been previously identified10. We bioinformatically characterized the GAG biosynthetic gene cluster11, and found that GT4C (AFUA_3G07860) has the potential to be the GAG synthase (Extended Data Fig. 1a). The GT4C cluster was upregulated during A. fumigatus growth (Extended Data Fig. 1b, c). GT4C possesses transmembrane regions and is part of the major facilitator superfamily (Extended Data Fig. 1d). To confirm that GT4C is involved in GAG synthesis, we generated an A. fumigatus strain lacking GT4C (Δgt4c) (Extended Data Fig. 1e, f). GAG is required for A. fumigatus adherence7. Δgt4c mycelium lost their adherence capability (Fig. 1a, b), and introduction of purified GAG from WT A. fumigatus partially restored its adhesion (Fig. 1c), suggesting that the GT4C gene is involved in adherence and the synthesis of GAG. Additionally, scanning electron microscopy (SEM) showed that WT fungus was decorated with fibrillar material in the extracellular matrix (ECM), which is characteristic of GAG being present6,7, and the fibrils adhered to both fungal cells and abiotic surfaces (Fig. 1d, green head arrow). These structures were totally absent on the Δgt4c strain (Fig. 1d)6,7, and immunostaining with an anti-GAG monoclonal antibody confirmed GAG’s absence (Fig. 1e).
Fig. 1. A. fumigatus GT4C regulates GAG synthesis.
a, Biofilm formation assay on an abiotic surface with A. fumigatus wild type (WT) and Δgt4c. Representative image. b, c, Quantification of biofilm formation on an abiotic surface (b) in absence or (c) presence of exogenous GAG in Brian medium by crystal violet absorbance at 600 nm wavelength (A600 nm). (b, n = 5 and c, n = 6 biologically independent samples; ****P < 0.0001; unpaired two-tailed t-test). Data are mean +/− SEM. Exact P values are presented in Extended Data Table 2. d, Scanning electron microscopy of A. fumigatus WT or Δgt4c hyphae surface incubated for 20 h in Brian medium (green arrowhead indicates ECM composed of GAG). e, Immunofluorescence staining of fungal GAG (green) on mycelium of A. fumigatus WT or Δgt4c. (d,e, Representative images, n ≥ 2 independent experiments). f, Representative structure of A. fumigatus GAG. g–i, Percentage of monosaccharides in (g) alkali insoluble or (h) alkali soluble cell wall fractions and (i) percentage of monosaccharides or proteins in culture supernatant from WT and Δgt4c A. fumigatus (n = 2 biologically independent samples; bar depicts mean). GalN, galactosamine; GlcN, glucosamine; n.d., not detected. Scale bars, (d) 1 μm; (e) 10 μm.
GAG is a large polysaccharide polymer composed of α1,4-linked galactose and α1,4-linked N-acetylgalactosamine or galactosamine (GalN) residues randomly distributed6 (Fig. 1f). The Δgt4c mutant cell wall completely lacked the GalN residue, while the parental strain contained GalN (Fig. 1g–i). Together, these data confirmed that GT4C is essential for GAG synthesis and that the GT4C protein is the putative GAG synthase for A. fumigatus. We also found that the other genes of the cluster required for GAG synthesis10 were not downregulated in the absence of GT4C compared with their expression in WT A. fumigatus (Extended Data Fig. 1g).
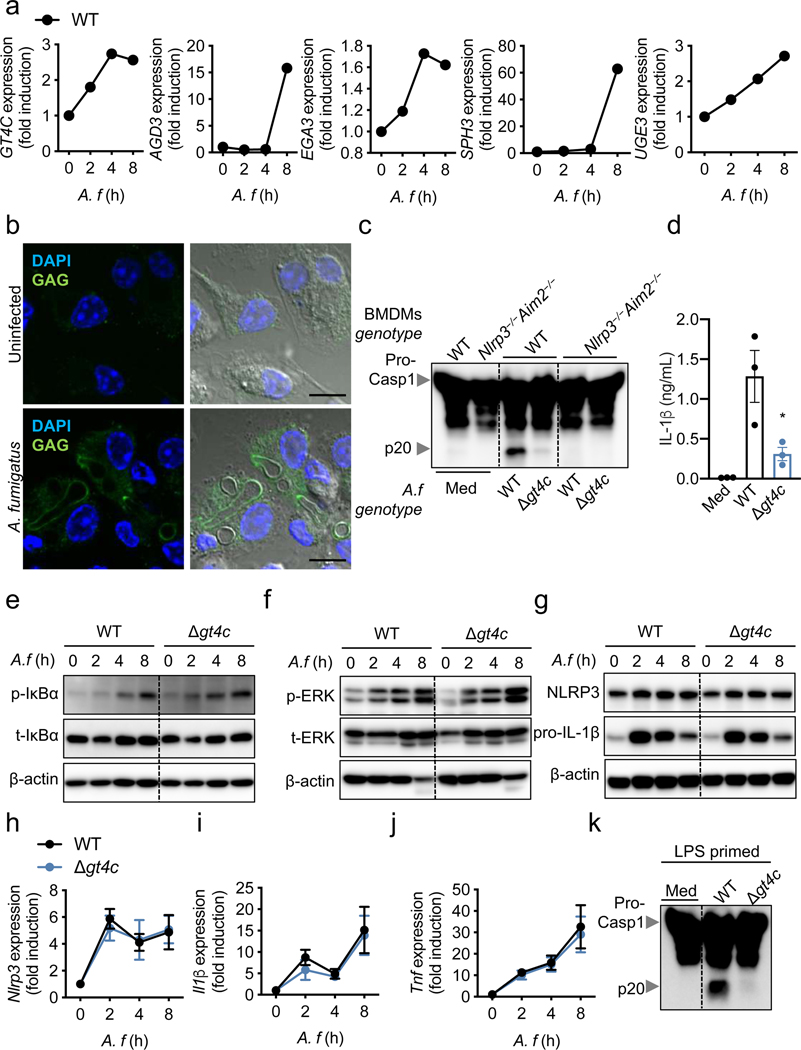
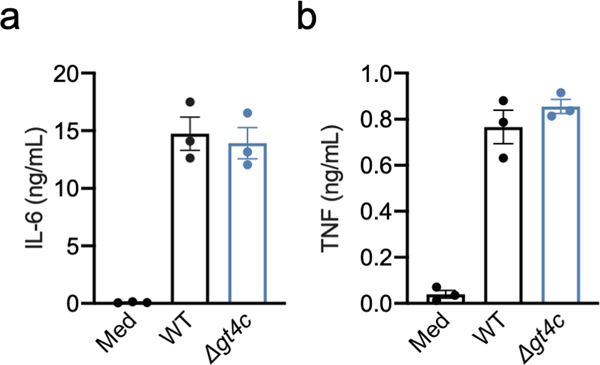
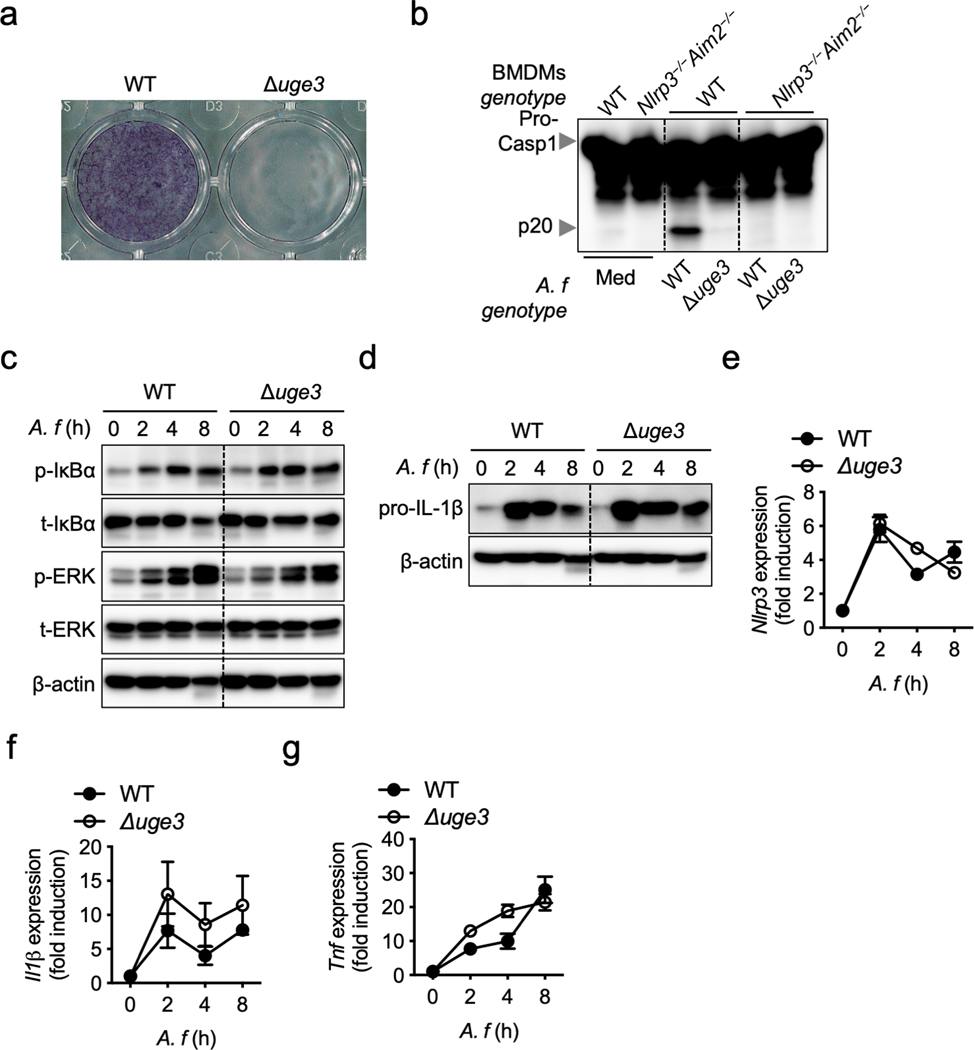
To define the role of GAG in innate immunity and inflammasome activation, we first confirmed that the GAG biosynthetic gene cluster was expressed and that GAG was synthesized by WT A. fumigatus and present in the cytosol during infection of bone marrow-derived macrophages (BMDMs) (Fig. 2a, b). Cleavage of caspase-1 and the release of IL-1β were impaired in unprimed BMDMs infected with the Δgt4c strain compared with those infected with WT A. fumigatus, whereas the secretion of inflammasome-independent cytokines was not affected (Fig. 2c, d, Extended Data Fig. 2). We further confirmed that this impaired inflammasome activation was due to the absence of GAG by using another A. fumigatus strain that cannot produce GAG due to the deletion of the UDP-glucose-4-epimerase (UGE3)7 (Extended Data Fig. 3a and b).
Fig. 2. GT4C potentiates A. fumigatus-induced inflammasome activation.
a, RT-PCR analysis of GT4C, AGD3, EGA3, SPH3 and UGE3 A. fumigatus (A.f) genes from the wild type (WT) strain in unprimed bone marrow-derived macrophages (BMDMs) 0–8 h after infection relative to quantification of A. f TEF1 (n = 2 biologically independent samples; mean plotted). b, Immunofluorescence staining of A.f GAG (green) and BMDM nuclei (blue) in unprimed BMDMs 12 h after infection. Scale bars, 10 μm. Representative images (n ≥ 3 independent experiments). c, Immunoblot analysis of pro-caspase-1 (pro-Casp1; p45) and cleaved caspase-1 (p20) of unprimed BMDMs left untreated (medium alone [Med]) or assessed 20 h after infection (multiplicity of infection [MOI], 10). Representative images (n ≥ 3 independent experiments). d, Release of IL-1β from unprimed BMDMs left uninfected (Med) or assessed 20 h after infection (MOI, 10) (n = 3 biologically independent samples). Data are mean +/− SEM. *P < 0.05 (one-way ANOVA with Dunnett’s multiple-comparisons test). Exact P values are presented in Extended Data Table 2. e, f, Immunoblot analysis of (e) phospho- and total-IκBα (p-IκBα, t-IκBα) or (f) phospho- and total-ERK1/2 (p-ERK, t-ERK) in unprimed WT BMDMs 0–8 h after infection (MOI, 10). Representative images (n ≥ 3 independent experiments). g, Immunoblot analysis of NLRP3 and pro–IL-1β in unprimed BMDMs 0–8 h after infection (MOI, 10). Representative images (n ≥ 3 independent experiments). h–j, RT-PCR analysis of Nlrp3, Il1β and Tnf in WT BMDMs 0–8 h after infection presented relative to quantification of the gene encoding β-actin (n = 4 biologically independent samples). Data are mean +/− SEM. k, Immunoblot analysis of pro– and cleaved caspase-1 of BMDMs primed with LPS and left untreated (Med) or assessed 20 h after infection (MOI, 10). Representative images (n ≥ 3 independent experiments).
We next determined the ability of the Δgt4c and Δuge3 A. fumigatus strains to activate inflammatory signaling required for priming inflammasome activation. Phosphorylation of extracellular signal-regulated kinase 1/2 (ERK1/2) and IκBα was not reduced during infection with Δgt4c and Δuge3 A. fumigatus compared with the WT (Fig. 2e, f, Extended Data Fig. 3c). Consistently, WT, Δgt4c and Δuge3 strains induced comparable NLRP3 and pro–IL-1β protein expression after infection (Fig. 2g, Extended Data Fig. 3d). Therefore, A. fumigatus-induced cell priming was independent of GAG, possibly due to other PAMPs on the surface of A. fumigatus and the contribution of other polysaccharides such as β-glucan12. There were no significant differences in the expression of Nlrp3, Il1β and Tnf in BMDMs infected with WT, Δgt4c or Δuge3 strains (Fig. 2h–j, Extended Data Fig. 3e–g). Furthermore, LPS priming failed to rescue the defect in caspase-1 activation induced by Δgt4c (Fig. 2k), further confirming that the defective inflammasome response was independent of priming but dependent on inflammasome activation itself.
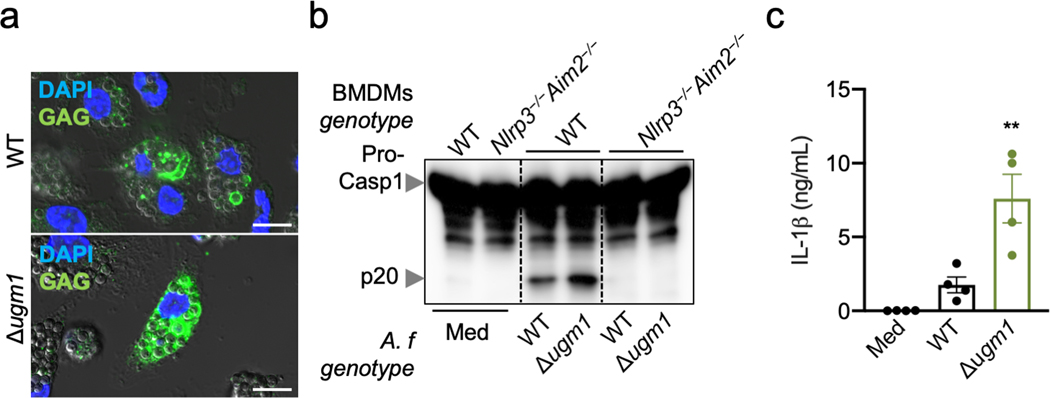
We also found that BMDMs infected with the Δugm1 A. fumigatus strain, which produces more GAG compared with parental A. fumigatus (Extended Data Fig. 4a)7, showed enhanced cleavage of caspase-1 and IL-1β release compared with WT A. fumigatus (Extended Data Fig. 4b, c). This confirmed the crucial role of GAG in A. fumigatus–mediated inflammasome activation.
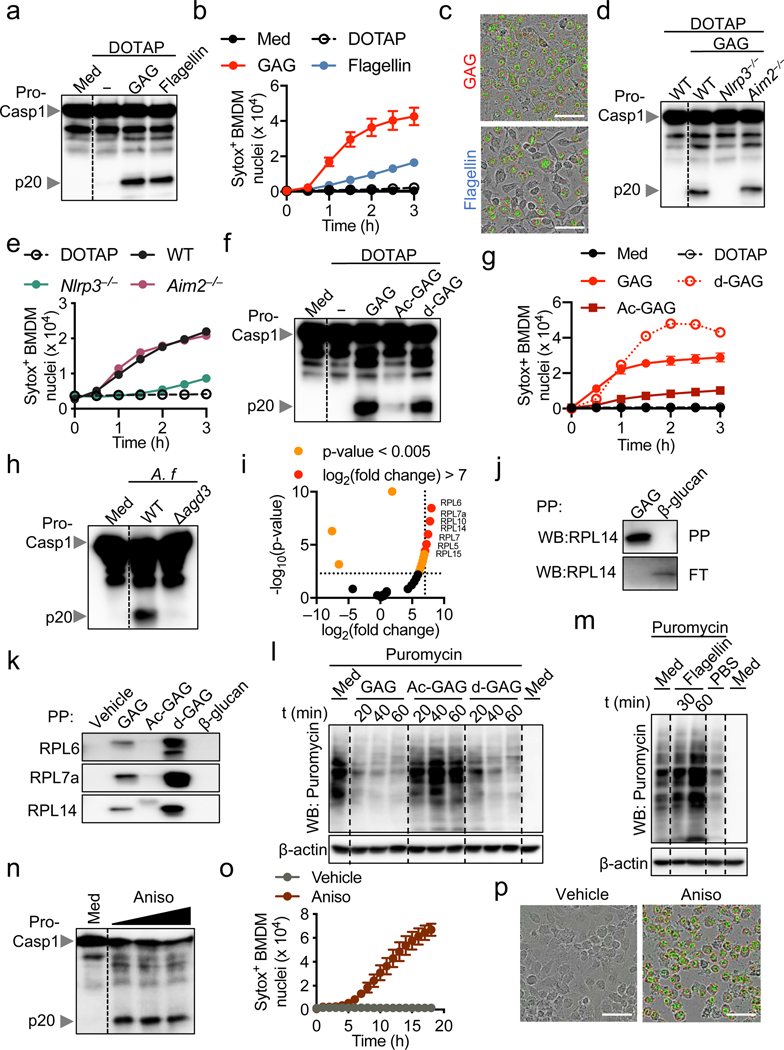
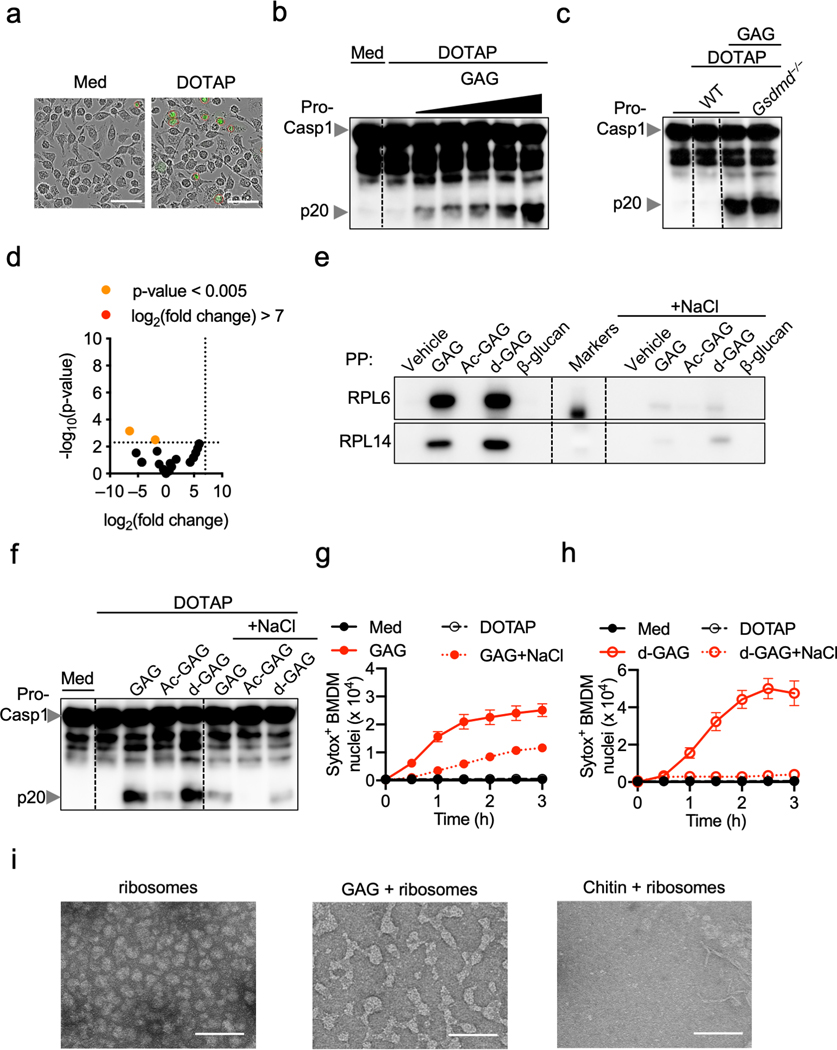
We recently showed that cytosolic delivery of β-glucan activates the inflammasome2. Upon infection, Aspergillus conidia inflate and germinate inside the host cell, releasing GAG into the cytosol (Fig. 2b, Extended Data Fig. 4a). Cytosolic delivery of GAG or flagellin induced caspase-1 cleavage and cell death in BMDMs, confirming the ability of cytosolic GAG to induce inflammasome activation (Fig. 3a–c, Extended Data Fig. 5a, b). A. fumigatus induces activation of both the NLRP3 and AIM2 inflammasomes3. However, with GAG transfection, NLRP3 was required for caspase-1 cleavage and cell death, but AIM2 was not (Fig. 3d, e). This shows that GAG specifically induces NLRP3 inflammasome activation. Also, GSDMD was dispensable for NLRP3 inflammasome activation during GAG transfection (Extended Data Fig. 5c).
Fig. 3. Galactosamine of GAG interacts with ribosomes, inhibits translation and induces NLRP3 inflammasome activation.
a, Immunoblot analysis of pro-caspase-1 (pro-Casp1; p45) and cleaved caspase-1 (p20) of bone marrow-derived macrophages (BMDMs) left untreated (medium alone [Med]) or assessed 3 h after indicated transfection. Representative images (n ≥ 3 independent experiments). b, Cell death during indicated transfection (n = 3 biologically independent samples). c, Cell death induced during GAG or flagellin transfection after 3 h. Scale bars, 50 μm. Representative images (n ≥ 3 independent experiments). d, e, Immunoblot analysis of caspase-1 (d) and cell death (e) of indicated BMDMs transfected with GAG or WT transfected with DOTAP alone. d, Representative images (n ≥ 3 independent experiments); e, (n = 1). f, g, Immunoblot analysis of caspase-1 (f) and cell death (g) of WT BMDMs transfected with indicated stimuli. Representative images (n = 3 independent experiments). h, Immunoblot analysis of caspase-1 from BMDMs infected with A. fumigatus (A.f) WT (AF293) or Δagd3 (MOI, 10). Representative images (n ≥ 3 independent experiments). i, Volcano plot of the polysaccharide pull down (PP) of the GAG interactome with BMDM cytosolic proteins versus control. P values were determined by the G-test and are presented in Supplemental Table 1. j, Immunoblot analysis of RPL14 interacting with GAG or β-glucan after PP or in the corresponding flow through (FT). k, Immunoblot analysis of ribosomal proteins interacting with indicated sample. l, m, Immunoblot analysis of translation rate by puromycin integration during indicated transfections. n, Immunoblot analysis of caspase-1 from BMDMs assessed after 16 h with increasing concentrations of anisomycin (Aniso, 25, 50, and 100 μg/mL). j–n, Representative images (n ≥ 3 independent experiments). o, Cell death during Aniso treatment (n = 2 [vehicle] and 3 [Aniso] biologically independent samples). p, Cell death induced during Aniso treatment. Scale bars, 50 μm. Representative images (n ≥ 3 independent experiments). b, g, o, Data are mean +/− SEM.
The bioactivity of bacterial or fungal exopolysaccharides such as GAG is highly dependent on their degree of acetylation11. We observed that acetylated GAG (Ac-GAG) did not induce notable caspase-1 cleavage and cell death, whereas deacetylated GAG (d-GAG) did (Fig. 3f, g), suggesting that the galactosamine subunit of GAG is required for inflammasome activation and cell death. To further confirm the role of d-GAG, we infected BMDMs with the A. fumigatus Δagd3 strain, which only produces acetylated GAG due to loss of N-acetyl glucosamine deacetylase11. Similar to the effect of Ac-GAG (Fig. 3f), the Δagd3 strain failed to induce caspase-1 cleavage (Fig. 3h), further confirming that the presence of galactosamine in GAG is crucial for inflammasome activation.
We then identified ribosomal proteins as interacting partners of GAG (Fig. 3i and Supplemental Table 1) but not β-glucan (Extended Data Fig. 5d). We validated that RPL14 interacted specifically with GAG, but not β-glucan (Fig. 3j). Furthermore, d-GAG, but not Ac-GAG or β-glucan, interacted with ribosomal proteins found in our mass spectrometry analysis (RPL6, RPL7a and RPL14) (Fig. 3k). Addition of NaCl inhibited this interaction, suggesting that charge-charge interactions are responsible for the binding (Extended Data Fig. 5e). To confirm this, we complemented the reaction media with NaCl during GAG transfection; this inhibited the GAG-ribosome interaction and protected against inflammasome activation and cell death (Extended Data Fig. 5f–h). We also observed that purified ribosomes incubated with GAG became clumped (Extended Data Fig. 5i). Together these data suggest that GAG traps ribosomes and inhibits translation elongation and/or termination. These findings also confirmed that the galactosamine moiety is responsible for GAG trapping ribosomal proteins through charge-charge interactions, resulting in inflammasome activation.
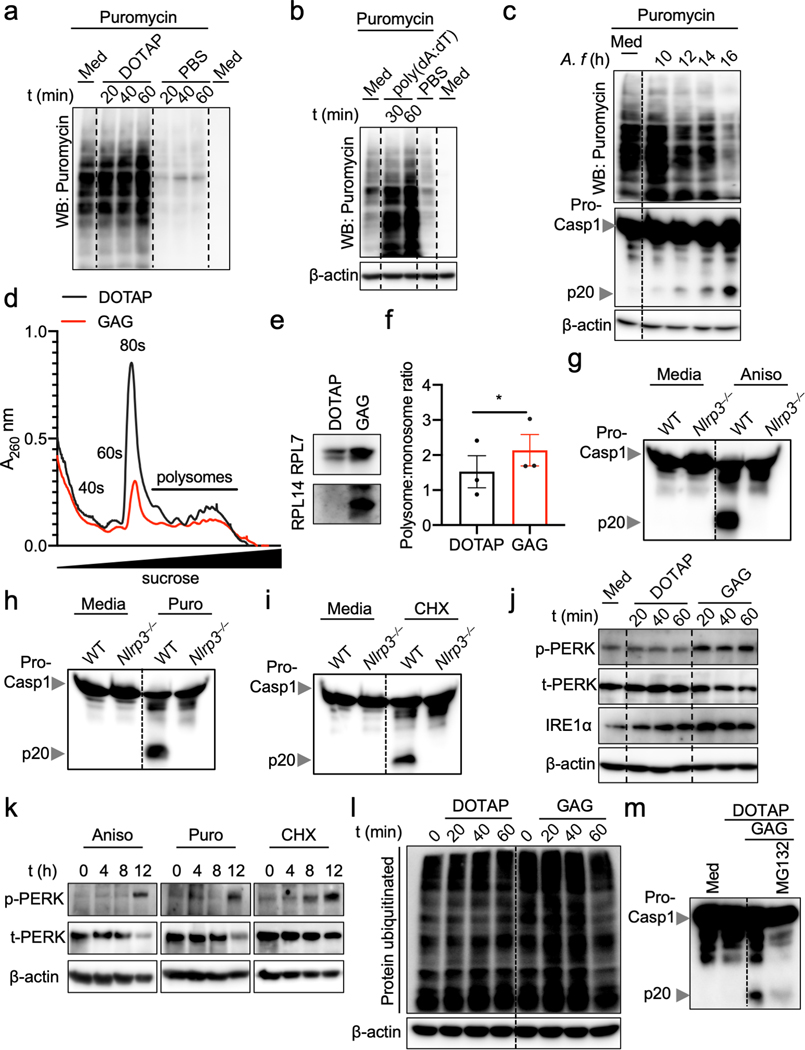
Because aberrations in ribosomes and translation inhibition can drive cell death13, we quantified the total translation activity in BMDMs transfected with GAG. Both GAG and d-GAG rapidly and strongly inhibited translation (Fig. 3l, Extended Data Fig. 6a), whereas Ac-GAG was unable to inhibit translation, similar to flagellin and ds-DNA, two others known inflammasome triggers (Fig. 3l, m, Extended Data Fig. 6b). Infection with A. fumigatus also inhibited translation (Extended Data Fig. 6c).
Using polysome profiling to investigate how GAG inhibited translation, we observed that the size of the 80S peak remained small in the GAG transfected samples compared with DOTAP alone, suggesting stabilization of the polysomes (Extended Data Fig. 6d). A fraction of the ribosomal proteins precipitated out with GAG during the analysis (Extended Data Fig. 6e). This can explain the similar polysome peak sizes we observed in both the GAG-transfected and DOTAP alone-transfected samples (Extended Data Fig. 6d), as larger polysomes are more likely to form GAG-ribosome precipitates. The polysome:monosome ratio also increased during GAG transfection (Extended Data Fig. 6f). These data suggest that GAG immobilizes the ribosome to inhibit translation (Fig. 3l and Extended data Fig. 6d–f).
To confirm that translation inhibition triggers inflammasome activation, we stimulated BMDMs with the translation inhibitors anisomycin, puromycin and cycloheximide14. BMDMs treated with all three classes of inhibitors (initiation, elongation or termination inhibitors) showed caspase-1 cleavage and pyroptosis in an NLRP3-dependent manner, as was observed with GAG (Fig. 3n–p, Extended Data Fig. 6g–i). Collectively, these data show that the galactosamine unit of GAG interacts with ribosomal proteins to shut down translation, thereby activating the NLRP3 inflammasome.
Ribosomes and the endoplasmic reticulum (ER) are both central to protein synthesis and quality control. Defects in these processes can lead to ER stress, which mediates NLRP3 inflammasome activation15. We observed that GAG transfection induced PERK phosphorylation and the expression of IRE1α, two markers of ER stress (Extended Data Fig. 6j). Similar PERK activation was observed upon treatment with translation inhibitors (Extended Data Fig. 6k). Additionally, GAG induced protein polyubiquitination (Extended Data Fig. 6l), suggesting an accumulation of misfolded proteins which should be degraded via the unfolded protein response (UPR) and proteasome16. Inhibition of proteasome activity during GAG transfection abolished caspase-1 activation (Extended Data Fig. 6m), suggesting an UPR-dependent mechanism for inflammasome activation in response to GAG. Together, these data suggest that GAG inhibits translation and induces ER stress, which activates the UPR to mediate NLRP3 inflammasome activation.
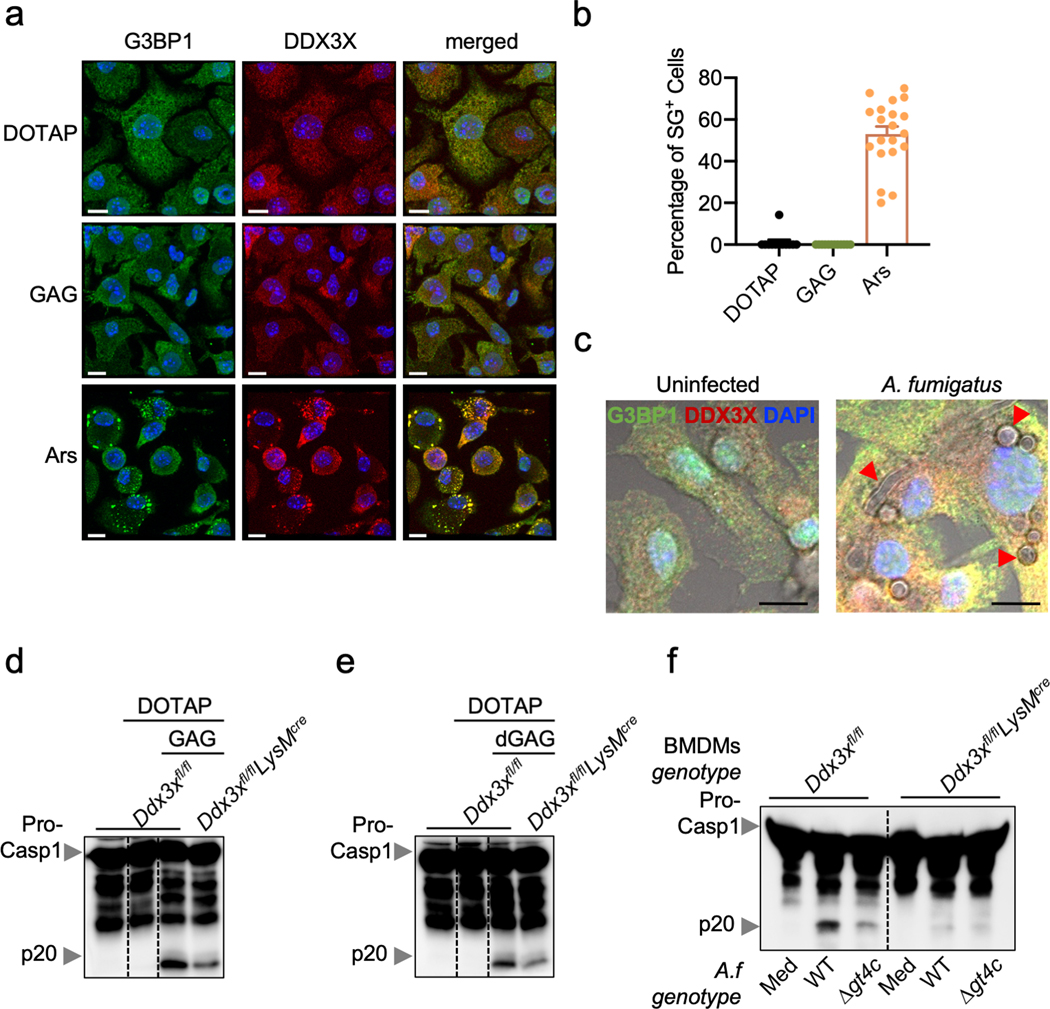
We recently showed that in response to stressors, cell fate is decided by the localization of DDX3X molecules to stress granules (pro-survival) or the NLRP3 inflammasome (pro-pyroptosis)17. GAG did not induce G3BP1/DDX3X-containing stress granules, nor did A. fumigatus infection (Extended Data Fig. 7a–c). DDX3X was required for inflammasome activation in response to GAG transfection and A. fumigatus infection (Extended Data Fig. 7d–f).
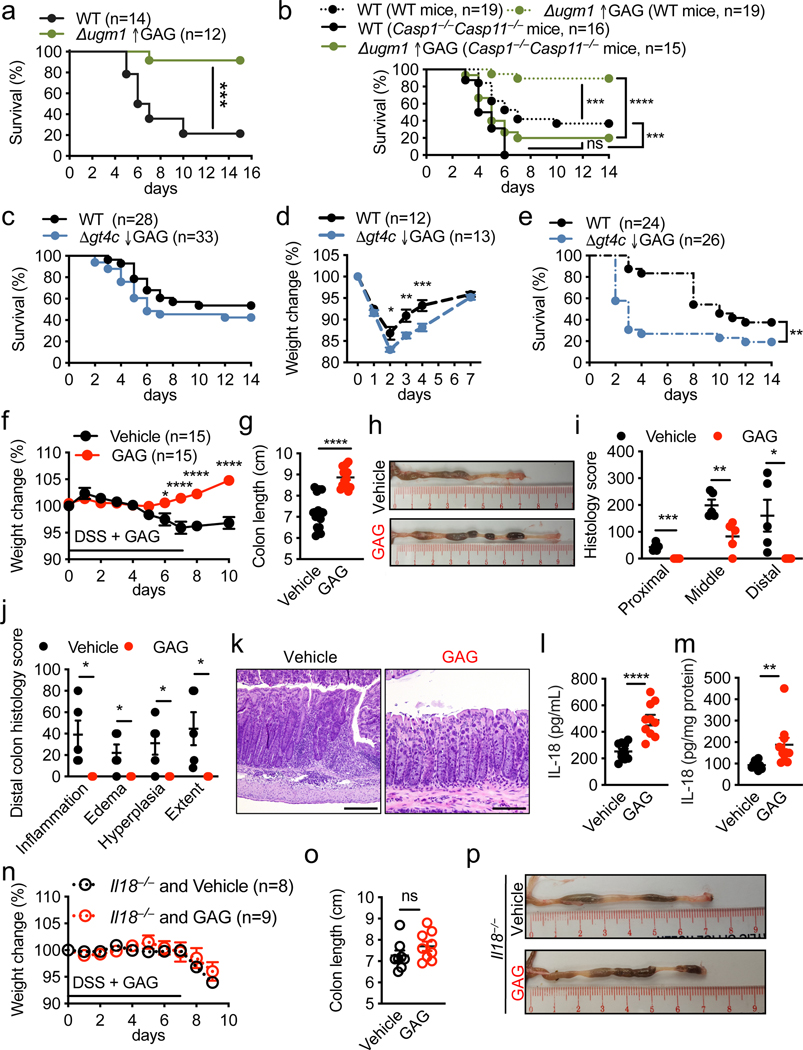
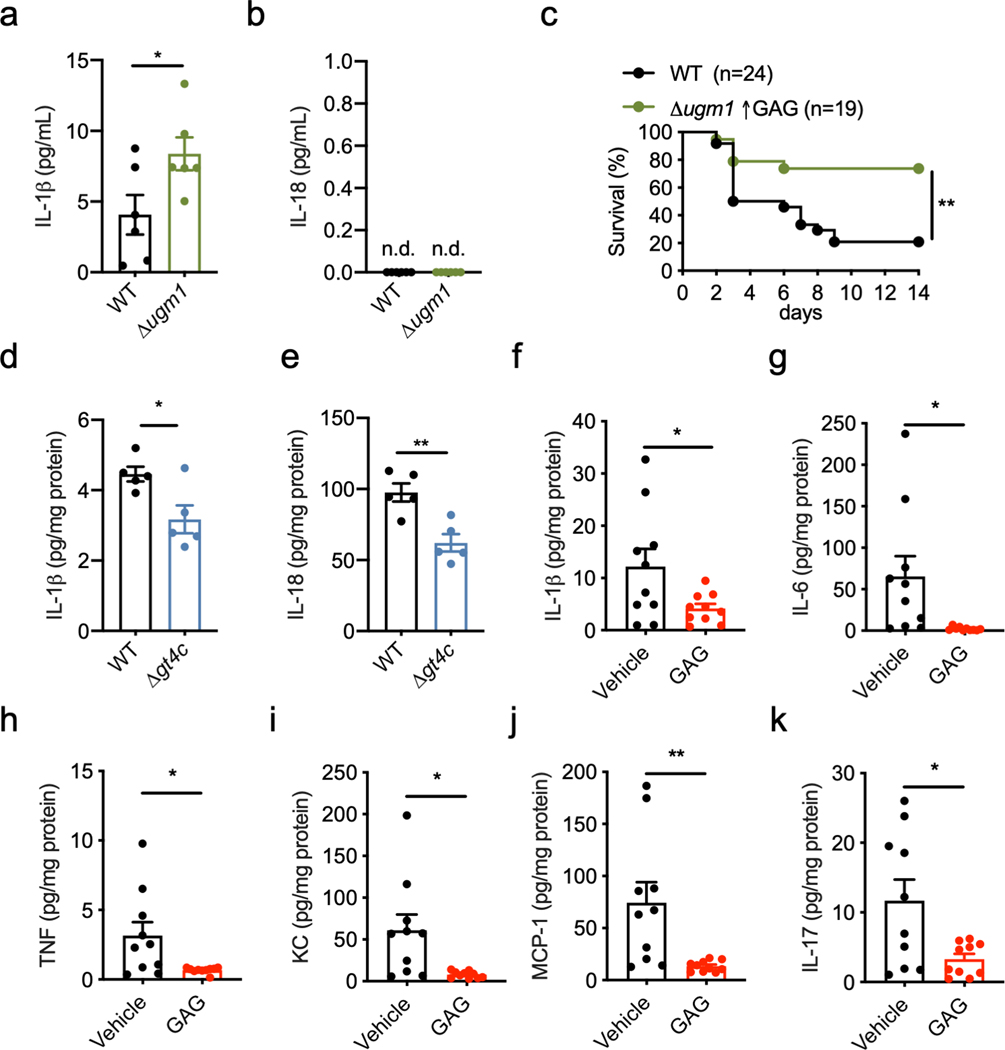
To investigate whether the protection provided by the inflammasome during aspergillosis2,3,18 was mediated by GAG, we infected immunocompromised WT mice with WT and Δugm1 (GAG overproducing strain) A. fumigatus strains. As expected, mice infected with the Δugm1 strain showed a higher survival rate than those infected with WT A. fumigatus (Fig. 4a). Mice lacking inflammasome components (Casp1−/−Casp11−/− mice) showed a higher mortality rate compared with WT mice infected with WT or Δugm1 A. fumigatus strains (Fig. 4b). Although the Δugm1 strain was less virulent than WT A. fumigatus in WT mice, the two strains were equally virulent in Casp1−/−Casp11−/− mice (Fig. 4b). Δugm1 also induced more IL-1β release in WT mice compared with the WT strain (Extended Data Fig. 8a,b). Together, these data suggest that inflammasome activation in response to GAG limits the virulence of the Δugm1 strain in WT mice.
Fig. 4. GAG-induced inflammasome activation provides host protection against aspergillosis and DSS-induced colitis.
a–c, Survival of wild type (WT) or Casp1−/−Casp11−/− immunosuppressed mice immunosuppressed infected intranasally with (a, b) 1 × 10⁶ A. fumigatus, or (c) with 5 × 10⁵ A. fumigatus. d, Weight change of immunocompetent WT mice infected intranasally with 5 × 10⁷ A. fumigatus. e, Survival of immunocompetent WT mice infected intravenously with 1 × 10⁶ A. fumigatus. f, Weight change of WT mice during dextran sulfate sodium (DSS) hydric supplementation and treatment with GAG (red) or vehicle (black) by intraperitoneal injection. g, Colon length of WT mice treated with GAG (red) or vehicle (black) (GAG and Vehicle, n = 15 each). h, Representative images of colon from (g) at day 10. i, j, Histology scores of the colon at day 10 (GAG and Vehicle, n = 5 each). k, Representative images of hematoxylin and eosin staining of distal colon at day 10. Scale bars, 200 μm. l, m, Concentrations of IL-18 in (l) serum and (m) colon tissue homogenates at day 10 (Vehicle and GAG, n = 10 each). n, Weight change of Il18−/− mice during DSS hydric supplementation and treatment with GAG or vehicle by intraperitoneal injection. o, Colon length of Il18−/− mice treated with GAG (red, n = 9) or vehicle (black, n = 8). p, Representative images of colon from (o) at day 10. ns, not significant, *P < 0.05, **P < 0.01, ***P < 0.001 and ****P < 0.0001, (a–c, e) log-rank (Mantel-Cox) test, (d, f, n) 2-way ANOVA with Holm-Sidak’s multiple comparisons test, and (g, i, j, l, m, o) unpaired two-tailed t-test. Exact P values are presented in Extended Data Table 2. d, f, g, i, j, l–o, Data are mean +/− SEM.
The survival rates of immunocompromised WT mice infected with WT and Δgt4c A. fumigatus strains were similar (Fig. 4c). However, mice infected with Δgt4c looked more hunched compared with those infected with the WT strain (data not shown). Moreover, immunocompetent WT mice lost more body weight when infected with Δgt4c compared with the WT A. fumigatus (Fig. 4d). In a systemic model, direct injection of the Δgt4c mutant conidia into the blood stream showed significantly higher virulence compared to WT A. fumigatus, whereas the Δugm1 mutant was less virulent (Fig. 4e and Extended Data Fig. 8c). In addition, IL-1β and IL-18 release were reduced in the liver of mice infected with Δgt4c compared with the WT A. fumigatus (Extended Data Fig. 8d, e). These results collectively demonstrate that GAG-mediated inflammasome activation is required for host defense against aspergillosis.
We further extended our study of the role and physiological relevance of GAG-mediated inflammasome activation using a dextran sulfate sodium (DSS)-induced colitis model, where inflammasome activation is largely protective19,20. We observed that WT mice treated with GAG did not lose body weight and were protected from inflammation (Fig. 4f–k). Although the levels of proinflammatory cytokines secreted in the colon were reduced in GAG-treated mice compared with levels in vehicle-treated mice (Extended Data Fig. 8f–k), levels of the inflammasome-dependent cytokine IL-18 were increased in both serum and colon lysates (Fig. 4l, m). In addition, GAG treatment did not provide protection in Il18−/− mice during DSS-induced colitis (Fig. 4n–p), suggesting that GAG-induced IL-18 production is crucial for protection against colitis.
In summary, we identified A. fumigatus deacetylated-GAG as a novel PAMP that activates the NLRP3 inflammasome. Mechanistically, the galactosamine subunit interacted with ribosomal proteins through charge-charge interactions to inhibit translation and induce ER stress, thereby causing inflammasome activation. Ribosomes are the most abundant organelle in the cell and are required for translation and cellular homeostasis. Therefore, aberrant protein synthesis is a danger signal. Ribosomes may act as cytosolic sensors of intracellular GAG that initiate activation of a protective NLRP3 inflammasome response. Ribosomes have been proposed as a metabolic sensor in bacteria to adapt in response to the environment21,22. While aberrant cellular ionic exchange, lysosomal rupture, mitochondria destabilization, ER stress23 or trans-Golgi network disassembly24 have each been proposed as mechanisms contributing to NLRP3 inflammasome activation, the exact mechanism is still debated. Loss of cellular potassium, an event in NLRP3 inflammasome activation, induces translation inhibition via ribotoxic stress25. In addition, reactive oxygen species (ROS) and cellular oxidative stress inhibit translation26,27. ROS and mitochondria are associated with NLRP3 inflammasome activation. These observations suggest ribosomes and translation inhibition could be an important mechanism for NLRP3 inflammasome activation. However, the role of ribosomes and translation during NLRP3 inflammasome activation by other triggers and pathogens needs further investigation. Our data provide a new paradigm where ribosomes play a crucial role in driving inflammasome activation and promoting an effective innate immune response against fungal pathogens.
METHODS
Aspergillus strain and culture
Aspergillus fumigatus (A.f) A1160, Δgt4c, Δugm128, AF293 (NCPF 7367), Δagd311 and Δuge37 strains were grown on 2% (w/v) malt/2% (w/v) agar slants for 1 week. Conidia were harvested in water containing 0.1% (v/v) Tween 2029.
Mice
Casp1–/–Casp11–/– (ref. 30), Nlrp3–/– (ref. 31), Aim2–/– (ref. 32), Il18–/– (ref. 3), Nlrp3–/–Aim2–/– (ref. 3), Gsdmd–/– (ref. 33) and Ddx3xfl/flLysMcre (ref. 17) mice have been described previously. All mice were backcrossed to the C57BL/6 background. Mice were bred at St. Jude Children’s Research Hospital (St. Jude). Animal studies were conducted under protocols approved by the St. Jude Animal Care and Use Committee. Mice were kept with a 12:12 light:dark cycle. Humidity was maintained between 30%–70% and the temperature ranged from 20–23.3°C. Prior sample size determination was not done. Animals from the same cage were randomly selected for different treatments. The pathologist was blinded for examination of histological analyses.
Generation of A. fumigatus Δgt4c deletion strains
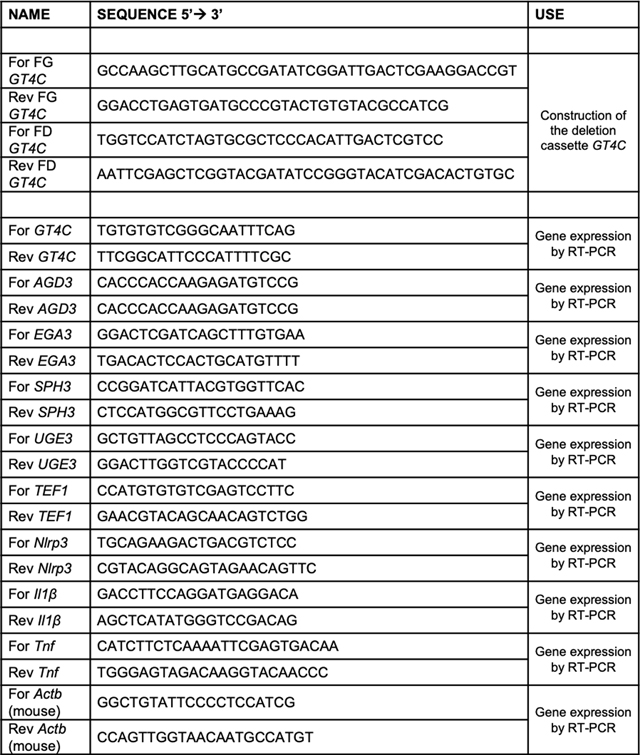
The deletion mutants were constructed in the A1160 background29 using the β-rec/six site-specific recombination system34. The self-excising β-rec/six blaster cassette containing the hygromycin resistance marker was released from the plasmid pSK529 via FspI restriction enzyme digestion. Using GeneArt® Seamless Cloning and Assembly (Life Technologies) the GT4 replacement cassette containing the marker module flanked by 5’ and 3’ homologous regions of the target gene generated by PCR was cloned into the pUC19 vector. The corresponding replacement cassettes were released from the resulting vector via EcoRV or DraI digestion, respectively. The A1160 parental strain was transformed with the GT4C replacement cassettes by electroporation to generate the single deletion mutants. Transformants obtained were analyzed by Southern blot using the DIG probe protocol (Roche Diagnostics) (Extended Data Fig. 1e,f and Extended Data Table 1).
Cell-inert surface assay
The cell-inert surface adhesion assay was performed on an abiotic surface (tissue culture test plate 24, TPP). Liquid medium (1 mL) containing 104 A. fumigatus conidia was incubated at 37°C for 20 h. After washing with water, adherent mycelium was estimated as described before with Crystal violet staining35.
Carbohydrate analysis of the cell wall and culture supernatant fractions
After 48 h of growth in Brian liquid medium shaking at 37°C, 150 rpm, mycelia and culture supernatant were separated by filtration. Macromolecules from the supernatant were precipitated by 3 volumes of ethanol at 4°C overnight and collected by centrifugation (5 min, 4000 × g). Cell wall fractions were obtained after mycelium disruption and centrifugation as previously described36. Polysaccharides from the cell wall were separated based on their alkali-solubility36. Neutral hexoses were estimated by the phenolsulfuric method using glucose as a standard37. Osamines were quantified by HPLC after acid hydrolysis by 6 N HCl at 100°C for 6 h38. The amount of de-N-acetylated galactosamine in the GAG fraction was estimated by assaying for anhydrotalose formed after nitrous deamination39. Briefly, 500 μL of sample containing up to 40 μg of osamine was treated with 500 μL of 5% KHSO4 and 500 μL of 5% NaNO2 for 2 h at 50°C. After cooling, the excess nitrous acid was destroyed by 500 μL of 12.5% ammonium sulfamate for 5 min at room temperature. Then, 500 μL of 0.5% MBTH (3-methyl-2-benzothiazolinone hydrazone monohydrate, Sigma) was added and the mixture was allowed to stand for 30 min at 37°C before the addition of 500 μL of 0.5% FeCl3. The blue color was allowed to develop for 30 min at room temperature and the absorbance was measured at 650 nm. Proteins were quantified by the BCA assay (Thermo Fisher Scientific) using BSA as a standard. Monosaccharides were identified and quantified by GLC after acid hydrolysis with 4 N trifluoroacetic acid at 100°C for 4 h36. Glycosidic linkage analysis was performed by methylation using the lithium methyl sulfinyl carbanion procedure and identified as partially methylated acetate alditol by GC-MS as previously described40.
GAG purification and biochemical modifications (de-N-acetylation and acetylation)
GAG production and chemical modifications were carried out as previously described6,41. For de-N-acetylation, GAG was suspended in 3 mL of 10 mM HCl at a final concentration of 3.33 mg/mL by sonication in plastic tubes. The de-N-acetylation was started by addition of 3.4 mL 18.8 M NaOH, and the mixture was incubated at 100°C for up to 4−5 h. The tubes were vortexed every hour. The reaction was stopped on ice and neutralized with 12 N HCl. De-N-acetylated GAG was dialyzed against milli-Q water and finally lyophilised. For acetylation, GAG was dissolved in 25 μL of 400 mM acetic acid and 100 μL CH3OH. The mixture was preincubated for 1 h at ambient temperature with agitation at 300 rpm. Acetylation was initiated by addition of 3 μL acetic anhydride for 1 h. After dialysis with milli-Q water, the sample was lyophilised.
In vitro stimulation of BMDMs
Primary BMDMs were grown for 6 days in IMDM (12440–053, Gibco) supplemented with 10% FBS (S1620, lot number 221C16, Biowest), 30% L929-conditioned medium and 1% penicillin and streptomycin. BMDMs (1 × 10⁶) were seeded in 12-well cell culture plates (3513, Costar) in DMEM (11995–065, Gibco) supplemented with 10% FBS and 1% penicillin–streptomycin before stimulation with ligands. For infection granulocyte macrophage colony-stimulating factor (GM-CSF)–derived bone marrow cells (denoted as BMDMs) were prepared as previously described and infected with A. fumigatus conidia at a multiplicity of infection (MOI) of 10 for 18 h. For priming, BMDMs were incubated with 100 ng/mL of LPS (tlrl-smlps, Invivogen) for 3 h and washed before infecting with A. fumigatus as described above.
For stimulation with translation inhibitors, BMDMs were incubated with 1 μg/mL of Pam3CSK4 (tlrl-pms, Invivogen) for 4 h, washed, and incubated with 25 μg/mL of anisomycin (11308, Cayman Chemical), 50 μg/mL of cycloheximide (01810, Sigma-Aldrich) or 50 μg/mL of puromycin (ant-pr-1, Invivogen).
Ligand transfection into BMDMs
For polysaccharides (GAG or curdlan [β-glucan; C7821, Sigma]) or flagellin (tlrl-epstfla, Invivogen) transfection, BMDMs were incubated with 1 μg/mL of Pam3CSK4 (tlrl-pms, Invivogen) for 4 h, washed, and incubated for 1 h prior to transfection in HBSS/Modified (HyClone, SH30031.02). Then 20 μg/mL GAG, Ac-GAG, d-GAG or curdlan were resuspended in HCl 0.01 N or 2 μg/mL flagellin was resuspended in LAL water (Invivogen) and mixed with DOTAP (Roche, 11202375001) as per the manufacturer’s protocol (vol:vol ratio).
For poly(dA:dT) (tlrl-patn, Invivogen) transfection, the BMDMs were incubated with 1 μg/mL of Pam3CSK4 for 4 h, washed, and were incubated 1 h prior to transfection in Opti-MEM (31985–070, Thermo Fisher Scientific). One μg/mL of poly(dA:dT) was mixed with Xfect (631318, Takara) as per the manufacturer’s protocol. The BMDMs were stimulated with mixed solutions for 3 h before cell lysate collection.
For inhibition of the proteasome or salt treatment during GAG transfection, the medium was complemented 10 min prior to transfection with 30 μM of MG132 (M8699, Sigma Aldrich) or 200 mM of NaCl (BP358, Fisher).
To measure poly-ubiquitination, the cells were washed with PBS and harvested with RIPA buffer complemented with 10 μM of N-Ethylmaleimide (NEM).
Real-time cell-death analysis
Real-time cell-death assays were performed using a two-color IncuCyte Zoom incubator imaging system (Essen Biosciences). BMDMs (80,000 per well) were seeded in 96-well tissue culture plates (3596, Costar) in the presence of 20 nM Sytox Green (Thermo Fisher Scientific, S7020) in the corresponding medium or buffer used for the ligand transfection method (see above). The images were acquired every 30 min for 3 h at 37°C and 5% CO2. The resulting images were analyzed using the software package supplied with the IncuCyte imager (IncuCyte S3, v2018C), which counts the number of Sytox Green-positive BMDM nuclei (Sytox+ BMDM nuclei) present in each image.
Translation rate of BMDMs
For translation rate quantification, BMDMs were transfected as described above with GAGs, flagellin or poly(dA:dT) or infected with A. fumigatus. For translation inhibition controls the cells were stimulated with 50 μg/mL anisomycin (Cayman Chemical) or incubated in PBS. Ten min prior to the collection of cell lysates, 10 μg/mL of puromycin (ant-pr, Invivogen) was added. BMDMs were lysed in 1× RIPA buffer and sample loading buffer for immunoblotting analysis.
Polysaccharide pull down analysis
For identification of proteins interacting with GAG, the BMDMs were lysed in NP40 buffer (50 mM HEPES, 150 mM NaCl, 1% NP40, 50 mM EDTA, pH 7.4 ± 0.2) and centrifuged for 10 min at 10,000 × g to remove cell debris. Cell lysate and GAGs (GAG, Ac-GAG, d-GAG) or β-glucan were incubated for 2 h with rotation at room temperature with or without 1.2 M NaCl (BP358, Fisher). The samples were washed 6 times with NP40 buffer after 10 min of 10,000 × g centrifugation at 4°C. After washes, polysaccharides pulled down were eluted in sample buffer and used for immunoblotting analysis or mass spectrometry analysis on the Q-Exactive mass spectrometer as describe previously17.
Polysome profiling
BMDMs (12 × 106) were transfected with DOTAP + GAG or DOTAP alone and incubated for 1 h. Polysome profiling was performed as described previously42 with minor modifications. Briefly, clarified cell lysates were loaded on top of a 5%–50% sucrose gradient and spun at 133,000 × g in an SW-60 rotor for 2 hours at 4°C. Absorbance at UV 260 nm was used to track separation of the polysomes in the sucrose gradient. Area under the curve was calculated in GraphPad Prism.
Ribosome purification
The ribosomes of BMDMs were purified as described previously42 with minor modifications. Briefly, 20 × 106 WT BMDMs were harvested and washed 3 times with PBS. Then the cells were lysed in standard buffer (10 mM Tris pH 7.4, 5 mM BME, 50 mM ammonium chloride, 5 mM magnesium acetate), and the lysate was clarified by centrifugation at 20,000 × g for 30 minutes at 4°C. The clarified lysate was loaded on a discontinuous sucrose gradient (5% and 20% sucrose made in wash buffer [10 mM Tris pH 7.4, 5 mM BME, 500 mM ammonium chloride, 100 mM magnesium acetate]). The cells were spun at 60,000 × g in an SW-55Ti rotor for 16 hours at 4°C. The ribosome pellet was resuspended in standard buffer and spun at 10,000 × g for 10 minutes at 4°C to remove insoluble debris.
In vivo A. fumigatus infection
Mice were infected with A. fumigatus as previously described18. Briefly, cyclophosphamide monohydrate (C0768, Sigma) was dissolved in sterile PBS and administered intraperitoneally (150 mg per kg of body weight). Cortisone 21-acetate (C3130, Sigma) was suspended in 0.1% Tween 20 in PBS and subcutaneously injected (112 mg per kg of body weight). Male and female mice aged 7 to 8 weeks were used for this study. Mice were given a combination of cyclophosphamide and cortisone acetate 2 days before infection and on the day of infection for the immunocompromised model of pulmonary aspergillosis or directly infected without cyclophosphamide and cortisone acetate treatment for the immunocompetent model. Mice were anesthetized by isoflurane inhalation and inoculated intranasally with 1 × 10⁵ to 1 × 10⁶ conidia of A. fumigatus in 30 μL of 0.1% Tween 20 in PBS for the immunocompromised model or 108 conidia of A. fumigatus in 30 μL 0.1% Tween 20 in PBS for the immunocompetent pulmonary model. For the immunocompetent systemic model, mice were injected in the retro-orbital vein with 106 conidia in 150 μL 0.1% Tween 20 in PBS. Fungal burden was quantified by RT-PCR as previously described43. For the measurement of in vivo cytokines released during pulmonary aspergillosis (WT and Δugm1 A. fumigatus strains), we processed the bronchioalveolar lavage with 1 mL of PBS 2 days after infection and analyzed the cytokines. For the systemic model (WT and Δgt4c A. fumigatus strains), we extracted the liver of infected mice and measured the cytokines in the liver lysate 16 h and 24 h after infection for IL-1β and IL-18, respectively.
In vivo DSS-induced colitis
The dextran sulfate sodium (DSS)-induced colitis model was carried out as previously described44. Briefly, male and female mice aged 7 to 8 weeks were supplemented with 3% DSS (9011–18-1, Thermo Fisher Scientific) in the drinking water for 7 days and injected daily intraperitoneally with 1 mg/kg mouse weight GAG or vehicle control for 7 days (concurrent with DSS treatment) followed by regular drinking water for 3 days. For the measurement of in vivo cytokines released in the DSS-induced colitis model, serum and colon lysates were collected at day 10.
Immunoblotting analysis
To check for caspase-1 cleavage by western blot analysis, cells and supernatants were lysed in caspase lysis buffer and sample loading buffer containing SDS and 100 mM dithiothreitol. To check for signaling molecules, BMDMs were lysed in 1× RIPA buffer and sample loading buffer as described previously3. Proteins (15 μg) were separated on 8%–10% or 12% polyacrylamide gels. After electrophoretic transfer of protein onto PVDF membranes (EMD Millipore), membranes were blocked in 5% skim milk and incubated with primary antibodies against caspase-1 (AG-20B-0042, Adipogen, 1:1000), p-IκBα (2859, Cell Signaling, 1:1000), t-IκBα (9242, Cell Signaling, 1:1000), p-ERK (9101, Cell Signaling, 1:1000), t-ERK (9102, Cell Signaling, 1:1000), NLRP3 (AG-20B-0006, Adipogen, 1:1000), pro–IL-1β (12507, Cell Signaling, 1:1000), β-actin (8H10D10, Cell Signaling, 1:1000), RPL6 (A15094, ABclonal, 1:1000), RPL7a (A14060, ABclonal, 1:1000), RPL14 (A6724, ABclonal, 1:1000), p-PERK (3179S, Cell Signaling, 1:750–1:1000), t-PERK (3192, Cell Signaling, 1:1000), IRE1α (3294S, Cell Signaling, 1:1000), ubiquitin (3933S, Cell Signaling, 1:1000) and puromycin (MABE343, EMD Millipore, 1:25000) followed by secondary anti-rabbit, anti-mouse or anti-goat HRP antibodies (111–035-047, 315–035-047, and 705–035-003, respectively from Jackson ImmunoResearch Laboratories). Membranes were developed with an Amersham imager and analyzed with Fiji for MacOS X (version 2.0.0-rc-67/1.52c)45.
Real-time qRT-PCR analysis
BMDMs infected with A. fumigatus as above for the indicated time were collected in TRIzol (15596026, Thermo Fisher Scientific) for RNA extraction. A. fumigatus mycelium grown for 8 h in LB medium at 37°C and 250 rpm were washed with PBS and collected in TRIzol. RNA was converted into cDNA by using the High-Capacity cDNA Reverse Transcription Kit (4368814, Applied Biosystems). Real-time qPCR was performed on an ABI 7500 real-time PCR instrument with 2× SYBR Green (4368706, Applied Biosystems). Macrophage gene quantification and A. fumigatus gene quantification were presented relative to that of the gene encoding macrophage Actb and A. fumigatus TEF1, respectively.
Cytokine analysis
Cytokine levels were determined by multiplex ELISA (MCYTOMAG-70K, Millipore) according to the manufacturer’s instructions. For the in vivo measurement of IL-1β and IL-18, the mouse IL-1β uncoated ELISA kit (88–703-88, Invitrogen) and mouse IL-18 ELISA Kit (BMS618–3TEN, Invitrogen) were used according to the manufacturer’s instructions.
Immunofluorescence staining
Mycelia of Δgt4c and parental strains were PFA-fixed (2.5% (v/v) PFA in PBS) overnight at 4°C, washed three times with 0.1 N NH4Cl in PBS, once with PBS, and then incubated with a specific GAG monoclonal antibody against galactosaminogalactan as described previously6. For GAG immunofluorescence staining in BMDMs, 1 × 10⁶ BMDMs were seeded on 4-well, 15-μm slides (80426, Ibidi) in DMEM supplemented with 10% FBS and 1% penicillin–streptomycin and infected with A. fumigatus conidia at 10 MOI for the indicated time. Cells were washed 3 times and fixed in 4% paraformaldehyde for 15 min at room temperature, followed by blocking in PBS containing 10% goat serum (PCN5000, Life Technologies) supplemented with 0.2% saponin (47036, Sigma Aldrich) for 1 h at room temperature. Then cells were incubated with a specific GAG monoclonal antibody against galactosaminogalactan as described above6. Next, cells were washed 4 times with PBS and stained with an anti-rabbit secondary Alexa Fluor 488 antibody (1:250 dilution, A32723, Invitrogen) and 5 μg/mL DAPI (Biotium) in PBS containing 10% goat serum supplemented with 0.2% saponin for 1 h at room temperature. Cells were visualized and imaged using a Nikon C2 confocal microscope. For stress granule staining the BMDMs were transfected with GAG or incubated with 50 μM sodium (meta)arsenite (S7400, Sigma Aldrich) for 1 h or infected with A. fumigatus for 15 h before being fixed with 4% paraformaldehyde for 15 min. Then the cells were processed as described previously for DDX3-G3BP1 staining17. Antibodies used were anti-DDX3X (A300–474A, Bethyl Laboratories) and anti-G3BP1 (66486–1-Ig, Proteintech).
Scanning electron microscopy
Cells were grown in Brian medium at 30°C for 20 h on 1.2 mm coverslips coated with a carbon tap. Samples were fixed in 2.5% glutaraldehyde in 0.1 M Hepes buffer (pH 7.4) overnight at 4 °C, then washed for 5 min three times in 0.1 M Hepes buffer (pH 7.2), postfixed for 1 h in 1% osmium, and rinsed with distilled water. Cells were dehydrated through a graded ethanol series followed by critical point drying with CO2. Dried specimens were gold/palladium sputter-coated with a gun ionic evaporator PEC 682. The samples were imaged in a JEOL JSM 6700F field emission scanning electron microscope operating at 5 kV.
Statistical analysis
GraphPad Prism 8.0 was used for data analysis. Data are represented as mean ± standard error of the mean. P < 0.05 was considered statistically significant.
Extended Data
Extended Data Fig. 1. Identification of A. fumigatus GAG synthase.
a, Schematic of GAG synthase cluster. b, RNAseq analysis during A. fumigatus growth (0, 4 and 8 h) from Mouyna et al.46; gene expressions are represented by mean of normalized read count/gene for the GT4C cluster (n = 3 biologically independent samples). Data are mean +/− SEM. c, Heatmap showing differential gene expression of A. fumigatus at 4 h (swollen conidia) and 8 h (germinated conidia) compared to 0 h (resting conidia). d, Schematic representation of the GT4C protein with transmembrane regions (black), α-glycosyltransferase domains (green) and major facilitator superfamily domain (MFS) predicted from amino acid sequence with InterProscan 5. e, Schematic representation of wild type (WT) and Δgt4c locus with NcoI restriction sites and Southern blot probe used to control the GT4C gene deletion. f, Southern blot using GT4C probe with WT and Δgt4c purified DNA from one experiment. g, Real-time quantitative RT-PCR analysis of GT4C, AGD3, EGA3, SPH3 and UGE3 A. fumigatus genes in wild type (WT) and Δgt4c strains (8 h in LB medium, 37°C and 250 rpm) presented relative to that of the gene encoding A. fumigatus TEF1. n.d., not detected (n = 3 biologically independent samples). Data are mean +/− SEM.
Extended Data Fig. 2. Absence of GAG does not affect release of non-inflammasome dependent cytokines.
Release of (a) IL-6 and (b) TNF from unprimed bone marrow-derived macrophages (BMDMs) left uninfected (Med) or assessed 20 h after infection with A. fumigatus wild type (WT) or Δgt4c strain (multiplicity of infection, 10), (n = 3 independent biological samples). Data are mean +/− SEM.
Extended Data Fig. 3. UGE3 potentiates A. fumigatus-induced inflammasome activation.
a, Assessment of biofilm formation on an abiotic surface with A. fumigatus (A. f) wild type (WT) and deletion mutant strain Δuge3. b, Immunoblot analysis of pro-caspase-1 (pro-Casp1; p45) and the active caspase-1 subunit (p20) from unprimed bone marrow-derived macrophages (BMDMs) left untreated (medium alone [Med]) or measured 20 h after infection with the indicated A.f live resting conidia (multiplicity of infection [MOI], 10). Representative images (n ≥ 3 independent experiments). c, Immunoblot analysis of phospho- and total-IκBα (p-IκBα, t-IκBα) or phospho- and total-ERK1/2 (p-ERK, t-ERK) from unprimed WT BMDMs 0–8 h after infection with WT or Δuge3 mutant A.f live resting conidia (MOI, 10). Representative images (n ≥ 3 independent experiments). d, Immunoblot analysis of pro–IL-1β from unprimed BMDMs 0–8 h after infection with WT or Δuge3 mutant A.f live resting conidia (MOI, 10). Representative images (n ≥ 3 independent experiments). e–g, Real-time quantitative RT-PCR analysis of Nlrp3, Il1β and Tnf genes from WT BMDMs 0–8 h after infection with WT or Δuge3 mutant A. f live resting conidia presented relative to that of the gene encoding β-actin (n = 4 biologically independent samples). Data are mean +/− SEM.
Extended Data Fig. 4. Over-synthesis of GAG induces hyper-inflammasome activation.
a, Immunofluorescence staining of A. fumigatus (A.f) GAG (green) and bone marrow-derived macrophage (BMDM) nuclei (blue) in unprimed BMDMs 4 h after infection with A. fumigatus (A. f) wild type (WT) or Δugm1 resting conidia (multiplicity of infection [MOI], 10). Scale bars, 10 μm. Representative images (n ≥ 3 independent experiments). b, Immunoblot analysis of pro–caspase-1 (pro-Casp1; p45) and the active caspase-1 subunit (p20) of unprimed BMDMs left untreated (medium alone [Med]) or assessed 20 h after infection with the indicated live A. f resting conidia genotype (WT or A. f deletion mutant Δugm1) (MOI, 10). Representative images (n ≥ 3 independent experiments). c, Release of IL-1β from unprimed BMDMs left uninfected (Med) or assessed 20 h after infection with A. f (MOI, 10). **P = 0.0046 (unpaired two-tailed t-test). (n = 4 biologically independent samples). Data are mean +/− SEM.
Extended Data Fig. 5. GAG induces caspase-1 cleavage in a dose- and charge-charge interaction-dependent manner and interacts with ribosomes.
a, Representative images of bone marrow-derived macrophages (BMDMs) in medium (Med) or during treatment with DOTAP alone (green fluorescence corresponds to Sytox green nuclei, and Sytox green-positive nuclei are marked with a red circle). Scale bars, 10 μm. Representative images (n ≥ 3 independent experiments). b, Immunoblot analysis of pro–caspase-1 (pro-Casp1; p45) and the active caspase-1 subunit (p20) of BMDMs left untreated (medium alone [Med]) or assessed 3 h after transfection with increasing concentrations of GAG or vehicle alone (DOTAP). Representative images (n ≥ 3 independent experiments). c, Immunoblot analysis of caspase-1 during transfection with GAG in wild type (WT) and Gsdmd−/− BMDMs. Representative images (n ≥ 3 independent experiments). d, Volcano plot of the polysaccharide pull down mass spectrometry analysis of the β-glucan interactome with BMDM cytosolic proteins versus control. Proteins with P value < 0.005 are orange highlighted and proteins with P value < 0.005 and log2(fold change) > 7 compared to control are red highlighted (none identified); P value was determined by the G-test and exact P values are presented in Supplemental Table 1. e, Immunoblot analysis of ribosomal proteins interacting with GAG, Ac-GAG, d-GAG or β-glucan or vehicle with or without NaCl. Representative images (n ≥ 3 independent experiments). f, Immunoblot analysis of caspase-1 from BMDMs assessed after 3 h incubation with GAG, Ac-GAG or d-GAG with or without NaCl. Representative images (n ≥ 3 independent experiments). g, h, Measurement of cell death by Sytox green staining during GAG and d-GAG treatment with or without NaCl (n = 3 biologically independent samples). Data are mean +/− SEM. i, Electron microscopy pictures of ribosomes, GAG + ribosomes and chitin + ribosomes with negative staining; data from one experiment. Scale bars, 100 nm.
Extended Data Fig. 6. GAG inhibits translation and induces endoplasmic stress.
a-c Immunoblot analysis of translation rate in bone marrow-derived macrophages (BMDMs) by puromycin integration into proteins during (a) vehicle (DOTAP) or PBS incubation, (b) poly(dA:dT) transfection or (c) A. fumigatus (A. f) infection and caspase-1 activation during A. f infection. Representative images (n ≥ 2 independent experiments). d, Polysome profiling during DOTAP or DOTAP + GAG treatments. e, Immunoblot analysis of the cell pellet after polysome profiling. Representative images (n ≥ 2 independent experiments). f, Polysome:monosome ratio during DOTAP or DOTAP + GAG treatments. Data are mean +/− SEM. *P = 0.0366 (paired two-tailed t-test) (n = 3 biologically independent samples). g−i, Immunoblot analysis of pro–caspase-1 (pro-Casp1; p45) and the active caspase-1 subunit (p20) of wild type (WT) or Nlrp3−/− BMDMs assessed after 16 h incubation with (g) 25 μg/mL anisomycin (Aniso), (h) 50 μg/mL puromycin (Puro) or (i) 50 μg/mL cycloheximide (CHX). Representative images (n ≥ 2 independent experiments). j,k, Immunoblot analysis of PERK activation (p-PERK) and IRE1α induction during (j) GAG transfection or (k) PERK activation during treatment with translation inhibitors. Representative images (n ≥ 2 independent experiments). l, Immunoblot analysis of proteins ubiquitinated during GAG transfection. Representative images (n ≥ 2 independent experiments). m, Immunoblot analysis of caspase-1 of BMDMs left untreated (medium alone [Med]) or assessed 3 h after transfection with GAG and treated with MG132. Representative images (n ≥ 2 independent experiments).
Extended Data Fig. 7. Stress granules are not induced by GAG.
a, Immunofluorescence staining of G3BP1 (green), DDX3X (red) and bone marrow-derived macrophage (BMDM) nuclei (blue) in unprimed BMDMs 40 min after transfection with GAG or incubation with arsenite (Ars). Representative images (n ≥ 2 independent experiments). b, Quantification of the percentage of stress granule-positive cells after transfection with GAG, vehicle (DOTAP) alone or Ars. (n > 10 biologically independent fields of cells). Data are mean +/− SEM. c, Immunofluorescence staining of G3BP1 (green), DDX3X (red) and BMDM nuclei (blue) in unprimed BMDMs 15 h after infection with A. fumigatus. Representative images (n ≥ 2 independent experiments). d,e, Immunoblot analysis of pro–caspase-1 (pro-Casp1; p45) and the active caspase-1 subunit (p20) of BMDMs assessed 3 h after transfection with vehicle (DOTAP), (d) GAG or (e) d-GAG. Representative images (n ≥ 2 independent experiments). f, Immunoblot analysis of caspase-1 from BMDMs left untreated (medium alone [Med]) or infected with A. fumigatus (A.f) WT or deletion mutant Δgt4c (multiplicity of infection [MOI], 10). Representative images (n ≥ 2 independent experiments). (a, c) Scale bars, 10 μm.
Extended Data Fig. 8. GAG-induced proinflammatory cytokine secretion during aspergillosis and DSS-induced colitis.
a,b, Level of IL-1β (a) and IL-18 (b) in bronchioalveolar lavage 2 days after infection with wild type (WT) or Δugm1 strains of A. fumigatus. (a) *P = 0.036. Unpaired two-tailed t-test. (n = 6 independent samples). Data are mean +/− SEM. c, Survival of 7- to 8-week-old immunocompetent WT mice infected intravenously with 1 × 10⁶ A. fumigatus resting conidia (WT or Δugm1). **P = 0.0014. Log-rank (Mantel-Cox) test. d, e Level of IL-1β (d) and IL-18 (e) in liver homogenates after infection with WT or Δgt4c strains. (d) *P = 0.0209; (e) **P = 0.0041. Unpaired two-tailed t-test. (n = 5 independent samples). Data are mean +/− SEM. f–k, Concentration of cytokines in colon homogenates after dextran sulfate sodium (DSS) water supplementation and treatment with GAG or vehicle (Vehicle and GAG, n = 10 each). (f) *P = 0.0336; (g) *P = 0.0181; (h) *P = 0.0188; (i) *P = 0.0115; (j) **P = 0.0066; (k) *P = 0.0154. Unpaired two-tailed t-test. n.d., not detected. Data are mean +/− SEM.
Extended Data Table 1.
Primer list.
 |
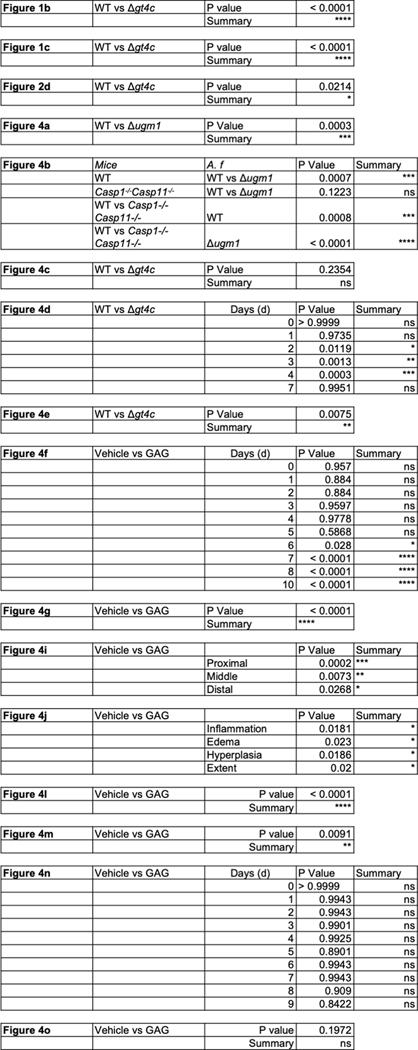
Extended Data Table 2.
 |
Supplementary Material
Acknowledgements
We thank members of the Kanneganti lab for their comments and suggestions, R. Tweedell for scientific editing of the manuscript, the St. Jude Children’s Hospital Veterinary Pathology Core, SJCRH Center for Proteomics and Metabolomics and SJCRH Cell & Tissue Imaging Center. We also thank Dr. Sheppard for sharing the A. fumigatus deletion mutant Δagd3 and V.M. Dixit and N. Kayagaki (Genentech) for the Casp1−/−Casp11−/− mutant mouse strain.
Funding
T-D.K. is supported by NIH grants AI101935, AI124346, AR056296 and CA253095 and by the American Lebanese Syrian Associated Charities. The content is solely the responsibility of the authors and does not necessarily represent the official views of the National Institutes of Health. J.-P.L. is supported by the Aviesan project Aspergillus, the French Government’s Investissement d’Avenir program, Laboratoire d’Excellence “Integrative Biology of Emerging Infectious Diseases” (grant n°ANR-10-LABX-62-IBEID), la Fondation pour la Recherche Médicale (DEQ20150331722 LATGE Equipe FRM 2015).
Footnotes
AUTHOR INFORMATION
Reprints and permissions information is available at www.nature.com/reprints.
The authors declare no competing financial interests.
Data availability
The datasets generated and analyzed during the current study are contained within the manuscript and accompanying extended data figures.
References
- 1.Man SM, Karki R & Kanneganti TD Molecular mechanisms and functions of pyroptosis, inflammatory caspases and inflammasomes in infectious diseases. Immunol Rev 277, 61–75, doi: 10.1111/imr.12534 (2017). [DOI] [PMC free article] [PubMed] [Google Scholar]
- 2.Briard B et al. Fungal ligands released by innate immune effectors promote inflammasome activation during Aspergillus fumigatus infection. Nat Microbiol 4, 316–327, doi: 10.1038/s41564-018-0298-0 (2019). [DOI] [PMC free article] [PubMed] [Google Scholar]
- 3.Karki R et al. Concerted Activation of the AIM2 and NLRP3 Inflammasomes Orchestrates Host Protection against Aspergillus Infection. Cell Host Microbe 17, 357–368, doi: 10.1016/j.chom.2015.01.006 (2015). [DOI] [PMC free article] [PubMed] [Google Scholar]
- 4.Said-Sadier N, Padilla E, Langsley G & Ojcius DM Aspergillus fumigatus stimulates the NLRP3 inflammasome through a pathway requiring ROS production and the Syk tyrosine kinase. PLoS One 5, e10008, doi: 10.1371/journal.pone.0010008 (2010). [DOI] [PMC free article] [PubMed] [Google Scholar]
- 5.Latgé JP, Beauvais A & Chamilos G. The Cell Wall of the Human Fungal Pathogen Aspergillus fumigatus: Biosynthesis, Organization, Immune Response, and Virulence. Annu Rev Microbiol 71, 99–116, doi: 10.1146/annurev-micro-030117-020406 (2017). [DOI] [PubMed] [Google Scholar]
- 6.Fontaine T et al. Galactosaminogalactan, a new immunosuppressive polysaccharide of Aspergillus fumigatus. PLoS Pathog 7, e1002372, doi: 10.1371/journal.ppat.1002372 (2011). [DOI] [PMC free article] [PubMed] [Google Scholar]
- 7.Gravelat FN et al. Aspergillus galactosaminogalactan mediates adherence to host constituents and conceals hyphal β-glucan from the immune system. PLoS Pathog 9, e1003575, doi: 10.1371/journal.ppat.1003575 (2013). [DOI] [PMC free article] [PubMed] [Google Scholar]
- 8.Hua KF et al. Capsular Polysaccharide Is Involved in NLRP3 Inflammasome Activation by Klebsiella pneumoniae Serotype K1. Infect Immun 83, 3396–3409, doi: 10.1128/iai.00125-15 (2015). [DOI] [PMC free article] [PubMed] [Google Scholar]
- 9.Wolf AJ et al. Hexokinase Is an Innate Immune Receptor for the Detection of Bacterial Peptidoglycan. Cell 166, 624–636, doi: 10.1016/j.cell.2016.05.076 (2016). [DOI] [PMC free article] [PubMed] [Google Scholar]
- 10.Briard B, Muszkieta L, Latgé JP & Fontaine T. Galactosaminogalactan of Aspergillus fumigatus, a bioactive fungal polymer. Mycologia 108, 572–580, doi: 10.3852/15-312 (2016). [DOI] [PubMed] [Google Scholar]
- 11.Lee MJ et al. Deacetylation of Fungal Exopolysaccharide Mediates Adhesion and Biofilm Formation. mBio 7, e00252–00216, doi: 10.1128/mBio.00252-16 (2016). [DOI] [PMC free article] [PubMed] [Google Scholar]
- 12.Tzianabos AO Polysaccharide immunomodulators as therapeutic agents: structural aspects and biologic function. Clin Microbiol Rev 13, 523–533, doi: 10.1128/cmr.13.4.523-533.2000 (2000). [DOI] [PMC free article] [PubMed] [Google Scholar]
- 13.Zhou X, Liao WJ, Liao JM, Liao P & Lu H. Ribosomal proteins: functions beyond the ribosome. J Mol Cell Biol 7, 92–104, doi: 10.1093/jmcb/mjv014 (2015). [DOI] [PMC free article] [PubMed] [Google Scholar]
- 14.Vyleta ML, Wong J & Magun BE Suppression of ribosomal function triggers innate immune signaling through activation of the NLRP3 inflammasome. PLoS One 7, e36044, doi: 10.1371/journal.pone.0036044 (2012). [DOI] [PMC free article] [PubMed] [Google Scholar]
- 15.Bronner DN et al. Endoplasmic Reticulum Stress Activates the Inflammasome via NLRP3- and Caspase-2-Driven Mitochondrial Damage. Immunity 43, 451–462, doi: 10.1016/j.immuni.2015.08.008 (2015). [DOI] [PMC free article] [PubMed] [Google Scholar]
- 16.Hetz C. The unfolded protein response: controlling cell fate decisions under ER stress and beyond. Nature reviews. Molecular cell biology 13, 89–102, doi: 10.1038/nrm3270 (2012). [DOI] [PubMed] [Google Scholar]
- 17.Samir P et al. DDX3X acts as a live-or-die checkpoint in stressed cells by regulating NLRP3 inflammasome. Nature 573, 590–594, doi: 10.1038/s41586-019-1551-2 (2019). [DOI] [PMC free article] [PubMed] [Google Scholar]
- 18.Man SM et al. Differential roles of caspase-1 and caspase-11 in infection and inflammation. Sci Rep 7, 45126, doi: 10.1038/srep45126 (2017). [DOI] [PMC free article] [PubMed] [Google Scholar]
- 19.Dupaul-Chicoine J et al. Control of intestinal homeostasis, colitis, and colitis-associated colorectal cancer by the inflammatory caspases. Immunity 32, 367–378, doi: 10.1016/j.immuni.2010.02.012 (2010). [DOI] [PubMed] [Google Scholar]
- 20.Zaki MH et al. The NLRP3 inflammasome protects against loss of epithelial integrity and mortality during experimental colitis. Immunity 32, 379–391, doi: 10.1016/j.immuni.2010.03.003 (2010). [DOI] [PMC free article] [PubMed] [Google Scholar]
- 21.Chadani Y et al. Intrinsic Ribosome Destabilization Underlies Translation and Provides an Organism with a Strategy of Environmental Sensing. Mol Cell 68, 528–539.e525, doi: 10.1016/j.molcel.2017.10.020 (2017). [DOI] [PubMed] [Google Scholar]
- 22.van der Horst S, Filipovska T, Hanson J & Smeekens S. Metabolite Control of Translation by Conserved Peptide uORFs: The Ribosome as a Metabolite Multisensor. Plant Physiol 182, 110–122, doi: 10.1104/pp.19.00940 (2020). [DOI] [PMC free article] [PubMed] [Google Scholar]
- 23.Menu P et al. ER stress activates the NLRP3 inflammasome via an UPR-independent pathway. Cell Death Dis 3, e261, doi: 10.1038/cddis.2011.132 (2012). [DOI] [PMC free article] [PubMed] [Google Scholar]
- 24.Chen J & Chen ZJ PtdIns4P on dispersed trans-Golgi network mediates NLRP3 inflammasome activation. Nature 564, 71–76, doi: 10.1038/s41586-018-0761-3 (2018). [DOI] [PMC free article] [PubMed] [Google Scholar]
- 25.Muñoz-Planillo R et al. K⁺ efflux is the common trigger of NLRP3 inflammasome activation by bacterial toxins and particulate matter. Immunity 38, 1142–1153, doi: 10.1016/j.immuni.2013.05.016 (2013). [DOI] [PMC free article] [PubMed] [Google Scholar]
- 26.Topf U et al. Quantitative proteomics identifies redox switches for global translation modulation by mitochondrially produced reactive oxygen species. Nat Commun 9, 324, doi: 10.1038/s41467-017-02694-8 (2018). [DOI] [PMC free article] [PubMed] [Google Scholar]
- 27.Willi J et al. Oxidative stress damages rRNA inside the ribosome and differentially affects the catalytic center. Nucleic Acids Res 46, 1945–1957, doi: 10.1093/nar/gkx1308 (2018). [DOI] [PMC free article] [PubMed] [Google Scholar]
- 28.Lamarre C et al. Galactofuranose attenuates cellular adhesion of Aspergillus fumigatus. Cell Microbiol 11, 1612–1623, doi: 10.1111/j.1462-5822.2009.01352.x (2009). [DOI] [PubMed] [Google Scholar]
- 29.da Silva Ferreira ME et al. The akuB(KU80) mutant deficient for nonhomologous end joining is a powerful tool for analyzing pathogenicity in Aspergillus fumigatus. Eukaryot Cell 5, 207–211, doi: 10.1128/EC.5.1.207-211.2006 (2006). [DOI] [PMC free article] [PubMed] [Google Scholar]
- 30.Kayagaki N et al. Non-canonical inflammasome activation targets caspase-11. Nature 479, 117–121, doi: 10.1038/nature10558 (2011). [DOI] [PubMed] [Google Scholar]
- 31.Kanneganti TD et al. Bacterial RNA and small antiviral compounds activate caspase-1 through cryopyrin/Nalp3. Nature 440, 233–236, doi: 10.1038/nature04517 (2006). [DOI] [PubMed] [Google Scholar]
- 32.Jones JW et al. Absent in melanoma 2 is required for innate immune recognition of Francisella tularensis. Proc Natl Acad Sci U S A 107, 9771–9776, doi: 10.1073/pnas.1003738107 (2010). [DOI] [PMC free article] [PubMed] [Google Scholar]
- 33.Karki R et al. IRF8 Regulates Transcription of Naips for NLRC4 Inflammasome Activation. Cell 173, 920–933 e913, doi: 10.1016/j.cell.2018.02.055 (2018). [DOI] [PMC free article] [PubMed] [Google Scholar]
- 34.Hartmann T et al. Validation of a self-excising marker in the human pathogen Aspergillus fumigatus by employing the beta-rec/six site-specific recombination system. Appl Environ Microbiol 76, 6313–6317, doi: 10.1128/AEM.00882-10 (2010). [DOI] [PMC free article] [PubMed] [Google Scholar]
- 35.Briard B et al. Dirhamnolipids secreted from Pseudomonas aeruginosa modify anjpegungal susceptibility of Aspergillus fumigatus by inhibiting beta1,3 glucan synthase activity. ISME J 11, 1578–1591, doi: 10.1038/ismej.2017.32 (2017). [DOI] [PMC free article] [PubMed] [Google Scholar]
- 36.Muszkieta L et al. Deciphering the role of the chitin synthase families 1 and 2 in the in vivo and in vitro growth of Aspergillus fumigatus by multiple gene targeting deletion. Cell Microbiol 16, 1784–1805, doi: 10.1111/cmi.12326 (2014). [DOI] [PubMed] [Google Scholar]
- 37.Dubois M, Gilles K, Hamilton JK, Rebers PA & Smith F. A colorimetric method for the determination of sugars. Nature 168, 167, doi: 10.1038/168167a0 (1951). [DOI] [PubMed] [Google Scholar]
- 38.Stalhberger T et al. Chemical organization of the cell wall polysaccharide core of Malassezia restricta. J Biol Chem 289, 12647–12656, doi: 10.1074/jbc.M113.547034 (2014). [DOI] [PMC free article] [PubMed] [Google Scholar]
- 39.Plassard CS, Mousain DG & Salsac LE Estimation of mycelial growth of basidiomycetes by means of chitin determination. Phytochemistry 21, 345–348, doi: 10.1016/S0031-9422(00)95263-4 (1982). [DOI] [Google Scholar]
- 40.Fontaine T, Talmont F, Dutton GGS & Fournet B. Analysis of pyruvic acid acetal containing polysaccharides by methanolysis and reductive cleavage methods. Analytical Biochemistry 199, 154–161, doi: 10.1016/0003-2697(91)90083-6 (1991). [DOI] [PubMed] [Google Scholar]
- 41.Gressler M et al. Definition of the Anti-inflammatory Oligosaccharides Derived From the Galactosaminogalactan (GAG) From Aspergillus fumigatus. Front Cell Infect Microbiol 9, 365, doi: 10.3389/fcimb.2019.00365 (2019). [DOI] [PMC free article] [PubMed] [Google Scholar]
- 42.Samir P et al. Identification of Changing Ribosome Protein Compositions using Mass Spectrometry. Proteomics 18, e1800217, doi: 10.1002/pmic.201800217 (2018). [DOI] [PMC free article] [PubMed] [Google Scholar]
- 43.Werner JL et al. Requisite role for the dectin-1 beta-glucan receptor in pulmonary defense against Aspergillus fumigatus. J Immunol 182, 4938–4946, doi: 10.4049/jimmunol.0804250 (2009). [DOI] [PMC free article] [PubMed] [Google Scholar]
- 44.Gresnigt MS et al. A polysaccharide virulence factor from Aspergillus fumigatus elicits anti-inflammatory effects through induction of Interleukin-1 receptor antagonist. PLoS Pathog 10, e1003936, doi: 10.1371/journal.ppat.1003936 (2014). [DOI] [PMC free article] [PubMed] [Google Scholar]
- 45.Schindelin J et al. Fiji: an open-source platform for biological-image analysis. Nat Methods 9, 676–682, doi: 10.1038/nmeth.2019 (2012). [DOI] [PMC free article] [PubMed] [Google Scholar]
- 46.Mouyna I et al. GH16 and GH81 family β-(1,3)-glucanases in Aspergillus fumigatus are essential for conidial cell wall morphogenesis. Cell. Microbiol. 18, 1285–1293. [DOI] [PubMed] [Google Scholar]
Associated Data
This section collects any data citations, data availability statements, or supplementary materials included in this article.


