Abstract
Ultrasound shear wave elastography (SWE) is a technique used to measure mechanical properties to evaluate healthy and pathological soft tissues. SWE typically employs an acoustic radiation force (ARF) to generate laterally propagating shear waves that are tracked in the spatiotemporal domains, and algorithms are used to estimate the wave velocity. The tissue viscoelasticity is often examined through analyzing the shear wave phase velocity dispersion curves, which is the variation of phase velocity with frequency or wavelength. A number of available methods to estimate dispersion exist, which can differ in resolution and variance. Moreover, most of these techniques reconstruct dispersion curves for a limited frequency band. In this work, we propose a novel method used for dispersion curve calculation. Our unique approach uses a generalized Stockwell transformation combined with a slant frequency-wavenumber analysis (GST-SFK). We tested the GST-SFK method on numerical phantom data generated using a finite-difference-based method in tissue-mimicking viscoelastic media. In addition, we evaluated the method on numerical shear wave motion data with different amounts of white Gaussian noise added. Additionally, we performed tests on data from custom-made tissue-mimicking viscoelastic phantom experiments, ex vivo porcine liver measurements, and in vivo liver tissue experiments. We compared results from our method with two other techniques used for estimating shear wave phase velocity: the two-dimensional Fourier transform (2D-FT) and the eigenvector (EV) method. Tests carried out revealed that the GST-SFK method provides dispersion curve estimates with lower errors over a wider frequency band in comparison to the 2D-FT and EV methods. In addition, the GST-SFK provides expanded bandwidth by a factor of two or more to be used for phase velocity estimation, which is meaningful for a tissue dispersion analysis in vivo.
Index Terms—: Shear wave elastography (SWE), ultrasound, acoustic radiation force (ARF), dispersion, soft tissue, liver, phantom, viscoelastic, Kelvin-Voigt, Stockwell transform, ex vivo, in vivo
I. Introduction
Ultrasound shear wave elastography (SWE) has been used in numerous clinical applications in order to make noninvasive, quantitative measurements of different mechanical properties in soft tissues [1]. Among the many ultrasound-based elastography methods are those that utilize acoustic radiation force (ARF) [2]. After the ARF is applied, a propagating shear wave results from the medium perturbation [3]. For estimation of the shear wave motion, ultrafast ultrasound imaging techniques are then applied for data recording [4]. Next, shear wave velocity is estimated, which is related to the mechanical properties of the tissue, using various techniques.
Many SWE approaches consider tissue to be strictly elastic while ignoring viscous properties. It has been shown that ignoring tissue viscosity results in elasticity measurement bias [5], [6]. One characteristic of viscoelastic materials is that the shear wave phase velocity varies with frequency, which is named dispersion. Viscoelastic properties of tissues can be estimated by fitting the shear wave dispersion curves to a rheological model [7]–[9]. They can also be evaluated using data driven techniques [10]–[14].
Shear wave phase velocity dispersion has been measured in many different applications [7], [8], [15]–[18]. Measurement of the phase velocity dispersion curve has commonly been carried out with either a phase gradient [19] or a two-dimensional Fourier transform (2D-FT) [20]. Other approaches used for shear wave phase velocity calculation is a Radon sum method, a multiple-signal classification (MUSIC) approach and a two-point continuous wavelet transform (2P-CWT) [17], [21], [22]. However, with these shear wave phase velocity measurement methods, the main drawback is the resulting frequency bandwidth. Differentiation of viscoelastic tissues can be accomplished when higher frequencies can be used, so maximization of the bandwidth for computing the dispersion curves is essential.
The 2D-FT methods which transform spatiotemporal data (x, t) to wavenumber-frequency (k, f) domain have been used to measure the dispersion. The peaks of the magnitude distribution of the (k, f) spectrum is used to measure the phase velocities using the relationship c = 2πf/k. Estimated dispersion curves either from the phase gradient, 2D-FT or other technique can be fit to rheological models to evaluate the viscoelastic parameters of the medium [8], [9], [17], [19].
In this work, we propose a novel method used for shear wave dispersion curves calculation applicable in viscoelastic tissues. The unique approach used in this method considers a generalized form of the Stockwell transform (S-transform) [23] along with the slant wavenumber-frequency analysis [24]. The proposed technique is an extension of a method described in [24]. The authors used the original form of the S-transform whereas, we applied a modified version of the S-transform for controlling the time-frequency resolution of a time-frequency decomposition of a signal. The S-transform has been used in many disciplines including medicine [25], [26], geophysics [27], [28], oceanography [29], hydrogeology [30], physics [31], and mechanical engineering [32], among others. In this paper we adopt this theory for shear wave phase velocity dispersion curve estimation for biomedical applications.
The rest of the paper is structured as follows. First, we present a generalized Stockwell transformation combined with a slant frequency-wavenumber analysis (GST-SFK) method used for shear wave phase velocity estimation. The GST-SFK method is provided as an alternative to the 2D-FT and eigenvector (EV) methods to calculate the phase velocity dispersion curve. This approach was studied using shear wave particle velocity data from numerical simulations of shear wave propagation in viscoelastic media. The robustness of the GST-SFK approach was examined by adding white Gaussian noise to these data. In addition, we utilized the method on experimental data from custom-made tissue-mimicking (TM) viscoelastic elastography phantoms, ex vivo porcine livers, and in vivo liver studies from six healthy subjects. Results from these numerical and physical phantoms and human subjects will be shown. Discussion and conclusions follow presentation of the results.
II. Methods
In this section, the 2D-FT and EV methods are recalled for dispersion curves calculation. They are used for comparison purposes in this work. Then, the GST-SFK method is developed and a theoretical background of the method is introduced in the following section. Main steps of the approach are also displayed in a flow chart in Fig. 1. The resolution capabilities of GST-SFK are tested with the numerical viscoelastic models, and experimentally using the CIRS viscoelastic tissue-mimicking phantoms, ex vivo porcine and in vivo human subject liver data, respectively.
Fig. 1:

Flow chart of the proposed GST-SFK method introduced in this study. Major steps of the GST-SFK can be outlined as follow: (I) acquire a 2D shear wave particle velocity motion data (x, t) at the ARF focal depth; (II) transform 2D spatiotemporal data into 3D time-frequency-space domain (t, f, x) using Eq. (5); (III) calculate P function and its amplitude using Eqs. (7)–(8); (IV) search for a maximum amplitude of Λ(u, f, k) over all steering group velocities, u, to obtain the frequency-wavenumber pairs K(f, k), using Eq. (9). Next, calculate the dispersion curves utilizing K(f, k) and using the formula c(f) = f/k.
A. Two-dimensional Fourier Transform (2D-FT) Method
The frequency-wavenumber (f–k) domain distribution of ultrasound shear wave axial particle velocity motion data measured at different lateral locations was processed in a way that a two-dimensional Fourier transform (2D-FT) was performed in temporal and spatial domains to create the frequency-wavenumber distribution. Next, phase velocity curves were computed from finding the peaks in the f–k distribution. From the 2D f–k maps peaks were detected for each frequency. In order to extract the main shear wave mode from the detected peaks, the peaks corresponding to the shear wave mode were tracked by searching for the nearest value. The coordinates of the localized peaks were used to calculate the phase velocity as c = 2πf/k. No thresholding was used.
B. The Eigenvector (EV) Method
The Eigenvector (EV) approach is strongly associated with the MUSIC method [21], [33], [34]. It ensures asymptotically unbiased estimates of a general set of signal parameters. The EV approach, same as MUSIC, is based on the orthogonality between signal and noise subspaces spanned by the eigenvectors of the correlation matrix. Using the noise subspace eigenvectors (M–p) the power spectrum of a signal can be computed through the following equation
| (1) |
where, ē is the vector of complex exponentials ejω, and λi is the eigenvalue associated with the eigenvector . The superscript H indicates the Hermitian operator. The eigenvectors coincide with the M − p smallest eigenvalues that span the noise subspace. M is the size of the autocorrelation matrix, and p is a number of complex exponentials in white noise [21], [34]–[37]. The EV method and the MUSIC algorithm are distinct in a way that MUSIC uses unity weighting whereas, EV applies inverse eigenvalues. Hence, the MUSIC algorithm yields more spurious peaks than the EV method. EV is considered to shape the noise spectrum better than MUSIC [33]. The constant p = 1 was selected in our studies because one propagating shear wave mode is expected to be found in the examined bulk media [34]. The parameter M = 128 was selected based on our preliminary analysis in [34], where the influence of the autocorrelation matrix size on the dispersion curves calculation was examined.
C. Slant Frequency Wavenumber Generalized S-transform Method (GST-SFK)
1). A Generalized S-transform:
The Stockwell transform, referred to as the S-transform, was developed as a time-frequency decomposition method [23]. The S-transform produces a time-frequency decomposition of a signal with a frequency-dependent Gaussian window used for spectral localization [23]. The Gaussian window width scales inversely, and height scales linearly, with the frequency controlling the time-frequency resolution. The S-transform, in its original form, is given as [23]
| (2) |
where S denotes the time-frequency S-transform of time variable h(t) signal, where f is a frequency and τ is a parameter which controls the position of the Gaussian window on the time vector, t.
Many modifications to the original form of the S-transform have been proposed in order to improve its robustness [38]–[43]. In our work we used the generalized S-transform to manipulate the time-frequency resolution [38], [40]. The Gaussian window is replaced with a generalized window in a form
| (3) |
where, w is the scaled Gaussian window given as
| (4) |
where, β is a scaling factor. After substituting Eq. (4) into Eq. (3) the generalized S-transform becomes
| (5) |
The scaling factor β changes the width of the window and controls the time-frequency resolution by altering the number of oscillations in the window [40]. A narrower window in the time domain widens in the frequency domain, losing S-transform resolution in the frequency. For larger β values, the Gaussian window is widened in the time domain increasing the frequency resolution [40]. Based on trial analysis a value of β = 0.5 was used in this work.
2). Slant Frequency-Wavenumber Analysis:
A shear wave wavefield h(x, t) can be transformed using the generalized S-transform to the time-frequency domain [40]. For a selected frequency range, a series of 2D complex-valued functions of the time and distance can be obtained, which can be written as [24]
| (6) |
By taking slant slices of the H(x, τ) function, for a selected frequency f, and steering group velocity u = x/τ, and the constant time, the one-dimensional complex-valued, slant-phase function (P), can be considered in a form [24]
| (7) |
The P function is computed for a series of steering group velocity values um, for a maximum distance, xm, and a maximum time, tm, of the recorded shear wave motion data. Δt is the time sampling rate. Then, the amplitude of the P function is computed as [24]
| (8) |
which is a three-dimensional spectral amplitude distribution with the coordinates of the steering group velocity, frequency, and wavenumber. The spectral amplitude peaks of the P correspond to distribution of the wavenumbers of elastic waves, which travel away from the source [24]. To obtain the dispersion curves, a maximum amplitude of Λ(u, f, k) over all steering group velocities is considered, which can be written as [24]
| (9) |
The peaks of K(f, k) for an impulsive ARF push are related to the phase velocities of different wave propagation modes [22]. Phase velocity curves were computed from finding the peaks in the K(f, k) distribution. These peaks were found at each frequency, f by searching in an orthogonal direction along the k direction. Then, the phase velocity mode curves for the main shear wave mode were localized in a similar way as for the 2D-FT method described in Sec. II-A.
III. Materials
In this section descriptions of the numerical, TM viscoelastic phantoms, the experimental custom-made TM phantoms, the ex vivo porcine liver data, and the in vivo human liver data are introduced.
A. Numerical Phantoms Description
Finite-difference-based modeling was used to create numerical phantoms of viscoelastic materials with known mechanical properties. A finite difference staggered grid (SGFD) scheme was implemented and used to generate particle velocity shear wave motion data [44]. In the SGFD scheme, the velocity-stress first-order hyperbolic system of equations is applied. In order to mitigate undesired reflections from model boundaries, the complex-frequency shifted perfectly matched layer based on recursive integration was applied [45]. The FOCUS software package was used to simulate the acoustic radiation force push beam [46]–[48]. A linear array was simulated with element width, kerf, height, and elevation focus of 0.283, 0.035, 7.000, and 25 mm, respectively. A center frequency of 4.0 MHz was used and 32 elements were active for the push beam. The medium had an attenuation, α, of 0.5 dB/cm/MHz and sound velocity, c, of 1540 m/s. The intensity of the ARF used in the body force, F = 2αI/c, was computed as I = 〈p〉2 /ρc where, p is the pressure. The push beams were focused at a focal depth of 20 mm, with a fixed f-number (F/N) of 2.21. The focal configuration of the transmitted excitation beam can be tailored by changing the f-number. The F/N dictates the depth of field and beam width which can be written as F/N = z/D, where z is the focal depth and D is the aperture width.
The simulations were evaluated in MATLAB (Mathworks, Natick, MA, USA). In order to reduce the solution time, the CUDA parallel computing platform (Nvidia, Santa Clara, CA, United States) was used for calculations. The spatial domains of the numerical models were uniformly sampled at 0.1 mm. The cells were considered to be adequately small for a good approximation to realistic tissue-mimicking media. The simulated domain dimensions are, in the lateral direction, x = ±60 mm, and in the axial dimension, z = 0–60 mm. We applied the Kelvin-Voigt (KV) material model with a constant μ2 of 2 Pa·s, and varying μ1 = 2 kPa (Model 1), 6 kPa (Model 2), and 10 kPa (Model 3), respectively. Poisson’s ratio was 0.499999(7), ensuring a compressional wave speed of 1500 m/s. In our models we set a CFL number (the Courant-Friedrichs-Lewy condition) to be a constant value (CFL = 0.45), and the time step was calculated from the CFL condition. The CFL condition, in its simplest form, can be described as CFL where, Δt is the time step, Δx is the spatial discretization step, and Vmax is the maximum wave velocity present in the model. For the incompressible bulk materials Vmax is equal to the compressional wave speed.
For the numerical simulations we employed the KV rheological viscoelastic model because it has been demonstrated in many research works that the KV model depicts shear wave phase velocity dispersion over certain frequency ranges [7], [9], [16], [49]–[52]. The KV model consists of two parameters, a dashpot, μ2, and a spring, μ1, placed in parallel. The KV model stress-strain relationship is delineated in the form
| (10) |
where, the stress tensor, σ, is related to the strain tensor, ε, by the shear elasticity μ1, the shear viscosity μ2, and the time derivative, . The shear wave phase velocity of the KV model, by solving the one-dimensional Helmholtz equation, can be computed as [9]
| (11) |
where, ω is an angular frequency, ω = 2πf. The reference shear wave phase velocity dispersion curves for the KV model, used in the following part of the article, were calculated using Eq. (11).
B. Tissue-Mimicking Viscoelastic Phantoms Description
In our experiments custom-made tissue-mimicking viscoelastic phantoms (CIRS Inc., Norfolk, VA, USA) - similar to those employed in [9], [14], [22], [53] - were utilized in this work to examine reliability of the GST-SFK method used for shear wave phase velocity curves evaluation. The reference dispersion curves of these phantoms are unknown. A programmable ultrasound system manufactured by Verasonics (V1, Verasonics, Inc., Kirkland, WA) was utilized for data acquisition. The ARF push beams were generated by a linear array transducer (L7–4, Philips Healthcare, Andover, MA) and were focused at 21.56 mm. The ARF push beam with 400 μs duration and a 4.09 MHz frequency was used. The push beam was produced by the leftmost 48 active elements of the L7–4 probe. Angularly directed plane waves, coherently compounded using three angles of −4°, 0°, and +4°, were used for a plane wave acquisition giving the effective frame rate of 4.1667 kHz [4]. The in-phase/quadrature (IQ) data were used to calculate the shear wave particle velocity adopting an autocorrelation algorithm [54]. Then, the motion data (particle velocity waveforms) were averaged over 5 mm in axial direction at focal depth and the DC component was subtracted from the waveforms.
C. Ex vivo Porcine Liver Data Description
Shear wave data from three ex vivo porcine livers - similar to those used in [22] - were also used to investigate the robustness of the GST-SFK method. The liver samples were acquired from pigs after euthanasia. The pigs were dedicated for medical education or cardiovascular research on protocols approved by the Mayo Clinic Institutional Animal Care and Use Committee. Acquisition parameters and data processing steps were the same as for the TM viscoelastic phantoms, described in Sec. III-B. Again, three angularly directed plane waves were used however, using angles of −3°, 0° and +3°. The ARF push beam was focused at 25 mm. The motion data were averaged over 3 mm in axial direction and the DC component was removed from the data.
D. In vivo Human Liver Data Description
For the in vivo liver tests shear wave measurements were conducted on six human subjects, who self-reported no history of liver disease. The liver imaging and measurements were carried out under a protocol approved by the Mayo Clinic Institutional Review Board. Written informed consent was obtained prior to scanning. The examinations were carried out by an experienced sonographer. During the tests, the ultrasound probe was positioned at the eighth intercostal space while holding breath by the human subject. Data acquisition was performed using a Vantage ultrasound system equipped with a C5–2v curved array transducer (Verasonics, Inc., Kirkland, WA, USA). The ARF push beams were focused in the center of the probe with the push frequency of 2 MHz and an f/9.9 focal configuration at depth of 50 mm. As in the previous experiments described in Secs. III-B and III-C, coherently compounded plane waves were utilized. Two angles of −1° and +1° were used resulting in the effective frame rate of 2.77 kHz. The motion data was processed in the same way as for the TM phantoms.
IV. Results
A. Numerical Phantoms
Shear wave particle velocity data for the numerical viscoelastic phantoms were examined with added white Gaussian noise. Fig. 2 shows shear wave spatiotemporal data measured at a focal depth of 20 mm, with added white Gaussian noise with a SNR of 13 dB, as an example. The results are displayed for three different KV viscoelastic models with varying shear modulus (μ1) of 2, 6, and 10 kPa, and a constant viscosity (μ2) of 2 Pa·s. Models are considered as more viscoelastic with higher ratio.
Fig. 2:

Spatiotemporal shear wave particle velocity signal. Results were computed for the numerical, tissue mimicking viscoelastic phantoms with a SNR of 13 dB.
Figure 3 presents two-dimensional shear wave phase velocity dispersion curves calculated using the 2D-FT and GST-SFK methods. The results were computed for the shear wave motion data demonstrated in Fig. 2. The phase velocity maps have superimposed markers which correspond to the maximum peaks of the phase velocity. The magnitude distribution of the phase velocity maps can be compared between the 2D-FT and GST-SFK approaches. For higher frequencies, e.g. 500–1000 Hz, the magnitude of the two-dimensional maps used to estimate the dispersion curves is higher for the GST-SFK method compared to the 2D-FT. Similar maps for the EV method were not shown because the EV method does not yield true power spectral density estimates. Counterparts of the 2D phase velocity maps are shown in Fig. 4 where one-dimensional phase velocity curves are shown. Phase velocity curves calculated using the EV method were added for additional comparison in Fig. 4. Presented results are compared against true values calculated using Eq. (11). Various methods give different robustness for the viscoelastic data examined. This is also dependent on the viscoelasticity of the material, i.e. ratio.
Fig. 3:
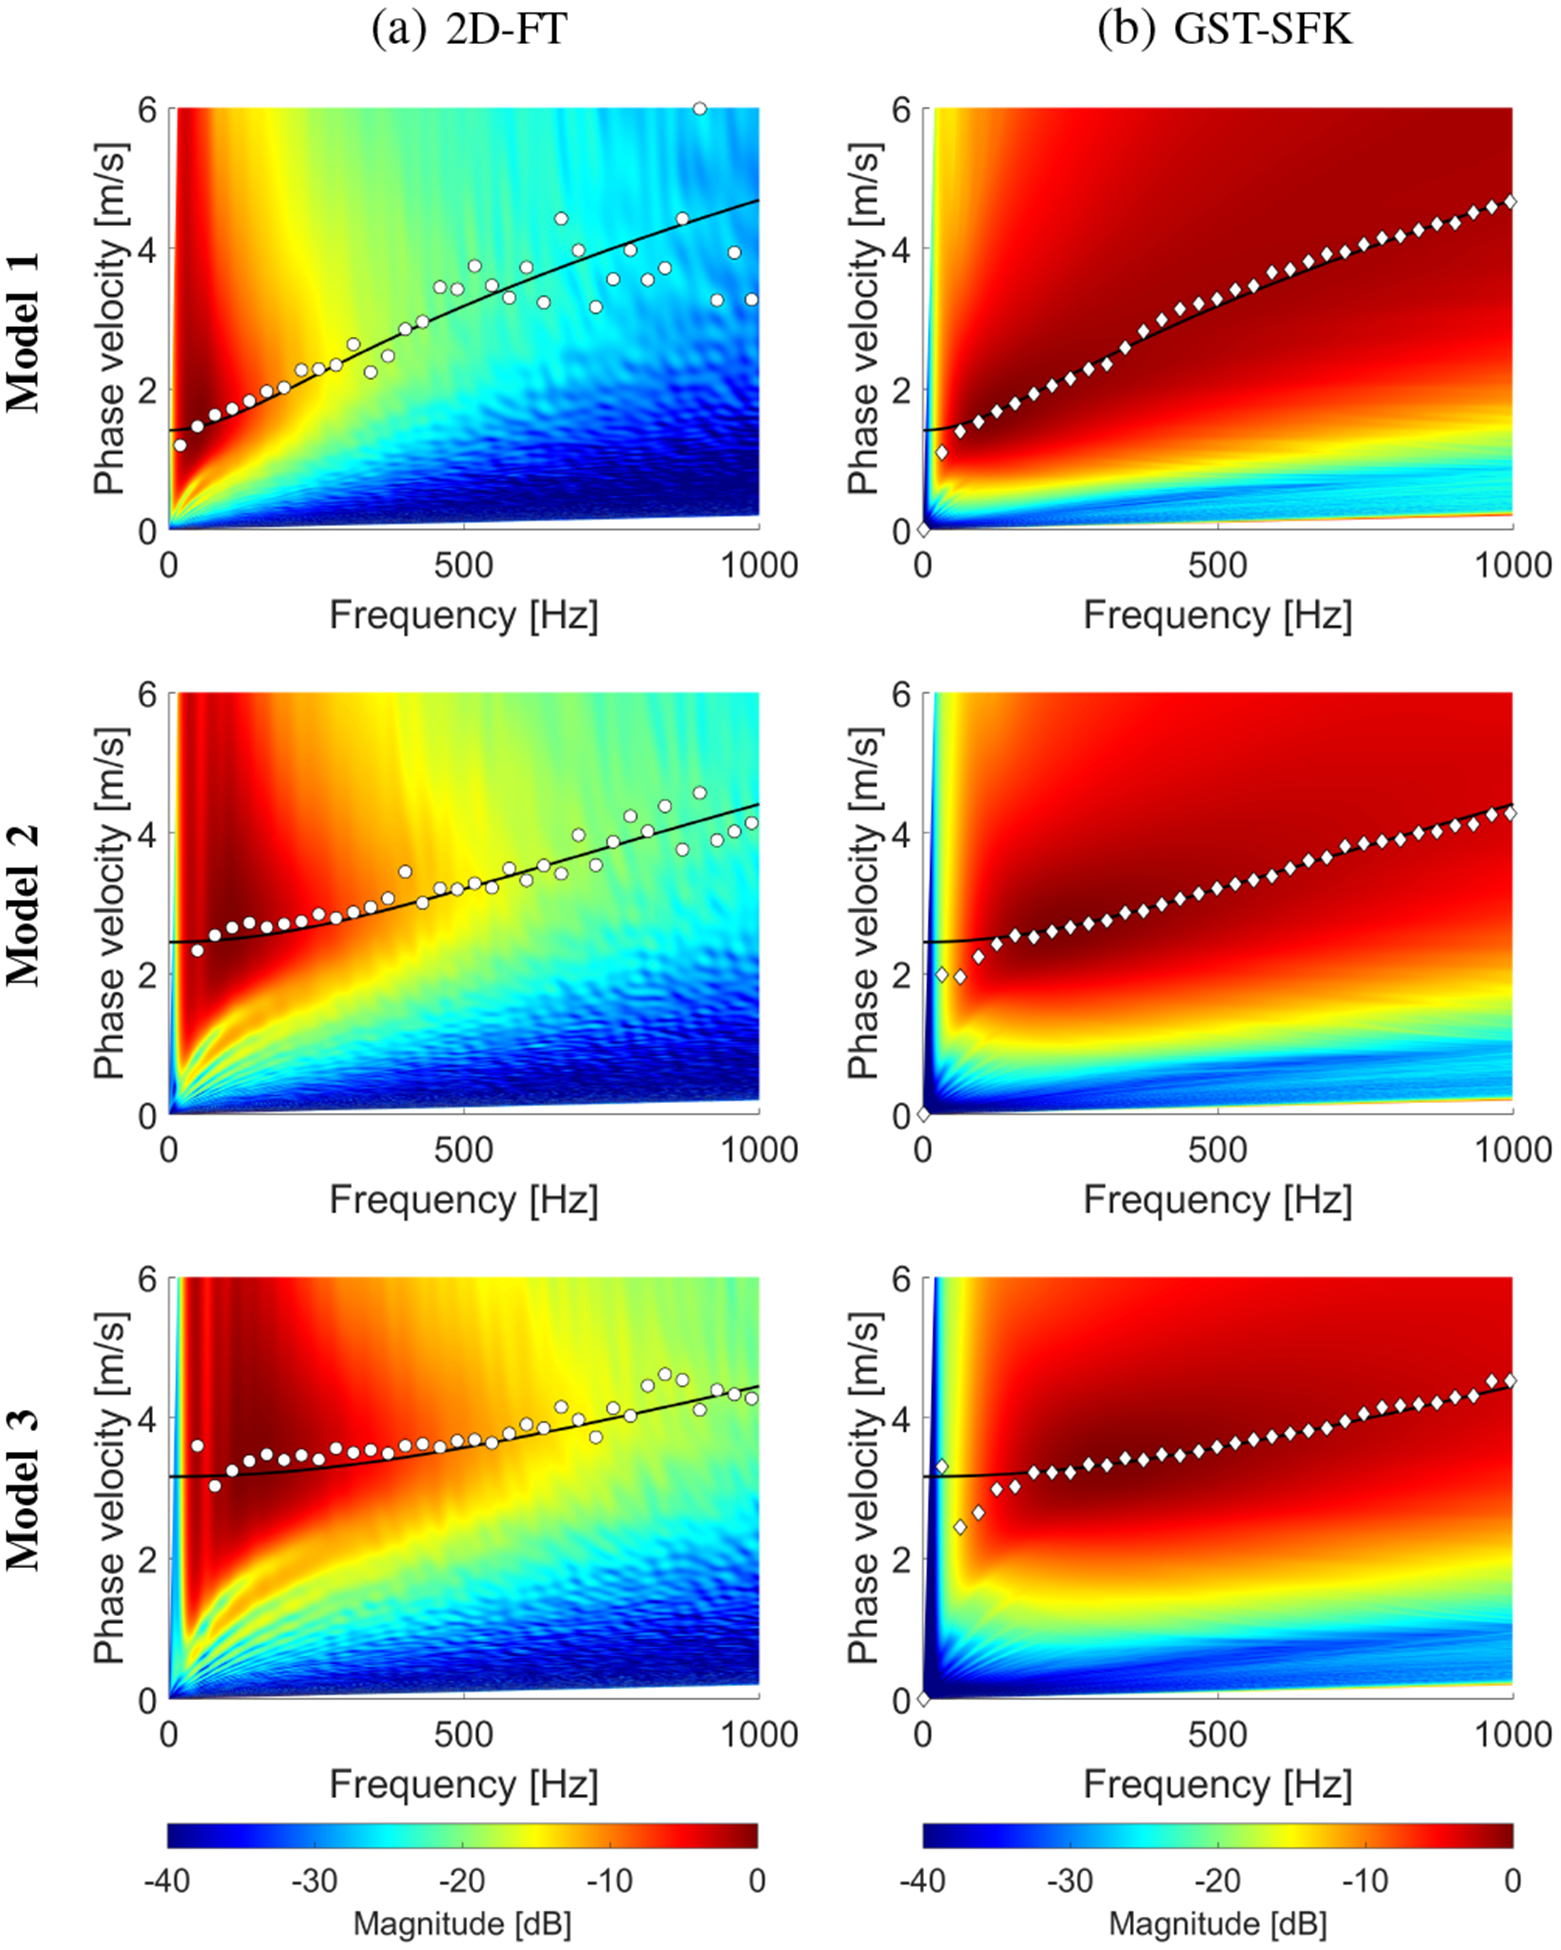
Phase velocity reconstructions based on the (a) 2D-FT, and (b) GST-SFK methods, for shear wave motion measurements. The phase velocity maps have superimposed markers corresponding to the maximum peaks of the phase velocity, as well as continuous lines which represent analytical solutions. Results were calculated for the numerical, tissue mimicking viscoelastic phantoms with a SNR of 13 dB.
Fig. 4:
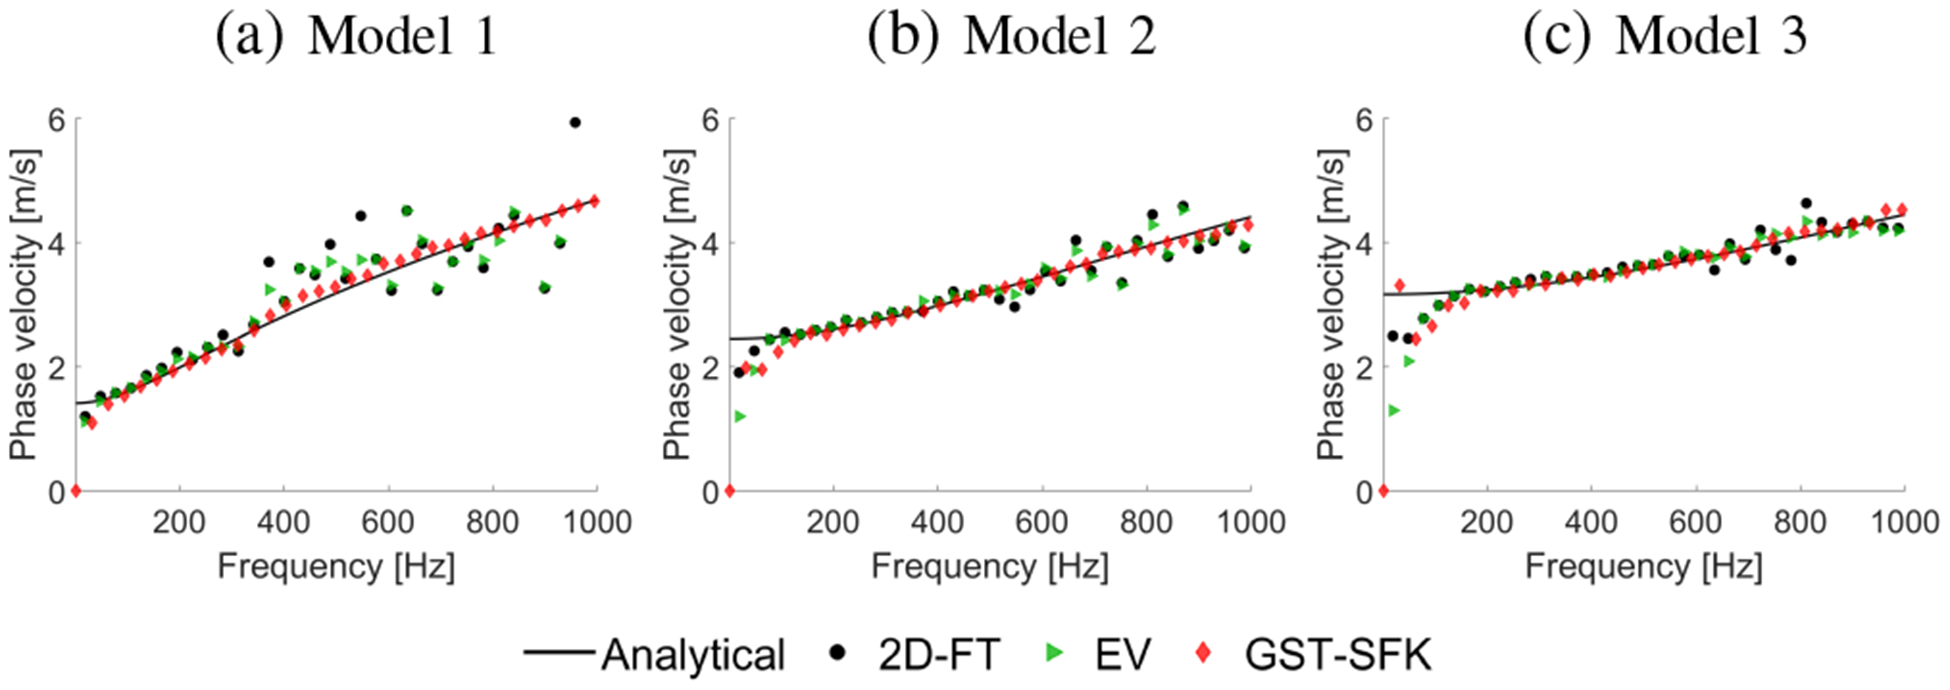
Phase velocity curves calculated for the 2D-FT (black dots), Eigenvector (green triangles), and GST-SFK (red diamonds) methods. Results were computed for the numerical, tissue mimicking viscoelastic phantoms with a SNR of 13 dB.
Box plots of the phase velocity percent error within a range of 200–900 Hz, for the three numerical models investigated, were computed for the data with a SNR of 25, 19, 13, and 7 dB, for 30 noise realizations of added noise each, respectively. Results are outlined in Fig. 5. The 25th and 75th percentiles are indicated by the bottom and top edges of the box, respectively. The mean and median values of the phase velocity error are represented by white circles and solid lines, respectively. The mean and median values were calculated from 30 noise realizations and a frequency range from 200–900 Hz. Values greater than l3 + wL(l3 − l1) or lower than l1 − wL(l3 − l1) were classified as outliers. The parameter wL is the maximum whisker length and was chosen to be 1.5. The parameters l1 and l3 are the 25th and 75th percentiles of the sample data, respectively. Quantitative evaluation of the interquartile range (IQR) can be done by computation of a difference between 25th and 75th percentiles of the sample data (IQR = l3 − l1). Additionally, IQR values for each numerical model and various SNR levels are shown in Table I.
Fig. 5:
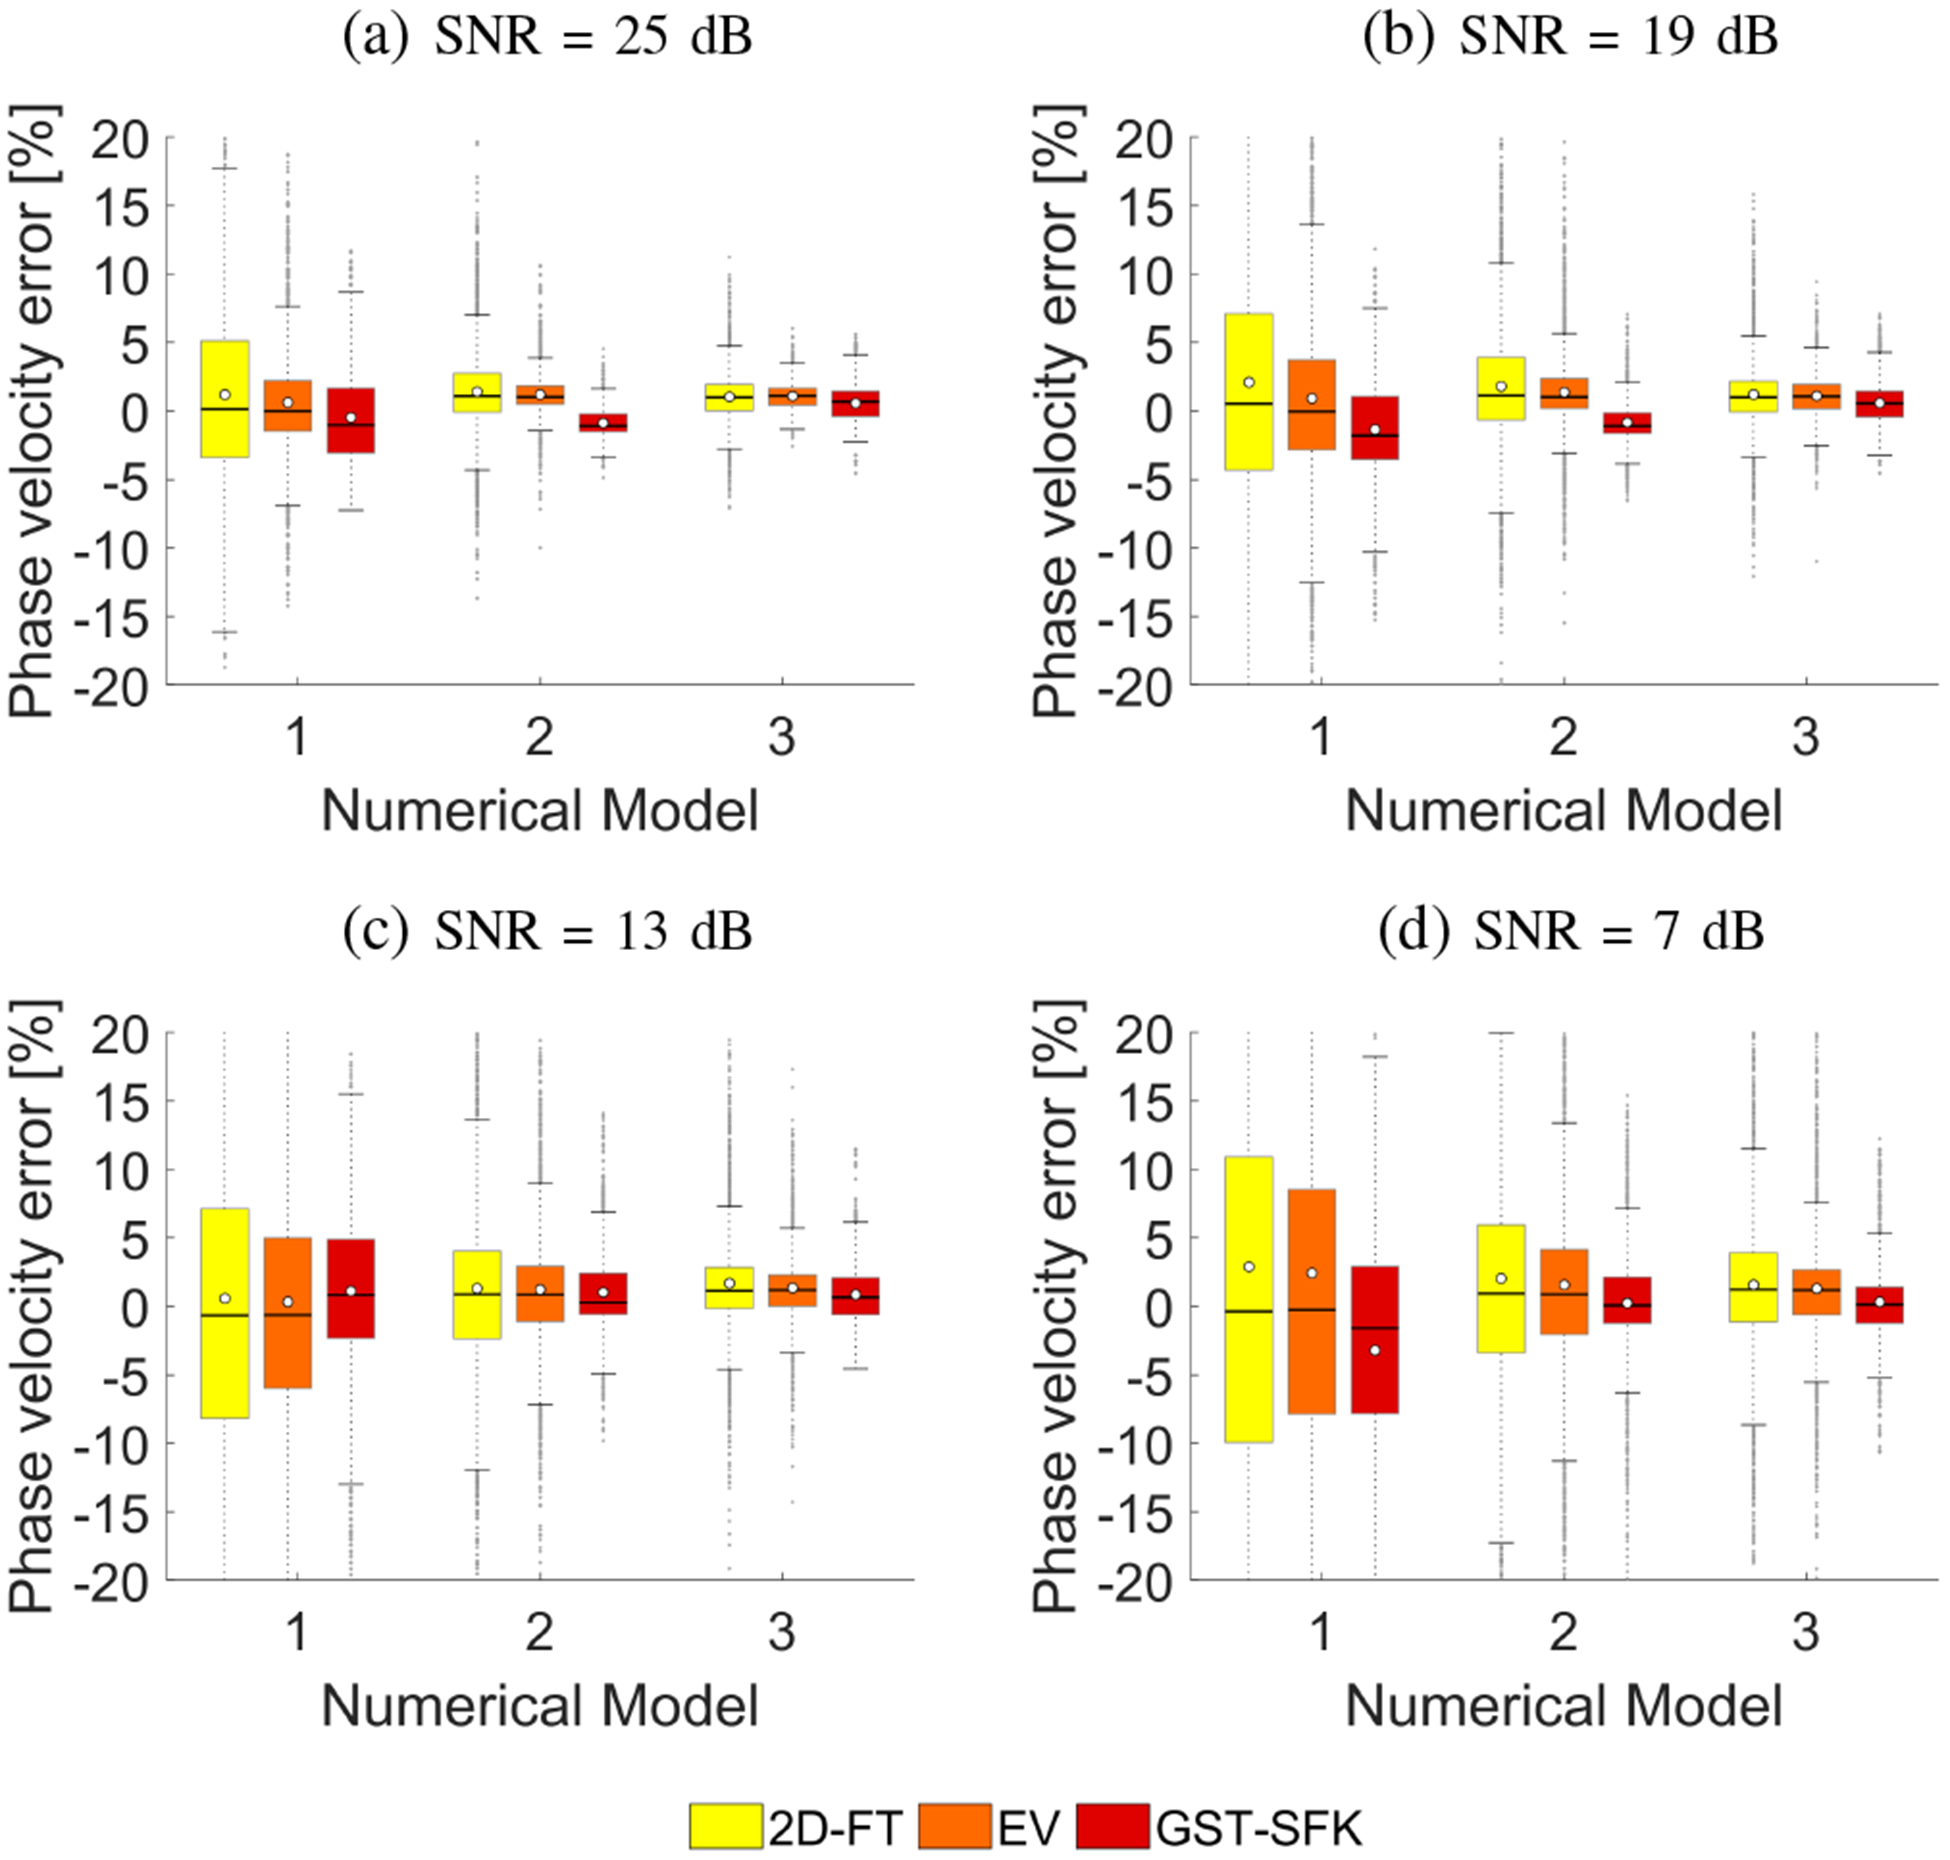
Box plots calculated for the phase velocity percent error computed in a frequency range from 200–900 Hz. Phase velocity errors were computed for the numerical finite difference data, for 30 noise realizations with SNR value set to (a) 25 dB, (b) 19 dB, (c) 13 dB, and (d) 7 dB, respectively.
TABLE I:
IQR of the phase velocity percent error for 30 noise realizations and frequency range from 200 to 900 Hz. Results for the 2D-FT, EV, and GST-SFK methods and three numerical phantoms are summarized. Results are displayed in the unit of [%].
|
μ1 [kPa] |
Method | SNR [dB] | |||
|---|---|---|---|---|---|
| 25 | 19 | 13 | 7 | ||
| 2D-FT | 8.52 | 11.42 | 15.30 | 20.86 | |
| 2 | EV | 3.69 | 6.57 | 16.39 | 16.39 |
| GST-SFK | 4.73 | 4.59 | 7.22 | 10.74 | |
| 2D-FT | 2.83 | 4.59 | 6.41 | 9.35 | |
| 6 | EV | 1.35 | 2.19 | 4.05 | 6.21 |
| GST-SFK | 1.28 | 1.50 | 3.00 | 3.38 | |
| 2D-FT | 1.91 | 2.25 | 3.00 | 5.07 | |
| 10 | EV | 1.23 | 1.79 | 2.29 | 3.29 |
| GST-SFK | 1.85 | 1.88 | 2.71 | 2.65 | |
For the numerical, viscoelastic models investigated the largest box plots occur for the 2D-FT method. The EV method, gives improved results (smaller box plots) in relation to the 2D-FT. The GST-SFK method gives comparable box plots to the EV approach however, it provides the results with reduced number of outliers. Less viscoelastic materials, with lower ratio, have lower variation (lower IQR) in calculated dispersion phase velocities. For example, for μ1 = 10 kPa and μ2 = 2 Pa·s (viscoelastic Model 3), SNR of 13 dB, IQR for 2D-FT is equal to 3.00%. At the same time the EV results have an IQR of 2.29%. The GST-SFK method exhibited IQR at the level of 2.29% (Table I).
B. TM Phantoms
In this section, the described methods in Sec. II were used to investigate phase velocity dispersion curves calculation for the experimental TM phantom data. The results for four different custom-made TM phantoms are displayed in Figs. 6, 7, 8. A depiction of the k-space for the 2D-FT and GST-SFK are shown in the Appendix.
Fig. 6:
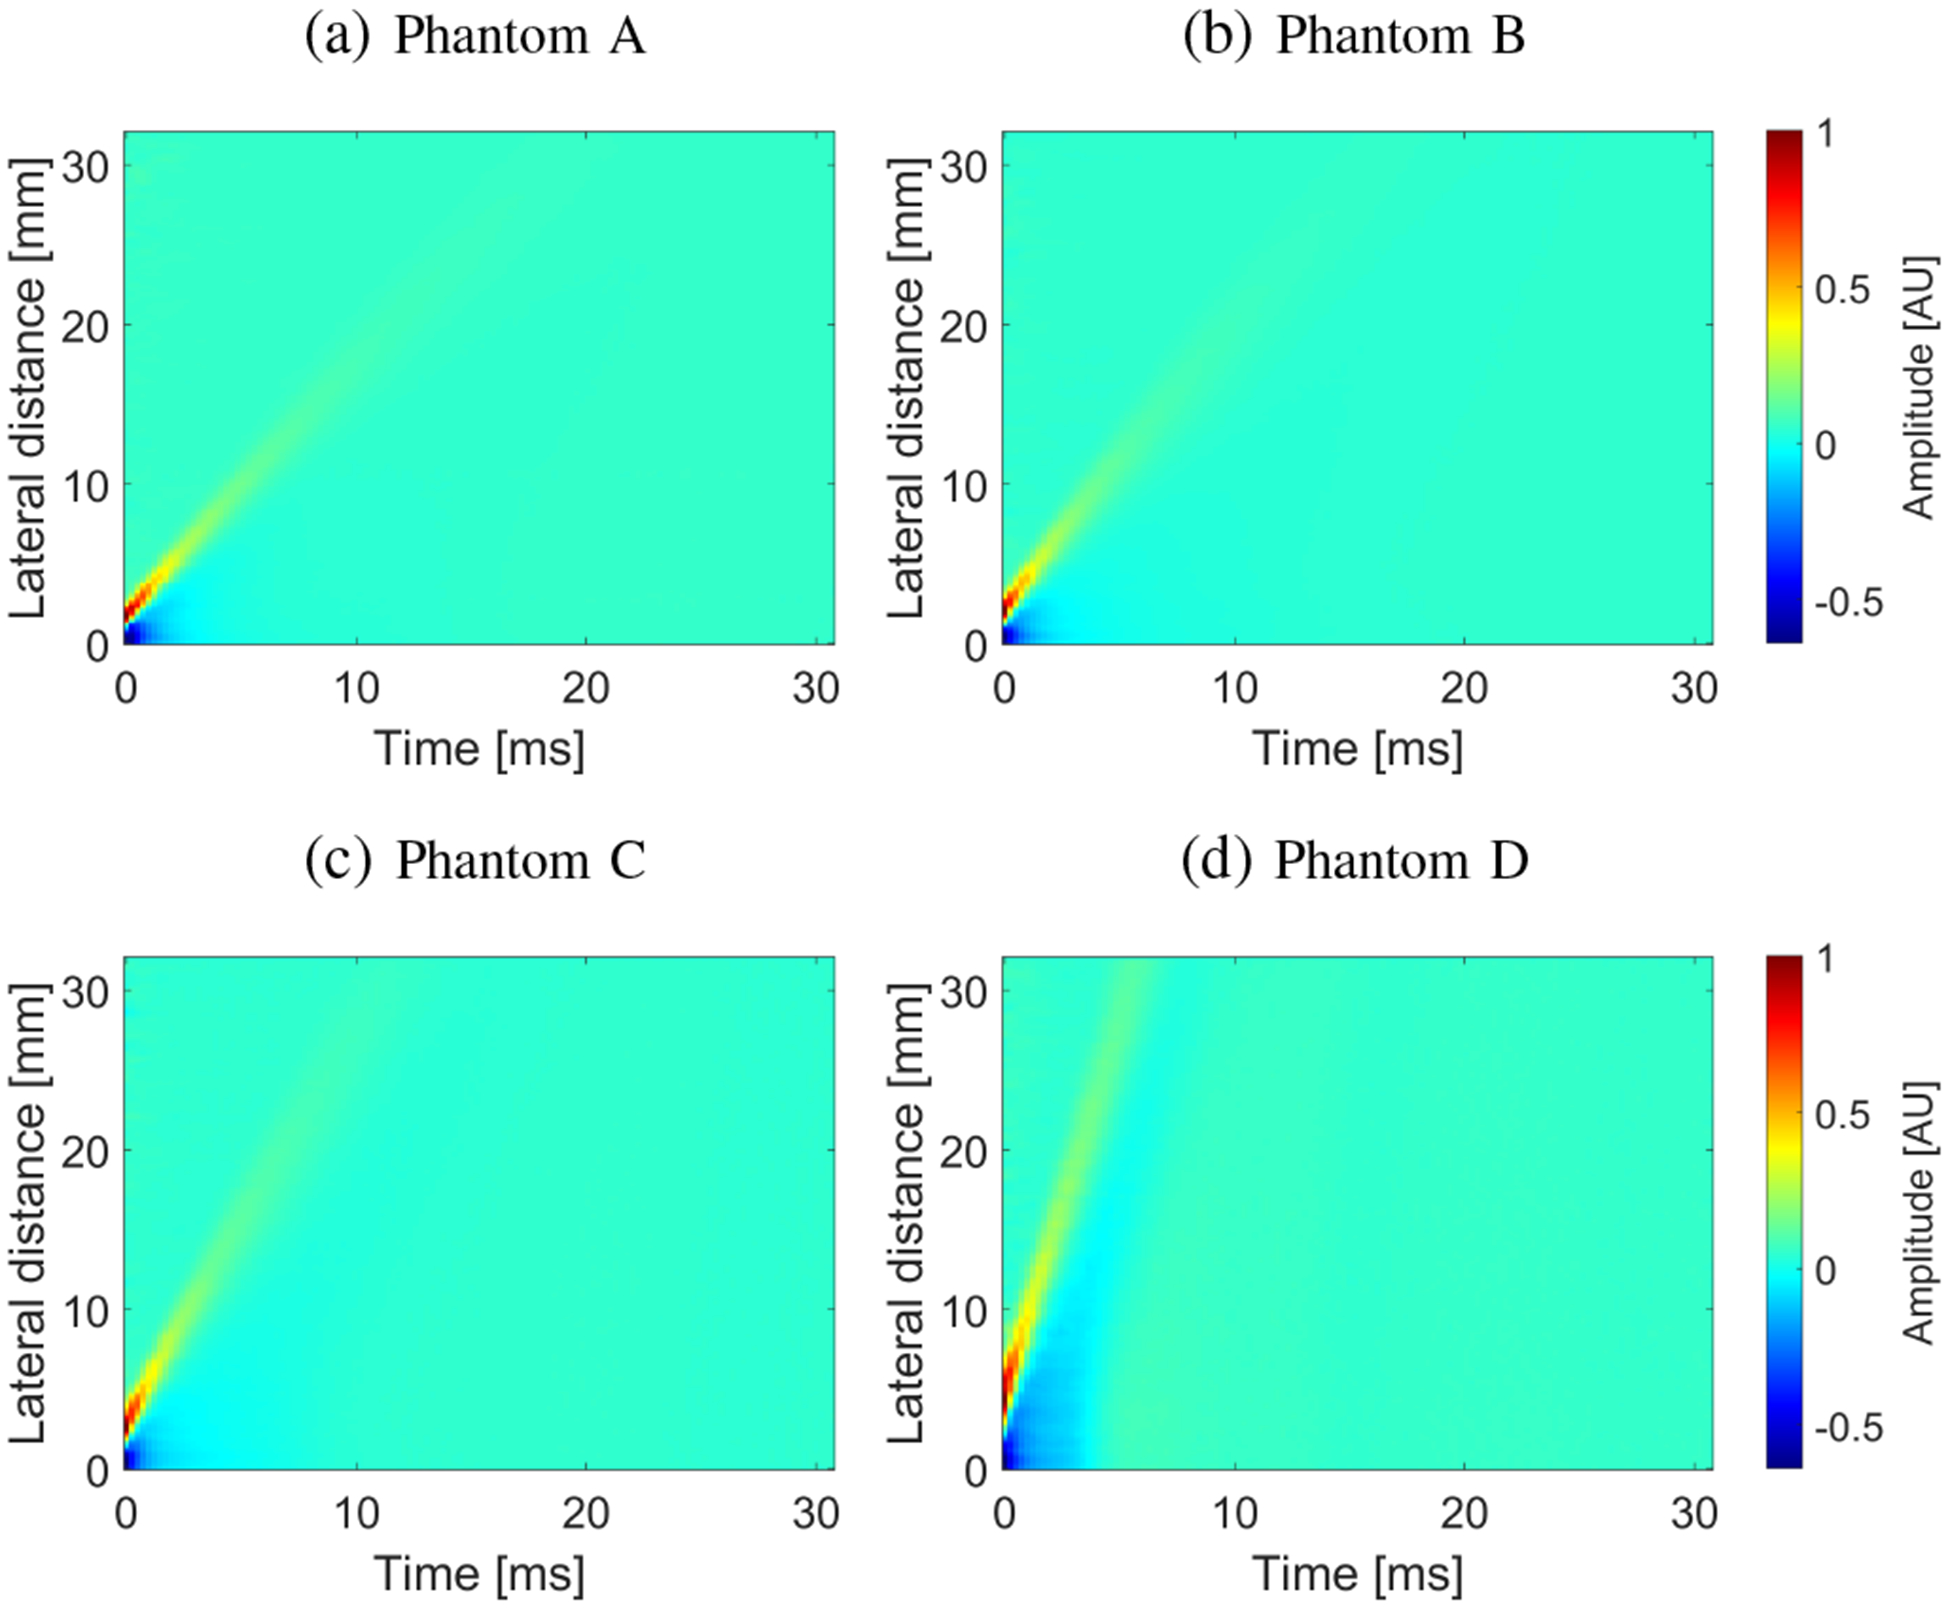
Spatiotemporal shear wave particle velocity signals. Results were calculated for the experimental, custom-made TM viscoelastic phantoms A, B, C, and D.
Fig. 7:
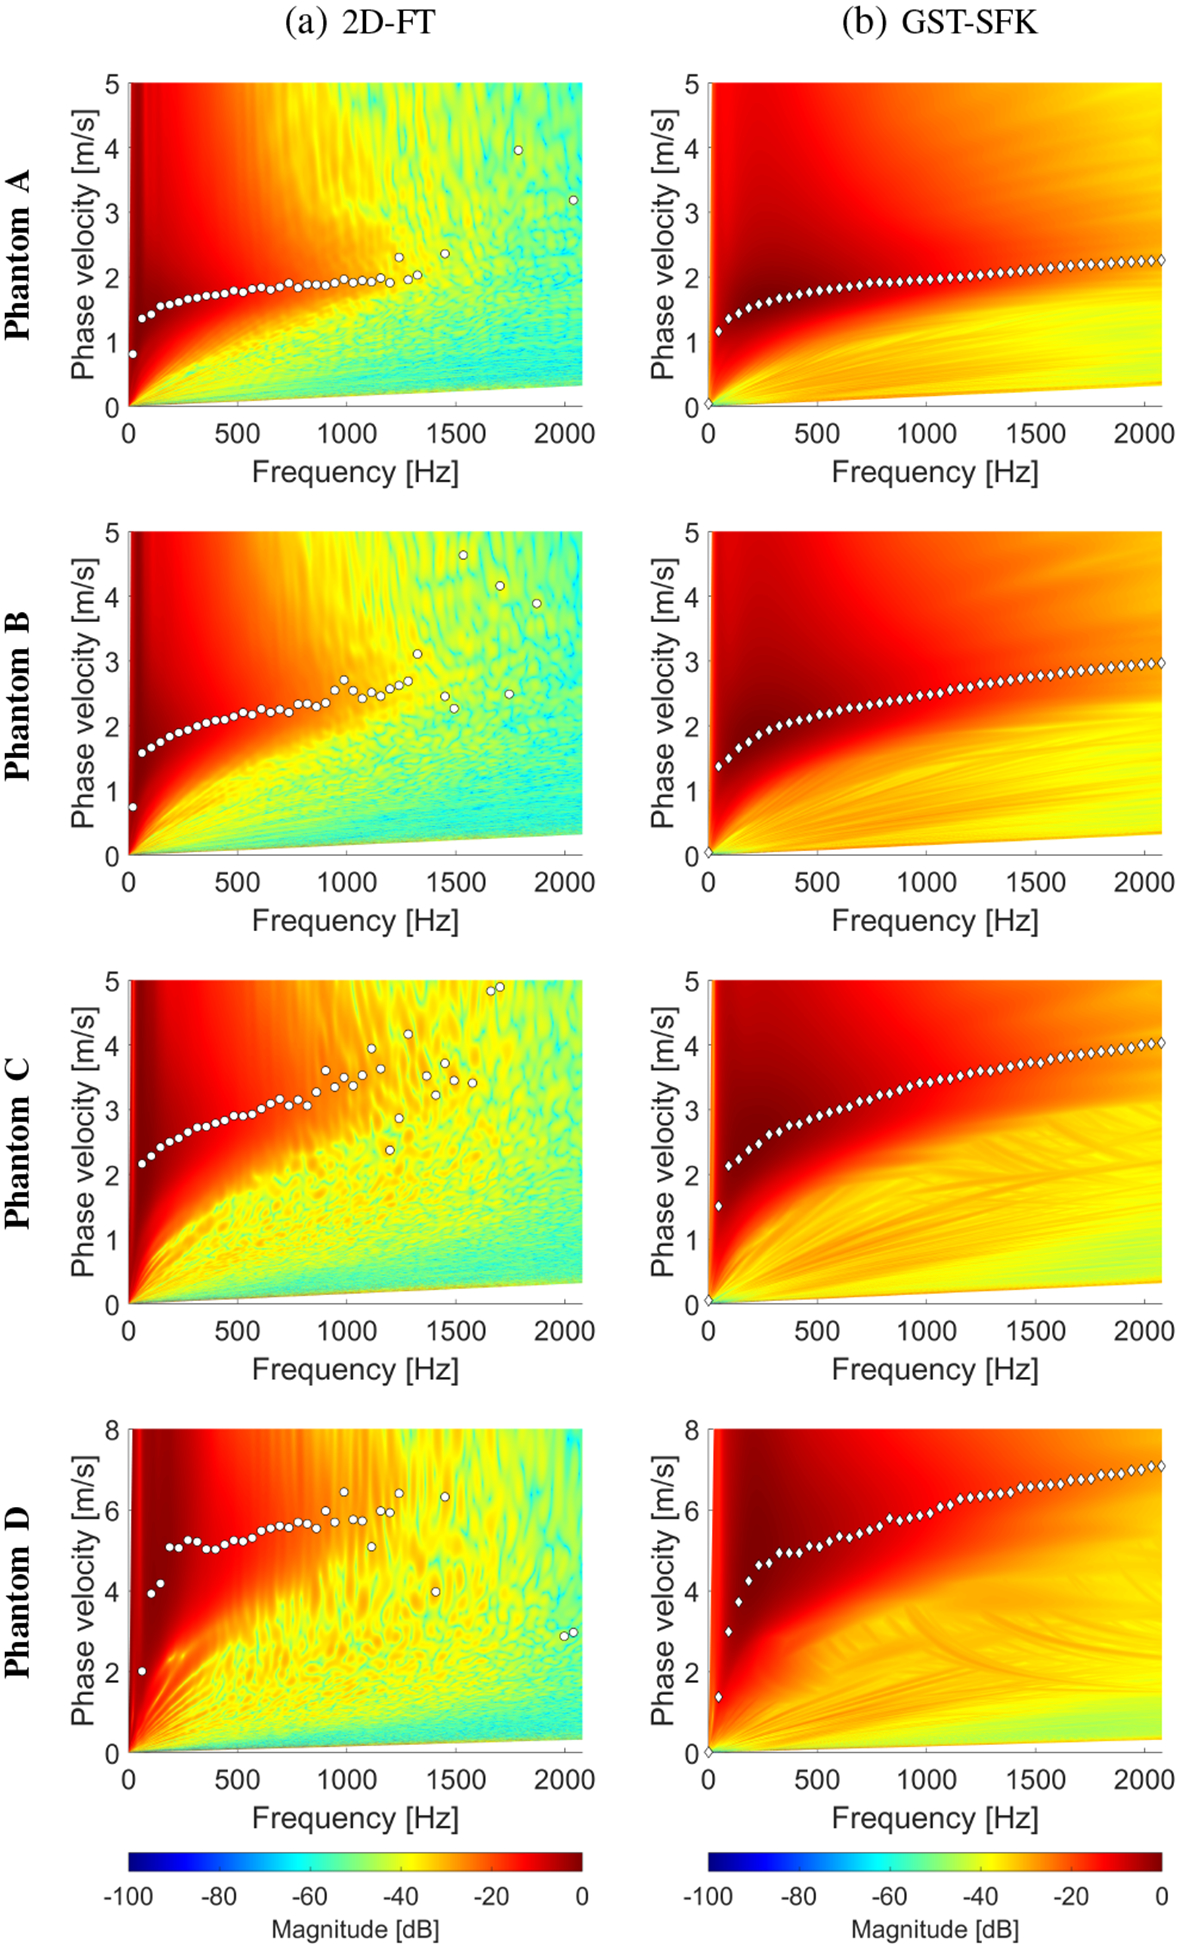
Phase velocity reconstructions based on the (a) 2D-FT, and (b) GST-SFK methods, for shear wave motion measurements. The phase velocity maps have superimposed markers corresponding to the maximum peaks of the phase velocity. Results were calculated for the experimental, custom-made TM viscoelastic phantoms A, B, C, and D.
Fig. 8:
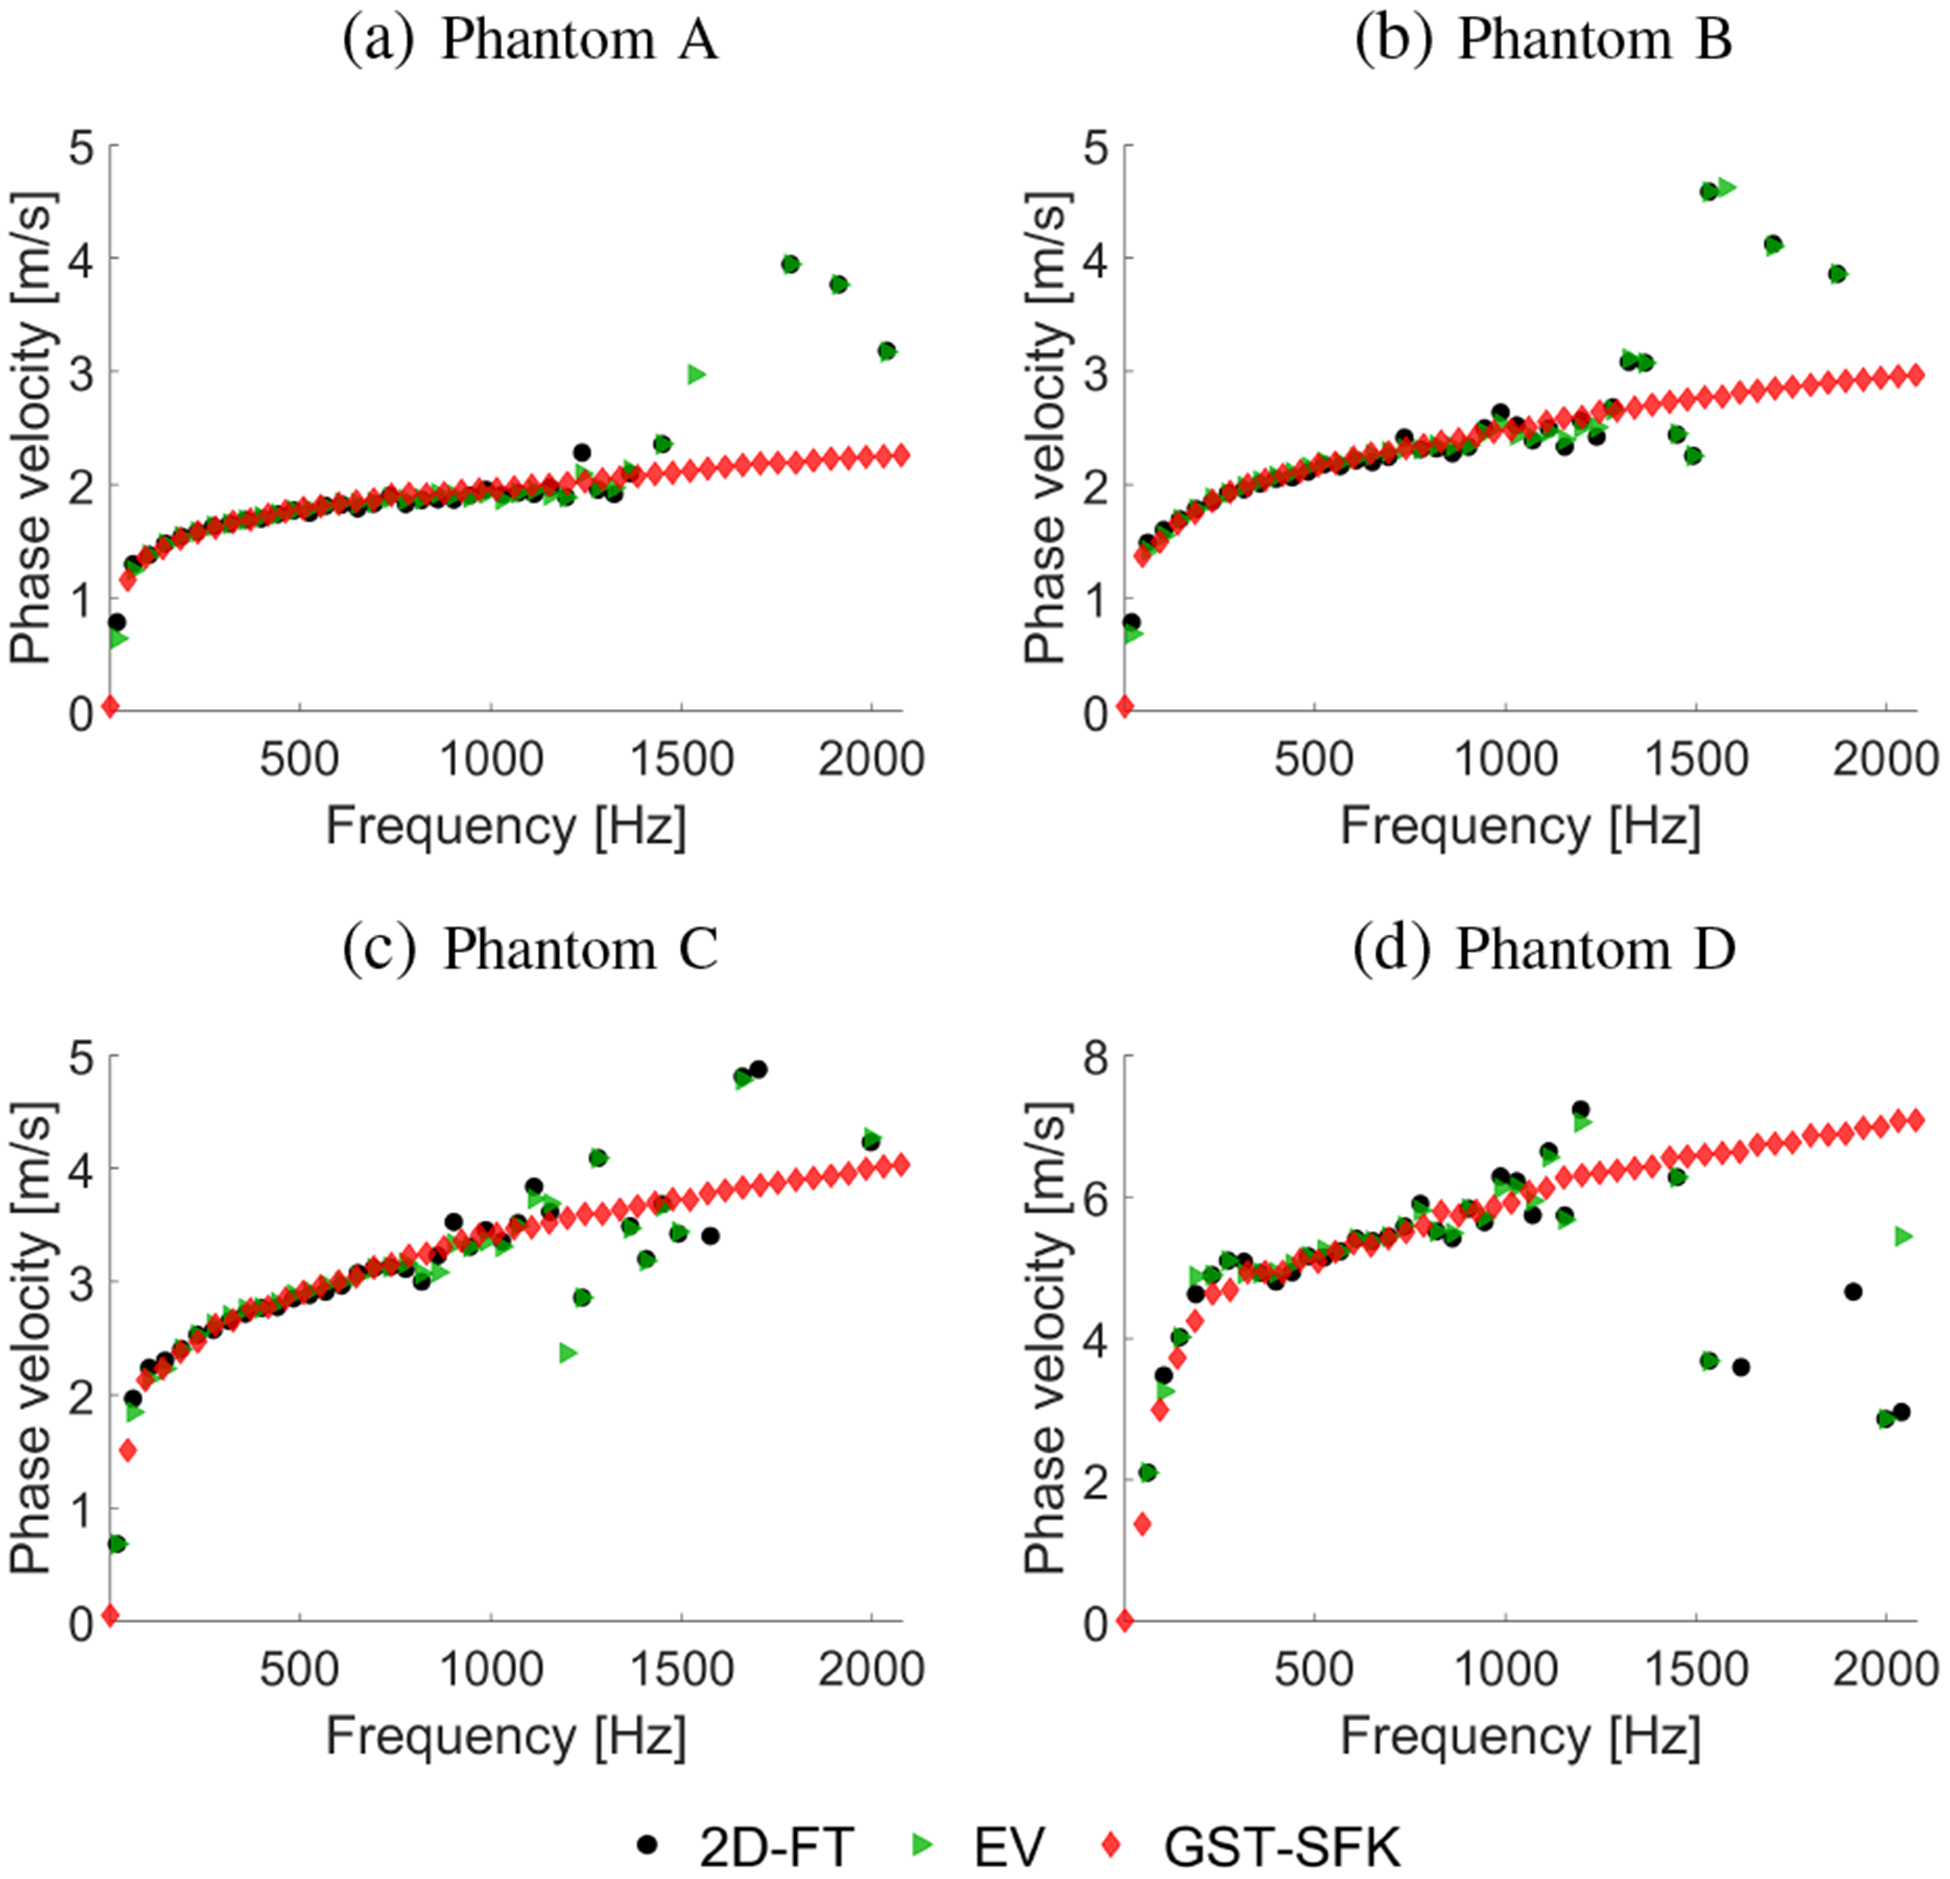
Phase velocity curves calculated for the 2D-FT (black dots), Eigenvector (green triangles), and GST-SFK (red diamonds) methods. Results were computed for the experimental, custom-made TM viscoelastic phantoms, for (a) Phantom A, (b) Phantom B, (c) Phantom C, and (d) Phantom D.
Figure 6 shows the spatiotemporal shear wave particle velocity data for all four phantoms. Figure 7 demonstrates two-dimensional phase velocity curves computed using the 2D-FT and GST-SFK methods. Similar as in the previous section, the superimposed markers on the maps correspond to the maximum peaks of the phase velocity. A clear difference between the 2D-FT and GST-SFK methods can be observed for frequencies starting from approximately 1000 Hz. Magnitude of the main shear wave phase velocity is enhanced for the GST-SFK approach in comparison to the 2D-FT technique. Thereby, dispersion curves for frequencies above 1000 Hz are detected with very low variation, marked as white diamond markers (Fig. 7b). The f–k distribution reconstructed based on the 2D-FT, and GST-SFK methods for the TM phantoms is shown in the Appendix.
The same dispersion curves as shown in Fig. 7 (via markers) were collected and compared in Fig. 8 along with dispersion curves calculated using the EV approach. A similar performance between the 2D-FT and EV techniques can be observed for all the TM phantoms investigated. The GST-SFK method for lower frequencies, up to e.g. 800 Hz, gives almost the same robustness. Then, with increasing frequency the GST-SFK method outperforms the other approaches. Variation of the GST-SFK dispersion curves, for frequencies of approximately 800–1200 Hz is lower than for the 2D-FT and EV techniques. More importantly, the GST-SFK method estimates dispersion curves for higher frequencies, up to 2000 Hz whereas, other techniques fail.
A supplementary material (Fig. S1) shows dispersion results analogous to those presented in Fig. 8 with the addition of the results obtained for the 2P-CWT technique [22]. Results for the 2P-CWT method are shown as an alternative approach based on wavelet transformation analysis.
C. Ex vivo Porcine Liver
The experimental ex vivo porcine liver data were processed using the GST-SFK method for shear wave phase velocity evaluation. Results for the GST-SFK method are compared against the 2D-FT and EV techniques. Results for three different porcine livers are presented in Figs. 9, 10, and 11.
Fig. 9:

Spatiotemporal shear wave particle velocity signals. Results were computed for the experimental, ex vivo porcine liver data, for (a) Liver 1, (b) Liver 2, and (c) Liver 3.
Fig. 10:
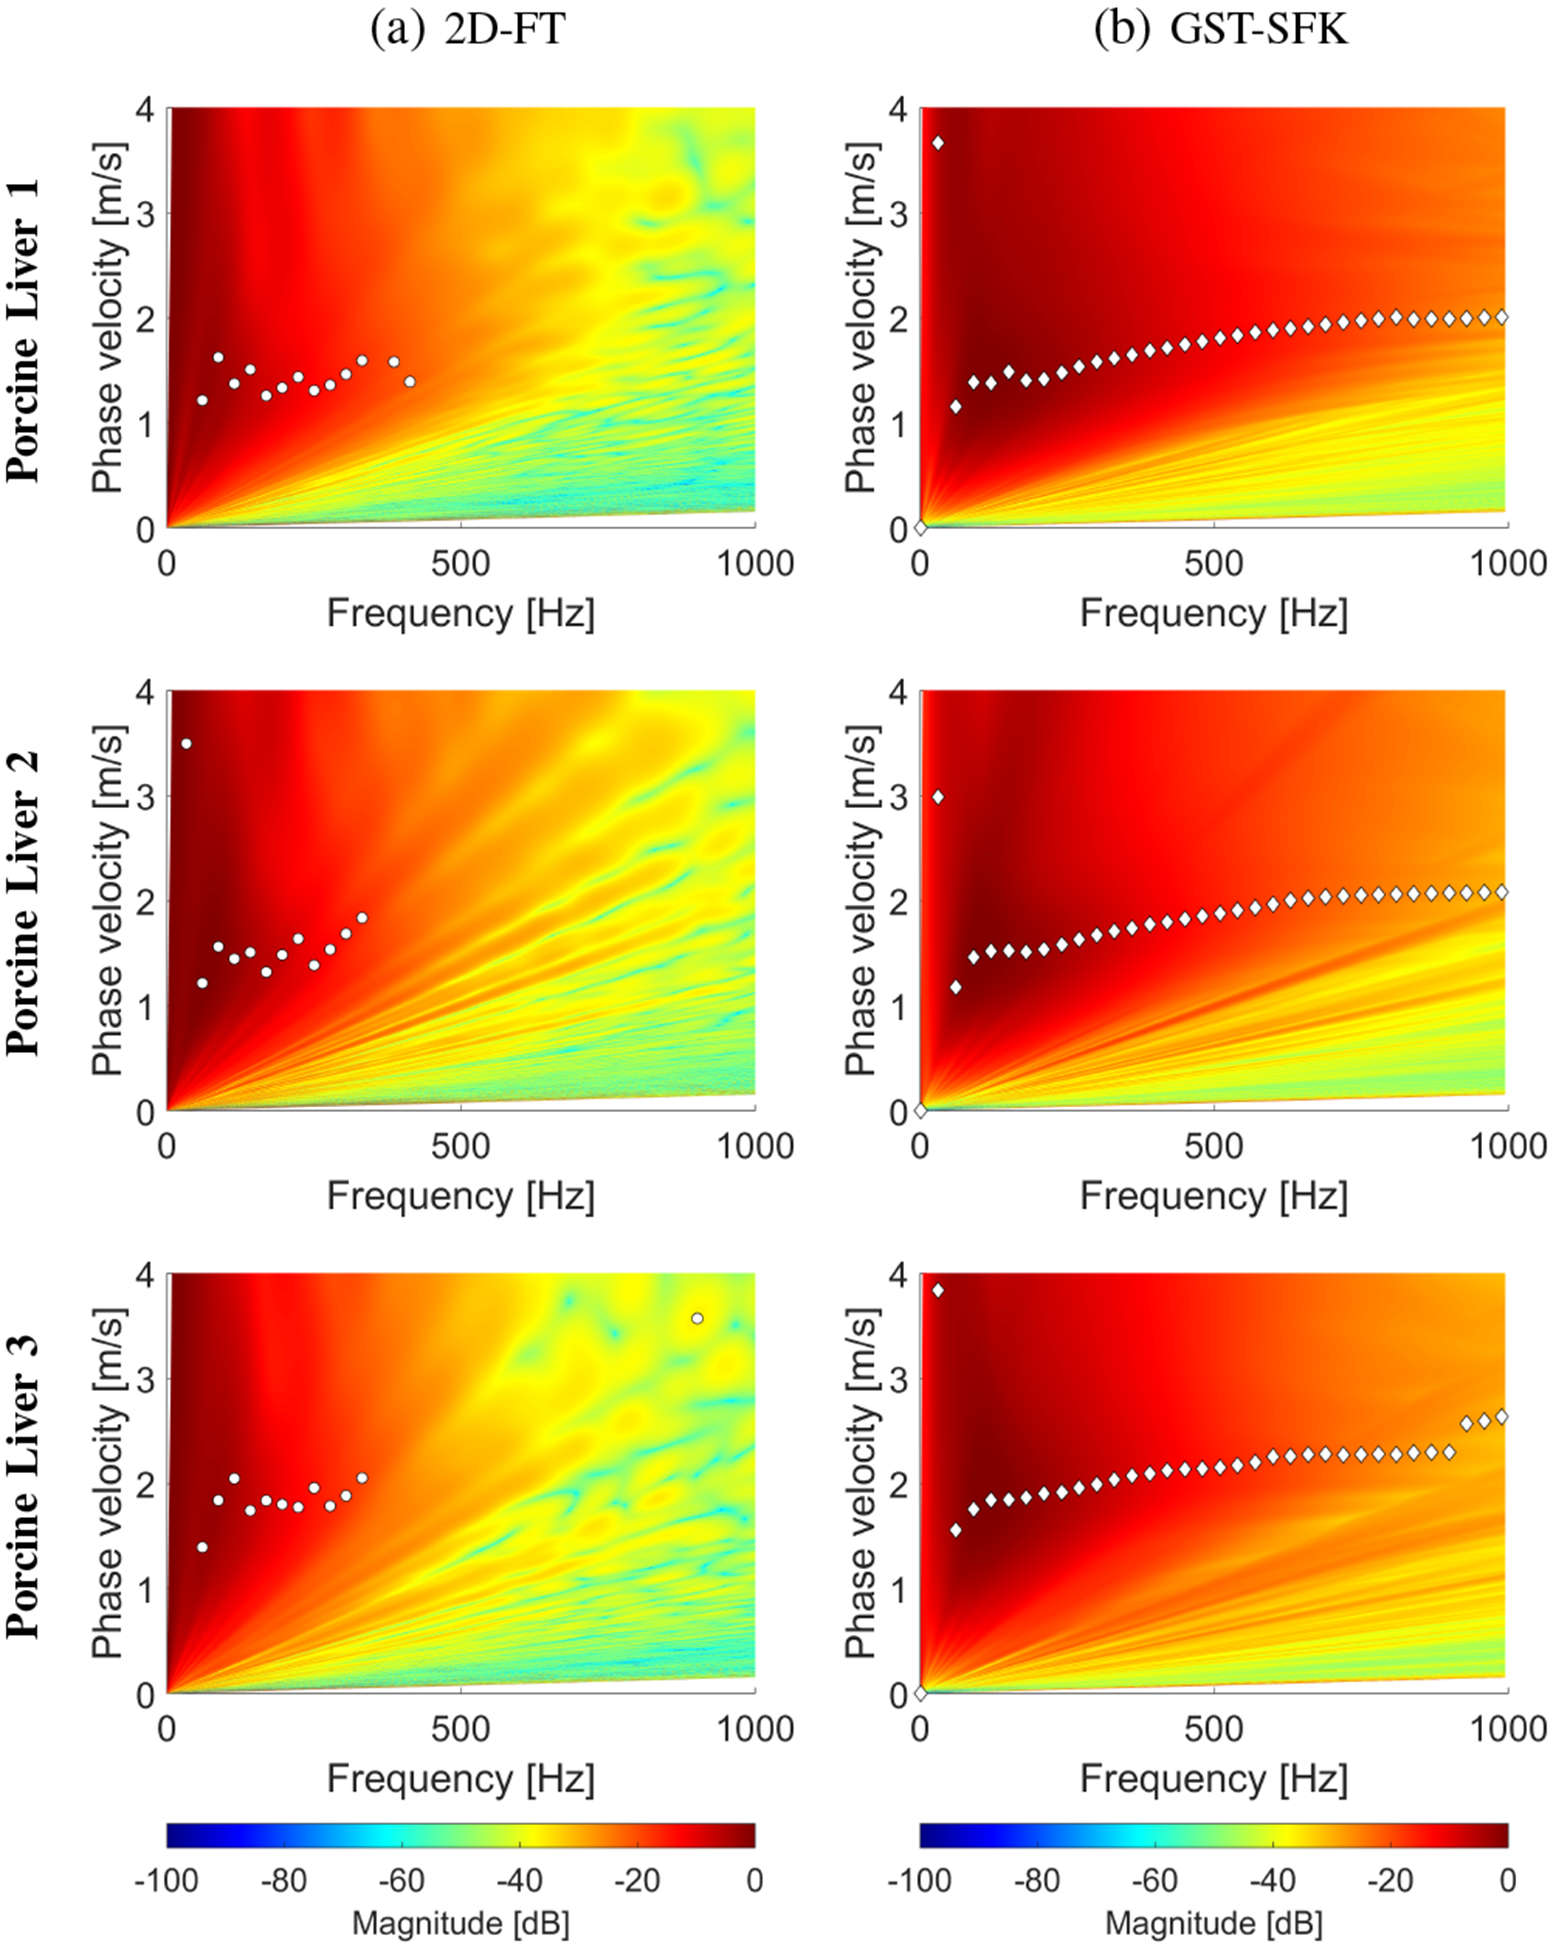
Phase velocity reconstructions based on the (a) 2D-FT, and (b) GST-SFK methods, for shear wave motion measurements. The phase velocity maps have superimposed markers corresponding to the maximum peaks of the phase velocity. Results were calculated for the experimental, ex vivo porcine liver data, for (a) Liver 1, (b) Liver 2, and (c) Liver 3.
Fig. 11:
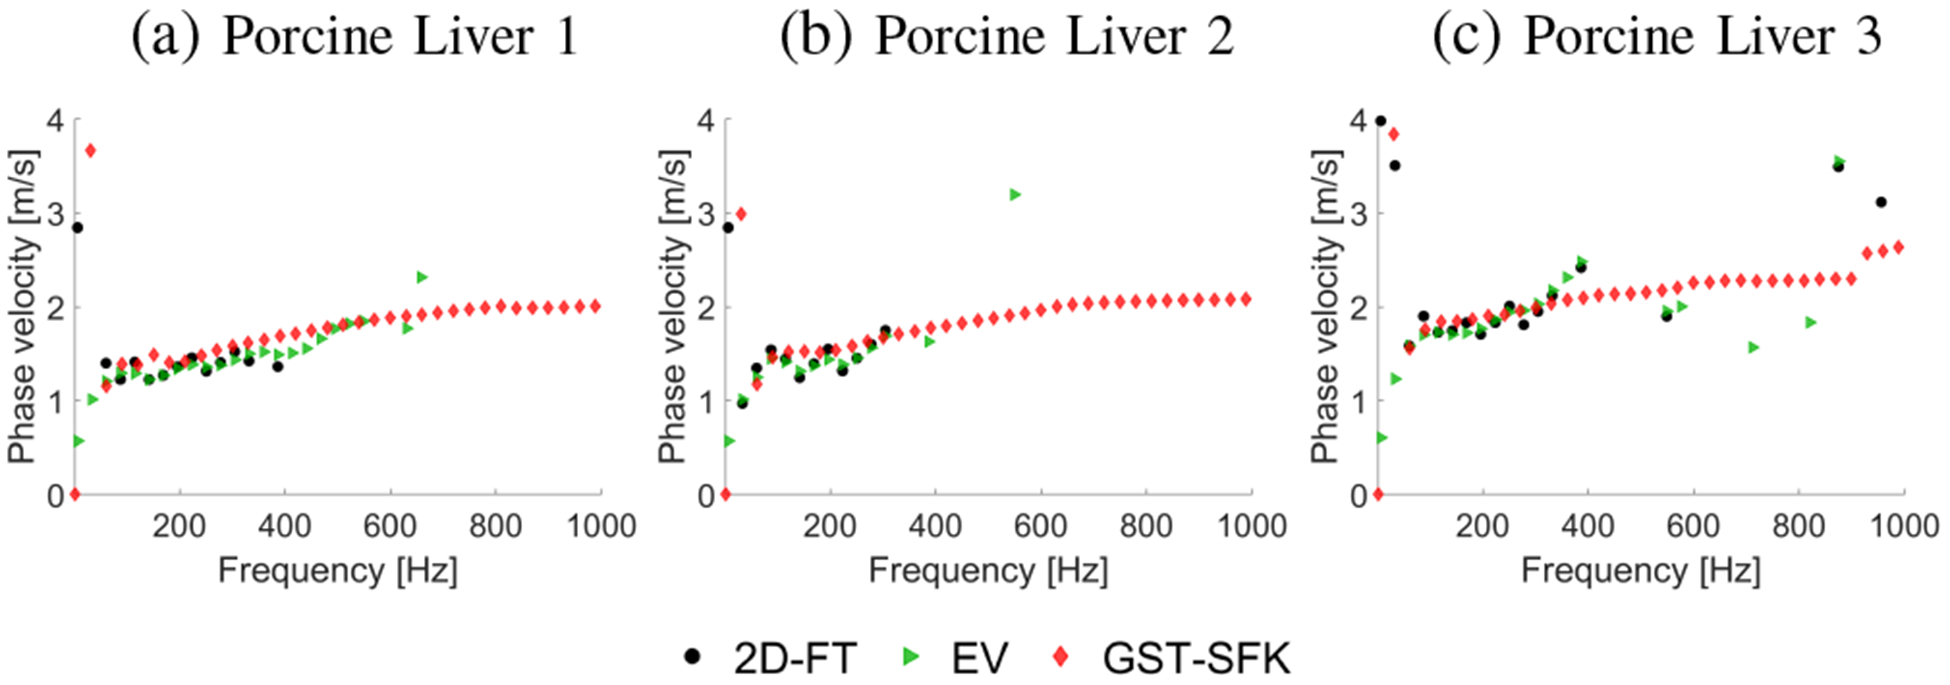
Phase velocity curves calculated for the 2D-FT (black dots), Eigenvector (green triangles), and GST-SFK (red diamonds) methods. Results were computed for the experimental, ex vivo porcine liver data, for (a) Liver 1, (b) Liver 2, and (c) Liver 3.
The spatiotemporal shear wave particle velocity motion data for the ARF push beam focused at 25 mm are shown in Fig. 9. The two-dimensional phase velocity results, with marked maxima of the phase velocity, for the 2D-FT and GST-SFK are presented in Fig. 10. Same as for the numerical and custom-made TM viscoelastic phantoms, also here, the two-dimensional maps, from which the phase velocities are estimated, have higher magnitude for frequencies starting from approximately 400 Hz, for the GST-SFK approach.
Figure 11 shows dispersion curves for all three methods investigated in this paper. Broadly similar results are observed for the 2D-FT and EV methods. The GST-SFK approach on the other hand, similar to the TM phantoms, provides dispersion curves for a wider frequency range, up to approximately 800 Hz and above. In addition, the dispersion curves from GST-SFK are smoother than those from 2D-FT and EV.
D. In vivo Human Liver
Figure 12 presents the spatiotemporal shear wave particle velocity data for the in vivo human livers. Results for six healthy volunteers are shown.
Fig. 12:
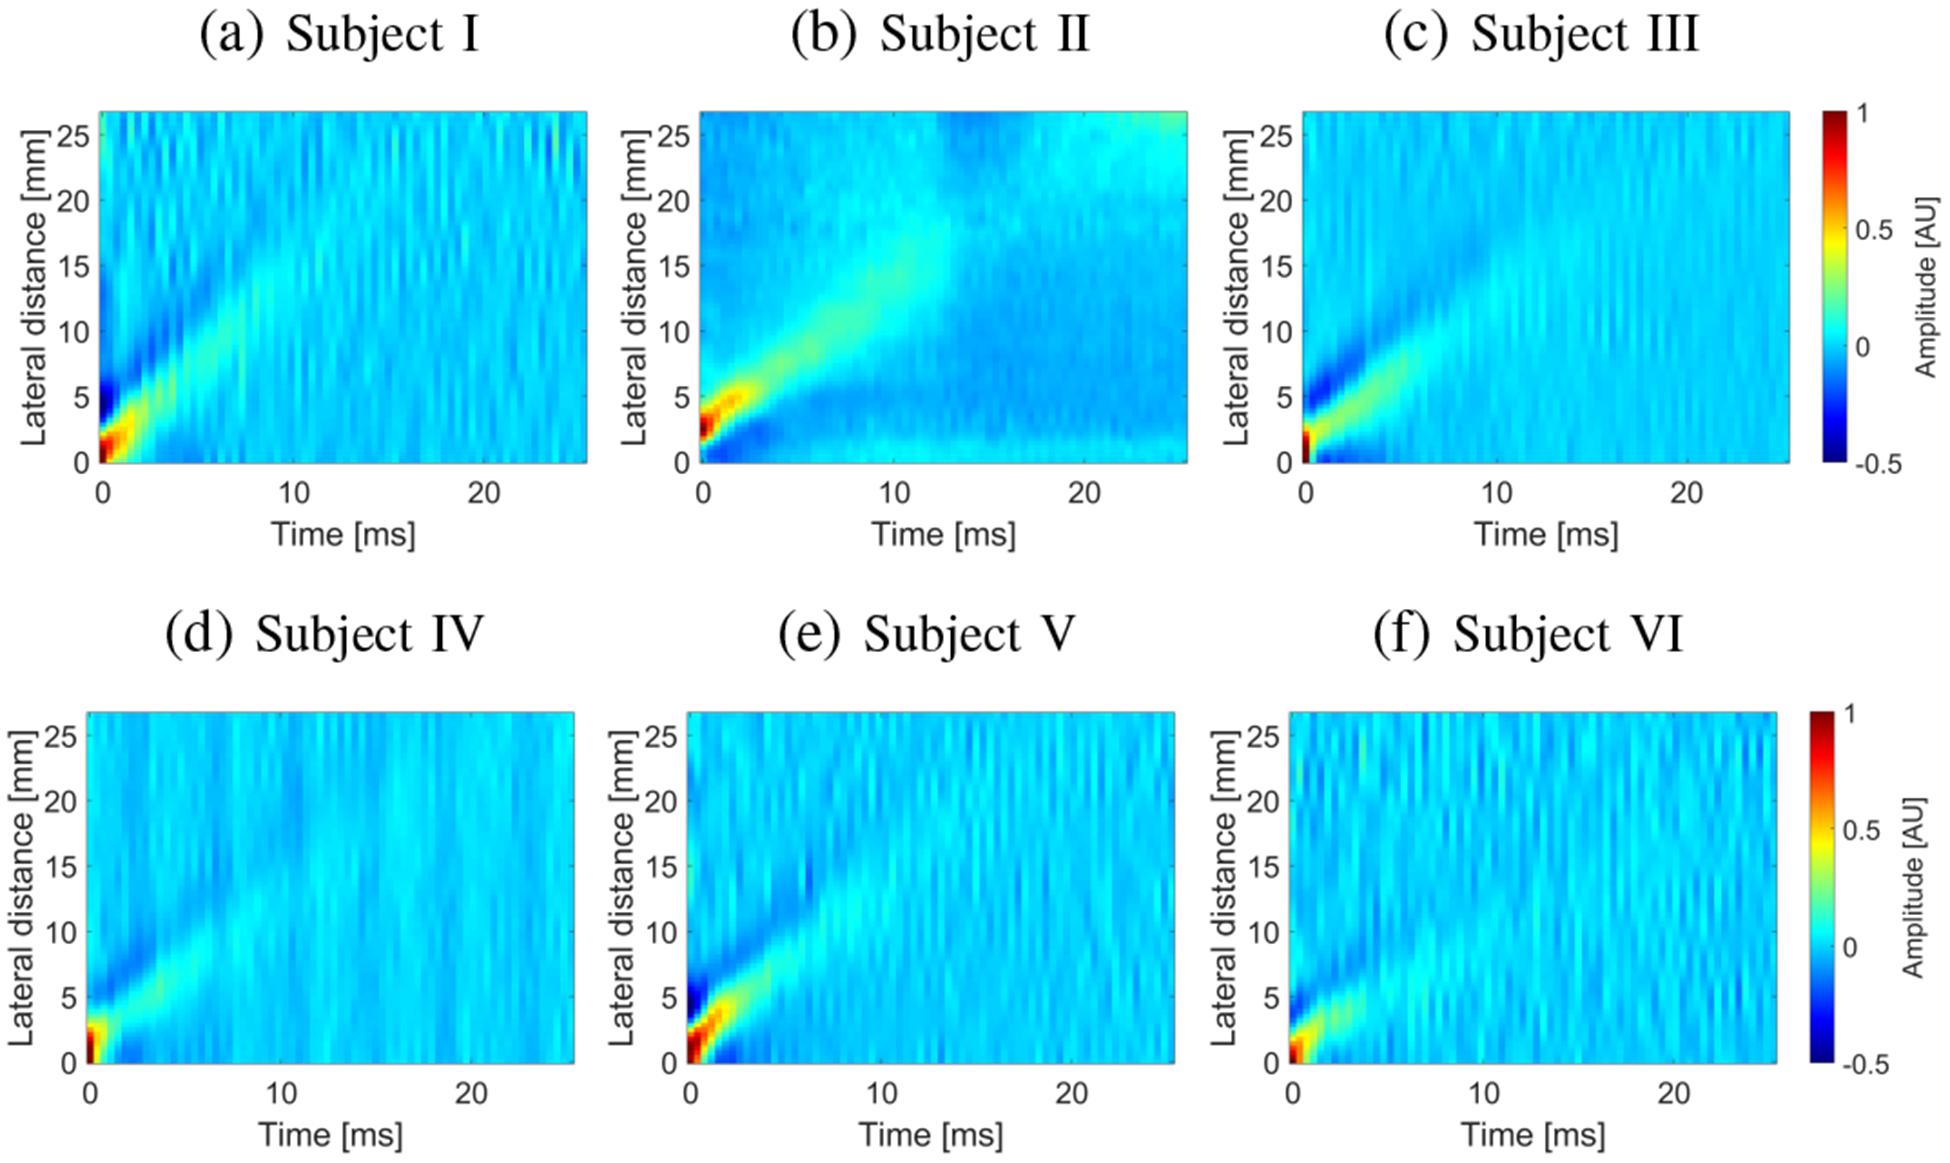
Spatiotemporal shear wave particle velocity signals. Results were computed for the experimental, in vivo human liver studies, for (a) Subject I, (b) Subject II, (c) Subject III, (d) Subject IV, (e) Subject V, and (f) Subject VI.
The two-dimensional phase velocity maps for the 2D-FT and GST-SFK approaches are shown in Fig. 13. Their comparison with the EV method is summarized in Fig. 14. Similarly, as in the previous data examined in this work, the 2D-FT and EV methods perform similarly. The GST-SFK approach enhances the information at higher frequencies and gives robust dispersion curves for frequencies up to approximately 700 Hz. The usable bandwidth was at least doubled compared to the other methods.
Fig. 13:
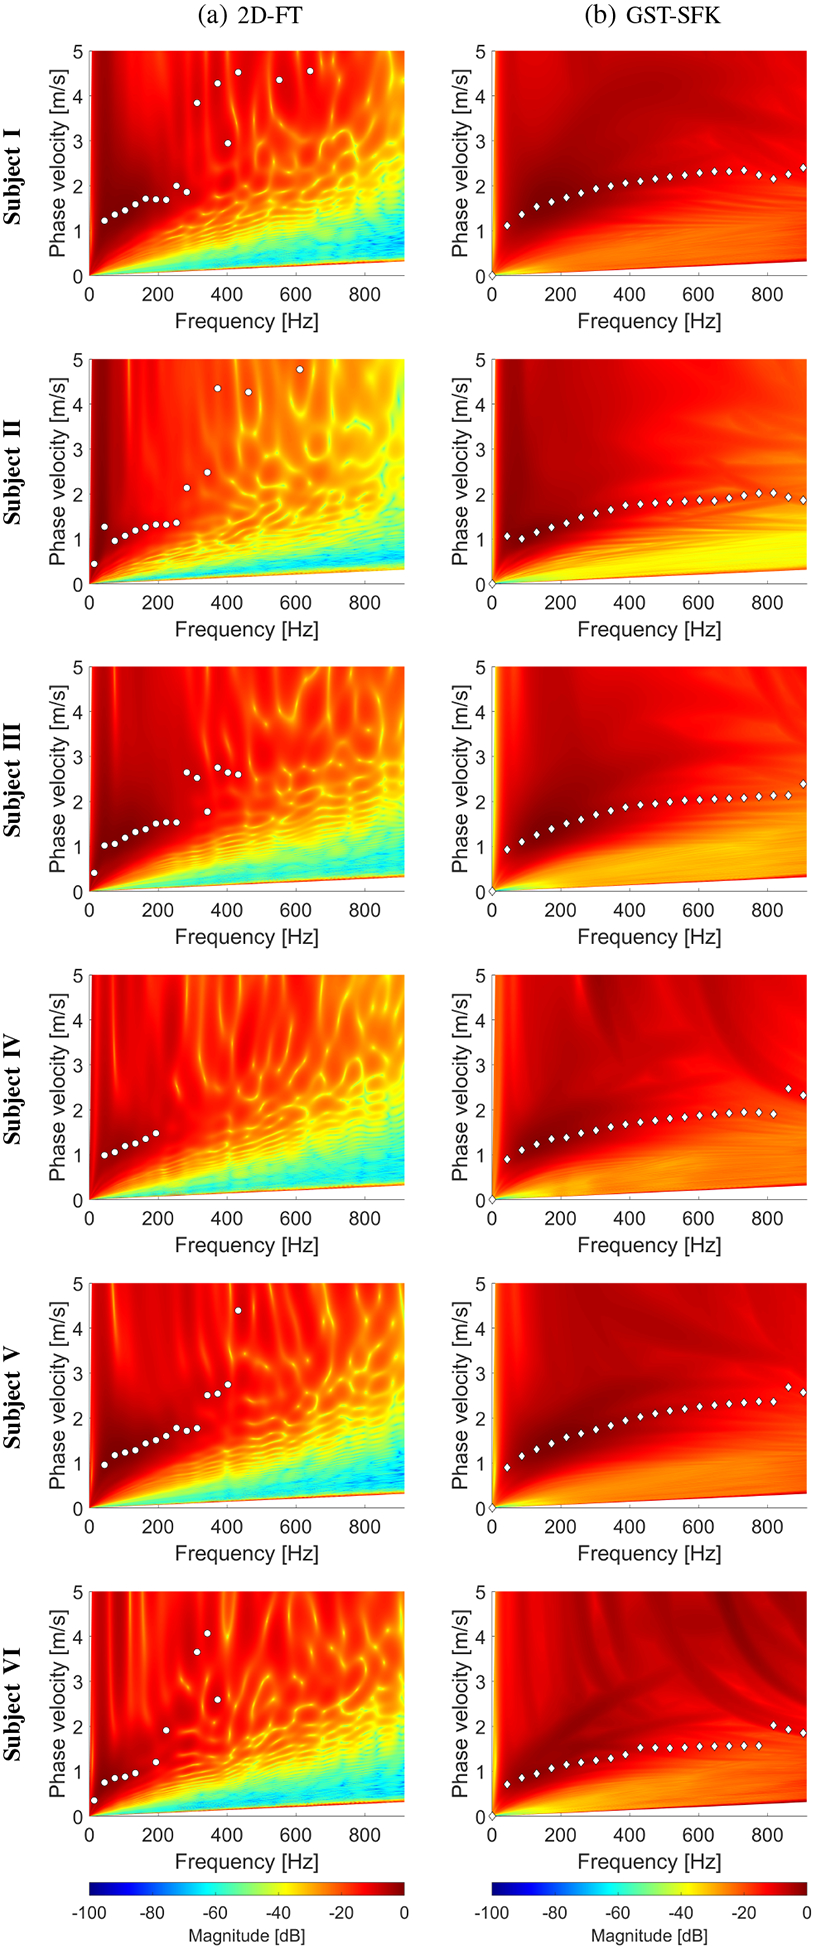
Phase velocity reconstructions based on the (a) 2D-FT, and (b) GST-SFK methods, for shear wave motion measurements. The phase velocity maps have superimposed markers corresponding to the maximum peaks of the phase velocity. Results were computed for the experimental, in vivo human liver studies, for (a) Subject I, (b) Subject II, (c) Subject III, (d) Subject IV, (e) Subject V, and (f) Subject VI.
Fig. 14:
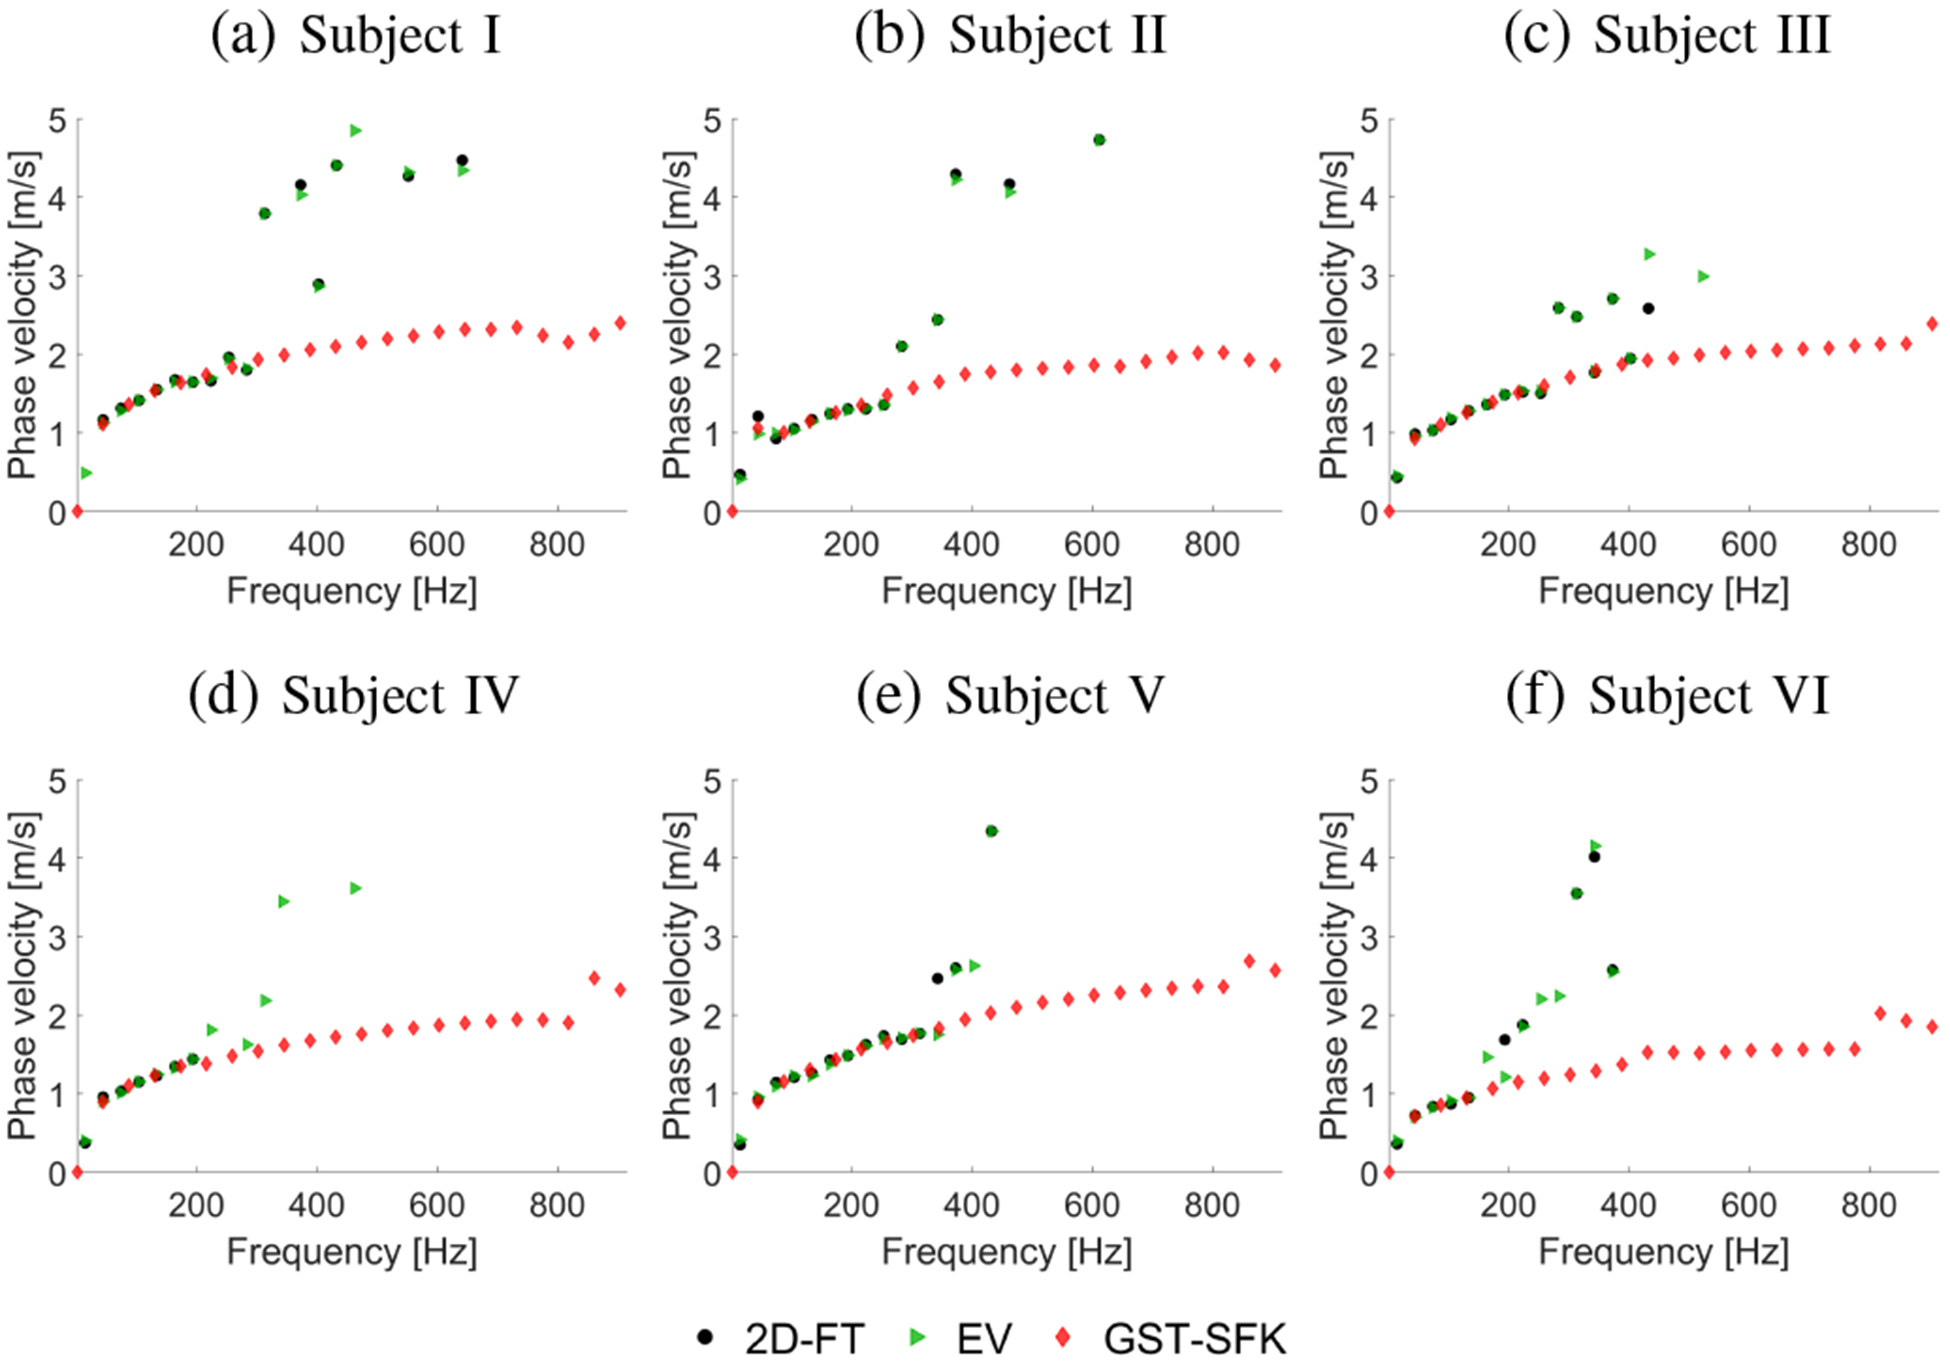
Phase velocity curves calculated for the 2D-FT (black dots), Eigenvector (green triangles), and GST-SFK (red diamonds) methods. Results were computed for the experimental, in vivo human liver studies, for (a) Subject I, (b) Subject II, (c) Subject III, (d) Subject IV, (e) Subject V, and (f) Subject VI.
V. Discussion
Dispersion curves, represented in wavenumber-frequency or velocity-frequency domains, play an important role when analyzing viscoelastic material properties of biological tissues. Many methods have been proposed for the dispersion relation estimation [17], [19]–[22]. Some of them offer better frequency resolution, and less variance than the other. Nevertheless, a frequency range for which the dispersion curves are being estimated is nearly the same.
In this work, we introduce a new method, called GST-SFK, for robust calculation of shear wave phase velocity in soft media and tissues. The GST-SFK approach was evaluated with shear wave particle velocity data induced by ARF in viscoelastic media using numerical models. One of the limitations of the numerical data used in this work is that the numerical models do not take into account displacement underestimation bias which arise during ultrasound motion detection. The performance of the GST-SFK method was compared with the 2D-FT and EV approaches for noisy (with added white Gaussian noise) data. Exemplary results are displayed in Figs. 3, 4 and 5, and Table I. The qualitative similarities between the numerical and experimental data can be observed. In addition, to supplement the numerical data, we investigated experimental data in viscoelastic phantoms, and ex vivo, and in vivo tissues.
The GST-SFK approach was further examined with four custom-made TM viscoelastic phantom experimental data. The results were in general similar for the 2D-FT, EV, and GST-SFK methods, for frequencies below 800 Hz. Above that range the GST-SFK approach outperformed other techniques giving robust dispersion curves for much longer frequency range, up to approximately 2000 Hz, in comparison to the other techniques. The usable bandwidth was extended more than two times which could be used in differentiation of viscoelastic materials at higher frequencies where separation may be more distinct due to dispersion.
The GST-SFK approach was also investigated using three ex vivo porcine livers data (Figs. 10 and 11) and six in vivo liver data (Figs. 13 and 14). For each data set examined extended usable bandwidth was observed. In addition, less scattered results were observed compared to the other two techniques.
High-resolution methods, like the EV approach, do not yield true power spectral density estimates as they do not preserve process power between the time and frequency domains. The 2D-FT and GST-SFK methods do yield true power spectral density estimates, and this information can be used for further processing if needed.
The GST-SFK method uses spectral decomposition combined with slant frequency wavenumber analysis. It uses the S-transform which combines strengths of the short time Fourier transform (STFT) [55], [56], and the continuous wavelet transform (CWT) [57] methods, and overcomes their shortcomings. The STFT can only be used in single resolution analysis and exhibits spectral smearing due to windowing. In addition, due to the fixed window width it cannot follow the signal dynamics correctly. The CWT is a multi-resolution method however, it produces a time-scale decomposition rather than a time-frequency decomposition. Furthermore, its temporal resolution is a function of frequency and is controlled by the range of the analyzing wavelets.
The S-transform on the other hand, is a multi-resolution method. The S-transform of a function h(t) is defined as a CWT with a particular mother wavelet multiplied by a phase factor of ei2πfτ [23]. It provides an extension of instantaneous frequency to broadband signals [23]. The phase of the S-transform referenced to the time origin provides additional information about spectra that is not available from locally referenced phase information in the CWT. It contains phase factors which entirely refer to local phase information of each signal component [23]. Phase measured by the S-transform is the localized value of absolute phase with respect to the Fourier spectrum [38]. The GST-SFK method uses the amplitude and phase spectrum of the S-transform, which enables to estimate the shear wave phase velocity. For more details about the relationship between the S-transform and the Wigner distribution, and wavelets readers are directed to [23], [58].
Another advantage of the GST-SFK approach is that the S-transform may be constructed using windows other than a Gaussian window. Hence, it is possible to design windows better suited to certain applications to improve temporal resolution, if needed. In our work, we used a generalized S-transform. Moreover, it can simultaneously estimate the local amplitude spectrum and the local phase spectrum.
In addition, the GST-SFK method uses the slant frequency-wavenumber transform to transform the data from the time-space domain to the frequency-phase velocity domain [24]. Thanks to the use of the generalized S-transform the approach excludes noise in the other time steps and reduces the spatial spectral leakage artifacts. Thus, the presented approach outperforms the 2D-FT and EV techniques and provides much more robust phase velocity estimates with expanded bandwidth.
There are some limitations of this method. The dispersion curve reconstructions, using a MATLAB (Mathworks, Natick, MA) implementation on a stand-alone PC, take approximately 10–15 seconds (depending on the input data size). This computational time is far from real time processing and may need improvement to implement the GST-SFK method on a clinical ultrasound scanner. For a comparison, the 2D-FT and EV methods take approximately 0.15 and 20 seconds, respectively. The computational time of the EV technique depends highly on the size of the autocorrelation matrix. The GST-SFK method, like other methods based on Fourier analysis, requires shear wave responses acquired over multiple laterally-spaced spatial points. This means that the resulting dispersion curves describe averaged material properties over a lateral segment. In practical applications, however, local properties are sought.
The presented work has some limitations that should be addressed in future work. First, we did not study other viscoelastic models than the KV model. It has been shown in multiple works in the literature, that the KV model does describe shear wave velocity dispersion over certain ranges of frequency. Moreover, in our manuscript we have multiple experimental data cases (for the TM phantoms, the ex vivo porcine liver data, and the in vivo human liver studies) which give an additional validation of our work especially as we have made comparisons of the phase velocities found using GST-SFK and the 2D-FT and EV methods. Second, we examined the GST-SFK method with data from viscoelastic homogeneous materials. It is anticipated that the GST-SFK method will also work for the layered materials where waves propagating in thin materials can undergo multiple reflections resulting in mode conversion. This, however, is beyond the scope of the present work.
One complication with the added bandwidth is that the dispersion curves may be measured closer to the Nyquist frequency, which for the measurements was 2.1 and 1.4 kHz for the phantom and in vivo cases, respectively. The acquisition parameters for the SWE experiment will need to take this added bandwidth into account.
Future work will be targeted to using the GST-SFK approach on experimental data from other in vivo tissue measurements to establish the robustness of the GST-SFK method and its limitations. Because, the GST-SFK method preserves power spectral density estimates its usage will be examined for other techniques, e.g. Local Phase Velocity Based Imaging (LPVI) [9], [59], [60].
VI. Conclusions
This work demonstrates a method for the evaluation of shear wave phase velocity dispersion curves based on the generalized S-transform and slant frequency-wavenumber analysis. The method was examined on numerical and experimental phantom data as well as ex vivo and in vivo experimental tissue data. Compared to the 2D-FT and EV methods, the GST-SFK approach achieved better performance and extended usable bandwidth by a factor of two or more. It could be used in differentiation of viscoelastic materials at higher frequencies where separation may be more distinct due to dispersion. The viscoelastic characterization of soft tissues will be studied in future work.
Supplementary Material
Acknowledgments
This work was supported by the Ministry of Science and Higher Education of Poland under agreement no. 0177/E-356/STYP/13/2018. The second author would like to acknowledge financial support from grant R01DK092255, from the National Institutes of Health. The content is solely the responsibility of authors and does not necessarily represent the official views of the National Institute of Diabetes and Digestive and Kidney Diseases or the National Institutes of Health.
VII. Appendix
Figure 15 shows the frequency-wavenumber (f-k) distribution reconstructed based on the (a) 2D-FT, and (b) GST-SFK methods, for shear wave particle velocity motion measurements. The f–k maps are normalized by wavenumber maxima in the frequency direction. Results were calculated for the experimental, custom-made TM viscoelastic phantoms A, B, C, and D.
Fig. 15:
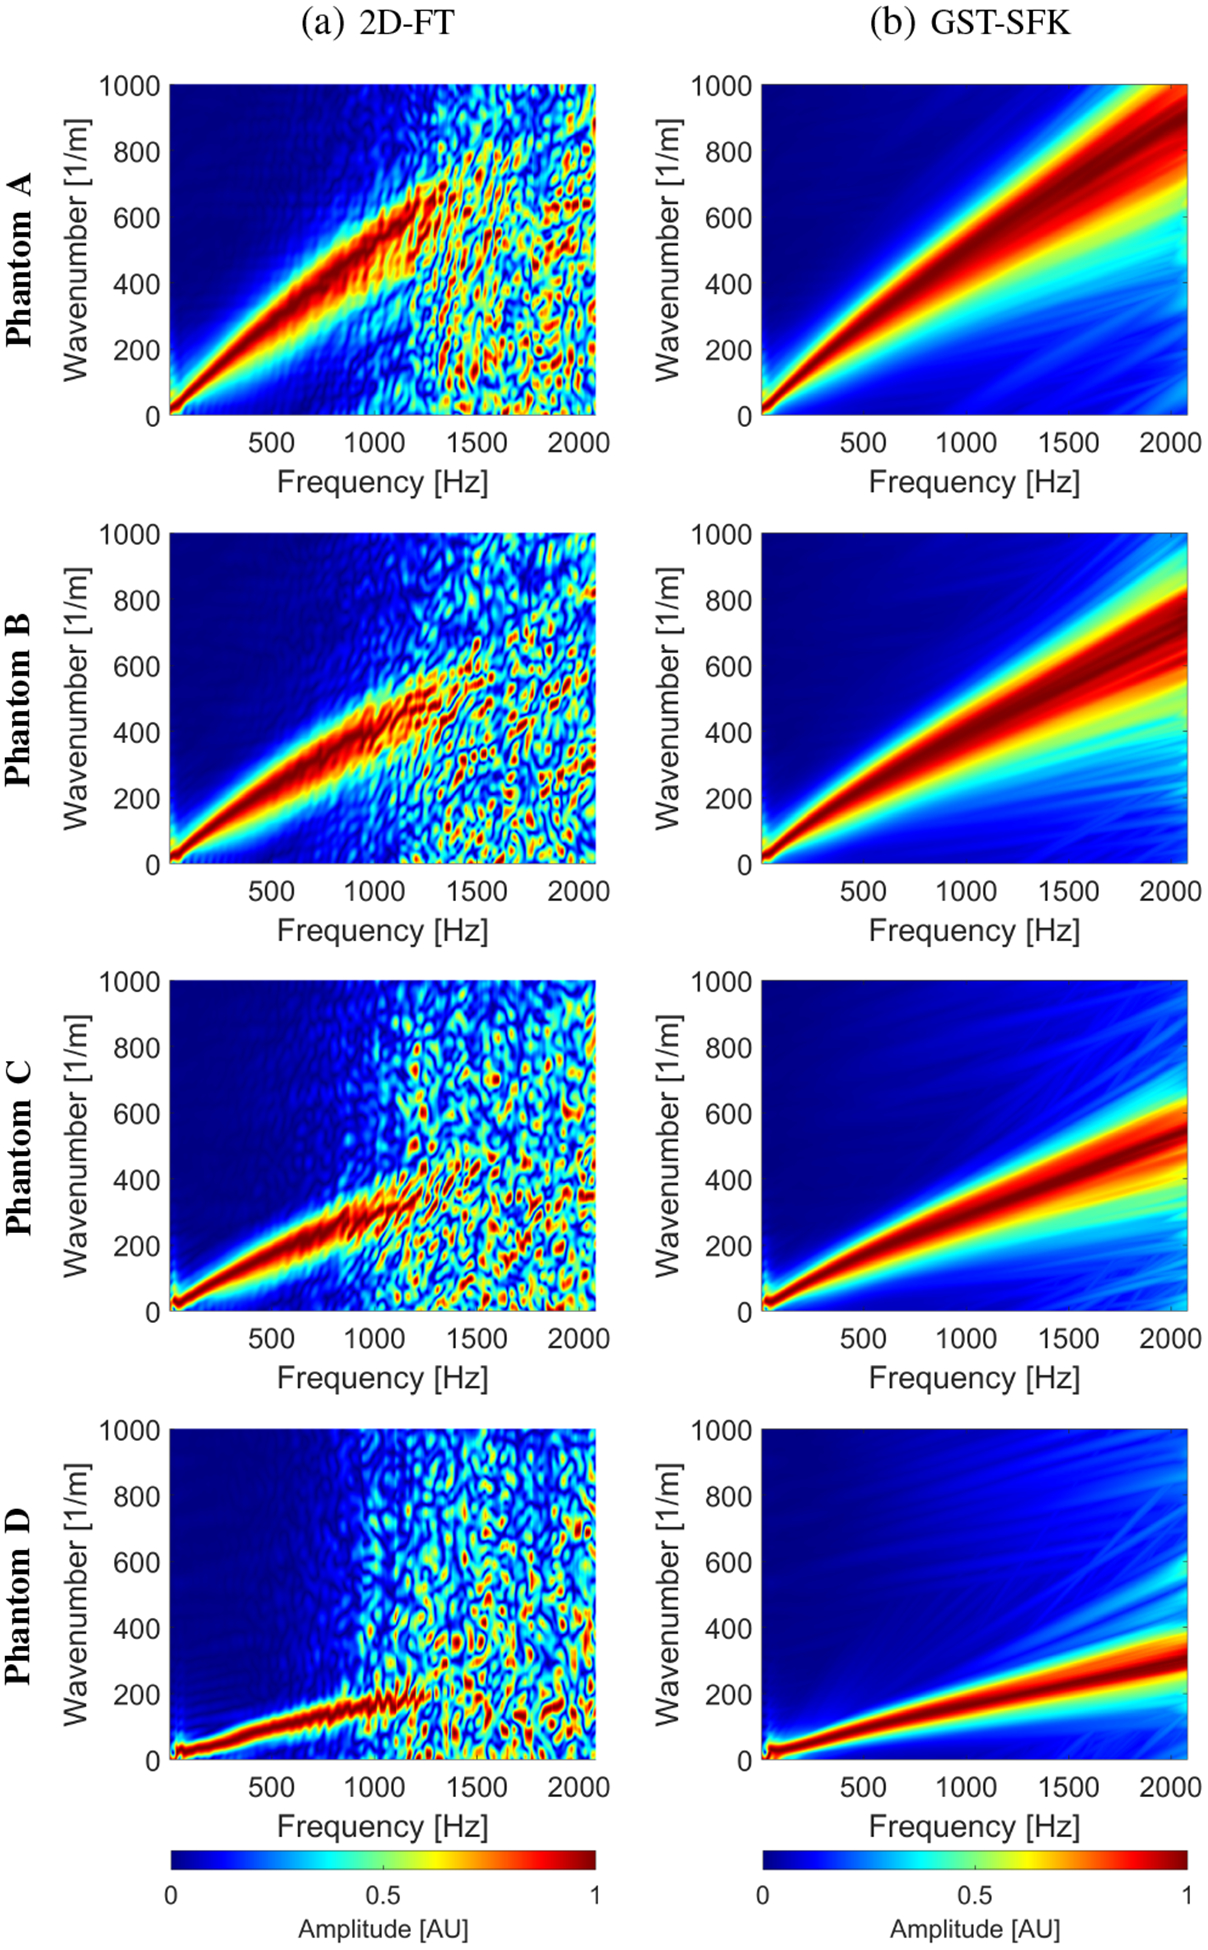
The frequency-wavenumber (f–k) distribution reconstructed based on the (a) 2D-FT, and (b) GST-SFK methods, for shear wave particle velocity motion measurements. The f–k maps are normalized by wavenumber maxima in the frequency direction. Results were calculated for the experimental, custom-made TM viscoelastic phantoms A, B, C, and D.
Footnotes
This paper has supplementary downloadable material available at http://ieeexplore.ieee.org, provided by the author.
Contributor Information
Piotr Kijanka, Department of Robotics and Mechatronics, AGH University of Science and Technology, 30-059 Krakow, Poland.
Matthew W. Urban, Department of Radiology, Mayo Clinic, Rochester, MN 55905 USA and also with the Department of Physiology and Biomedical Engineering, Mayo Clinic, Rochester, MN 55905 USA.
References
- [1].Sarvazyan A, Hall T, Urban M, Fatemi M, Aglyamov S, and Garra B, “Elasticity imaging-an emerging branch of medical imaging. An overview,” Curr. Med. Imaging Rev, vol. 7, no. 4, pp. 255–282, 2011. [DOI] [PMC free article] [PubMed] [Google Scholar]
- [2].Urban MW, “Production of acoustic radiation force using ultrasound: methods and applications,” Expert Review of Medical Devices, vol. 15, no. 11, pp. 819–834, 2018. [DOI] [PMC free article] [PubMed] [Google Scholar]
- [3].Nightingale K, McAleavey S, and Trahey G, “Shear-wave generation using acoustic radiation force: in vivo and ex vivo results,” Ultrasound in Medicine & Biology, vol. 29, no. 12, pp. 1715–1723, 2003. [DOI] [PubMed] [Google Scholar]
- [4].Montaldo G, Tanter M, Bercoff J, Benech N, and Fink M, “Coherent plane-wave compounding for very high frame rate ultrasonography and transient elastography,” IEEE Trans. Ultrason., Ferroelect., Freq. Control, vol. 56, no. 3, pp. 489–506, 2009. [DOI] [PubMed] [Google Scholar]
- [5].Zhu Y, Dong C, Yin Y, Chen X, Guo Y, Zheng Y, Shen Y, Wang T, Zhang X, and Chen S, “The role of viscosity estimation for oil-in-gelatin phantom in shear wave based ultrasound elastography,” Ultrasound in Medicine & Biology, vol. 41, no. 2, pp. 601–609, 2015. [DOI] [PubMed] [Google Scholar]
- [6].Parker KJ, Ormachea J, and Hah Z, “Group versus phase velocity of shear waves in soft tissues,” Ultrasonic Imaging, vol. 40, no. 6, pp. 343–356, 2018. [DOI] [PubMed] [Google Scholar]
- [7].Deffieux T, Montaldo G, Tanter M, and Fink M, “Shear wave spectroscopy for in vivo quantification of human soft tissues viscoelasticity,” IEEE Trans. Med. Imag, vol. 28, no. 3, pp. 313–322, 2009. [DOI] [PubMed] [Google Scholar]
- [8].Chen S, Urban MW, Pislaru C, Kinnick R, Zheng Y, Yao A, and Greenleaf JF, “Shearwave dispersion ultrasound vibrometry (SDUV) for measuring tissue elasticity and viscosity,” IEEE Trans. Ultrason., Ferroelect., Freq. Control, vol. 56, no. 1, pp. 55–62, 2009. [DOI] [PMC free article] [PubMed] [Google Scholar]
- [9].Kijanka P and Urban MW, “Local phase velocity based imaging (LPVI) of viscoelastic phantoms and tissues,” IEEE Trans. Ultrason., Ferroelect., Freq. Control, 2020. DOI: 10.1109/TUFFC.2020.2968147. [DOI] [PMC free article] [PubMed] [Google Scholar]
- [10].Rouze NC, Palmeri ML, and Nightingale KR, “An analytic, Fourier domain description of shear wave propagation in a viscoelastic medium using asymmetric Gaussian sources,” J. Acoust. Soc. Am, vol. 138, no. 2, pp. 1012–1022, 2015. [DOI] [PMC free article] [PubMed] [Google Scholar]
- [11].Nenadic IZ, Qiang B, Urban MW, Zhao H, Sanchez W, Greenleaf JF, and Chen S, “Attenuation measuring ultrasound shearwave elastography and in vivo application in post-transplant liver patients,” Physics in Medicine and Biology, vol. 62, no. 2, p. 484, 2016. [DOI] [PMC free article] [PubMed] [Google Scholar]
- [12].Kazemirad S, Bernard S, Hybois S, Tang A, and Cloutier G, “Ultrasound shear wave viscoelastography: Model-independent quantification of the complex shear modulus,” IEEE Trans. Ultrason., Ferroelect., Freq. Control, vol. 63, no. 9, pp. 1399–1408, 2016. [DOI] [PubMed] [Google Scholar]
- [13].Bernard S, Kazemirad S, and Cloutier G, “A frequency-shift method to measure shear-wave attenuation in soft tissues,” IEEE Trans. Ultrason., Ferroelect., Freq. Control, vol. 64, no. 3, pp. 514–524, 2017. [DOI] [PubMed] [Google Scholar]
- [14].Kijanka P and Urban MW, “Two-Point Frequency Shift Method for Shear Wave Attenuation Measurement,” IEEE Trans. Ultrason., Ferroelectr., Freq. Control, vol. 67, no. 3, pp. 483–496, 2020. [DOI] [PMC free article] [PubMed] [Google Scholar]
- [15].W Urban M, Chen S, and Fatemi M, “A review of shearwave dispersion ultrasound vibrometry (SDUV) and its applications,” Current Medical Imaging, vol. 8, no. 1, pp. 27–36, 2012. [DOI] [PMC free article] [PubMed] [Google Scholar]
- [16].Chen S, Sanchez W, Callstrom MR, Gorman B, Lewis JT, Sanderson SO, Greenleaf JF, Xie H, Shi Y, Pashley M, Shamdasani V, Lachman M, and Metz S, “Assessment of liver viscoelasticity by using shear waves induced by ultrasound radiation force,” Radiology, vol. 266, no. 3, pp. 964–970, 2013. [DOI] [PMC free article] [PubMed] [Google Scholar]
- [17].Nightingale KR, Rouze NC, Rosenzweig SJ, Wang MH, Abdelmalek MF, Guy CD, and Palmeri ML, “Derivation and analysis of viscoelastic properties in human liver: Impact of frequency on fibrosis and steatosis staging,” IEEE Trans. Ultrason., Ferroelect., Freq. Control, vol. 62, no. 1, pp. 165–175, 2015. [DOI] [PMC free article] [PubMed] [Google Scholar]
- [18].Tanter M, Bercoff J, Athanasiou A, Deffieux T, Gennisson J-L, Montaldo G, Muller M, Tardivon A, and Fink M, “Quantitative assessment of breast lesion viscoelasticity: initial clinical results using supersonic shear imaging,” Ultrasound in Medicine & Biology, vol. 34, no. 9, pp. 1373–1386, 2008. [DOI] [PubMed] [Google Scholar]
- [19].Chen S, Fatemi M, and Greenleaf JF, “Quantifying elasticity and viscosity from measurement of shear wave speed dispersion,” J. Acoust. Soc. Am, vol. 115, no. 6, pp. 2781–2785, 2004. [DOI] [PubMed] [Google Scholar]
- [20].Alleyne D and Cawley P, “A two-dimensional fourier transform method for the measurement of propagating multimode signals,” J. Acoust. Soc. Am, vol. 89, no. 3, pp. 1159–1168, 1991. [Google Scholar]
- [21].Kijanka P, Qiang B, Song P, Amador C, Chen S, and Urban MW, “Robust phase velocity dispersion estimation of viscoelastic materials used for medical applications based on the Multiple Signal Classification method,” IEEE Trans. Ultrason., Ferroelect., Freq. Control, vol. 65, no. 3, pp. 423–439, 2018. [DOI] [PMC free article] [PubMed] [Google Scholar]
- [22].Kijanka P, Ambrozinski L, and Urban MW, “Two point method for robust shear wave phase velocity dispersion estimation of viscoelastic materials,” Ultrasound in Medicine & Biology, vol. 45, no. 9, pp. 2540–2553, 2019. [DOI] [PMC free article] [PubMed] [Google Scholar]
- [23].Stockwell RG, Mansinha L, and Lowe R, “Localization of the complex spectrum: the S transform,” IEEE Transactions on Signal Processing, vol. 44, no. 4, pp. 998–1001, 1996. [Google Scholar]
- [24].Serdyukov AS, Yablokov AV, Duchkov AA, Azarov AA, and Baranov VD, “Slant f-k transform of multichannel seismic surface wave data,” Geophysics, vol. 84, no. 1, pp. A19–A24, 2019. [Google Scholar]
- [25].Varanini M, De Paolis G, Emdin M, Macerata A, Pola S, Cipriani M, and Marchesi C, “Spectral analysis of cardiovascular time series by the S-transform,” in Computers in Cardiology. IEEE, 1997, pp. 383–386. [Google Scholar]
- [26].Livanos G, Ranganathan N, and Jiang J, “Heart sound analysis using the S transform,” in Computers in Cardiology 2000. Vol. 27 (Cat. 00CH37163). IEEE, 2000, pp. 587–590. [Google Scholar]
- [27].Mansinha L, Stockwell R, Lowe R, Eramian M, and Schincariol R, “Local S-spectrum analysis of 1-D and 2-D data,” Physics of the Earth and Planetary Interiors, vol. 103, no. 3–4, pp. 329–336, 1997. [Google Scholar]
- [28].Theophanis S and Queen J, “Color display of the localized spectrum,” Geophysics, vol. 65, no. 4, pp. 1330–1340, 2000. [Google Scholar]
- [29].Chu PC, “The S-transform for obtaining localized spectra,” Mar. Technol. Soc. J, vol. 29, pp. 28–38, 1996. [Google Scholar]
- [30].Eramian M, Schincariol R, Mansinha L, and Stockwell R, “Generation of aquifer heterogeneity maps using two-dimensional spectral texture segmentation techniques,” Mathematical Geology, vol. 31, no. 3, pp. 327–348, 1999. [Google Scholar]
- [31].Stockwell RG, S-transform analysis of gravity wave activity from a small scale network of airglow imagers, 2000. [Google Scholar]
- [32].McFADDEN PD, Cook J, and Forster L, “Decomposition of gear vibration signals by the generalised S transform,” Mechanical Systems and Signal Processing, vol. 13, no. 5, pp. 691–707, 1999. [Google Scholar]
- [33].Johnson D and DeGraaf S, “Improving the resolution of bearing in passive sonar arrays by eigenvalue analysis,” IEEE Trans. Acoust., Speech, Signal Process, vol. 30, no. 4, pp. 638–647, 1982. [Google Scholar]
- [34].Kijanka P and Urban MW, “Dispersion curve calculation in viscoelastic tissue-mimicking materials using non-parametric, parametric, and high-resolution methods,” Ultrasonics, vol. 109, p. 106257, 2020. [DOI] [PMC free article] [PubMed] [Google Scholar]
- [35].Schmidt R, “Multiple emitter location and signal parameter estimation,” IEEE Transactions on Antennas and Propagation, vol. 34, no. 3, pp. 276–280, 1986. [Google Scholar]
- [36].Hayes MH, Statistical digital signal processing and modeling. John Wiley & Sons, 1996. [Google Scholar]
- [37].Williams DB and Madisetti V, Digital signal processing Handbook. CRC Press, Inc., 1997. [Google Scholar]
- [38].Pinnegar CR and Mansinha L, “The S-transform with windows of arbitrary and varying shape,” Geophysics, vol. 68, no. 1, pp. 381–385, 2003. [Google Scholar]
- [39].Sejdić E, Djurović I, and Jiang J, “A window width optimized S-transform,” EURASIP Journal on Advances in Signal Processing, vol. 2008, no. 1, p. 672941, 2007. [Google Scholar]
- [40].Askari R and Ferguson RJ, “Dispersion and the dissipative characteristics of surface waves in the generalized S-transform domain,” Geophysics, vol. 77, no. 1, pp. V11–V20, 2012. [Google Scholar]
- [41].Li D and Castagna J, “Modified s-transform in time-frequency analysis of seismic data,” in SEG Technical Program Expanded Abstracts 2013. Society of Exploration Geophysicists, 2013, pp. 4629–4634. [Google Scholar]
- [42].Reddy MV and Sodhi R, “A modified S-transform and random forests-based power quality assessment framework,” IEEE Transactions on Instrumentation and Measurement, vol. 67, no. 1, pp. 78–89, 2017. [Google Scholar]
- [43].Wu L and Castagna J, “S-transform and fourier transform frequency spectra of broadband seismic signals,” Geophysics, vol. 82, no. 5, pp. O71–O81, 2017. [Google Scholar]
- [44].Virieux J, “P-SV wave propagation in heterogeneous media: Velocity-stress finite-difference method,” Geophysics, vol. 51, no. 4, pp. 889–901, 1986. [Google Scholar]
- [45].Drossaert FH and Giannopoulos A, “A nonsplit complex frequency-shifted PML based on recursive integration for FDTD modeling of elastic waves,” Geophysics, vol. 72, no. 2, pp. T9–T17, 2007. [Google Scholar]
- [46].Zeng X and McGough RJ, “Evaluation of the angular spectrum approach for simulations of near-field pressures,” J. Acoust. Soc. Am, vol. 123, no. 1, pp. 68–76, 2008. [DOI] [PMC free article] [PubMed] [Google Scholar]
- [47].Chen D and McGough RJ, “A 2D fast near-field method for calculating near-field pressures generated by apodized rectangular pistons,” J. Acoust. Soc. Am, vol. 124, no. 3, pp. 1526–1537, 2008. [DOI] [PMC free article] [PubMed] [Google Scholar]
- [48].FOCUS, “Fast Object-Oriented C++ Ultrasound Simulator,” https://www.egr.msu.edu/~fultras-web/, 2019. [Google Scholar]
- [49].Catheline S, Gennisson J-L, Delon G, Fink M, Sinkus R, Abouelkaram S, and Culioli J, “Measurement of viscoelastic properties of homogeneous soft solid using transient elastography: an inverse problem approach,” J. Acoust. Soc. Am, vol. 116, no. 6, pp. 3734–3741, 2004. [DOI] [PubMed] [Google Scholar]
- [50].Gennisson J-L, Deffieux T, Macé E, Montaldo G, Fink M, and Tanter M, “Viscoelastic and anisotropic mechanical properties of in vivo muscle tissue assessed by supersonic shear imaging,” Ultrasound in Medicine & Biology, vol. 36, no. 5, pp. 789–801, 2010. [DOI] [PubMed] [Google Scholar]
- [51].Amador C, Urban M, Kinnick R, Chen S, and Greenleaf JF, “In vivo swine kidney viscoelasticity during acute gradual decrease in renal blood flow: pilot study,” Revista Ingeniería Biomédica, vol. 7, no. 13, pp. 68–78, 2013. [PMC free article] [PubMed] [Google Scholar]
- [52].Nguyen MM, Zhou S, Robert J.-l., Shamdasani V, and Xie H, “Development of oil-in-gelatin phantoms for viscoelasticity measurement in ultrasound shear wave elastography,” Ultrasound in Medicine & Biology, vol. 40, no. 1, pp. 168–176, 2014. [DOI] [PubMed] [Google Scholar]
- [53].Palmeri M, Nightingale K, Fielding S, Rouze N, Deng Y, Lynch T, Chen S, Song P, Urban M, Xie H et al. , “RSNA QIBA ultrasound shear wave speed Phase II phantom study in viscoelastic media,” in Ultrasonics Symposium (IUS). IEEE, 2015, pp. 1–4. [Google Scholar]
- [54].Kasai C, Namekawa K, Koyano A, and Omoto R, “Real-time two-dimensional blood flow imaging using an autocorrelation technique,” IEEE Trans. Sonics Ultrason, vol. 32, no. 3, pp. 458–464, 1985. [Google Scholar]
- [55].Gabor D, “Theory of communication. Part 1: The analysis of information,” Journal of the Institution of Electrical Engineers-Part III: Radio and Communication Engineering, vol. 93, no. 26, pp. 429–441, 1946. [Google Scholar]
- [56].Cohen L, Time-frequency analysis. Prentice hall, 1995, vol. 778. [Google Scholar]
- [57].Chakraborty A and Okaya D, “Frequency-time decomposition of seismic data using wavelet-based methods,” Geophysics, vol. 60, no. 6, pp. 1906–1916, 1995. [Google Scholar]
- [58].Stockwell RG, “A basis for efficient representation of the S-transform,” Digital Signal Processing, vol. 17, no. 1, pp. 371–393, 2007. [Google Scholar]
- [59].Kijanka P and Urban MW, “Local Phase Velocity Based Imaging (LPVI): A New Technique Used For Ultrasound Shear Wave Elastography,” IEEE Trans. Med. Imag, vol. 38, no. 4, pp. 894–908, 2019. [DOI] [PMC free article] [PubMed] [Google Scholar]
- [60].Kijanka P and Urban MW, “Fast Local Phase Velocity-Based Imaging: Shear Wave Particle Velocity and Displacement Motion Study,” IEEE Trans. Ultrason., Ferroelectr., Freq. Control, vol. 67, no. 3, pp. 526–537, 2019. [DOI] [PMC free article] [PubMed] [Google Scholar]
Associated Data
This section collects any data citations, data availability statements, or supplementary materials included in this article.


