Abstract
Several studies have reported that tissue‐resident memory T cells (TRM cells) or tertiary lymphoid structures (TLSs) are associated with a good prognosis. The aim of this study was to clarify the association of TRM cells and TLSs in the tumor immune microenvironment in gastric cancer (GC). We performed immunohistochemical and immunofluorescence staining to detect the presence of CD103+ T cells and to assess the association between CD103+ T cells and TLSs. CD103+ T cells were observed in the tumor epithelium accompanied by CD8+ T cells and were associated with a better prognosis in GC. Furthermore, CD103+ T cells were located around TLSs, and patients with CD103high had more rich TLSs. Patients who had both CD103high cells and who were TLS‐rich had a better prognosis than patients with CD103low cells and who were TLS‐poor. Moreover, for patients who received PD‐1 blockade therapy, CD103high and TLS‐rich predicted a good response. Flow cytometry was performed to confirm the characteristics of CD103+CD8+ T cells and showed that CD103+CD8+ T cells in GC expressed higher levels of PD‐1, granzyme B, and interferon‐γ than CD103−CD8+ T cells. Our results suggested that CD103+CD8+ cells in GC are correlated with TLSs, resulting in enhanced antitumor immunity in GC.
Keywords: antitumor immunity, CD103, gastric cancer, tertiary lymphoid structure, tissue‐resident memory T cell
Many CD103+ T cells were observed in the tumor epithelium accompanied by CD8+ T cells and were located around tertiary lymphoid structures (TLSs). Patients with a combination of CD103high and TLS‐rich had a good prognosis.

1. INTRODUCTION
The emergence of immunotherapy, especially immune checkpoint blockade of programmed death 1 (PD‐1), has changed the landscape of advanced gastric cancer (GC). 1 Immunotherapy is thought to enhance the antitumor response of cytotoxic T lymphocytes, ie CD8+ tumor‐infiltrating lymphocytes (TILs). 2 CD8+ TILs are important in antitumor immunity and are associated with a good prognosis in many different types of tumors. 3 , 4 , 5 Whether TILs can be evaluated with CD8 remains an open question. CD8+ T cells also include terminal exhausted T cells, not all of which are activated.
Recently, tissue‐resident memory T cells (TRM cells) have attracted much attention. These cells reside in the tissue and do not circulate back to the blood or secondary lymphoid organs. 6 , 7 , 8 These cells are defined by expression of CD103, which binds to the epithelial cell marker E‐cadherin. 6 CD8+ T cells that express CD103 are associated with improved survival in some cancers of epithelial origin. 9 , 10 , 11 , 12 , 13
We need to clarify where TILs are induced. In general, tumor‐infiltrating CD8+ T cells are thought to be derived from lymphoid tissue. Dendritic cells that have acquired tumor antigens migrate to lymph nodes, and present antigen to naive T cells, and then T cells migrate into the blood vessels and reinvade the tumor. Conversely, we have observed a decrease in the antigen‐presenting capacity of dendritic cells and a decrease in effector T cells in regional lymph nodes, suggesting that regional lymph nodes are not necessary to induce TILs. 14 B cells form clusters with T cells, CD21+ follicular dendritic cells, and high endothelial venules. These aggregates of immune cells are referred to as tertiary lymphoid structures (TLSs). The presence of these structures in tumors is associated with a better prognosis. 15 , 16 TLSs are associated with activation of the antitumor immune response, 17 , 18 and the combination of the presence of TLSs and CD8+ T cell infiltration is associated with superior prognosis. 19 We showed that TLSs are commonly present in GC tissues and are associated with a favorable prognosis and that the presence of TLSs is positively correlated with tumor‐infiltrating CD8+ T cells. 20 , 21 Based on these results, we hypothesized that TLSs induce TILs by sensitizing naive T cells with antigen. Furthermore, Workel et al recently showed that TRM cells are associated with TLS formation, 22 and several studies reported that TRM cells or TLSs may be a target of PD‐1 blockade. 12 , 23 Therefore, we considered that examining the association of these immune cells is important for the strategy of immunotherapy.
The aim of this study was to investigate the clinical significance of CD103+ T cells infiltrating into GC and their association with TLSs, to determine the dynamics of infiltrating effector T cells in GC.
2. MATERIALS AND METHODS
2.1. Patients and samples
Tumor samples were obtained from 261 patients with primary GC who underwent initial surgical resection at Osaka City University Hospital between 2014 and 2017. The tumor samples with the deepest invaded site of the tumor were selected for immunohistochemistry. Patients who underwent additional resection after endoscopic submucosal resection and chemotherapy were excluded. For 64 of 261 patients with advanced lymph node metastasis (pathological N2 or higher), metastatic lymph nodes near the primary tumor were used for immunohistochemistry. Pathological TNM staging was diagnosed histologically based on the 7th Edition of the Union for International Cancer Control TNM classification. The histological type was determined based on the 14th Edition of the Japanese Classification of Gastric Cancer. Differentiated (well differentiated, moderately differentiated and papillary adenocarcinoma) and undifferentiated types (poorly differentiated, mucinous adenocarcinoma and signet‐ring cell carcinoma) were defined according to the predominant histological type in the tumor. This study was performed according to the Declaration of Helsinki and was approved by the Osaka City University Ethics Committee. Informed consent was obtained from all patients.
2.2. Immunohistochemistry
Tumor specimens in paraffin‐embedded blocks were cut into 4‐µm‐thick sections. Nonspecific binding was blocked using nonspecific staining blocking reagent (Dako, Agilent Technologies, Inc). The sections were then reacted with rabbit monoclonal anti‐CD103 antibody (clone: EPR4166 (2); 1/1000; Abcam), mouse anti‐CD8 antibody (clone: C8/144; 1/250; Dako), mouse anti‐CD20 antibody (clone: L26; prediluted; Dako, Agilent Technologies, Inc), or rabbit anti‐CD4 antibody (clone: EPR6855; 1/250; Abcam) at 4°C overnight. Sections were incubated with secondary antibody for 10 min at room temperature. After washing in phosphate‐buffered saline, the sections were visualized using 3‐3′‐diamino‐benzidine for 5 min and counterstained with hematoxylin.
2.3. Evaluation of immunohistochemical staining
Tumor sections stained with anti‐CD103, anti‐CD8 and anti‐CD4 antibody were scanned at ×200 magnification, and the 5 most representative high‐power fields, regardless of tumor location, were randomly selected and included intratumoral CD103+, CD8+, and CD4+ cells. Regarding lymph nodes, we selected the metastatic lymph node with the highest number of CD103+ cells. We calculated the average number of CD103+, CD8+, and CD4+ cells in 5 fields. Tumor sections stained with anti‐CD20 antibody were scanned at ×20 magnification to select 3 fields with the greatest area of intratumoral and peritumoral CD20+ cells, and the percentage area (%) of each field with CD20+ cells was calculated using ImageJ software (NIH). All microscopic images were imported from the digital photo filing system DP‐73 (Olympus) and were then reviewed and confirmed by a pathologist who was blinded to the clinical information.
The cut‐off values obtained from a receiver operating characteristic (ROC) curve for postoperative recurrence as state variables were determined. Each ROC curve is shown in Figure 1. The cut‐off value of CD103+ T cells was 19.6 per field, that of CD8+ T cells was 42.0 per field, and that of CD20+ B cells was 1.59 per field. We divided the patients into 2 groups according to the cut‐off value: CD103high (n = 170) and CD103low (n = 91), CD8high (n = 153) and CD8low (n = 108), and TLS‐rich (n = 123) and TLS‐poor (n = 138).
FIGURE 1.

ROC curve of CD103+ T cells, CD8+ T cells and CD20+ B cells. The cut‐off value of CD103+ T cells was 19.6/field (AUC = 0.708, 95% CI: 0.637‐0.780), that of CD8+ T cells was 42.0/field (AUC = 0.617, 95% CI: 0.538‐0.697), and that of CD20+ B cells was 1.59/field (AUC = 0.658, 95% CI: 0.582‐0.733). AUC, area under the curve; CI, confidence interval
2.4. Immunofluorescence staining of tissue sections
Tumor specimens in paraffin‐embedded blocks were cut into 4‐µm‐thick sections. Nonspecific binding was blocked using nonspecific staining blocking reagent (Dako). The sections were incubated with rabbit monoclonal anti‐CD103 antibody (clone: EPR4166 (2); 1/1000; Abcam), mouse monoclonal anti‐CD8 antibody (clone: C8/144; 1/250; Dako), mouse anti‐CD20 antibody (clone: L26, prediluted; Dako, Agilent Technologies, Inc) and mouse anti‐CD11c antibody (cat. no. ab215858; 1/100; Abcam) at 4°C overnight. The sections were subsequently incubated with Alexa Fluor 488‐labeled goat polyclonal anti‐mouse IgG antibody (cat. no. ab150113; 1/1000; Abcam) and Alexa Fluor 647‐labeled goat polyclonal anti‐rabbit IgG antibody (cat. no. ab150079; 1/1000; Abcam) for 1 h at room temperature. The sections were covered with glass using ProLong™ Gold antifade reagent with DAPI (cat. no. P36935; Invitrogen/Thermo Fisher Scientific). Digital images were taken with an all‐in‐one fluorescence microscope (BZ‐8000; Keyence).
2.5. Flow cytometry
Single‐cell suspensions isolated from 6 patients with GC were stained for surface and intracellular markers for flow cytometry analysis. Briefly, tumor tissues were minced and digested with type I collagenase (1 mg/mL; Sigma) in DMEM at 37°C for 30 min. Subsequently, the dispersed cells were filtered through a 70‐μm filter and washed with phosphate‐buffered saline.
CD8+ TILs were isolated from the single‐cell suspensions using the REALease® CD8 (TIL) MicroBead Kit (Miltenyi Biotec) according to the manufacturer's instructions and then were stained with the following antibodies: anti‐CD8‐PE (clone: RPA‐T8; BD Biosciences), anti‐CD103‐BV421 (clone: Ber‐ACT8; BD Biosciences), anti‐PD‐1‐APC (clone: MIH4; BD Biosciences).
To measure cytokine production by T cells, CD8+ TILs were stimulated in LymphoONE T‐Cell Expansion Xeno‐Free Medium (cat. no. WK552S; TaKaRa Bio) in combination with RetroNectin (25 μg/mL; cat. no. T100A; TaKaRa Bio), anti‐CD3 (5 μg/mL; clone: OCK3; TaKaRa Bio), and recombinant interleukin‐2 (200 U/mL; cat. no. 200‐02; PeproTech), according to the manufacturer's instructions. After 48 h of incubation, cells were collected, permeabilized and fixed using the Fixation/Permeabilization Solution (BD Biosciences) on ice for 20 min. Cells were then washed with Perm/Wash TM Buffer (BD Biosciences) and stained with anti‐granzyme B‐Alexa Fluor 647 (clone: GB11; BD Biosciences) and anti‐interferon (IFN)‐γ‐BV 480 (clone: B27; BD Biosciences) at 4°C for 30 min.
To measure T cell apoptosis, cells were stained with Fixable Viability Stain 620 (cat. no. 564996; BD Biosciences). Flow cytometry data were acquired using FACS AriaIII (BD Bioscience) and were analyzed with FlowJo version 10.
2.6. Statistical analysis
Statistical analysis other than ROC curve analysis was performed with JMP 14 software (SAS Institute). ROC curve analysis was performed with SPSS software v.22 (SPSS Japan). The Mann‐Whitney test was used to assess the associations between the expression of CD103 and CD8 and clinicopathological features. Overall survival (OS) and relapse‐free survival (RFS) curves were calculated with the Kaplan‐Meier method, and significant differences in survival were determined using the log‐rank test. The day of surgery was used as the starting point for the measurement of OS. RFS is defined as the time between the day of surgery and recurrence. A Cox proportional hazard model was used for univariate and multivariate analyses of prognostic factors. For all other experiments, data were compared using two‐tailed Student t test. P‐values of <.05 were considered statistically significant.
3. RESULTS
3.1. CD103+CD8+ T cells were present in GC
With immunohistochemistry, most CD8+ T cells were located within the tumor stroma. Conversely, CD103+ T cells had infiltrated not only into the tumor stroma but also into the epithelial regions of tumors and were considered TRM cells (Figure 2A). In patients with the undifferentiated type, CD103+ T cells were observed (Figure 2B). Some CD8+ T cells were observed in the epithelial regions of the tumor. Immunofluorescence double staining for CD8 and CD103 showed that many CD103+ T cells were CD8+ (Figure 2C, white arrow). In particular, CD103+ T cells invading the tumor epithelium were CD8+. These results indicate that CD103+CD8+ T cells were one subtype of CD8+ T cells. This was confirmed with fluorescence activated cell sorting analysis of tumor tissue and by the fact that about 70% of CD8+ T cells were CD103+ (Figure 2D).
FIGURE 2.
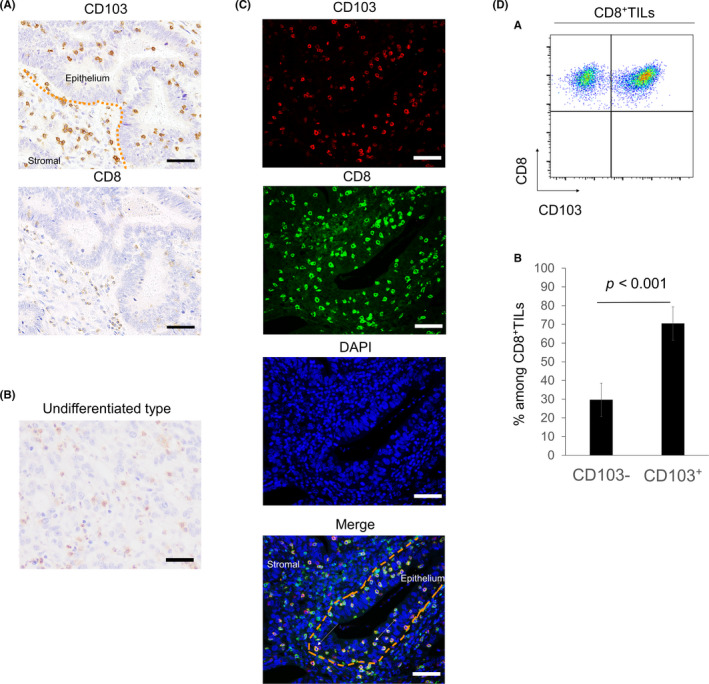
Distribution of CD103+ and CD8+ T cells in tumor tissues of GC with immunohistochemical and immunofluorescence staining. A, Tumor sections from 261 patients with GC were stained with anti‐CD103 and anti‐CD8 antibodies. Representative images of CD103 and CD8 immunostaining of the same tumor area are shown. Scale bars, 50 μm. B, Representative image of CD103 staining in the undifferentiated type. Scale bar, 50 μm. C, Representative images of immunofluorescence staining of CD103 (red), CD8 (green), and DAPI (blue) are shown. CD103+CD8+ T cells were observed not only in the tumor stroma but also in the tumor epithelium (white arrows). Scale bars, 50 μm. D, a, Representative pseudocolor plots of CD8+ TILs. D, b, The mean ± standard error of the proportion of CD103+ and CD103− T cells from 5 tumors. CD103+CD8+ T cells accounted for 69.8% of CD8+ TILs
3.2. Clinicopathological characteristics of CD103+ T cells or CD8+ T cells
The association between the number of CD103+ or CD8+ T cells and the clinicopathological features is shown in Table 1. The difference between CD103+ T cells and CD8+ T cells is that CD103+ T cells were associated with cancer progression and tended to be more frequent in stage III or IV advanced cases. The infiltration of CD103+ T cells was decreased especially in cases with high lymph node metastasis and cases with positive lymphatic invasion. CD103+ T cells tended to be low even in Borrmann type 4 with extensive fibrotic stroma.
TABLE 1.
Correlations between clinicopathological factors and CD103+/CD8+ T cell infiltration
| N | CD103+ T cell | CD8+ T cell | |||||
|---|---|---|---|---|---|---|---|
| Low | High | P‐value | Low | High | P‐value | ||
| Age | |||||||
| <70 y | 126 | 45 | 81 | .687 | 51 | 75 | .776 |
| ≥70 y | 135 | 45 | 90 | 57 | 78 | ||
| Gender | |||||||
| Female | 79 | 29 | 50 | .612 | 35 | 44 | .529 |
| Male | 182 | 61 | 121 | 73 | 109 | ||
| Histology | |||||||
| Differentiated | 142 | 40 | 102 | .019 | 54 | 88 | .231 |
| Undifferentiated | 119 | 50 | 69 | 54 | 65 | ||
| pT category | |||||||
| T1 | 84 | 20 | 64 | <.001 | 29 | 55 | .029 |
| T2 | 41 | 11 | 30 | 17 | 24 | ||
| T3 | 73 | 23 | 50 | 27 | 46 | ||
| T4 | 63 | 36 | 27 | 35 | 28 | ||
| pN category | |||||||
| N 0 | 126 | 31 | 95 | .001 | 46 | 80 | .124 |
| N 1‐3 | 135 | 59 | 76 | 62 | 73 | ||
| pStage | |||||||
| Stage I | 101 | 22 | 79 | <.001 | 35 | 66 | .149 |
| Stage II | 59 | 20 | 39 | 28 | 31 | ||
| Stage III | 70 | 30 | 40 | 30 | 40 | ||
| Stage IV | 31 | 18 | 13 | 15 | 16 | ||
| Lymphatic invasion | |||||||
| − | 112 | 31 | 81 | .045 | 41 | 71 | .176 |
| + | 149 | 59 | 90 | 67 | 82 | ||
| Venous invasion | |||||||
| − | 164 | 54 | 110 | .494 | 70 | 94 | .580 |
| + | 97 | 36 | 61 | 38 | 59 | ||
3.3. Intratumoral CD103+ T cells predicted a better prognosis in GC
We evaluated the prognostic impact of CD103+ T cells in GC. Kaplan‐Meier analysis showed that CD103high was associated with improved OS in all patients and improved RFS in patients except stage IV (Figure 3A,a,b; P < .0001 for both). Prognosis of stage II, III and IV patients with CD103high was better than in those with CD103low (Figure 3B,b‐d, P = .015, P = .034, and P = .0229, respectively). With univariate analysis, we identified several prognostic factors including pathological T category, pathological lymph node metastasis, pathological stage, lymphatic invasion, venous invasion, high CD103 infiltration, high CD8 infiltration, and TLS‐rich. With multivariate analysis, pathological stage, venous invasion, and high CD103 infiltration were independently associated with OS (Table 2). We examined the relationship between the number of tumor‐infiltrating CD103+ T cells and the prognosis of patients with advanced lymph node metastasis in both the primary tumor and lymph nodes. The results showed that infiltration of CD103+ T cells in the primary tumor was associated with a favorable prognosis, but no difference was found in intra‐lymph node metastasis (Figure S1). We found no difference among lymph node size, localization, and primary GC position. These results indicated that the presence of CD103+ T cells in the tumor microenvironment was more important than their presence in lymph nodes.
FIGURE 3.
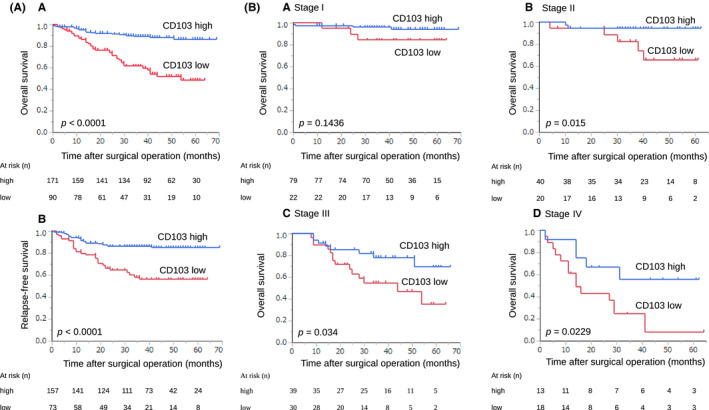
Prognostic impact of CD103+ T cells in GC. A, Kaplan‐Meier plots using the log‐rank test for OS and RFS according to the number of CD103+ T cells. Patients with CD103high had a better prognosis than those with CD103low (a: OS; P < .0001, b: RFS; P < .0001). B, Kaplan‐Meier plots using the log‐rank test for OS according to the number of CD103+ T cells in different pathological stages. Prognosis of stage II, III, and IV patients with CD103high was better than in those with CD103low
TABLE 2.
Univariate and multivariate analysis of prognostic factors in gastric cancer
| Variable | Overall survival | |||
|---|---|---|---|---|
| Univariate analysis | Multivariate analysis | |||
| Hazard ratio (95% CI) | P‐value | Hazard ratio (95% CI) | P‐value | |
| Age (<70 y/≥70 y) | 1.153 (0.886‐2.628) | .132 | ||
| Sex (male/female) | 0.683 (0.398‐1.198) | .172 | ||
| Histological type (differentiated/undifferentiated) | 0.763 (0.445‐1.302) | .320 | ||
| pT (T1‐2/T3‐4) | 4.539 (2.423‐9.274) | <.001 | ||
| pN (N0/N1‐3) | 3.868 (2.102‐7.686) | <.001 | ||
| pStage (I + Ⅱ/III + Ⅳ) | 5.940 (3.305‐11.33) | <.001 | 3.276 (1.71‐6.606) | <.001* |
| Lymphatic invasion (ly−/ly+) | 2.248 (1.265‐4.211) | .008 | ||
| Venous invasion (v−/v+) | 3.664 (2.119‐6.553) | <.001 | 2.599 (1.437‐4.852) | .002* |
| CD103 (low/high) | 0.240 (0.135‐0.415) | <.001 | 0.287 (0.139‐0.581) | <.001* |
| CD8 (low/high) | 0.495 (0.289‐0.838) | .009 | 1.094 (0.561‐2.102) | .788 |
| TLS (poor/rich) | 0.329 (0.173‐0.587) | <.001 | 0.549 (0.283‐1.005) | .061 |
Abbreviations: CI, confidence interval; pN, pathological lymph node metastasis; pT, pathological T category; TLS, tertiary lymphoid structure.
3.4. Infiltration of CD103+ T cells is associated with infiltration of CD8+ T cells
We assessed the association between CD103+ and CD8+ T cells and found that the number of CD103+ and CD8+ T cells was positively correlated (Figure 4A, r = .52, P < .0001). When considering the combination of CD103+ and CD8+ T cells, patients with CD103high and CD8high cells had a significantly better prognosis than those with any other combination (Figure 4B, P < .0001). For 39 patients with CD103high and CD8low, we performed immunohistochemistry using anti‐CD4 antibody. We divided these patients into 2 groups according to the median range (30.0 per field) and assessed the prognosis. The prognosis of patients with CD4low tended to be better than in those with CD4high (Figure 5A, P = .063). With immunofluorescence double staining with anti‐CD103 and anti‐CD11c antibodies, CD103+CD11c+ cells were rarely found (Figure 5B).
FIGURE 4.
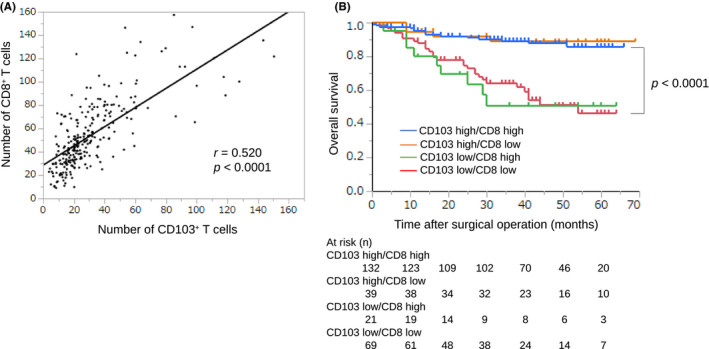
Association between the number of CD103+ and CD8+ T cells in GC. A, The correlation was analyzed using Spearman rank correlation coefficient, and the number of CD103+ T cells showed a strong positive correlation with the number of CD8+ T cells (r = .52, P < .0001). B, OS is shown with Kaplan‐Meier plots according to the combination of CD103+ and CD8+ T cells. Patients with CD103high and CD8high had a better prognosis than other groups. The log‐rank test was used to compare curves, and P < .05 was considered significant
FIGURE 5.
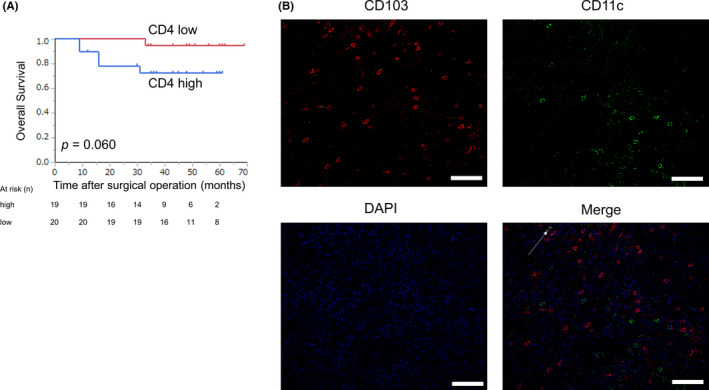
Prognostic impact of CD4+ T cells and the presence of CD103+CD11c+ cells in patients with CD103high and CD8low. A, Kaplan‐Meier plots using the log‐rank test for OS according to the number of CD4+ T cells in patients with CD103high and CD8low. Patients with CD4low tended to have a better prognosis than those with CD4high (P = .060). B, Representative images of immunofluorescence staining of CD103 (red), CD11c (green), and DAPI (blue) are shown. CD103+CD11c+ cells (white arrow) were rarely observed
3.5. CD103+CD8+ T cells express activation markers
To examine the function of CD103+CD8+ T cells, we analyzed the difference in cytokine production by CD103+CD8+ T cells isolated from 6 tumors with flow cytometry. CD103+CD8+ T cells in GC expressed higher levels of PD‐1, granzyme B, and IFN‐γ than CD103−CD8+ T cells (Figure 6).
FIGURE 6.
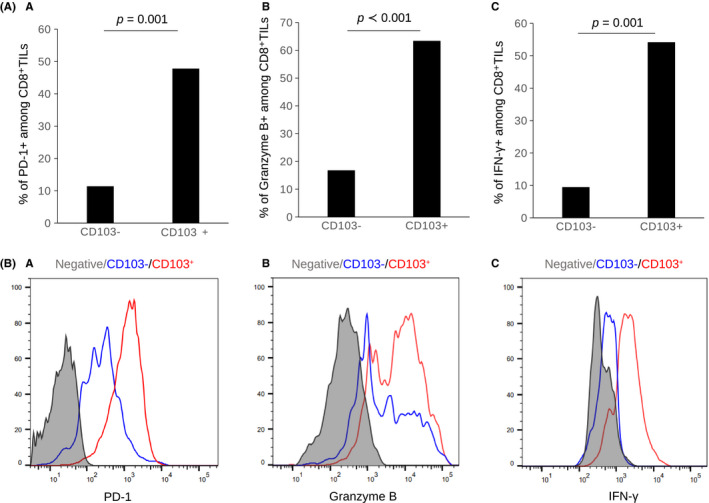
CD103+CD8+ T cells express activation markers. Flow cytometry analysis of expression of PD‐1, granzyme B, and IFN‐γ in CD103−CD8+ T cells and CD103+CD8+ T cells from 6 GC tumors. A, Bar graph of the proportion and (B) representative histograms of PD‐1, granzyme B, and IFN‐γ expression are shown. The bar graphs show the mean ± standard error. CD103+CD8+ T cells expressed higher levels of PD‐1, granzyme B, and IFN‐γ than CD103−CD8+ T cells
3.6. CD103+ T cells or TLSs are associated with response to PD‐1 blockade
Of 261 patients, 10 patients received PD‐1 blockade with nivolumab as third‐line treatment for recurrent or unresectable GC. The association between the number of CD103+ T cells or TLSs and the clinicopathological features is shown in Table 3. We evaluated the response in the target region to nivolumab according to the Response Evaluation Criteria in Solid Tumors guidelines. Partial response (PR) was observed in 2 patients, stable disease in 3 patients and progressive disease in 5 patients. CD103high or TLS‐rich predicted a better response to nivolumab than CD103low or TLS‐poor (P = .045 and P = .033). Furthermore, 2 patients with PR had both CD103high and TLS‐rich.
TABLE 3.
Correlations between response to PD‐1 blockade and CD103+ T cells/TLSs
| N | CD103+ T cell | TLS | |||||||
|---|---|---|---|---|---|---|---|---|---|
| Low | High | P‐value | Poor | Rich | P‐value | ||||
| Age | |||||||||
| <70 y | 4 | 4 | 0 | .091 | 3 | 1 | .778 | ||
| ≥70 y | 6 | 3 | 3 | 4 | 2 | ||||
| Gender | |||||||||
| Female | 3 | 3 | 0 | .175 | 2 | 1 | .88 | ||
| Male | 7 | 4 | 3 | 5 | 2 | ||||
| Histology | |||||||||
| Differentiated | 4 | 2 | 2 | .26 | 2 | 2 | .26 | ||
| Undifferentiated | 6 | 5 | 1 | 5 | 1 | ||||
| pT category | |||||||||
| T3 | 3 | 1 | 2 | .098 | 1 | 2 | .098 | ||
| T4 | 7 | 6 | 1 | 6 | 1 | ||||
| pStage | |||||||||
| Stage II | 1 | 0 | 1 | .24 | 0 | 1 | .033* | ||
| Stage III | 3 | 2 | 1 | 1 | 2 | ||||
| Stage IV | 6 | 5 | 1 | 6 | 0 | ||||
| Lymphatic invasion | |||||||||
| − | 2 | 0 | 2 | .016* | 0 | 2 | .016* | ||
| + | 8 | 7 | 1 | 7 | 1 | ||||
| Venous invasion | |||||||||
| − | 3 | 1 | 2 | .098 | 1 | 2 | .098 | ||
| + | 7 | 6 | 1 | 6 | 1 | ||||
| Response to nivolumab | |||||||||
| PR | 2 | 0 | 2 | .045* | 0 | 2 | .033* | ||
| SD | 3 | 3 | 0 | 2 | 1 | ||||
| PD | 5 | 4 | 1 | 5 | 0 | ||||
Abbreviations: PD, progressive disease; PR, partial response; SD, stable disease; TLS, tertiary lymphoid structure.
3.7. Association between CD103+ T cells and TLSs
Immunohistochemistry using anti‐CD103 antibody showed that CD103+ T cells were scattered around areas of lymphocyte aggregation as seen with anti‐CD20 staining; these aggregates were considered TLSs (Figure 7A). With immunofluorescence double staining, we found that these CD103+ T cells were located around the TLSs (Figure 7B). Patients with a combination of CD103high and TLS‐rich had a significantly better prognosis than those with any other combination (Figure 8A). Prognosis of stage II, III, and IV patients with CD103high and TLS‐rich was better than in those with CD103low and TLS‐poor (Figure 8B,b‐d, P = .042, P = .017, and P = .0569, respectively). These results indicate a correlation between CD103+ T cells and TLSs.
FIGURE 7.
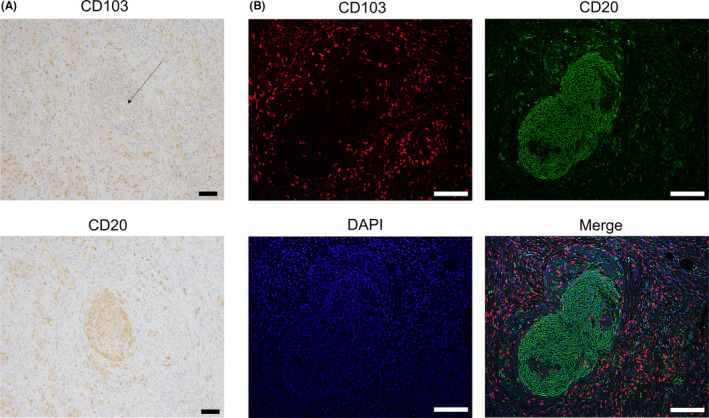
Distribution of CD103+ T cells and CD20+ B cells in tumor tissues of GC with immunohistochemical and immunofluorescence staining. A, Representative images of CD103 and CD20 immunostaining of the same tumor area are shown. Scale bars, 50 μm. B, Representative images of immunofluorescence staining of CD103 (red), CD20 (green), and DAPI (blue) are shown. CD103+ T cells were observed around CD20+ B cell aggregates, which were considered TLSs. Scale bars, 50 μm
FIGURE 8.
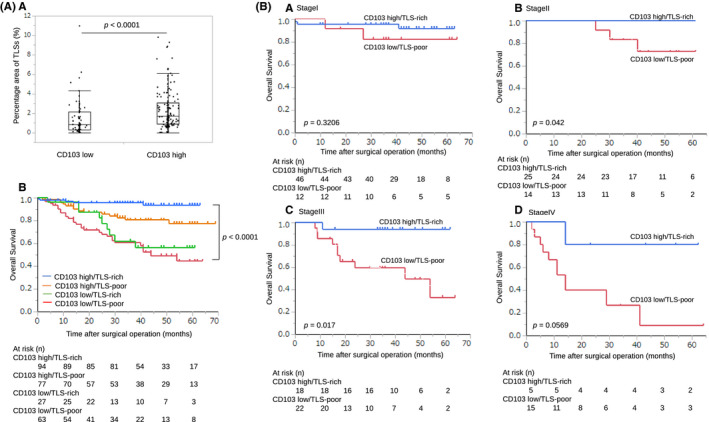
Association between CD103+ T cells and TLSs in GC. A, a, Patients who were CD103high had a significantly greater percentage area of TLSs than those with CD103low (P < .001). A, b, OS is shown with Kaplan‐Meier plots according to the combination of CD103+ T cells and TLSs. Patients who were CD103high and TLS‐rich had a better prognosis than other groups. The log‐rank test was used to compare curves, and P < .05 was considered significant. B, Prognosis of stages II, III, and IV patients with CD103high and TLS‐rich was better than patients who were CD103low and TLS‐poor
4. DISCUSSION
In our current study, we found that about 70% of TILs in GC tissues were CD103+CD8+ T cells, and the invasion of these cells into the tumors was frequent in patients with a good long‐term prognosis. Moreover, CD103+ T cells were located around TLSs, and CD103+ T cells coexpressed PD‐1 and had high granzyme B and IFN‐γ production, indicating that they were activated effector T cells. Our results suggested that tumor‐infiltrating CD103+ T cells may be associated with TLSs.
We first showed that intratumoral CD103+ T cells were present not only in the tumor stroma but also in the intraepithelial region in GC. CD103 was previously shown to bind to the cell surface marker E‐cadherin and to label TRM cells, which reside in the tissue and do not circulate back into the blood or secondary lymphoid organs. 6 , 7 , 8 However, we found several patients with CD103high with scirrhous GC, which has reduced E‐cadherin expression. 24 Webb et al reported no obvious correlation between E‐cadherin staining intensity and the presence of CD103+ T cells in ovarian cancer. 9 In other words, infiltration of CD103+ T cells may be influenced by factors other than E‐cadherin. Therefore, tumor‐infiltrating CD103+ T cells may include not only conventional TRM cells but also antigen‐sensitized cells that invaded from outside the tumor.
In relation to prognosis, as previously reported, patients with CD103+ T cell infiltration had a good prognosis. In particular, a good long‐term prognosis was observed for high amounts of CD103 invasion even in patients with stage III and IV cancer. CD103+ T cells may remain even after radical excision of the tumor. In our study, patients with CD103high and CD8high had a better prognosis than other groups, and we consider that CD103+CD8+ T cells are the most important immune cells. CD103high and CD8low also predicted a good prognosis. These results suggested that another phenotype of CD103+ cells can be involved in a good prognosis. CD103+CD11c+ cells were rarely found in our study. CD103+CD11c+ cells are a small subpopulation of CD103+ cells in human samples. 10 Therefore, we considered that CD103+ dendritic cells had little influence on the prognosis. Conversely, CD103+CD4+ T cells may play a role in antitumor immunity. However, Gu et al showed that CD103+CD4+ T cells in GC exhibited an immunosuppressive phenotype and predicted a poor prognosis. 25 In our study, CD4low tended to predict better prognosis than CD4high in patients with CD103high and CD8low. Therefore, regulatory T cells may be involved in a poor outcome. However, functional characteristics of CD103+CD4+ T cells have not been reported in detail, and further investigations for CD103+CD4+ T cells are needed.
Although several studies reported that CD8+ T cells were observed in 30%‐50% of the CD103+ T cell population, 10 , 26 the percentage of CD8+ TILs that are CD103+ T cells has remained unclear. In our study, about 70% of tumor‐infiltrating CD8+ T cells were CD103+. We considered that CD103+CD8+ T cells were the most important subpopulation of CD8+ T cells. Our study showed that CD103+CD8+ T cells exhibited higher levels of granzyme B expression, IFN‐γ production, and PD‐1 expression than CD103−CD8+ T cells. Previous studies of another tumor type reported that CD103+CD8+ T cells expressed cytotoxic molecules, such as granzyme B and IFN‐γ, and also expressed inhibitory molecules including PD‐1. 27 , 28 PD‐1 is more an indicator of T cell activation than exhaustion, 29 and co‐expression of exhaustion markers and cytotoxic mediators seen in CD103+CD8+ T cells can be explained as part of T cell activation. 30 Therefore, we suggested that CD103+CD8+ T cells represent a highly activated T cell subset among CD8+ TILs and may be “bona fide” TILs.
CD103+CD8+ T cells may be a target of PD‐1 blockade because CD103+CD8+ T cells express high levels of PD‐1. 12 , 31 When analyzing the patients who received PD‐1 blockade therapy in our study, those with CD103high or TLS‐rich had a good response to nivolumab. Moreover, patients with PR had both CD103high and TLS‐rich. These results suggest that not only CD103+ T cells but also TLSs are important to predict the efficacy of PD‐1 blockade. No study has examined the association between CD103+ T cells or TLSs and the response to PD‐1 blockade in human clinical samples with GC. Therefore, our results are very important and are different from previous studies.
A remaining question is where CD103+ T cells undergo antigen sensitization. We previously reported that TLSs are associated with good prognosis in GC. 20 , 21 TLSs are structurally and functionally similar to secondary lymph organs, and TLS formation is induced by CXCL13. 17 , 32 Although CXCL13 is generally associated with dendritic cells and follicular helper T cells, 18 , 33 several studies have identified the expression of CXCL13 in highly exhausted TILs in lung cancer, melanoma, and breast cancer. 34 , 35 , 36 Furthermore, Workel et al in ovarian cancer recently showed that CD103+CD8+ T cells expressed CXCL13 mRNA. 22 Accordingly, induction of TLS formation may be associated with CD103+CD8+ T cells. We reported that TLSs around the tumor played a role in inducing cytotoxic T lymphocyte proliferation in GC. 21 The present study showed that many CD103+ T cells were located around TLSs, and patients with both CD103high and TLS‐rich had a better prognosis than those with any other combination. Our results led to the hypothesis that CD103+CD8+ T cells are associated with TLS formation by production of CXCL13 and that TLSs function as antigen‐presenting cells and activate CD103+CD8+ T cells further, resulting in more enhanced antitumor immunity. The importance of the association between CD103+ T cells and TLSs is supported by the fact that patients with a good response to PD‐1 blockade had both CD103high and TLS‐rich. Therefore, our study provides increasing evidence of the importance of CD103+ T cells and TLSs in the local tumor immune environment.
The main limitation of this study was that we only evaluated cells using immunohistochemistry and immunofluorescence staining to assess the association between CD103+ T cells and TLSs. Moreover, the number of samples that were used in flow cytometry was small, and we evaluated only a few types of cytokines associated with the phenotype of CD103+CD8+ T cells. We did not demonstrate a direct effect of CD103+ cells on cancer cells. Further studies are required to evaluate the characteristics of CD103+CD8+ T cells and the association between CD103+ T cells and TLSs.
In conclusion, we confirmed that CD103+CD8+ T cells were present, associated with a favorable prognosis, represented a highly activated state and were likely to be related to TLSs in the tumor. Moreover, CD103high and TLS‐rich predicted a good response to PD‐1 blockade. This study provides a more advanced understanding of the dynamics of TILs. Regarding the clinical relevance, our results indicated that TLSs with CD103+ T cells could be a marker to predict the efficacy of immunotherapy in GC.
ETHICAL APPROVAL STATEMENT
All experimental procedures were approved by the Osaka City University Ethics Committee (approval No. 4092), and all patients provided informed consent for collection and analysis of their specimens.
DISCLOSURE
The authors have no conflict of interest.
Supporting information
Fig S1
Mori T, Tanaka H, Suzuki S, et al. Tertiary lymphoid structures show infiltration of effective tumor‐resident T cells in gastric cancer. Cancer Sci. 2021;112:1746–1757. 10.1111/cas.14888
REFERENCE
- 1. Ramakrishnan R, Gabrilovich DI. Novel mechanism of synergistic effects of conventional chemotherapy and immune therapy of cancer. Cancer Immunol Immunother. 2013;62:405‐410. [DOI] [PMC free article] [PubMed] [Google Scholar]
- 2. Tumeh PC, Harview CL, Yearley JH, et al. PD‐1 blockade induces responses by inhibiting adaptive immune resistance. Nature. 2014;515:568‐571. [DOI] [PMC free article] [PubMed] [Google Scholar]
- 3. Yang YP. Cancer immunotherapy: harnessing the immune system to battle cancer. J Clin Invest. 2015;125:3335‐3337. [DOI] [PMC free article] [PubMed] [Google Scholar]
- 4. Jiang W, Liu K, Guo Q, et al. Tumor‐infiltrating immune cells and prognosis in gastric cancer: a systematic review and meta‐analysis. Oncotarget. 2017;8:62312‐62329. [DOI] [PMC free article] [PubMed] [Google Scholar]
- 5. Lee JS, Won HS, Sun DS, Hong JH, Ko YH. Prognostic role of tumor‐infiltrating lymphocytes in gastric cancer: a systematic review and meta‐analysis. Medicine. 2018;97:e11769. [DOI] [PMC free article] [PubMed] [Google Scholar]
- 6. Mueller SN, Mackay LK. Tissue‐resident memory T cells: local specialists in immune defence. Nat Rev Immunol. 2016;16:79‐89. [DOI] [PubMed] [Google Scholar]
- 7. Amsen D, van Gisbergen K, Hombrink P, van Lier RAW. Tissue‐resident memory T cells at the center of immunity to solid tumors. Nat Immunol. 2018;19:538‐546. [DOI] [PubMed] [Google Scholar]
- 8. Mami‐Chouaib F, Blanc C, Corgnac S, et al. Resident memory T cells, critical components in tumor immunology. J Immunother Cancer. 2018;6:87. [DOI] [PMC free article] [PubMed] [Google Scholar]
- 9. Webb JR, Milne K, Watson P, deLeeuw RJ, Nelson BH. Tumor‐infiltrating lymphocytes expressing the tissue resident memory marker CD103 are associated with increased survival in high‐grade serous ovarian cancer. Clin Cancer Res. 2014;20:434‐444. [DOI] [PubMed] [Google Scholar]
- 10. Djenidi F, Adam J, Goubar A, et al. CD8(+) CD103(+) Tumor‐infiltrating lymphocytes are tumor‐specific tissue‐resident memory T cells and a prognostic factor for survival in lung cancer patients. J Immunol. 2015;194:3475‐3486. [DOI] [PubMed] [Google Scholar]
- 11. Webb JR, Milne K, Nelson BH. PD‐1 and CD103 are widely coexpressed on prognostically favorable intraepithelial CD8 T cells in human ovarian cancer. Cancer Immunol Res. 2015;3:926‐935. [DOI] [PubMed] [Google Scholar]
- 12. Edwards J, Wilmott JS, Madore J, et al. CD103(+) tumor‐resident CD8(+) T cells are associated with improved survival in immunotherapy‐naive melanoma patients and expand significantly during anti‐PD‐1 treatment. Clin Cancer Res. 2018;24:3036‐3045. [DOI] [PubMed] [Google Scholar]
- 13. Li RC, Liu H, Cao YF, et al. Identification and validation of an immunogenic subtype of gastric cancer with abundant intratumoural CD103(+)CD8(+) T cells conferring favourable prognosis. Br J Cancer. 2020;122:1525‐1534. [DOI] [PMC free article] [PubMed] [Google Scholar]
- 14. Okita Y, Tanaka H, Ohira M, et al. Role of tumor‐infiltrating CD11b(+) antigen‐presenting cells in the progression of gastric cancer. J Surg Res. 2014;186:192‐200. [DOI] [PubMed] [Google Scholar]
- 15. Figenschau SL, Fismen S, Fenton KA, Fenton C, Mortensen ES. Tertiary lymphoid structures are associated with higher tumor grade in primary operable breast cancer patients. BMC Cancer. 2015;15:101. [DOI] [PMC free article] [PubMed] [Google Scholar]
- 16. Germain C, Gnjatic S, Tamzalit F, et al. Presence of B Cells in Tertiary Lymphoid Structures Is Associated with a Protective Immunity in Patients with Lung Cancer. Am J Respir Crit Care Med. 2014;189:832‐844. [DOI] [PubMed] [Google Scholar]
- 17. Dieu‐Nosjean MC, Giraldo NA, Kaplon H, Germain C, Fridman WH, Sautes‐Fridman C. Tertiary lymphoid structures, drivers of the anti‐tumor responses in human cancers. Immunol Rev. 2016;271:260‐275. [DOI] [PubMed] [Google Scholar]
- 18. Pimenta EM, Barnes BJ. Role of tertiary lymphoid structures (TLS) in anti‐tumor immunity: potential tumor‐induced cytokines/chemokines that regulate TLS formation in epithelial‐derived cancers. Cancers. 2014;6:969‐997. [DOI] [PMC free article] [PubMed] [Google Scholar]
- 19. Kroeger DR, Milne K, Nelson BH. Tumor‐infiltrating plasma cells are associated with tertiary lymphoid structures, cytolytic T‐cell responses, and superior prognosis in ovarian cancer. Clin Cancer Res. 2016;22:3005‐3015. [DOI] [PubMed] [Google Scholar]
- 20. Sakimura C, Tanaka H, Okuno T, et al. B cells in tertiary lymphoid structures are associated with favorable prognosis in gastric cancer. J Surg Res. 2017;215:74‐82. [DOI] [PubMed] [Google Scholar]
- 21. Yamakoshi Y, Tanaka H, Sakimura C, et al. Immunological potential of tertiary lymphoid structures surrounding the primary tumor in gastric cancer. Int J Oncol. 2020;57:171‐182. [DOI] [PMC free article] [PubMed] [Google Scholar]
- 22. Workel HH, Lubbers JM, Arnold R, et al. A transcriptionally distinct CXCL13(+)CD103(+)CD8(+) T‐cell population is associated with B‐cell recruitment and neoantigen load in human cancer. Cancer Immunol Res. 2019;7:784‐796. [DOI] [PubMed] [Google Scholar]
- 23. Cabrita R, Lauss M, Sanna A, et al. Tertiary lymphoid structures improve immunotherapy and survival in melanoma. Nature. 2020;577:561‐565. [DOI] [PubMed] [Google Scholar]
- 24. Shiozaki H, Tahara H, Oka H, et al. Expression of immunoreactive E‐cadherin adhesion molecules in human cancers. Am J Pathol. 1991;139:17‐23. [PMC free article] [PubMed] [Google Scholar]
- 25. Gu Y, Chen YF, Jin KF, et al. Intratumoral CD103(+)CD4(+) T cell infiltration defines immunoevasive contexture and poor clinical outcomes in gastric cancer patients. Oncoimmunology. 2020;9:1844402. [DOI] [PMC free article] [PubMed] [Google Scholar]
- 26. Chu YF, Liao J, Li JQ, et al. CD103(+) tumor‐infiltrating lymphocytes predict favorable prognosis in patients with esophageal squamous cell carcinoma. J Cancer. 2019;10:5234‐5243. [DOI] [PMC free article] [PubMed] [Google Scholar]
- 27. Ganesan AP, Clarke J, Wood O, et al. Tissue‐resident memory features are linked to the magnitude of cytotoxic T cell responses in human lung cancer. Nat Immunol. 2017;18:940‐950. [DOI] [PMC free article] [PubMed] [Google Scholar]
- 28. Hartana CA, Bergman EA, Broome A, et al. Tissue‐resident memory T cells are epigenetically cytotoxic with signs of exhaustion in human urinary bladder cancer. Clin Exp Immunol. 2018;194:39‐53. [DOI] [PMC free article] [PubMed] [Google Scholar]
- 29. Legat A, Speiser DE, Pircher H, Zehn D, Marraco SAF. Inhibitory receptor expression depends more dominantly on differentiation and activation than "exhaustion" of human CD8 T cells. Front Immunol. 2013;4:455. [DOI] [PMC free article] [PubMed] [Google Scholar]
- 30. Kumar BV, Connors TJ, Farber DL. Human T cell development, localization, and function throughout life. Immunity. 2018;48:202‐213. [DOI] [PMC free article] [PubMed] [Google Scholar]
- 31. Han L, Gao QL, Zhou XM, et al. Characterization of CD103(+) CD8(+) tissue‐resident T cells in esophageal squamous cell carcinoma: may be tumor reactive and resurrected by anti‐PD‐1 blockade. Cancer Immunol Immunother. 2020;69:1493‐1504. [DOI] [PMC free article] [PubMed] [Google Scholar]
- 32. Germain C, Gnjatic S, Dieu‐Nosjean MC. Tertiary lymphoid structure‐associated B cells are key players in anti‐tumor immunity. Front Immunol. 2015;6:67. [DOI] [PMC free article] [PubMed] [Google Scholar]
- 33. Vissers JLM, Hartgers FC, Lindhout E, Figdor CG, Adema GJ. BLC (CXCL13) is expressed by different dendritic cell subsets in vitro and in vivo. Eur J Immunol. 2001;31:1544‐1549. [DOI] [PubMed] [Google Scholar]
- 34. Tirosh I, Izar B, Prakadan SM, et al. Dissecting the multicellular ecosystem of metastatic melanoma by single‐cell RNA‐seq. Science. 2016;352:189‐196. [DOI] [PMC free article] [PubMed] [Google Scholar]
- 35. Gu‐Trantien C, Migliori E, Buisseret L, et al. CXCL13‐producing T‐FH cells link immune suppression and adaptive memory in human breast cancer. JCI Insight. 2017;2:e91487. [DOI] [PMC free article] [PubMed] [Google Scholar]
- 36. Thommen DS, Koelzer VH, Herzig P, et al. A transcriptionally and functionally distinct PD‐1(+) CD8(+) T cell pool with predictive potential in non‐small‐cell lung cancer treated with PD‐1 blockade. Nat Med. 2018;24:994‐1004. [DOI] [PMC free article] [PubMed] [Google Scholar]
Associated Data
This section collects any data citations, data availability statements, or supplementary materials included in this article.
Supplementary Materials
Fig S1


